

Translate this page into:
Photoacoustic imaging a PDT response marker for monitoring vasculature changes
⁎Corresponding author. ashafiq@ksu.edu.sa (Shafiq Ahmad)
-
Received: ,
Accepted: ,
This article was originally published by Elsevier and was migrated to Scientific Scholar after the change of Publisher.
Peer review under responsibility of King Saud University.
Abstract
Photoacoustic imaging (PAI) is an evolving modality for studying and imaging tumor hypoxia. The experimental results from animals treated with ALA for Pre-PDT, Post-PDT, 4hr PDT, 24 hr PDT show a short-term increase in the BV followed by a strong decrease; however, no complete stasis. An alternate method is created by looking at the spatial and frequency domain histogram to observe the tumor vasculature. The images are represented in frequency domains by application of two-dimensional Fast Fourier Transform (FFT) on spatial domain images. The variations in acoustic impedance after Photodynamic Therapy (PDT) are studied. The photoacoustic signals implemented on tumor models indicated PDT influenced variations in the hemoglobin levels against different time periods and studied their outcome on the tumor necrosis.
Keywords
Photoacoustic imaging
Tumor hypoxia
Acoustic impedance

1 Introduction
PAI is a technique depends upon the launch of acoustic waves from light-absorbing structures due to their thermal expansion. PAI is showing promises for several biomedical applications research in and translational research. Photodynamic Therapy (PDT) is a minimal invasive localized therapy that utilizes light-activated drugs called photosensitizers by initiating direct cell kill. PDT can be applied as a stand-alone therapy or as adjuvant therapy to present a standard of care. PDT is gaining popularity and exploits improvements in biomedical imaging techniques. Due to the higher sensitivity, shorter acquisition time and higher temporal resolution, they have achieved marvelous consideration in biomedical applications (Attia et al., 2019; Cao et al., 2017; Erfanzadeh and Zhu, 2019; Hosseinaee et al., 2020; Manwar et al., 2020; Zhao et al., 2019; Zhou and Jokerst, 2020). Tissues carrying phototoxic photosensitizers in molecular or nanoparticle form are irradiated with light of a particular wavelength for the generation of the excited singlet and triplet states resulting in reactive oxygen species (ROS), including singlet oxygen, superoxide anion, and other reactive species, such as the hydroxyl radical and hydrogen peroxide. The oxidative damage to various critical cellular components in the proximity of the ROS destroys the tumor due to either direct action on the tumor cells or necrosis induced by the disruption of the tumor's vasculature, cancer cell death, and destruction of unwanted tissue. Following systematic administration of a photosensitizing agent, it preferentially accumulates and is retained in the rapidly proliferating tumor tissues. Light is administered to the tumor site at times of maximum selective photosensitizer concentration in the tumor and the surrounding host tissue. In vivo studies of PDT disclose that the antitumor effect originates from different mechanisms, including direct damage to cancer cells and damage to vasculatures, impacting the Hemoglobin (Hb) levels.
The numerous PDT studies (Beard, 2011; Chen et al., 2021; Das et al., 2021; Dolet et al., 2021; Fu et al., 2019; Hester et al., 2020; Kim et al., 2015; Li and Chen, 2015; Liu and Li, 2020; Meng et al., 2019; Okumura et al., 2018; Qiu et al., 2021; Rao et al., 2020; Valluru and Willmann, 2016; Wang et al., 2016; Xu and Wang, 2006; Xu, 2011; Yu et al., 2017; Atif et al., 2016) indicated that this technology effectively treats a wide range of tumors by either direct cell kill or vasculature damage. The measurements of the tumor blood volume, blood flow, and Hb levels are essential for assessing tumor response in preclinical model systems and clinically.
Intravascular photoacoustic imaging is developing as a reliable image modality to assess tumors and post-treatment effects. Imaging contrast by endogenous or exogenous therapeutic agents increases the image modality's reliability and can deliver substantial benefits for response monitoring. The photoacoustic signal can be significantly improved through image contrast agents. Improvement in diagnostics can use therapeutics with photoacoustic imaging to treat tumors effectively. Deep tumor imaging, therapeutic responses monitoring, Hb detection, and ROS detection are important parameters for tumor growth and characterization. We utilized photoacoustic signals enhancement approaches on tumor models. Our study extracts PDT altered hemoglobin levels at different time intervals and correlated these results with tumor necrosis. The use of PAI and ultrasound has been previously proposed (Hester et al., 2020).
2 Materials and methods
Tumour were induced in the hind limbs of nude mice using PC3 cells. After the injection of PS, mice were imaged by PAI. ALA (60 mg/kg) and lower (1 mg/kg) & higher (3 mg/kg) concentration of BPD were used as photosensitizers. After administration of ALA and BPD for 4 hrs or 15 min respectively light activation was started. Tumours were imaged at multiple λ by the PAI system initially at 780 and 830 nm as the minimum order to determine the total hemoglobin signals to acquire the blood volume and oxygen level.
Early outcome indicators are suggested for this study as photodynamic therapy responses against tumors. Post Photodynamic therapy, Photoacustic (PA) images are retrived by different angles. Then images are superimposed on anatomical images as reported in the previous study (Atif et al., 2021). The photodynamic therapy response analysis is based on pre-PDT, immediate Post PDT i.e. 0 Hrs, then 4 Hrs, and 24 Hrs, respectively. These spatial domain figures are analyzed using thresholding and counting image voxels exceeding that threshold. A certain tumor area is analysed from the full image.
Region outside the tumor is compared with tumor area. Image is additionally disintegrated into constituent channels in the color scales, i.e., red, green, and blue. The spatial domain image is converted into an 8-bit greyscale.
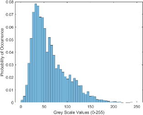
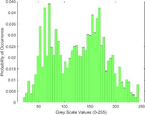
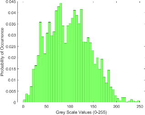
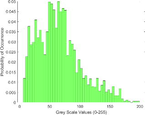
Histograms and derivatives of these histograms for tumor area images are analysed for every case of Pre PDT, Post PDT, 4Hrs, and 24Hrs. Likewise, histograms and their derivatives for normal area images are calculated for each case of Pre PDT, Post PDT, 4Hrs, and 24Hrs. Spatial graphs are also transformed to the frequency domain to depict the frequency contents present in the tumor and normal tissues as detected by PAI.
This study was approved by the Princess Margaret Cancer Centre animal care committee, Toronto, Ontario, under AUP 6515.1.1.
3 Result and discussion
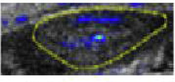
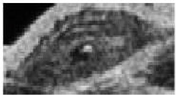
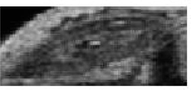
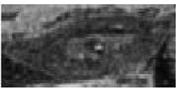
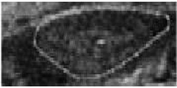
PAI uses pulsed or frequency domain near-infrared light mainly absorbed by specific marked component (e.g., hemoglobin), causing transient local heating (« 1 °C). It results in thermoelastic expansion of the target which leads to the emission of acoustic waves detected by an external ultrasound transducer. PAI delivers high resolution (50 µm) 3D absorption maps of vasculature, shown in Fig. 1 for BV.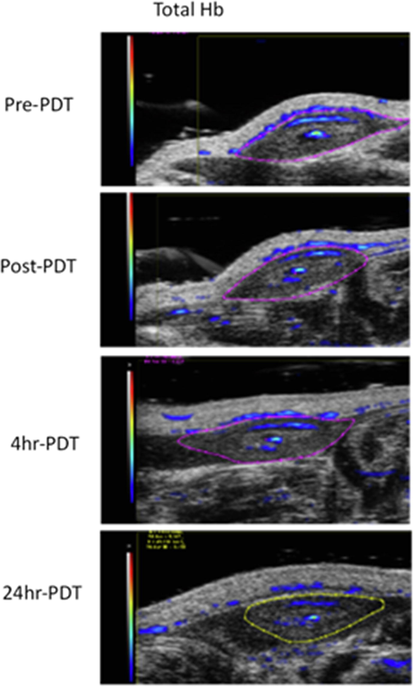
An example of a subcutaneous prostate tumor treated with 5-ALA 60 mg/kg and 535 nm radiant exposure of 150 J/cm2. The column shows a short-term increase in the BV followed by a strong decrease; however, there is no complete stasis.
Fig. 1 shows a subcutaneous prostate tumor treated with 5-ALA 60 mg/kg and 535 nm radiation to a radiant exposure of 150 J/cm2. The entire column of Pre-PDT, Post-PDT, 4hr PDT, 24 hr PDT shows a short-term increase in the BV followed by a substantial decrease but no complete stasis.
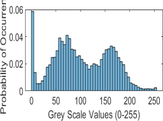
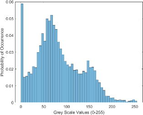
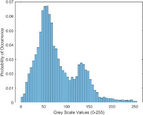
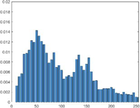
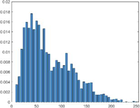
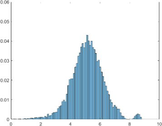
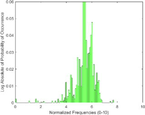
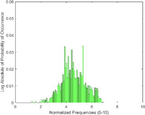
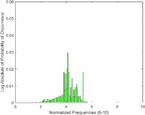
Table 1 shows the temporal evolution of Ultrasound and Photoacoustic imaging before and after PDT resulting in the spatial and frequency domain histograms of normal skin tissue layers and a subcutaneous tumor. Spatial intensity distribution histograms were prepared and evaluated for variations in the frequency domains for quantitative interpretation of experimental results.
Pre PDT
Post PDT
4 Hrs
24 Hrs
Original images
US Greyscale
PAI Tumour


Normal Skin

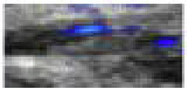
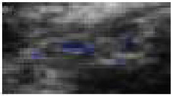
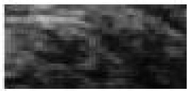
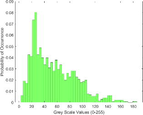
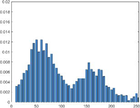
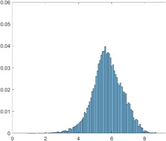
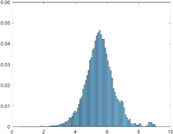
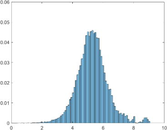
Fig. 2 shows the intensity differences between the tumor ROI and the skin ROI as a function of greyscale intensity. The US intensity ratio between the tissues is reduced over time. In particular, the high US intensities, representing large changes in the acoustic impedance mismatch, are disproportionally lost. Post PDT, an overall homogenization of the tissue is suggested through the treatment by 24 Hrs.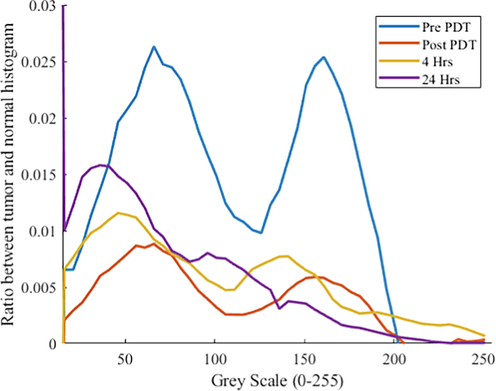
Ratio histogram of the tumor over normal skin Region of Interest (ROIs) from Pre PDT up to 24Hrs.
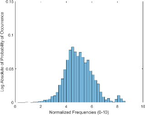
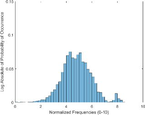
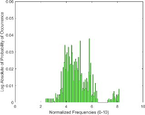
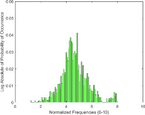
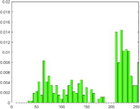
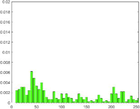
An analysis of the US and the PAI images presented in Table 1 and the extracted intensity histograms and 2D spatial frequencies shown in Table 2 did not show statistically significant differences when approximated by a normal distribution. This holds true for the US and PAI data between the tumor and normal tissue, and the spatial frequency distributions' temporal evolution did not. No changes in the frequency distribution were noted for the tumor tissue intensities distributions, see Table 3, 2nd column. In contrast, for normal skin, the frequency mean shows a tendency to increase and the variance decrease, see Table 3 3rd column. The mean of the normal US spatial frequency distribution approximates that of the tumor, indicating an enhancement in the size of the structures causing acoustic impedance differences. The spatial frequency of the acoustic impedence changes can be explained by increased apoptosis in the normal skin tissue (Castano et al., 2006; Kessel, 2020; Plaetzer et al., 2005) whereas, given the high heterogeneity in the tumor tissue and the continuous presence of apoptotic cells therein. Modifications of the US response due to PDT-induced apoptosis was reported previously (Atif et al., 2022b; Czarnota et al., 1999; Li et al., 2006; Vlad et al., 2011; Wilson et al., 1999). For the PAI, the spatial frequency distributions' temporal evolution also does not show statistically significant differences for the tumor tissues. The number of observations for the normal skin tissue is low, and hence the variability in the mean of the frequency distribution shows more variability as a function of time appears more random. There is no apparent trend in the evolution of the center frequency or the width of the distribution. However, again the variability or change in the normal tissue is larger than in the tumor tissue. A possible source for this alteration between the tumor and normal skin response may be that the former has vasculature dominated by large, well-perfused vessels, whereas the latter's vasculature is dominated by arterioles, capillaries, and venules, providing a different response to PDT. While the use of PAI in PDT monitoring has received only limited attention for PDT, predominantly related to photosensitizer development (Li et al., 2017; Liu et al., 2021; Zhang et al., 2020), it is well established for monitoring vascular responses (May et al., 2016; Neuschmelting et al., 2018; Rich and Seshadri, 2015).
Pre PDT
Post PDT
4 Hrs
24 Hrs
Intensity Histograms
Tumour
Intensity Histograms
treated normal skin
Frequency HIstogram
Tumor
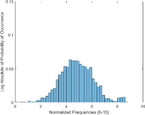
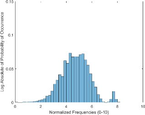
Frequency Histograms
treated normal skin


PAI intensity histogram
Tumour

PAI Intensity Histogram
Normal treated

PAI Frequency Histogram
Tumour
PAI Frequency Histogram
Normal Treated.
UltraSound mean frequency
[kHz]PAI mean frequency
[kHz]
Tumor
Normal
Tumor
Normal
Pre PDT
61.4 ± 17.9
39.8 ± 21.9
64.9 ± 13.3
71.9 ± 1.6
Post PDT
59.6 ± 16.4
55.8 ± 20.2
62.6 ± 14.3
67.5 ± 20.2
4Hrs
58.5 ± 18.0
51.1 ± 17.3
67.8 ± 13.2
75.3 ± 12.8
24Hrs
60.4 ± 18.9
57.5 ± 16.9
67.8 ± 15.4
51.5 ± 50.5
Where rate of change of oxyen is ratio of the difference of vales of oxygen levels from current to the previous with the change in time between the PDT observations.
In Fig. 3, the rate of change in blood volume is shown versus the rate of change for the three photosensitizer doses tested. The scatter plot of blood volume against oxygenation changes represents cells reduced metabolic activity, possibly including cell death.Where, rate of change of Oxygen is the difference between the current and previous values of Oxygen divided by the time difference between the observed values.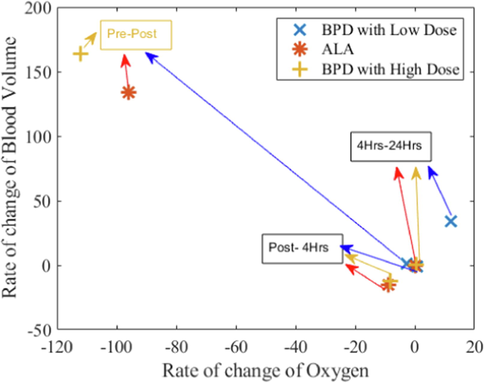
Rate of change of Blood Volume of ALA PDT and BPD low and a high dose of PDT versus rate of change of oxygen.
In summary, structural alterrations of tissue were given less consideration, but the variations in acoustic impedance changes post-PDT was observed. The results represented a close spatial correlation between signal providing BV depending on the rate of change of oxygen. The experimental results from animals treated with ALA for Pre-PDT, Post-PDT, 4hr PDT, and 24 hr PDT show a short-term increase in the BV followed by a substantial decrease. However, there is no complete stasis based on these data. In another study, the ultrasound role and photoacoustic imaging were assessed to improve PDT-mediated outcome prediction for cancer. Photosensitizer tracking uptake and vascular obliteration were measured to study oxygen dynamics for overall estimation of tumor responses (Hester et al., 2020). In our group's earlier study, we discussed the quantification of blood volume, total hemoglobin saturation and ultrasound signal changes correlated with PDT-induced amendments in the tumor (Atif et al., 2022a). The present study applied photoacoustic signal enrichment methods to this tumor model. PDT-induced alterations of hemoglobin levels with different time intervals were explained, and results were correlated with tumor necrosis. Combined with structural imaging, these blood volume changes are an early indicator of a Photodynamic response.
4 Conclusion
In the current study, we studied the role of total hemoglobin and blood volume in the photodynamic activity and Ultrasound (US) signal changes and their correlation with PDT-induced alterations in the tumor. Images are represented in frequency domains by application of two-dimensional FFT on spatial domain images. Furthermore, variations in the acoustic impedance post-PDT have been demonstrated. Animal experimental results treated with ALA for Pre-PDT, Post-PDT, 4hr PDT, and 24 hr PDT show a short-term increase in the Blood Volume (BV) followed by a substantial decrease. However, there is no complete stasis. Photoacoustic signals augmentation approaches were implemented on tumor models and highlighted that PDT influenced variations of hemoglobin levels with different time intervals and correlated these outcomes with tumor necrosis.
Acknowledgment
This Project was funded by the National Plan for Science, Technology, and Innovation (MAARIFAH), King Abdulaziz City for Science and Technology, Kingdom of Saudi Arabia, Award Number (2-17-01-001-0068).
Declaration of Competing Interest
The authors declare that they have no known competing financial interests or personal relationships that could have appeared to influence the work reported in this paper.
References
- Atif, M., Hanif, A., Alsalhi, M.S., Altamimi, H.A., Lilge, L., 2021. Associating vascular imaging with hypoxia and cell survival in vivo for Biophotonics applications. In: 2021 SBFoton International Optics and Photonics Conference: Keep on Shining, SBFoton IOPC 2021. https://doi.org/10.1109/SBFotonIOPC50774.2021.9461965.
- Review of the role played by the photosensitizer’s photobleaching during photodynamic therapy. J. Optoelectron. Adv Mater 2016:18.
- [Google Scholar]
- Blood volume and structural imaging as an early indicator for photodynamic response. J. King Saud Univ. - Sci.. 2022;34(6):102143.
- [Google Scholar]
- Oxygen saturation and blood volume analysis by photoacoustic imaging to identify pre and post-PDT vascular changes. Saudi J. Biol. Sci.. 2022;29(6):103304.
- [Google Scholar]
- A review of clinical photoacoustic imaging: Current and future trends. Photoacoustics. 2019;16:100144.
- [Google Scholar]
- Photodynamic therapy and anti-tumour immunity. Nat. Rev. Cancer.. 2006;6(7):535-545.
- [Google Scholar]
- Progress of clinical translation of handheld and semi-handheld photoacoustic imaging. Photoacoustics. 2021;22:100264.
- [Google Scholar]
- Ultrasound imaging of apoptosis: High-resolution non-invasive monitoring of programmed cell death in vitro, in situ and in vivo. Br. J. Cancer.. 1999;81(3):520-527.
- [Google Scholar]
- In vitro and in vivo multispectral photoacoustic imaging for the evaluation of chromophore concentration. Sensors. 2021;21(10):3366.
- [Google Scholar]
- Photoacoustic imaging: contrast agents and their biomedical applications. Adv. Mater. 2019
- [CrossRef] [Google Scholar]
- Role of ultrasound and photoacoustic imaging in photodynamic therapy for cancer. Photochem. Photobiol.. 2020;96(2):260-279.
- [Google Scholar]
- Photodynamic therapy: apoptosis, paraptosis and beyond. Apoptosis. 2020;25(9-10):611-615.
- [Google Scholar]
- Photoacoustic imaging platforms for multimodal imaging. Ultrasonography. 2015;34(2):88-97.
- [CrossRef] [Google Scholar]
- Chemotherapeutic drug-photothermal agent co-self-assembling nanoparticles for near-infrared fluorescence and photoacoustic dual-modal imaging-guided chemo-photothermal synergistic therapy. J. Control. Release.. 2017;258:95-107.
- [Google Scholar]
- Feasibility of interstitial doppler optical coherence tomography for in vivo detection of microvascular changes during photodynamic therapy. Lasers Surg. Med.. 2006;38(8):754-761.
- [Google Scholar]
- Photoacoustic imaging of cells in a three-dimensional microenvironment. J. Biomed. Sci.. 2020;27(1)
- [CrossRef] [Google Scholar]
- Multifunctional nanozyme for multimodal imaging-guided enhanced sonodynamic therapy by regulating the tumor microenvironment. Nanoscale. 2021;13(33):14049-14066.
- [Google Scholar]
- Overview of ultrasound detection technologies for photoacoustic imaging. Micromachines. 2020;11(7):692.
- [Google Scholar]
- Photoacoustic imaging of cancer treatment response: Early detection of therapeutic effect from thermosensitive liposomes. PLoS One. 2016;11(10):e0165345.
- [Google Scholar]
- Photoacoustic temperature imaging based on multi-wavelength excitation. Photoacoustics. 2019;13:33-45.
- [Google Scholar]
- WST11 vascular targeted photodynamic therapy effect monitoring by multispectral optoacoustic tomography (MSOT) in mice. Theranostics. 2018;8(3):723-734.
- [Google Scholar]
- Photoacoustic imaging of tumour vascular permeability with indocyanine green in a mouse model. Eur Radiol Exp. 2018;2(1)
- [CrossRef] [Google Scholar]
- Apoptosis Following Photodynamic Tumor Therapy: Induction, Mechanisms and Detection. Curr. Pharm. Des. 2005
- [CrossRef] [Google Scholar]
- Photoacoustic imaging as a highly efficient and precise imaging strategy for the evaluation of brain diseases. Quant. Imaging Med. Surg.. 2021;11(5):2169-2186.
- [Google Scholar]
- Photoacoustic imaging for management of breast cancer: A literature review and future perspectives. Appl. Sci.. 2020;10(3):767.
- [Google Scholar]
- Photoacoustic imaging of vascular hemodynamics: Validation with blood oxygenation level-dependent MR imaging. Radiology. 2015;275(1):110-118.
- [Google Scholar]
- Clinical photoacoustic imaging of cancer. Ultrasonography. 2016;35(4):267-280.
- [CrossRef] [Google Scholar]
- Ultrasound imaging of apoptosis: Spectroscopic detection of DNA-damage effects at high and low frequencies. Methods Mol. Biol. 2011
- [CrossRef] [Google Scholar]
- Recent advances in photoacoustic imaging for deep-tissue biomedical applications. Theranostics. 2016;6(13):2394-2413.
- [Google Scholar]
- Wilson, B.C., Molckovsky, A., Czarnota, G.J., Sherar, M.D., Kolios, M.C., Lilge, L.D., Dattani, R.S., Osterman, K.S., Paulsen, K.D., Hoopes, P.J., 1999. Monitoring tissue response to photodynamic therapy: The potential of minimally invasive electrical impedance spectroscopy and high-frequency ultrasound. In: Proc SPIE. Proc SPIE, pp. 73–82. https://doi.org/10.1117/12.351508.
- Multifunctional microbubbles and nanobubbles for photoacoustic imaging. Contrast Media Mol. Imaging. 2011
- [CrossRef] [Google Scholar]
- Photoacoustic imaging in biomedicine. Rev. Sci. Instrum. doi. 2006;10(1063/1):2195024.
- [Google Scholar]
- Wavefront shaping and its application to enhance photoacoustic imaging. Appl. Sci.. 2017;7(12):1320.
- [Google Scholar]
- Targeted nanobody complex enhanced photodynamic therapy for lung cancer by overcoming tumor microenvironment. Cancer CellInt. 2020;20(1)
- [CrossRef] [Google Scholar]
- Minimally invasive photoacoustic imaging: Current status and future perspectives. Photoacoustics. 2019;16:100146.
- [Google Scholar]
- Photoacoustic imaging with fiber optic technology: A review. Photoacoustics. 2020;20:100211.
- [Google Scholar]
Appendix A
Supplementary material
Supplementary data to this article can be found online at https://doi.org/10.1016/j.jksus.2022.102480
Appendix A
Supplementary material
The following are the Supplementary data to this article:


