

Translate this page into:
Study of environmental regulation on industrial energy conservation and emission reduction
-
Received: ,
Accepted: ,
This article was originally published by Elsevier and was migrated to Scientific Scholar after the change of Publisher.
Peer review under responsibility of King Saud University.
Abstract
Objective
China has become the top emitter of carbon dioxide (CO2), since 2006 and continued to maintain a rapid economic expansion alongside rising energy conservation and emission reduction. China faces a deteriorating environment regulation and increased domestic and international pressure to reduce emissions.
Methods
The Emission Trading Scheme (ETS) must be able to decrease emissions and promote energy conservation in developing countries in order for these countries to experience sustainable economic and environmental growth. The impact of China's carbon dioxide (CO2) ETS pilot law, which took effect in 2011, on energy efficiency and carbon reduction was examined in this article. To examine how the CO2 ETS affects energy efficiency and emission reduction, we employ the difference-in-differences (DID) model based on the panel data of the two-digit sector at the province level.
Results
According to the findings, regulated industries in pilot areas use 22.8% less energy and emit 15.5% less CO2 than those in non-pilot areas. These reductions were the outcome of the CO2 ETS. According to additional analysis, boosting energy technical efficiency and modifying the industrial structure are the major factors driving the consequences of policy.
Conclusion
The CO2 ETS also functions better, according to our research, in regions with strong environmental regulation and marketization. According to our research, developing countries' attempts to conserve energy and reduce emissions have benefited from the CO2 ETS.
Keywords
China
Environmental regulation
Energy conservation
Emission reduction
Carbon dioxide (CO2)
Emission Trading Scheme (ETS)

1 Introduction
China's fast industrial growth in recent years has resulted in increased energy demand, which has major environmental impacts. Around the same quantity of coal was burned in China as the rest of the globe in 2013. Increasing coal usage in China was responsible for 23.7 percent of global CO2 emissions in 2015 (Zhang et al, 2020). Many countries have come to a fundamental agreement to lower their CO2 output because of environmental problems and global warming. The Chinese government has agreed to lower carbon dioxide emissions by 40–45 percent of GDP from 2005 levels by 2020, as stated at the Copenhagen Climate Change Conference in 2009 and as per the published report at the end of 2017, China had cut carbon dioxide emissions per unit of GDP by 46 percent from the 2005 level, fulfilling its commitment to reduce carbon emissions by 40 to 45 percent from the 2005 level by 2020. Faced with a deteriorating environment and growing pressure to cut emissions at home and abroad, China's government set a mandatory objective: by 2020, the country's carbon dioxide emission intensity (CO2 per GDP) must have increased by no less than 40 to 45 percent from its 2005 level (NDRC, 2010). But even if that target is reached, there was still be a 75% rise in CO2 emissions in 2020 compared to 2006 (Usman et al., 2021; Mody and Bhoosreddy, 1995). If the current emission pattern continues, the number of emissions in 2020 might be up to 2.5 times that in 2006 represents in Fig. 1 (See Table 1).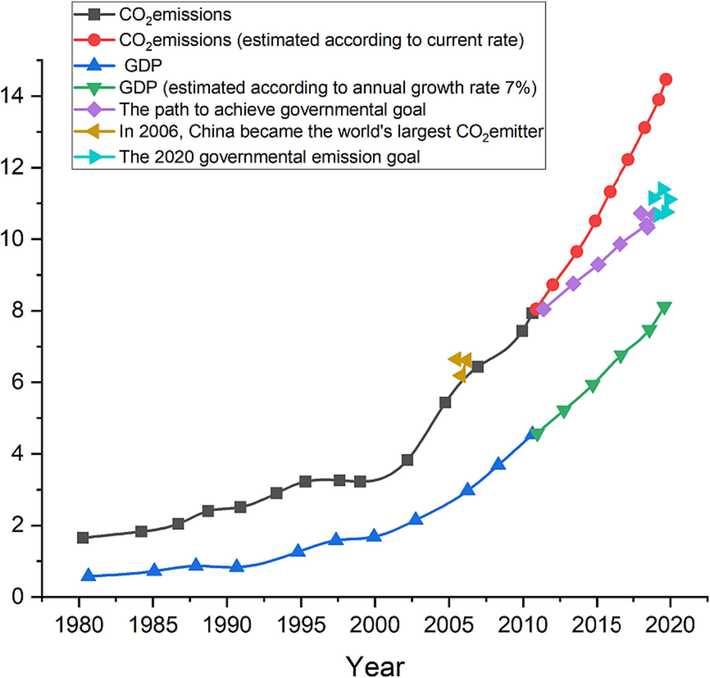
Annual CO2 emissions and China's GDP growth. IEA (2013), NBS (2013b), and SCC data (2011).
Energy category
Conversion reference coefficient
Other Washed Coal
0.28 kg SC/kg
Briquettes
0.61 kg SC/kilogram
Coke
0.97 kg SC/kg
Other Gas
0.57 kg SC/m 3
Gasoline
1.47 kg SC/kg
Kerosene
1.47 kg SC/kg
Fuel Oil
1.42 kg SC/kg
Other Energy
–
Electricity
0.12 kg SC/kWh
Heat
0.03 kg SC /million j
Natural Gas
1.33 kg SC/m3
Other Petroleum Products
1.21 kg SC/kg
Refinery Gas
1.57 kg SC/kg
LPG
1.71 kg SC/kg
Diesel Oil
1.45 kg SC/kg
Crude Oil
1.42 kg SC/kg
Coke Oven Gas
0.61 kg SC/m
Cleaned Coal
0.90 kg SC /kg
Raw Coal
0.71 kg SC /kg
Since then, several environmental laws have been put into place to lower CO2 emissions. CO2 ETS pilot programme was started in 2011 in 7 provinces and cities with the goal of exploring and eventually establishing a national carbon emissions trading market (Hao et al., 2020). Energy use and CO2 emissions are inextricably linked since using fossil fuels for energy is a major contributor to CO2 emissions. Approximately 75% of CO2 emissions are caused by using fossil fuels. However, the industrial sector is the greatest consumer of energy and a major source of CO2 emissions (Wu et al. 2020; Garg 2021), making it a vital engine of economic growth. Fig. 2 indicates the structure of Emission Trading Scheme. Companies that emit more than 5,000 tonnes of carbon dioxide annually must purchase permits from those who emit less. One of the seven cities that have implemented the experimental programme since 2013 is Beijing. The programme has roughly 1,000 enterprises participating, which accounts for about 45% of the city's overall emissions.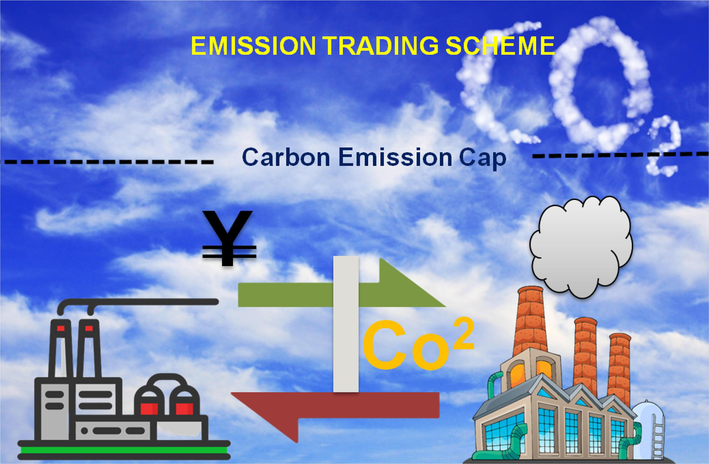
Structure of Emission Trading Scheme.
Thus, reducing emissions and conserving energy in the industrial sector are crucial for both attaining the total carbon intensity target and advancing low-carbon development. The Porter hypothesis, on the one hand, suggests that corporations might be encouraged to adopt technological advances by policies that are both strict and lenient on the environment. Organizations may be encouraged to invest in technology that complies with the ETS and generates revenue by selling emission permits, therefore increasing the sector's technical efficiency, decreasing energy consumption, and minimising carbon dioxide emissions. By selling permits, converting energy, and exiting the market, among other strategies, enterprises might more effectively utilize production elements, resulting in reduced greenhouse gases. To reach emission reduction goals, these policies may indirectly impact the industrial and energy structures. Although several mechanisms are not mutually exclusive, it is still unknown how ETS operates. We use China's CO2 ETS pilot policy, which has the following benefits, to analyse the impact of the ETS. Encroachment and excessive particulate emissions are symptoms of China's strong economic growth, and these problems are shared by other developing countries. Second, due to China's consistently inadequate institutional framework, it can be particularly difficult to implement market-based environmental regulation effectively. Additionally, the pilot areas are chosen by the central government because local governments are not likely to be the ones driving the process because it is top-down in nature. Additionally, the geographic distribution of these pilot zones in the eastern, central, and western regions varies greatly (Haldar and Sethi, 2021; Ahmed and Ali, 2021). In this research we analyze the impact of China's CO2 ETS pilot law, which took effect in 2011, on energy efficiency and carbon reduction is examined in this article.
The contributions of this research
-
The impact of China's CO2 ETS pilot law, which took effect in 2011, on energy efficiency and emission reduction is examined in this article.
-
The findings show that regulated industries in pilot zones emit 15.5% less CO2 and consume 22.8% less energy than those in non-pilot areas.
-
Based on our findings, the CO2 ETS has been helpful in promoting energy efficiency and lowering emissions in developing nations.
The remaining part of this research is divided into 4 parts, section 2: related works, section 3: research methodology, section 4: discussion and section 5: conclusion.
1.1 Related works
Dissanayake et al. (2020) assesses an ETS, a fuel tax, and a carbon tax for Indonesia. And used the “energy-environmental variant of the Global Trade Analysis Project”, this study evaluates the efficacy of 3-carbon emission countermeasures in light of Indonesia's desired emissions target. These strategies include a carbon price, a fuel tax, and an ETS. Li and Yao (2020) and Shahabaz and Afzal, (2021) described how combined policies on the energy supply and demand sides work in concert. To close this gap, we use a dynamic “Computable General Equilibrium (CGE)” model to examine how a carbon tax and a reduction in coal capacity will affect energy demand and supply. Tan et al. (2022) utilising to provide evidence on these effects at the business level by using a “distribution dynamics technique, which could reveal historical transition probabilities and forecast long-term evolution. Using the unique data set collected during the Hubei ETS pilot project in China”. Wakabayashi and Kimura (2018) and Li (2022) offers a thorough analysis of Japan's first mandated emissions trading system, the “Tokyo Metropolitan Emissions Trading Scheme (Tokyo ETS)”, which was started by the Tokyo government. The Tokyo ETS includes indirect emissions from the commercial sector, in contrast to trading programme in other nations. Jimenez et al. (2022) employs a combination of bibliometric and text analysis techniques to provide a historical review of the literature on ship renewable energy. The R software's bibliometrix package was combined with the VOSviewer programme to do bibliometric analysis. Additionally, these researches have primarily examined industrialized economies like those in the United States and Europe. Despite the fact that few researches have focused on developing nations. Ren et al. (2020) investigated how the ETS affected micro-firm innovation. However, developing nations that are experiencing both severe environmental deterioration and rapid economic growth are under pressure from both the economy and the environment. The purpose of Gao et al. (2020) was to determine whether and how the ETS affects carbon emissions and carbon leakage. First of all place, from 2005 to 2015, the carbon emissions, consumption emissions, and emission levels from fossil fuel combustion for 28 industries across 30 regions were calculated using the provincial ecologically extended approach. Chen and Lin, (2021) discovered that carbon/energy-carbon performance can be greatly enhanced by carbon trading. This empirical study identifies the function of the carbon trading programme, which is a useful policy tool for promoting carbon neutrality, in boosting energy efficiency and emission reduction. Chen et al., (2021) focused examines the “weak” version of the Porter hypothesis using data from listed enterprises in 31 Canadian provinces between 1990 and 2018. Lin and Jia (2019) and Momohshaibu et al. (2022) examined through developing a dynamic recursive CGE model and generating five countermeasure calculations are based on the newly created Chinese national ETS market, we analyse the impacts of nationwide ETS on the economic, the power sector, and the environmental. Yang et al. (2020) described that in order the global carbon pricing system, implemented in 2017, and must be strengthened from the perspective of market-oriented environmental regulation policy if the economic dual reward and the Multiplier effect are to be extended over the rest of the country. “The NDRC issued a Notice on Carrying out the Pilot Project on Carbon Emissions Trading on October 29, 2011, and approved the start of CO2 ETS pilots in Beijing, Tianjin, Shanghai, Chongqing, Hubei, Guangdong, and Shenzhen” to lower the price of cutting pollution and entice businesses to do so through free markets (shown in Fig. 3). To lay the groundwork for the adoption of the CO2 ETS, the pilot areas set up a Carbon dioxide emission trading community in 2013 and released the related management measures in line with the policy requirements. Fig. 3 indicates the Pilot areas for the CO2 ETS.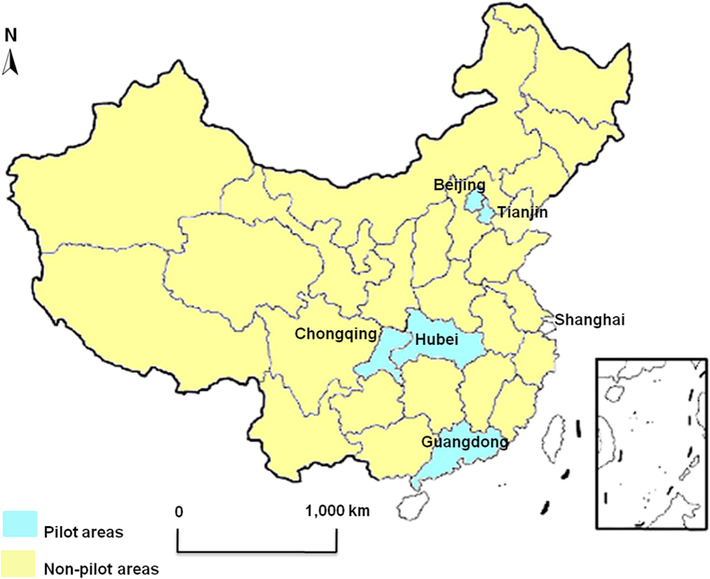
Pilot areas for the CO2 ETS.
Bayer and Aklin, (2020) provided evidence to back up the contention that a global market can work if it is a stable institution that might perhaps become more stringent in the road. In such a case, companies may reduce pollution even if the market cost is low. In fact, low prices may indicate a decline in the market for carbon allowances. Low pricing were therefore compatible with effective carbon markets. Arimura and Abe, (2021) described by the Tokyo administration that perhaps the Tokyo Emissions Trading System was effective, while others have argued that the decrease in emissions under Tokyo ETS was due to increases in electricity costs caused by the “Great East Japan Earthquake of 2011”. Adebayo et al. (2021) analysed data from 1965 to 2019 to determine how CO2 emissions and energy usage affect economic performance in Indonesia while also taking into account trade openness, urbanization, and agriculture.
2 Research methodology
2.1 Data and samples
The CO2 ETS pilot plan encompasses numerous industries, including as “petrochemicals, chemicals, building materials, iron and steel, nonferrous metals, paper, power, and aviation” (NDRC, 2016) (Wu et al. 2020). In altogether, these industries are responsible for 90% of the world's energy consumption and 95 percent of its CO2 emissions. Therefore, we focus on the above sectors for our study and employ the subsequent filtering methodology. A list of 10 double-digit industries is obtained by first relating the aforementioned the Chinese 2 industry's subsectors categorization, taking into account the data's availability. Second, we choose the aforementioned 10 double-digit industries from 2005 to 2015 in 30 provinces of mainland China as initial samples due to the dearth of data in Tibet.
The information was gathered from the following two sources: “first, the China Emission Accounts and Datasets, which provided information on CO2 emissions and energy consumption. Second, the China Statistical Yearbook, the China Industrial Statistical Yearbook, and the China Statistical Yearbook on Science and Technology were used to gather the other variable data” (Wu et al. 2020). When combining data from different sources, records with provincial capital power consumption values that are zero are eliminated. After all was said and done, we had 3,155 province-industry-year observations.
2.2 Factors
2.2.1 Energy consumption and CO2 emissions
In order to successfully evaluate policy effects, energy consumption and CO2 emissions must be accurately recorded. The following criteria guided the selection of these data:
-
First, the dataset the CO2 emissions from the procedures used to produce concretes in addition to the 20 categories of energy consumption used by 47 businesses, making emissions data complete and more precise.
-
Second, practically all current research employs the “Intergovernmental Panel on Climate Change (IPCC)” emission factors, “which have been proved by academics to be greater than China's survey numbers”.
-
Third, the dataset contains information on “China's 30 provinces' evidence from 2000 to 2015 is available”, supporting further investigation of China's environment protection.
In order to fully understand how the CO2 ETS has affected resource efficiency, “we converted 20 various forms of energy consumption into conventional coal and utilize the logarithmic of Province Company’s annually consumed energy”. The data have been utilised in a variety of research and are publicly accessible for downloading “from China Emission Accounts and Datasets”. “Similar to this, the logarithm of CO2 emissions from a provincial industry in a particular year is used to measure the effects of emission reduction Standard Coal are represents as SC”. Table 2 represents the reference coefficient for energy conversion.
Variable
All samples
Nonpilot areas
(N = 2532)
T-test
P50
P99
P1
Mean
SD
SD
Mean
SD
Mean
Difference
Other variables
ES2
87.88
99.95
0.02
78.64
23.48
25.09
76.8
23.05
79.08
2.3
EE
16.11
309.6
16.11
34.82
52.73
48.54
35.28
53.72
34.69
−0.62
Efficiency
0.76
0.88
0.58
0.75
0.08
0.076
0.08
0.08
0.74
−0.03**
ES1
71.3
98.98
0.02
61.82
32.31
32.95
51.96
31.7
64.25
12.32***
IS
4.22
35.06
0.02
6.26
6.99
7.04
4.77
6.93
6.65
1.88***
ES3
10.07
91.79
0.02
18.74
22.17
25.9
20.13
21.24
18.4
−1.75*
Marketization
6.26
10.16
6.22
6.27
1.76
1.25
7.89
1.64
5.88
−1.9**
Control variables
Fee
0.27
1.69
0.04
0.39
0.39
0.3
0.34
0.41
0.4
0.08***
Size
0.55
8.96
1
0.101
1.57
1.19
0.79
1.63
1.06
0.29***
Patent
0.18
3.5
1
0.43
0.09
0.62
0.67
0.73
0.38
−0.3***
Revenue
4.99
77.29
0.05
10.9
26.3
48.32
11.55
16.99
10.74
−0.82
Proportion
49.5
62
22.9
47.74
7.81
10.31
43.9
6.74
48.68
4.8***
FDI
0.46
18.48
1
1.79
3.58
4.79
3.51
3.06
1.37
−2.14***
Per GDP
3.09
10.4
0.78
3.5
2.17
2.78
5.48
1.66
3.02
−2.48***
Export
2
2
1
0.79
0.46
0.39
0.84
0.47
0.73
−0.15***
Energy consumption and CO2 emission
Ln(CO2)
1.63
5.67
1
1.88
1.54
1.67
1.45
1.56
1.94
0.29***
Ln(Energy)
5.28
7.1
0.05
4.86
1.95
4.51
2.05
1.92
4.93
0.44***
2.3 Control parameters
To include both internal and external forces in the debate of energy and the reduction of emissions, we account for a number of variables. “Industry size, income, Foreign Direct Investment (FDI), and export learning are internal factors”.
-
Industry size (Size): The logarithm of the average annual employee count for each industry is used to calculate its size.
-
Industry revenue (revenue): Industry energy use and carbon emissions are predicted to be positively connected with industry revenues. To calculate the industry's revenue, we utilize the entire operating income for each year.
-
FDI: Advanced technology that helps with energy saving and emission reduction can be brought to host countries by FDI. FDI, however, may also result in an increase in emissions and the pollution haven effect. To gauge the effect of FDI, we look at the ratio of industrial assets to FDI.
-
Export learning (export): Through export, businesses can acquire cutting-edge technology and management expertise and increase production efficiency, which has an impact on the sector's efforts to conserve energy and reduce emissions.
-
Proportion of industrial output value: Manufacturing's economic benefit as a percentage of GDP serves as a surrogate for the industry's value output.
-
Technological innovation (Patent): Given the crucial role that technical innovation plays in enhancing energy and environmental efficiency, to evaluate the amount of regional development, we look at the overall total number of patents granted in the region for any particular period.
3 Results
The descriptive data analyses for each variable are shown in Table 3. The logarithm of CO2 emissions is also 1.66 in pilot areas and 1.93 in nonpilot areas. We discover that non-pilot areas have much higher mean values for energy consumption and CO2 emissions than do pilot areas.
Hubei
Shenzhen
Shangai
Tianjin
Beijing
Guangdong
Chongqing
Threshold for coverage
Energy
>60,000 t
>20,000 t
>20,000 t
>20,000 t
>10,000 t
>20000 t
>20,000 t
Covered firms
138
635 firms & 197 buildings
191
114
490
202
242
Launch of the trading center
2014.04
2013.06
2013.11
2013.12
2013.11
2013.12
2014.0 6
Offiset
CCE Rs
CCE Rs
CCERs
CCERs
CCERs
CCERs
CCERs
Ration of cap to total emission Allocation
35%
38%
57%
50%-60%
40%
54%
60%
Annual cap (billio n ton)
3.24
1.07
1.6
1.6
0.6
3.88
1.25
Covered industry
industries including steel, cement, and chemicals
Industrial
sectorOther industries include those that produce steel, petrochemicals, chemicals, nonferrous metals, and power.
Industries such as those in the steel.
industries like cement, steel, and chemicals
industries such as power, cement, petrochemicals, steel, etc.
Chemical, metallurgical, electric, building, machinery, light, etc. industries.
Economy environmental regulations, the proportion of industrial production, and industry size are all considerably greater in non-pilot regions than those in pilot areas when when compared to the control variables. Additionally, the revenue generated by the industry in pilot and nonpilot locations does not differ significantly. Table 4 provides a summary of the aforementioned six elements such as “Beijing, Tianjin, Shanghai, Chongqing, Hubei, Guangdong, and Shenzhen” of the pilot policy design. Table 4 represents the ETS control in pilot regions.
Variables
CO2 emission
Energy consumption
Ln (CO2)
Ln (Energy)
Per GDP
0.66
(1.18)−1.87
(19.91)−0.05**
(0.02)−0.07
(0.03)
ETS
Time
−5.06***
(1.45)−85.38***
(26.41)−0.15**
(0.06)−0.22
(0.11)
Export
6.11
(3.64)120.03**
(47.24)0.39***
(0.07)0.82***
(0.16)
ETS
−12.19**
(4.73)−126.39
(122.61)−0.63***
(0.16)−1.61***
(0.32)
FDI
−0.26
(0.52)−2.36
(5.20)
0.01
(0.01)−0.00
(0.00)
Time
4.91
(3.67)89.24
(64.05)0.51***
(0.09)0.50***
(0.16)
Revenue
0.14
(0.01)4.46
(4.14)0.00*
(0.00)0.00
(0.00)
Size
0.40
(1.96)83.28
(50.86)0.17***
(0.04)0.34***
(0.05)
Proportion
0.09
(0.09)0.05
(2.26)0.00
(0.00)0.00
(0.00)
Observations
3,157
3,157
3,157
3,157
Patent
−0.24
(1.41)−10.41
(27.67)0.03
(0.02)0.08
(0.062)
Year fixed effects
Y
Y
Y
Y
Fee
6.83**
(2.71)−0.02
(0.07)106.21*
(57.27)0.04
(0.12)
Industry fixed effects
Y
Y
Y
Y
Constant
−9.58
(6.26)1.00***
(0.22)3.81***
(0.44)36.82
(109.28)
R-squared
0.62
0.52
0.73
0.85
Province fixed effects
Y
Y
Y
Y
3.1 Examining the parallel trend
In the first screening test, we examine the yearly fluctuations in power use and CO2 emissions among pilot regions and nonpilot regions in accordance with the approach. The yearly changes in the average square root of carbon dioxide emissions and energy consumption from 2005 to 2015 are depicted in Figs. 4 and 5, respectively. According to the statistics, the rates of growth in energy use and CO2 emissions in pilot regions and nonpilot areas were comparable before 2011. These findings provide us comfort in knowing that after 2011, the trends in the pilot regions and nonpilot areas would have been equivalent in the lack of the CO2 ETS pilot scheme.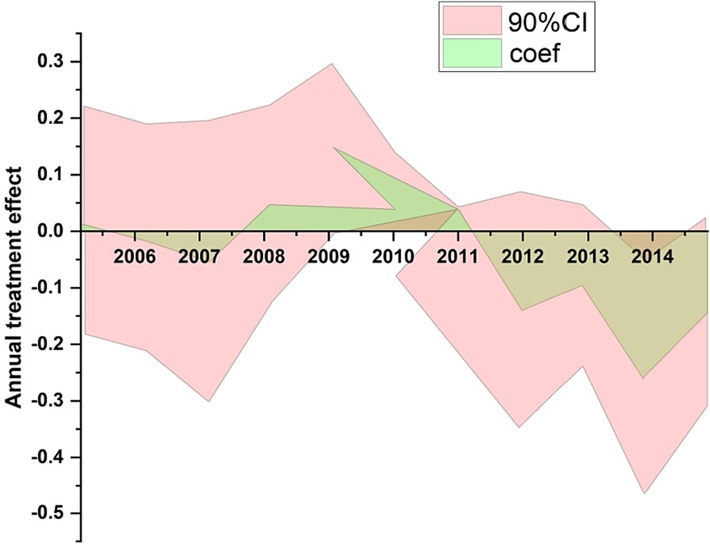
Ln annual treatment effect (Energy).
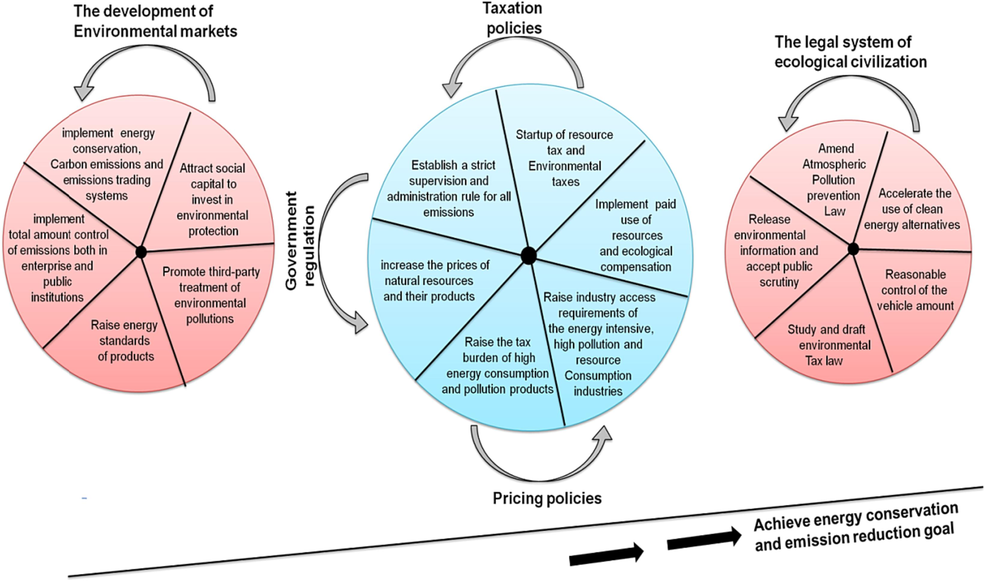
The most recent policies in China for reducing emissions and energy conservation.
3.2 Emission reduction and energy conservation
The information shows that the CO2 ETS has a negative effect on energy use and Carbon intensity. Specifically, following the introduction of the legislation, the controlled businesses in the pilot regions saw reductions in their power use and CO2 emissions of 22.8% and 15.5%, correspondingly. Even when using Emissions of CO2 and actual power consumption as response variable, the findings are still notably bad “at the 1% level”.For example, Shenzhen is said to have cut its carbon emissions by 11% between 2010 and 2015, according to reports. The Percentage is positively connected with energy use and CO2 emissions, in keeping with the conclusions of past research, although this correlation is not statically important. Additionally, the impact of Patent and Fee on energy use and carbon emissions is negligible. Overall, the findings show that the CO2 ETS has been effective in reducing emissions and promoting energy conservation. The outcomes might be attributed to two key causes when combined with the current scenario in China. This “bottom-up” cap construction method may be able to more effectively communicate the pressure for emission reduction to policy receivers at the micro level. Additionally, according to Oliveira et al. (2021), all pilot regions include emissions from both direct and indirect electricity usage; this might actually prevent carbon leakage, promote energy efficiency, and help reduce emission. Table 4 depicts the baseline regression.
Additionally, Fig. 4 shows how the “coefficient of energy consumption” reached statistical significance two years later how the “coefficient of CO2 emissions” reached statistical significance right away. The CO2 ETS has a general delaying effect on energy consumption. The indirect influence of the CO2 ETS on energy use may be the cause of the trailing effect, as enterprises gradually cut energy use to meet emissions objectives as the level of regulation rises.
3.3 Analysis of heterogeneity
In reality, the ETS's influence on policy might differ greatly. It depends on elements like policy design methodologies, relationships with current environmental regulations, and the institutional context. We concentrate on two elements—environmental enforcement and marketization—that are strongly related to the emerging nations. On the one hand, a strong legal foundation, such as trading regulations and sanctions for transgressing corporations, is necessary for the ETS to be implemented effectively. Environmental management choices made by a company may be impacted by strict environmental law oversight and enforcement.
3.4 Test of robustness
3.4.1 Estimation with propensity score matching (PSM)-DID
Whereas the CO2 ETS greatly reduces energy consumption and carbon dioxide emissions, proposed policy biases may have an impact on the outcomes. Choosing a region, for one, that has more impacts on energy saving and reducing emissions can skew the results. To address these issues, we therefore employ the PSM approach. We use predicted values to contrast businesses that share comparable economic features but aren't the focus of initiatives to industries which are the focus of government initiatives. “The most crucial decision in using the PSM approach is selecting the covariates, which include per GDP, proportion, patent, fee, size, revenue, FDI, and export”. The baseline equation is then re-estimated using the matched samples. Table 5 presents the findings of PSM-DID estimation.
Variables
Ln (CO2)
Ln (Energy)
Observations
2,887
2,887
Year fixed effects
Y
Y
Province fixed effects
Y
Y
ETS
Time
−0.15**
(0.05)−0.21***
(0.06)
Industry fixed effects
Y
Y
R-squared
0.85
0.75
Constant
1.07***
(0.22)3.84***
(0.41)
Controls
Y
Y
4 Discussion
The main distinguishing assumption of the DID model is that the energy conservation and pollution reduction efforts made by regulated companies in pilot regions may be successfully counter factually modified in non-pilot areas (Luong et al., 2017). A potential issue with this theory is the idea that preexisting temporal patterns could be to blame for the differences between the pilot and non-pilot sectors.
We compare the annual variations in power usage and CO2 emissions between pilot areas and nonpilot regions in the first screening test in line with the methodology. Figs. 4 and 5 show, respectively, the annual increases in the average square root of energy consumption and carbon dioxide emissions from 2005 to 2015. Prior to 2011, the rates of increase in energy consumption and CO2 emissions in pilot regions and nonpilot areas were equal, according to the figures. These results provide us comfort in knowing that, in the absence of the CO2 ETS pilot plan, the trends in the pilot regions and nonpilot areas would have been equal after 2011.
Particularly, the regulated firms in the pilot zones reduced their electricity usage and CO2 emissions by 22,8% and 15,5%, respectively, after the law was introduced. The results are still very poor “at the 1% level” even when real electricity usage and CO2 emissions are used as response variables. For instance, studies claim that Shenzhen reduced its carbon emissions by 11% between 2010 and 2015. Similar to this, the major polluters in Beijing decreased their total carbon emissions between 2013 and 2015 by around 4.6%, 5.99%, and 6.18%, respectively, according to the Beijing Environment Exchange (2017). Previous investigations on the economic impact of Chinese FDI came to similar conclusions. Export promotes energy conservation and emission reduction, maybe because it allows businesses to learn cutting-edge technologies and acquire managerial experience. Per GDP and the dependent variables are negatively correlated. In line with previous studies' findings, the percentage is positively correlated with energy consumption and CO2 emissions, however this association is not statistically significant. Furthermore, there is little effect of Patent and Fee on energy use and carbon emissions.
The lack of adequate monitoring is one of the key reasons for the inefficiency of Chile's carbon trading system. Environmental regulation and enforcement are essential for the ETS to be implemented effectively. The ETS is based on the concept of market competition, while being one of the most effective environmental legislation. Both the functioning of the carbon trading system and the effectiveness of trade will be significantly impacted by the volume of transactions, price, and searching and transaction fees. The ETS will be unsuccessful if the allowance is misused since the marginal costs of mitigation will outweigh the real advantages of carbon trading. For China's CO2 ETS, which is based on the emissions trading system used by developed nations like Europe and the United States, a poor institutional environment and government meddling are ongoing issues. Therefore, by examining contextual factors like marketization and environmental enforcement, we may be able to better understand the effects of policy. According to Li and Ramanathan's research (Zhang et al., 2020), we assess the efficiency of ecological legislation and enforcement by counting the number of provincial environmental administrative penalty cases that are filed each year. The statistics were taken from the China Environmental Statistics Yearbook. Depending on the average number of environmental regulations implemented, we divided our sample into two subgroups, with the sub-population below the environment compliance 50th percentile indicating less environmental compliance. Depending on the average level of marketization, we divided the samples into two subgroups, with the upper quartile below marketization representing a lesser extent of deregulation and privatization. One possible reason is that China has large coal reserves and that coal energy accounts for most of the primary energy sources in the nation. In fact, coal accounted for at least 60% of global energy use between 2000 and 2016.
This conference, which many people refer to as “China's second reform,” had a significant impact on China's green development laws, market, taxes, pricing, and oversight. Additionally, “the Action Plan for the Prevention and Control of Air Pollution was released by the State Council the same year.” The aforementioned policies and programmes will determine China's future development path in terms of renewable energy and greenhouse gas emissions. The most recent government plans from China include strategies for promoting energy balance and emissions reduction, such as (a) strengthening the legal basis for ecological sustainability, (b) releasing price strategy, tax policies, and regulatory changes to provide impetus, and (c) promoting the growth of environmental marketplaces. These tactics work together as mechanisms to strengthen China's efforts to cut pollution and increase energy efficiency. The most current regulations in China for emissions reduction and energy saving are shown in Fig. 5.
China has implemented a lot of environmental regulations to control the environment, and the CO2 ETS is a significant effort to address environmental problems. “We use the DID framework to evaluate the effects of the CO2 ETS on energy savings and reduced emissions using data from province two-digit sector from 2005 to 2015.” According to the findings, regulated firms in the pilot zones use 22.8% less energy and spend 15.5% less on environmental expenditures. Increasing technological efficiency and altering the industrial structure both have an impact on policy outcomes. Additionally, the CO2 ETS performs better in areas where environmental control and marketization are prevalent. After multiple testing, the general findings remain true. The importance of the following policy suggestions for the long-term expansion of a national CO2 ETS is stressed. First, our research shows that the regulated businesses in the pilot zones are successfully prompted to cut down on their energy use and emissions. When establishing market-based environmental policies to address urgent environmental challenges, China should use the lessons acquired from the CO2 ETS pilot programme as a road map and source of inspiration. Other industries and resource categories, such as the trade of water and energy rights, should also be considered by China. Second, further study shows that improving industrial structure and increasing energy technology efficiency are what make the CO2 ETS successful. The development and use of coal-related technologies should be taken into account in order to effectively boost coal energy efficiency and reduce emissions. Third, we discover that areas with more stringent environmental laws have more effective CO2 ETSs, highlighting the need of environmental monitoring for the efficient operation of the emissions trading system. The government should move quickly to adopt CO2 ETS legislation to increase the carbon emission pricing scheme's effectiveness. Furthermore, it's essential that carbon emissions data be presented in a transparent and unbiased way.
5 Conclusion
Results from the CO2 ETS appear to be positive on the overall, according to an early assessment of the policy that encourages. Such achievements not only give China a solid benchmark for using market-based environmental legislation to accomplish economically and ecologically sustainable growth, but they also support the implementation of carbon mitigation in emerging economies by offering practical instruments for policymaking. This is due to the fact that these experiences offer China a solid framework for using business environmental protections to achieve both environmental and economic sustainability. Using the DID model, which is built on dynamic panel of the two-digit sector at the provincial level from 2005 to 2015, we assess the impacts of the CO2 ETS on energy conservation and reducing emissions. In this research we analyze the factors such as energy consumption and CO2 emission and control parameters, descriptive data analysis, analysis of heterogeneity and test of robustness. Both of these effects are beneficial to the environment. However, it does not appear that this will have an effect on maximising the efficiency of the structure of foreign investment or advancing technical innovation. This demonstrates that eastern China's environmental control is not enforced to the same degree as other parts of the country.
6 Availability of data and materials
The data used to support the findings of this study are available from the corresponding author upon request.
Funding
Sponsored by the National Social Science Foundation of China, Major Programmes 22 and ZD107.
Acknowledgement
The authors are thankful to the higher authorities for the facilities provided.
Declaration of competing interest
The authors declare that they have no known competing financial interests or personal relationships that could have appeared to influence the work reported in this paper.
References
- Economic performance of Indonesia amidst CO2 emissions and agriculture: a time series analysis. Environ. Sci. Pollut. Res.. 2021;28(35):47942-47956.
- [CrossRef] [Google Scholar]
- Usage of traditional chinese medicine, western medicine and integrated chinese- western medicine for the treatment of allergic rhinitis. SPR. 2021;1(1):1-11.
- [CrossRef] [Google Scholar]
- The impact of the Tokyo emissions trading scheme on office buildings: what factor contributed to the emission reduction? Environ. Econ. Policy Stud.. 2021;23(3):517-533.
- [CrossRef] [Google Scholar]
- The European Union emissions trading system reduced CO2 emissions despite low prices. Proc. Natl. Acad. Sci. USA. 2020;117(16):8804-8812.
- [CrossRef] [Google Scholar]
- Towards carbon neutrality by implementing carbon emissions trading scheme: policy evaluation in China. Energy Policy. 2021;157:112510
- [CrossRef] [Google Scholar]
- Do carbon emission trading schemes stimulate green innovation in enterprises? Evidence from China. Technol. Forecast. Soc. Change.. 2021;168:120744
- [CrossRef] [Google Scholar]
- Evaluating the efficiency of carbon emissions policies in a large emitting developing country. Energy Policy. 2020;136:111080.
- [Google Scholar]
- Evaluation of effectiveness of China's carbon emissions trading scheme in carbon mitigation. Energy Econ.. 2020;90:104872
- [CrossRef] [Google Scholar]
- Digital twin technology: Revolutionary to improve personalized healthcare. SPR. 2021;1(1):33-35.
- [CrossRef] [Google Scholar]
- Effect of institutional quality and renewable energy consumption on CO2 emissions− an empirical investigation for developing countries. Environ. Sci. Pollut. Res. Int.. 2021;28(12):15485-15503.
- [CrossRef] [Google Scholar]
- How do FDI and technical innovation affect environmental quality? Evidence from China. Environ. Sci. Pollut. Res.. 2020;27(8):7835-7850.
- [CrossRef] [Google Scholar]
- A review of ship energy efficiency research and directions towards emission reduction in the maritime industry. J. Clean. Prod.. 2022;336:132888
- [CrossRef] [Google Scholar]
- Treatment and technology of domestic sewage for improvement of rural environment in China-Jiangsu: a research. SPR.. 2022;2(2):466-475.
- [CrossRef] [Google Scholar]
- Can energy supply-side and demand-side policies for energy saving and emission reduction be synergistic? - A simulated study on China's coal capacity cut and carbon tax. Energy Policy. 2020;138:111232
- [CrossRef] [Google Scholar]
- What will China's carbon emission trading market affect with only electricity sector involvement? A CGE based study. Energy Econ.. 2019;78:301-311.
- [CrossRef] [Google Scholar]
- How do foreign institutional investors enhance firm innovation? J. Financial Quant. Anal.. 2017;52(4):1449-1490.
- [CrossRef] [Google Scholar]
- Assessment of physicochemical parameters and organochlorine pesticide residues in selected vegetable farmlands soil in Zamfara state, Nigeria. SPR. 2022;2(2):491-498.
- [CrossRef] [Google Scholar]
- Potential trading partners of a brazilian emissions trading scheme: the effects of linking with a developed region (Europe) and two developing regions (Latin America and China) Technol. Forecast Soc. Change.. 2021;171:120947
- [CrossRef] [Google Scholar]
- Emissions trading and firm innovation: evidence from a natural experiment in China. Technol. Forecast. Soc. Change.. 2020;155:119989
- [CrossRef] [Google Scholar]
- Implementation of high dose rate brachytherapy in cancer treatment. SPR.. 2021;1(3):77-106.
- [CrossRef] [Google Scholar]
- Assessing the effects of emissions trading systems on energy consumption and energy mix. Appl. Energy. 2022;310:118583
- [CrossRef] [Google Scholar]
- Does ICT have symmetric or asymmetric effects on CO2 emissions? Evidence from selected Asian economies. Technol. Soc.. 2021;67:101692
- [CrossRef] [Google Scholar]
- The impact of the Tokyo Metropolitan Emissions Trading Scheme on reducing greenhouse gas emissions: findings from a facility-based study. Clim. Policy.. 2018;18(8):1028-1043.
- [CrossRef] [Google Scholar]
- How do energy consumption and environmental regulation affect carbon emissions in China? New evidence from a dynamic threshold panel model. Resour. Policy.. 2020;67
- [CrossRef] [Google Scholar]
- Does China's carbon emission trading policy have an employment double dividend and a Porter effect? Energy Policy. 2020;142:111492
- [CrossRef] [Google Scholar]
- Study on sustainable urbanization literature based on Web of Science, scopus, and China national knowledge infrastructure: a scientometric analysis in CiteSpace. J. Clean. Prod.. 2020;264:121537
- [CrossRef] [Google Scholar]
Appendix A
Supplementary material
Supplementary data to this article can be found online at https://doi.org/10.1016/j.jksus.2023.102920.
Appendix A
Supplementary material
The following are the Supplementary data to this article:


