

Translate this page into:
Estimation of yield, phenology and agro-meteorological indices of Quality Protein Maize (Zea mays L.) under different nutrient omissions in temperate ecology of Kashmir
⁎Corresponding authors at: Center for Plant Science and Biodiversity, University of Swat, Charbagh, Pakistan (I. Ali). tauseekk@gmail.com (Tauseef Ahmad Bhat), iftikhar.ali@stonybrook.edu (Iftikhar Ali)
-
Received: ,
Accepted: ,
This article was originally published by Elsevier and was migrated to Scientific Scholar after the change of Publisher.
Peer review under responsibility of King Saud University
Abstract
The major yield governing factors especially under rainfed ecosystem are the agro-meteorological indices. Hence, an experiment was conducted in 2021 kharif season to examine the impact of nutrient omission on phenology, yield and agro-meteorological indices of Quality Protein Maize (QPM) under the North Western Himalayas of India at the Agronomy farm of FoA (Faculty of Agriculture), Wadoora, Sopore, SKUAST-Kashmir. Eight treatments were used in the experiment viz. (T1-Absolute control, T2-N120P75K40, T3-N120P75K40Zn5S10, T4-P75K40Zn5S10 (-N), T5-N120K40Zn5S10 (-P), T6-N120P75Zn5S10 (-K), T7-N120P75K40S10 (-Zn) and T8-N120P75K40Zn5 (-S)), using a randomized complete block design with three replications. Results demonstrated that recommended dose of fertilizer plus zinc and sulphur (T3-N120P75K40Zn5S10) noted higher grain (9.78 t ha−1) and biological (22.05 t ha−1) yield, a longer period of time to reach various phonological stages thereby achieved maximum heat units or growing degree days (GDD), heliothermal units (HTU), photo-thermal units (PTU), pheno-thermal index (PTI) and heat use efficiency (HUE). Nitrogen was the most limiting nutrient thereby accumulating least heat units and HUE. The agrometeorological indices could be therefore helpful in predicting the phenology and maize yield. The outcomes of the experiment showed that using the recommended fertilizer dosage plus zinc and sulphur in QPM should be adopted to attain higher yield under the North Western Himalayas of India, However, additional agro-ecological study is required to further validate the findings.
Keywords
Agro-meteorological indices
GDD
Phenology
Phenothermal index
Yield

1 Introduction
Maize is known for efficient utilization of solar energy and has enormous potential for increased yield (Murdia et al., 2016). Weather variables like temperature, rainfall, light intensity, radiation, sunshine duration etc. are the important prevailing parameters that influence growth and productivity of crop however, temperature is among the most important factor that effects phenology, growth and yield of field crops (Zhang et al., 2022). Due to the high quality protein content, maize is essential for ensuring both food and nutritional security (Shingne et al., 2020). From an economic and environmental perspective, it is essential to regulate nitrogen fertilizer applications precisely and quickly for maize crops (Suhail et al., 2021). Depletion of soil nutrients is a major cause that is responsible for Asia’s farming systems’ low crop yields. Due to static and incorrect fertilizer recommendations, years of over fertilizing has resulted in significant nutritional and financial losses. To increase productivity and thereby boost food security, it is crucial to identify the soil nutrients limiting the growth and output of maize. Deficiency of essential nutrients has been associated to decreased nutrient intake, growth and crop yield (Jan et al., 2022). However, due to land use and soil management practices, fertility of soil varies geographically and temporally with time from small to large scale (Liu et al., 2009). Native soil nutrient status, cropping system, farming techniques, and fertilizer applications all have an impact on the level of soil fertility. By providing site-specific recommendations, this issue can be reduced (Moebius-Clune et al., 2013). The effective application of fertilizers depends on fertilizer management at the optimum time and dose (Hussain et al., 2007). To improve sustainable land use techniques and yield, it is essential to recognize variations in soil fertility in relation to their use, distribution, and causes. Smallholder farmers primarily manage soil variation through location-specific soil management on the basis of performance and crop responses which people have observed over previous years within local farms. Site-specific management of nutrients is one of the technique that aims to address the nutritional needs of crops accurately, precisely produced in the field. It utilizes native nutrient sources while providing fertilizers at precise rates and critical growth phases in order to fill the gap between crop's nutrient demand and the availability of natural nutrients (Fayaz et al., 2022). For correcting the soil variation and boosting the output of small-scale farmers, research must find the most constraining nutrients elements and develop flexible suggestions in place of blanket recommendations. Variations in soil properties may provide as the basis for flexible recommendations that influence productivity and yield responses.
The seasonal variation of crops and varieties can be effectively addressed through its heat unit requirements. The concept of a heat unit is used to account for the impact of temperature on crops, which is based on the idea that crops require a specific amount of temperature to complete each of their developmental stages (Singh and Amod, 2013). ‘Growing degree days’ (GDD), ‘heliothermal units’ (HTU), ‘photothermal units’ (PTU), ‘phenothermal index’ (PTI) and ‘heat use efficiency’ (HUE) are various temperature based agrometeorological indices used to assess phenology, growth and yield of field crops (Divesh et al., 2018). Crop biomass accumulation and developmental change are largely influenced through climatic factors during the growing season, which also have an impact on crop’s requirement for heat units as it progresses from one growth stage to another. A crop has a definite requirement of temperature for reaching various phenophases and the time interval between the different developmental stages is decided by the accumulation of heat units or GDD at the respective stage (Suffiya et al., 2023; Bhat et al., 2015). Despite similar agroclimatic conditions, nutrient omissions exhibit a remarkable influence on the crop phenology and phasic development of a crop and hence influencing the accumulation and partitioning of crop biomass. This change in the phenological time of a crop is inturn decided by the accumulation of heats and other agrometeorological indices (Jan et al., 2022). The research on findings the most limited nutrients affecting the yield of QPM through nutrient omissions and their impact on the agrometeorological indices deciding the heat requirement for proper phenological development has not been addressed under temperate climate of Kashmir, therefore, an experiment was conducted with a hypothesis to investigate overall phasic change as well as yield of QPM in response to nutrient omission by using the agro-meteorological indices.
2 Materials and methods
2.1 Experimental location
A field experiment was conducted to examine the impact of nutrient omission on phenology, yield and agro-meteorological indices of Quality Protein Maize at the Agronomy farm of FoA, Wadoora, Sopore, SKUAST-Kashmir during 2021 kharif season.
The location is falling under a temperate climate and an annual precipitation of 812 mm, with a latitude and longitude of 34° 34′ N and 74° 40′ E and an altitude of 1580 m amsl (above mean sea level). The variety tested for the experiment was LQMH-1. Soil texture of experimental farm was silty-clay-loam with a pH of 6.8 (neutral), medium content of organic carbon, medium availability of N, P, K, and S but with low availability of Zn (Table 1).
S. No.
Characteristics
Range
Methodology used
Remark
1
pH
6.8
Digital glass electrode pH meter (Jackson, 1973)
Neutral
2
EC
0.28 (dSm−1)
Solu-bridge conductivity meter (Jackson, 1973)
Normal
3
Organic carbon (O.C)
0.69 (%)
Walkley and Black’s method (Black and Walkley, 1934)
Medium
4
Available Nitrogen (N)
304.20 kg ha−1
Alkaline permanganate method (Subbiah and Asija, 1956)
Medium
5
Available phosphorus (P)
16.42 kg ha−1
Olsen’s method NaHCO3 (Olsen et al., 1954)
Medium
6
Available potassium (K)
178.63 kg ha−1
Ammonium acetate extract method (Flame photometer) (Jackson,1973)
Medium
7
Available Zinc (Zn)
0.68 mg kg−1
Diethylenetriaminepentaacetic acid (DTPA) extractable method (Lindsay and Norvell, 1978)
Low
8
Available sulphur (S)
17.30 kg ha−1
Turbidetric method (Sinclair, 1973)
Medium
9
Soil texture
Hydrometer method (Bouyoucos, 1962)
Silt clay loam
Sand
(20%)
Silt
(50%)
Clay
(30%)
2.2 Weather of the experimental site
The weather was found highly variable over the entire crop growing period, with weekly minimum temperature variation between 9.50 and 18.91 °C and weekly maximum temperature between 26 and 32 °C. The total precipitation of 184.60 mm was received during the entire crop growing period, whereas mean sunshine hours recorded were 144.54 and the average maximum (RH1) and minimum (RH2) relative humidity recorded have been 75.98% and 48.07%, respectively (Fig. 1).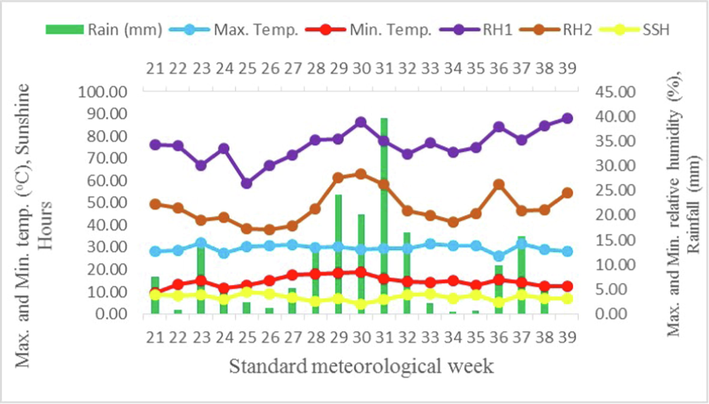
Weekly average meteorological data for Kharif-2021 crop growth season.
2.3 Details of the experimental design and treatments
Randomized complete block design (RCBD) was used in our study with three replications, and comprised of eight treatments viz., (T1-Absolute control, T2-N120P75K40, T3-N120P75K40Zn5S10, T4-P75K40Zn5S10 (-N), T5-N120K40Zn5S10 (-P), T6-N120P75Zn5S10 (-K), T7-N120P75K40S10 (-Zn) and T8-N120P75K40Zn5 (-S)).
2.4 Management practices of crop
The experimental plots were setup in accordance with the treatments. To achieve the desired depth, a tractor was used for two ploughings, which were followed by levelling. Bunds and replication borders of experimental plots were manually prepared. N, P, K, Zn and S nutrients were applied through urea (46% N), DAP (46% P2O5), MOP (60% K2O), zinc oxide (80.3% Zn) and potassium sulphate (18.4% S), respectively. Among the nutrient omission treatments, the treatments, T4 and T6, phosphorus and sulphur were applied through rock phosphate (20% P2O5) and gypsum (18.6% S), respectively. At sowing time, all nutrients were applied except for nitrogen, which was treated in three splits, 1/3rd was added as basal, and the remaining 2/3rd in two equal splits (knee high stage and prior to tasseling). The presence of enough soil moisture for seed germination was ensured prior to seed sowing. Seed that had been pre-soaked and treated with Metalaxyl 35 SD @ 4 g kg−1 and Bavistin + Captan 1:1 ratio @ 2 g kg−1 seed were sown with a spacing of 75 cm × 20 cm in lines.
After sowing, the lines were covered with soil and slightly pressed to ensure that the seeds had adequate contact with the soil. As per the crop requirement, irrigation water was used in the field. At 3 DAS, pre-emergence atrazine spray (0.75 kg a.i. ha−1) plus hand weeding at 21 days after sowing (DAS) were used to control weeds effectively. Chlorpyriphos (0.05%) was sprayed as a preventive approach to control insect infestations. After eliminating the two border rows from the experimental plots, the net plot area was calculated. Crop samples were manually harvested from the net plot area for the purpose of yield measurement, and hand shelling was done to separate the grains from the cobs.
2.5 Biometric observations of crop
When the crop had reached 50% of each phonological stage, observations on the number of days to complete each phenological stage were noted. After removing the stalk and husk from the cobs, grain yield was measured. All the cobs pertaining to each net plot area were sun dried, and the grains were then manually shelled. Grain yield noted in kg−1 was lowered to 15% moisture, and then indicated as tonnes ha−1 (t ha−1). After harvesting, weight of each net plot’s bundle was noted after three to four days of sun drying, and the weight was then transformed into tonnes ha−1 (t ha−1) for measuring biological yield.
2.6 Agro-meteorological indices calculation and heat use efficiency
Meteorological variables (viz. daily maximum and minimum temperature, sunshine hours, average relative humidity and day length) recorded through automatic weather station located in the research farm of Agronomy were used to calculate the agro-meteorological indices, using the formulas provided below, at different phenological stages. With a base temperature of 10 °C, agro-met indices were assessed from sowing time to each phenological stage. (Nuttonson, 1995).
TMax. = Maximum temperature,
Tmin = Minimum temperature.
Tb = Base temperature i.e. a temperature below which growth ceases.
2.7 Statistical analysis
By using the statistical method of randomized complete design, data on QPM phenology and grain yield were evaluated using the analysis of variance (ANOVA) technique. The SPSS software, version 27.0, was used to perform the operation of statistical analysis. The stepwise regression and correlation heat maps between yield and agro-meteorological indices were analysed using R software. The statistical model of the experimental design is given as: µ is overall mean; αi is treatment effect (Random Variable); βj is block effect (Fixed variable); eij is the error.
3 Results and discussion
3.1 Crop phenology
Data (Table 2) from the nutrient omission treatments demonstrated a significant variation in QPM so as to complete different phenophases. The prevalent temperature has a significant impact on the rate of plant development. Treatment (T3) N120P75K40Zn5S10 took 121 days to complete various phenophases when compared with the rest of treatments. The reason could be due to the sufficient and balanced nutrient availability that resulted in ideal vegetative growth prior to the beginning of reproductive stage. Whereas absolute control took least number of days (110.33) to complete different phenophases, that might be due to the best crop response under nutrient stress conditions, thus completing its duration in shorter span in comparison to the rest of treatments.
Days to different phenological stages
Growing degree days
Treatments
Knee high
Tasseling
Silking
Maturity
Knee high
Tasseling
Silking
Maturity
T1: Control
32.33
60.00
65.00
10.33
347.28
716.76
793.70
1,361.12
T2: N120P75K40
41.33
70.66
76.33
120.66
460.88
871.85
943.96
1,485.00
T3: N120P75K40Zn5S10
42.33
72.33
77.00
121.00
473.80
894.26
952.05
1,488.33
T4: P75K40S10Zn5 (-N)
34.33
64.33
70.00
115.00
370.70
805.26
862.35
1,413.25
T5: N120K40Zn5S10 (-P)
35.66
66.00
72.66
117.00
387.11
808.70
899.10
1,439.75
T6: N120P75Zn5S10 (-K)
37.66
67.33
73.66
118.00
414.78
826.43
911.26
1,453.50
T7: N120P75K40S10 (-Zn)
38.66
68.00
75.00
119.00
427.45
834.76
927.60
1,466.00
T8: N120P75K40Zn5 (-S)
39.33
68.33
75.33
119.33
435.95
857.85
931.68
1,470.08
Sem±
0.61
0.48
0.73
0.60
9.02
14.61
11.40
4.00
CD(p ≤ 0.05)
1.84
1.45
2.16
1.82
27.43
41.36
34.92
12.45
Among nutrient omission treatments, nitrogen omission treatment took a minimum days (115.00 Days) to achieve various phenophases, therefore, emerged as the most restricted nutrient, followed by phosphorus and potassium, showing most significant impact on growth characters as compared to other nutrients. The omission of nitrogen followed by P and K reduced the vegetative phase of crop and consequently the calendar days and thermal regime of different phenological stages in QPM. Phenological stages are highly dependent on proper nutritional balance therefore any deviation can cause malfunctioning in their expression (Kaur et al., 2010).
3.2 Agro-meteorological indices
3.2.1 Growing degree days (GDD)
Nutrient omission treatments showed significant variation (Table 2) in QPM’s heat accumulation at several phenological phases. The treatment N120P75K40Zn5S10 consumed more heat units (1,488.33 0C) to cross several phenological phases in contrast to other treatments, whereas absolute control treatment consumed the lowest heat units. The reason could be due to the presence of sufficient and balanced application of fertilizers throughout the crop growth period, which extended the calendar days and consequently the crop growth period, thereby increasing GDD. Omission of nutrients (-N, -P, -K, -Zn and -S) showed a substantial decrease in consuming heat units, however, the most prominent influence was seen in case of N. The growing degree day (GDD), which takes into account the amount of heat needed to complete various crop phenophases, estimates the relation of growth with temperature. This might be attributed to the nutrient stress conditions that resulted in shortening of growth period thus reducing the duration of different phenophases under nutrient omission treatments, resulting in consumption of less heat units. Several researchers reported similar results (Bhat et al., 2015).
3.2.2 Heliothermal units (HTU)
Significant differences in heliothermal units at various phonological stages were observed (Table 3) among various nutrient omission treatments in QPM. The highest number of heliothermal units (11,542.81 °C day hour) were recorded under the treatment N120P75K40Zn5S10 in comparison to other treatments at different phenological stages. The reason is due to the accumulation of more heat units through balanced and adequate nutrient availability, which in turn increased HTU. Among nutrient omission treatments, N was the most limiting nutrient that showed least accumulation of HTUs (10,968.46 °C day hour) due to the reduced vegetative phase of crop under N omission followed by P and K. Several experimental reports support our examined results (Hafiz et al., 2013).
Treatments
Knee high
Tasseling
Silking
Maturity
T1: Control
2,859.50
5,756.61
6,248.46
10,511.04
T2: N120P75K40
3,980.86
6,647.28
7,155.40
11,520.47
T3: N120P75K40Zn5S10
4,089.98
6,819.75
7,210.20
11,542.81
T4: P75K40S10Zn5 (-N)
3,118.24
6,245.48
6,590.18
10,968.46
T5: N120K40Zn5S10 (-P)
3,272.61
6,305.80
6,862.77
11,205.15
T6: N120P75Zn5S10 (-K)
3,536.09
6,366.41
6,930.77
11,314.57
T7: N120P75K40S10 (-Zn)
3,669.45
6,385.33
7,031.79
11,406.46
T8: N120P75K40Zn5 (-S)
3,515.83
6,532.88
7,071.39
11,433.82
Sem±
103.38
82.42
62.60
21.01
CD(p ≤ 0.05)
309.58
247.47
187.80
64.66
3.2.3 Photothermal units (PTU)
Accumulation of photothermal units varied significantly at different phenophases among the different nutrient omission treatments in QPM (Table 4). The treatment N120P75K40Zn5S10 accumulated highest number of photothermal units at knee high (6,501.63 °C day hour), tasseling (12,179.14 °C day hour), silking (12,940.46 °C day hour) and maturity (19,676.37 °C day hour) stage. This might be accounted to the accessibility of nutrients that extended the duration for completing different phenophases, thus led to the production of more heat units and consequently increased PTUs. Among nutrient omission treatments, omission of N resulted in the accumulation of least PTUs followed by the omission of P and K at each phenological stage. The reason is due to the decline in vegetative phase of the crop resulting in decreased crop duration thus achieving lower PTUs. Ram et al., 2012 also explained similar findings in their research.
Treatments
Knee high
Tasseling
Silking
Maturity
T1: Control
4,762.38
9,808.03
10,840.99
18,137.49
T2: N120P75K40
6,324.45
11,882.23
12,834.23
19,636.39
T3: N120P75K40Zn5S10
6,501.63
12,179.14
12,940.46
19,676.37
T4: P75K40S10Zn5 (-N)
5,084.80
10,994.85
11,756.32
18,772.47
T5: N120K40Zn5S10 (-P)
5,310.76
11,041.85
12,243.04
19,092.83
T6: N120P75Zn5S10 (-K)
5,691.23
11,278.39
12,403.74
19,258.51
T7: N120P75K40S10 (-Zn)
5,865.34
11,389.54
12,619.16
19,408.81
T8: N120P75K40Zn5 (-S)
5,982.16
11,696.22
12,672.77
19,457.67
Sem±
127.46
183.92
126.27
33.77
CD(p ≤ 0.05)
376.99
552.37
376.52
98.99
3.2.4 Phenothermal index (PTI)
Phenothermal index, which is represented as degree days per growth day, was significantly influenced under various nutrient omission treatments at different phenological stages (Table 5) and revealed an increasing trend from knee high to flowering stage, followed by a trend depicting a decrease till maturity, which may indicate a reduction in daily heat consumption in approaching senescence. Treatment N120P75K40Zn5 (-S) showed significantly higher phenothermal index (14.52 °C day day−1), though statistically par with P75K40Zn5S10 (-N). From silking to tasseling, absolute control recorded the highest phenothermal index (15.38 °C day day−1) and the lowest PTI was noted under nitrogen omission treatment (9.47 °C day day−1). From silking to maturity, maximum phenothermal index (12.51 °C day day−1) was achieved under the absolute control treatment whereas N120P75K40Zn5S10 treatment showed the lowest PTI (12.18 °C day day−1), likely as a result of maximum duration to pass these phonological stages. These results are explained by the findings of Bhat et al. (2015) and Jan et al. (2022) in their findings.
Treatments
Tasseling-Knee high
Silking-Tasseling
Maturity-Silking
T1: Control
13.35
15.38
12.51
T2: N120P75K40
14.01
12.65
12.20
T3: N120P75K40Zn5S10
14.01
12.35
12.18
T4: P75K40S10Zn5 (-N)
14.47
9.47
12.24
T5: N120K40Zn5S10 (-P)
13.89
13.56
12.19
T6: N120P75Zn5S10 (-K)
13.87
13.43
12.23
T7: N120P75K40S10 (-Zn)
13.88
13.26
12.23
T8: N120P75K40Zn5 (-S)
14.52
11.18
12.22
Sem±
0.08
0.23
0.069
CD(p ≤ 0.05)
0.24
0.69
0.18
3.2.5 Heat use efficiency (HUE)
As per the data (Table 6) nutrient omission treatments varied significantly with respect to HUE, in terms of grain and biological yield. Highest heat use efficiency (HUE) on grain yield basis (6.56 kg ha−1 0C days−1), biological yield basis (14.81 kg ha−1 0C days−1) were noted under the treatment N120P75K40Zn5S10 in contrast to absolute control and rest of nutrient omission plots. This is explained on the basis of significantly higher yield returns due to the synchronized application and availability of all nutrients to the crop, thus accounted for higher heat use efficiency. Among the different nutrient omission treatments, omission of nitrogen followed by the omission of P and K showed the most significant impact on HUE. Nitrogen omitted plots resulted in lower grain and biological yield thus resulting in lower HUE. Our data is supported with the research results of Jagdish and Hadda (2014), Bhat et al. (2015) and Jan et al. (2022).
Treatments
Grain yield basis
Biological yield basis
T1: Control
3.10
7.56
T2: N120P75K40
6.15
13.97
T3: N120P75K40Zn5S10
6.56
14.81
T4: P75K40S10Zn5 (-N)
3.99
9.77
T5: N120K40Zn5S10 (-P)
4.56
10.79
T6: N120P75Zn5S10 (-K)
5.15
11.74
T7: N120P75K40S10 (-Zn)
5.50
12.61
T8: N120P75K40Zn5 (-S)
5.60
12.89
Sem±
0.16
0.37
CD(p ≤ 0.05)
0.49
1.15
3.3 Yield (t ha−1)
Nutrient omission treatments differed significantly in terms of grain-yield as exhibited by the data (Table 7). Treatment N120P75K40Zn5S10 achieved the higher grain yield of 9.78 tonnes ha−1 however, lowest grain-yield of 4.22 tonnes ha−1 were recorded under absolute control treatment. However, it was observed that the omission of nutrients (-Nitrogen, -Phosphorus, -Potassium, -Zinc and –Sulphur) significantly reduced the grain yield. In comparison to Nitrogen, Phosphorus and Potassium omission treatments, omission of zinc (-Zn) and sulphur (-S) treatments had the least influence on grain yield reduction. Furthermore, significant variation was noticed among the various nutrient omission treatments with respect to biological yield. The treatment N120P75K40Zn5S10 recorded the biological yield (22.05 t ha−1), though statistically par to N120P75K40, and lowest biological yield of 10.29 t ha−1 was achieved under absolute control treatment. Further, it was found that biological yield was significantly reduced when nutrients were omitted (-Nitrogen, -Phosphorus, -Potassium, -Zinc and –Sulphur). However, zinc (-Zn) and sulphur (-S) omitted plots demonstrated least impact on biological yield reduction when compared to (-N, -P, and -K). Adequate availability of nutrients through balanced nutrient management system at critical phenophases lead to the efficient photosynthate translocation from source to sink that in turn improved growth characters and yield attributes, thereby resulting in enhanced grain-yield. Experimental results examined by Sinha (2016) support these findings. Increased leaf area results in maximum interception of resulting in increased production and accumulation of dry matter and yield attributing characters that consequently results in higher yield (both grain and biological). Findings of Gani et al. (2018) also supported these results. Omission of nutrients particularly nitrogen effectively disturbs the metabolism of plants, disrupts chlorophyll structure and destabilize pigment protein complex which results in yield reduction in maize followed by phosphorus omission. Moreover, nitrogen omission shortens the vegetative phase that result in low grain yield. These results are supported by Reddy and Dakota (2007). Under the exclusion of primary macronutrients plants do not attain proper vegetative growth resulting in expression of poor yield attributes and yield. (Gangaiah, 2019). Plants subjected to improper growth at early stages affect biomass production with yield reduction because of poorly developed root system, under the omission of P. Further, more yield decline under N, P and K omission might be accounted to availability of soil nutrients in the respective omission plots, making it difficult to meet the higher requirements of these nutrients for maize. Mousumi and Ghosh (2018) explained similar findings in their research.
Treatments
Grain yield (t/ha)
Biological yield (t/ha)
T1: Control
4.22
10.29
T2: N120P75K40
9.13
20.74
T3: N120P75K40Zn5S10
9.78
22.05
T4: P75K40S10Zn5 (-N)
6.25
14.41
T5: N120K40Zn5S10 (-P)
6.96
15.92
T6: N120P75Zn5S10 (-K)
7.49
17.06
T7: N120P75K40S10 (-Zn)
8.07
18.49
T8: N120P75K40Zn5 (-S)
8.24
18.97
Sem±
0.19
0.45
CD(p ≤ 0.05)
0.55
1.32
3.4 Stepwise regression analysis
Stepwise regression analysis was made to find critical agro-meteorological indice responsible for higher yield of quality protein maize at different phenological stages and different the most predictable and probable model obtained for the parameter influencing the yield largely have been presented in Table 8. Among all the parameters affecting yield, NOD (Number of days) and PTU were added due to their higher coefficient of determination (R2). As per the results obtained PTU at knee high and harvest stage explained 92.6% and 83% of total variation in the yield whereas, NOD explained 88.3% and 82.3% of total variation in yield at tasseling and silking stage respectively (Table 5). These results are supported by the findings of Jan et al. (2022) and Bhat et al. (2015).
Growth stage
Yield
Stepwise regression equation
R2
(%)
S.E.
Sig.
Knee high
Grain yield
0.028*PTU-85.405
0.926
0.002
0.000
Stover yield
5.353*NOD-104.572
0.918
0.341
0.000
Biological yield
10.249*NOD-215.27
0.924
0.627
0.000
Tasseling
Grain yield
4.362*NOD-218.862
0.883
0.338
0.000
Stover yield
4.781*NOD-223.663
0.882
0.373
0.000
Biological yield
9.143*NOD-442.525
0.885
0.702
0.000
Silking
Grain yield
4.081*NOD-224.507
0.823
0.403
0.000
Stover yield
4.466*NOD-229.318
0.819
0.447
0.000
Biological yield
8.547*NOD-453.824
0.823
0.844
0.000
Maturity
Grain yield
0.032*PTU-536.656
0.003
0.830
0.000
Stover yield
0.035*PTU-568.094
0.003
0.819
0.000
Biological yield
0.067*PTU-1104.750
0.006
0.827
0.000
3.5 Correlation studies
The correlation studies between yield and agro-meteorological indices at different growth stages of quality protein maize were interpreted in Fig. 2. The results analysed on heat maps indicated that grain yield, stover yield and biological yield exhibited strongly positive and significant correlation with all the agrometeorological indices calculated viz. GDD, NOD, HTU, PTI etc except at knee high and tasseling stage where PTI was found to have week and non-significant correlation with yields. Further, the different agrometeorological indices showed positive and significant correlation with each other at all the phonological stages except at knee high stage where they exhibited non-significant relation between each other. These results indicated that agro-meteorological indices have greater and significant impact on the yield of quality protein maize and acts a key factor in influencing it through the heat unit requirement, heat use efficiency, sunshine hours and day length. These results are supported by the findings of Jan et al. (2022) and Bhat et al. (2015).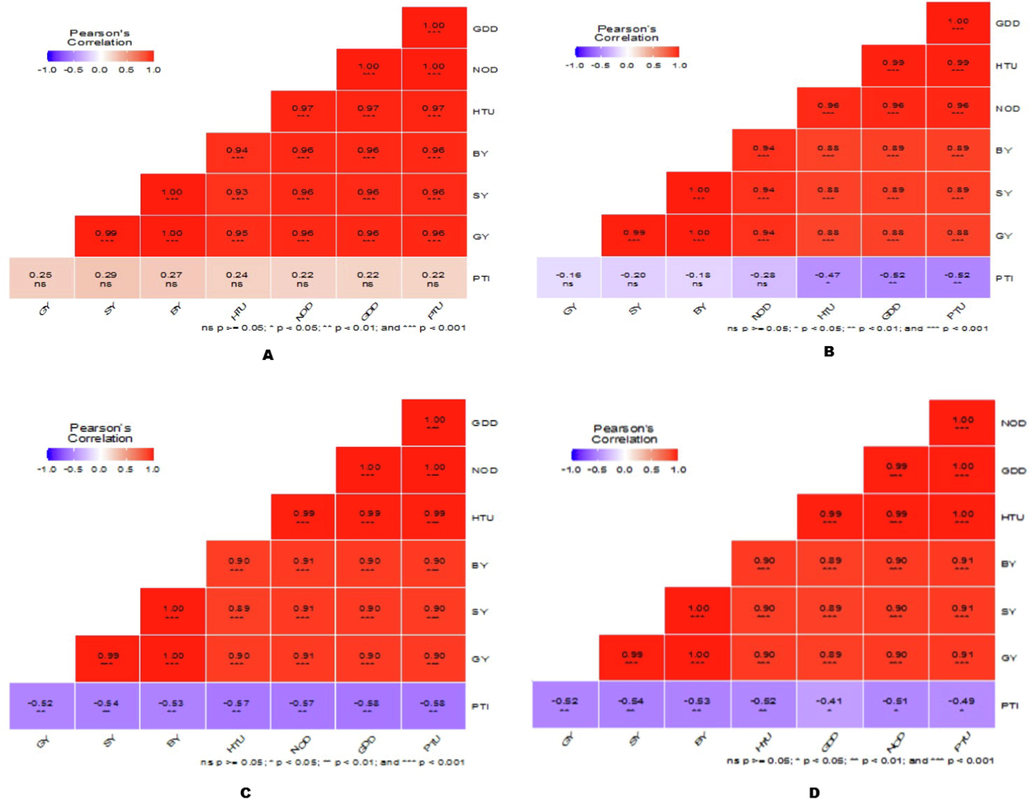
Heat map of the Pearson correlation between Grain yield (GY), Stover yield (SY), Biological yield (BY) and agrometeorological indices viz. Number of days (NOD), Helio-thermal units (HTU), Photothermal units (PTU), Pheno-thermal index (PTI) at (A) Knee High Stage; (B) Tasseling stage; (C) Silking stage; (D) Maturity stage.
4 Conclusions
Site specific application of N120P75K40Zn5S10 in quality protein maize needed more duration (days) to cross various phenological stages and achieved more number of accumulated heat units, photothermal units (PTU), phenothermal index (PTI), heliothermal units (HTU) and heat use efficiency (HUE), consequently higher yield (grain and biological). Moreover, adequate availability of nutrients during entire growth phase is essential for exploiting the weather conditions in a better way as evidenced by heat use efficiency. Among the nutrient omissions, nitrogen was found most limited and critical for the growth of QPM. Therefore, it can be concluded that site specific application of N120P75K40Zn5S10 should be adopted in QPM for achieving higher yield under the North western Himalayas of India, however as this was single year experiment (single location), it should be standardized location wise so that precise recommendations can be made effectively for adopting site specific nutrient management in QPM.
Funding
This research work was funded by Princess Nourah bint Abdulrahman University Researchers Supporting Project Number (PNURSP2023R62), Princess Nourah bint Abdulrahman University, Riyadh, Saudi Arabia.
Acknowledgement
This research work was funded by Princess Nourah bint Abdulrahman University Researchers Supporting Project Number (PNURSP2023R62), Princess Nourah bint Abdulrahman University, Riyadh, Saudi Arabia. The authors are highly thankful to the division of Agronomy, FoA, Wadura for providing facilities to conduct this research work.
Declaration of Competing Interest
The authors declare that they have no known competing financial interests or personal relationships that could have appeared to influence the work reported in this paper.
References
- Relation between agrometeorological indices, crop phenology and yield of rice genotypes as influenced by real time N management. J. Agrometeorol.. 2015;17(1):90-97.
- [Google Scholar]
- Hydrometer method improved for making particle size analyses of soils. Agron. J.. 1962;54(5):464-465.
- [Google Scholar]
- Temperature Based Agrometeorological Indices for Indian Mustard under Different Growing Environments in Western Haryana, India. Int. J. Curr. Microbiol. App. Sci.. 2018;7(01):1025-1035.
- [Google Scholar]
- Leaf Color Chart (LCC)-Based Precision Nitrogen Management for Assessing Phenology, Agrometeorological Indices and Sustainable Yield of Hybrid Maize Genotypes under Temperate Climate. Agron.. 2022;12:2981.
- [Google Scholar]
- Nutrient omission plot technique for yield response, indigenous nutrient supply and nutrient use efficiency estimation of rice (Oryza sativa L.) crop in Andaman and Nicobar Islands. Oryza. 2019;56:388-395.
- [Google Scholar]
- Effects of nutrients omission on maize growth and nutrient uptake in three dominant soil types of southwestern Nigeria. J. Plant Nutr.. 2018;41(15):1903-1915.
- [Google Scholar]
- Nitrogen stimulates phonological traits, growth and GDD of maize. Pak. J. Agric. Sci.. 2013;50(3):337-343.
- [Google Scholar]
- Measurement of nutrients in green house soil with laser induced breakdown spectroscopy. Environ. Mon. Asses.. 2007;124:131-139.
- [Google Scholar]
- Soil Chemical Analysis. New Delhi: Prentice Hall of India Private Limited; 1973. p. :498.
- Phenology and thermal indices of maize (Zea mays L.) influenced by subsoil compaction and nitrogen fertilization under semi-arid irrigated conditions. J. App. Natural Sci.. 2014;6(2):349-355.
- [Google Scholar]
- Evaluation of seedling age and nutrient sources on phenology, yield and agrometeorological indices for sweet corn (Zea mays saccharata L.) Saudi J. Bio. Sci.. 2022;29:735-742.
- [Google Scholar]
- Impact of nitrogen application on the performance of wheat and nitrogen use efficiency under different dates of sowing. Ind. J. Agron.. 2010;55:40-45.
- [Google Scholar]
- Development of DTPA soil test for Zinc, Iron, Mangnese and Copper. Soil Sci. Soci. Amer. J.. 1978;42(3):421-428.
- [Google Scholar]
- Evaluation of soil quality in the Yellow River Delta based on GIS. Chin. J. Soil Sci.. 2009;37(6):1053-1057.
- [Google Scholar]
- Adapt-N uses models and weather data to improve nitrogen management for corn. Better Crop.. 2013;97:7-9.
- [Google Scholar]
- Studies on different Agrometeorological indices and thermal use Efficiencies of rice in New Alluvial Zone of West Bengal. Bullet. Environ. Pharmacol. Life Sci.. 2018;7(6):72-78.
- [Google Scholar]
- Wheat Climate Relationship and Use Phenology in Ascertaining the Thermal and Photothermal Requirement of Wheat. Washington DC: American Institute of Crop Ecology; 1995. p. :338.
- Olsen, S.R., Col, S.W., Watenable, P.S., Dean, L.A. 1954. Estimation of available phosphorus in soils by extraction with sodium bicarbonate USDA, Circular 939.
- Accumulated heat requirement and yield of irrigated wheat (Triticum aestivum L.) varieties under different crop growing environment in central Punjab. J. Agromet.. 2012;14:147-153.
- [Google Scholar]
- Yield components of nodulated cowpea (Vigna unguiculata) and maize (Zea mays) plants grown with exogenous phosphorus in different cropping systems. Austra. J. Experi. Agric.. 2007;47:583-589.
- [Google Scholar]
- Studies of Agrometeorological Indices on under Hybrids Maize (Zea mays L.) under different Weather Condition. Int. J. Curr. Microbiol. App. Sci.. 2020;9(09):310-317.
- [Google Scholar]
- An ‘AutoAnalyzer’ method for determination of extractable sulphate in soil. New Zealand J. Agric. Res.. 1973;16(2):287-292.
- [Google Scholar]
- Thermal requirment of maize influenced by planting dates and intra- row spacing. Ijltemas.. 2013;2(1):18-23.
- [Google Scholar]
- Effect of site specific nutrient management on production and productivity of maize (Zea mays L.) under mid hill condition of Chhatisgarh. Inter. J. Plant Sci.. 2016;11(2):167-170.
- [Google Scholar]
- A rapid procedure for the estimation of available nitrogen in soil. Curr. Sci.. 1956;27:259-260.
- [Google Scholar]
- Spatial and temporal arrangement of hybrid maize for assessment of phenology and agrometeorological indices. J. Agri Sear.. 2023;10(1):01-10.
- [Google Scholar]
- Effect of precision nitrogen management through LCC on nutrient content and uptake of maize (Zea mays L.) under temperate conditions of Kashmir. Inter. J. Pl. Soil Sci.. 2021;33(15):1-11.
- [Google Scholar]
- An examination of the Degtjareff method for determining soil organic matter and a proposed modification of the chromic acid titration method. Soil Sci.. 1934;37:29-38.
- [Google Scholar]
- The impact of climate change on maize production: Empirical findings and implications for sustainable agricultural development. Front. Environ. Sci.. 2022;10:954940.
- [CrossRef] [Google Scholar]
Appendix A
Supplementary material
Supplementary data to this article can be found online at https://doi.org/10.1016/j.jksus.2023.102808.
Appendix A
Supplementary material
The following are the Supplementary data to this article:


