

Synthesis of lignin nanoparticles from Oxytenanthera abyssinica by nanoprecipitation method followed by ultrasonication for the nanocomposite application
⁎Corresponding author at: Department of Industrial Chemistry, College of Applied Sciences, Addis Ababa Sciences and Technology University, P.O. Box-16417, Addis Ababa, Ethiopia. rkbachheti@gmail.com (Rakesh Kumar Bachheti)
-
Received: ,
Accepted: ,
This article was originally published by Elsevier and was migrated to Scientific Scholar after the change of Publisher.
Peer review under responsibility of King Saud University.
Abstract
Lignin nanoparticles (LNPs) have a wide range of potential uses in the biomedical and environmental fields. They are used to prepare antioxidants, food packaging material, energy storage, cosmetics, thermal/light stabilizers, reinforced materials, and drug delivery. In this study, LNPs were prepared from soda lignin obtained from Oxytenanthera abyssinica using dioxane, acetone, ethanol, and acid-base solvents through the nanoprecipitation method, followed by an ultrasonic process. These methods produced four different LNPs with yields in the range of 28.5% to 88.9%. Scanning electron microscope (SEM) showed that the spherical-shaped LNPS (100–400 nm) were obtained using the acetone solvent, while irregularly shaped LNPs were formed by dioxane (150–400 nm), ethanol (40–200 nm) and acid-base (100–800 nm) solvents. The maximum zeta potential of the LNPAS samples was |-35.1 mV|, determined by the dynamic light scattering (DLS), with a particle size distribution between 91.28 and 458.7 nm. According to the energy-dispersive X-ray spectrometer (EDX) results, the sample contains the elements C, O, Si, Na, and Mo. X-ray powder diffraction (XRD) analysis showed very small crystallinity sizes ranging from 0.31 to 0.35 nm. Proton nuclear magnetic resonance (H-NMR) and Fourier transformation infrared Spectroscopy (FTIR) were used to find the functional groups in the synthesized LNPs. The Thermogravimetric analysis (TGA) peak showed that LNPS was thermally stable, and rapid mass loss occurred between 300 and 415 °C. Differential Scanning Calorimetry (DSC) data shows that the highest exothermic peaks are obtained at 345.2 °C. Synthesis of LNPs by dissolving isolated soda lignin in acetone, ethanol, dioxane, and acid-base solvents was quickly recovered, cheap, and eco-friendly. The synthesized are free of sulfur; they do not use toxic solvents such as Tetrahydrofuran (THF), Dimethyl sulfoxide (DMSO), and Dimethylformamide (DMF). Thus, they provide benefits for high-value-added Nanocomposite applications such as bio-based nonmaterial and food packaging materials. Acid-base nanoprecipitation procedure is the best approach regarding stability and size, but the acetone nanoprecipitation method is preferable regarding shape.
Keywords
Characterization
Soda lignin
Preparation of LNPS
Nanoprecipitation
Oxytenanthera abyssinica

1 Introduction
Lignin is a polyphenolic biopolymers of lignocellulosic biomass and represents one of the most abundant aromatic macromolecule (Figueiredo, et al., 2021). Due to environmental concerns, currently, lignin has become one of the research areas for industrial purposes. Depending on the process used for isolation, there are many forms of lignin, including sulfite, organosolv, soda, and kraft lignin (Upton and Kasko, 2016). Soda lignin is the most well-known type of lignin; it is widely used to process non-wood fibers. It is more pure and free of sulfur. As a result, it is the preferred method for nanocomposite application. The soda process is often considered advantageous compared to other methods because it provides feasible opportunities for chemical recovery and a reduced cooking time (Worku et al., 2023).
Lignin is frequently used to form various biomaterials used to deliver medications, tissue regeneration, antibacterial defenses, and antioxidants (Figueiredo et al., 2017). Although lignin has several uses, its low miscibility, low solubility, diverse structure, and wide range of molecular weights prevent it from performing those uses to their full potential (Gao and Fatehi, 2019). The efficiency of the lignin valorization process has increased due to lignin's conversion to the nanoscale (Low, et al,2021). The synthesis of LNPs is one of the most effective strategies for improving lignin's chemical and physical properties, because LNPs have better dispersibility and a larger surface-to-volume ratio than lignin (Chauhan, 2018). There are several ways to prepare LNPs, such as self-assembly, anti-solvent precipitation, acid precipitation, and solvent shifting (Figueiredo et al., 2018). However, most lignin-based nanoparticle preparation techniques include using expensive or harmful solvents such as THF, DMSO, and DMF and using more significant amounts of solvent that will not be recovered (Tang et al., 2020). For nanocomposite applications, cheap, easily recovered, green solvents such as water, ethanol, and acetone are preferably used for preparation.
Thus in this paper, we used ethanol, acetone, dioxane, and acid-base solvent to prepare different LNPs from soda lignin using the nanoprecipitation method. Nanoprecipitation is an easy, straightforward, quick, and sensitive process that uses little equipment and non-toxic substances (Schubert et al., 2011). The raw material used in LNPs preparation should be sustainable, abundant, and reduce environmental concerns. In this regard, Oxytenanthera abyssinica was used as a lignin source for LNP preparation in our study because it is a fast-growing plant with a short harvesting time, is abundant and has good chemical composition properties that make the plant a cost-effective and sustainable feedstock for chemical and biochemical industrial applications.
2 Material and methods
2.1 Pretreatment of Oxytenanthera abyssinica
Using Soxhlet extraction, dewaxing was performed using a 2:1 ratio combination of toluene to ethanol as solvent-based on our previous work (Worku et al. (2022). Ten grams of the raw Oxytenanthera abyssinica stem powder was utilized for six hours to eliminate waxes, resins, and other extractives. In the second step, aqueous sodium hydroxide treatment was performed to extract pectin, hemicellulose, and lignin as black liquor using vacuum filtration. The dewaxed Oxytenathera abyssinica sample was alkali-treated with 7%, 13%, and 20% NaOH at 23 (room temperature), 100, 110, and 120 °C for 1, 2, 3, and 24 h with a fiber-to-solvent ratio of 1:20. The collected black liquor was kept for the determination of yield of Oxytenanthera abyssinica soda lignin (OASL).
2.2 Determination of yield of soda lignin (OASL)
Lignin was isolated from the black liquor of alkali pretreatment samples by adding H2SO4 at a weight-to-weight ratio of 98% to the black liquor. Sulfuric acid solution (0.2 mol/L) was used to adjust the pH of the filtrate to 2 to 3 under vigorous agitation (700 rpm) in a magnetic stirrer for 15 min at room temperature (Kim et al., 2017). Then precipitation was seen to form, and the color changed from black to brown. The residual solid was rinsed with deionized water to pH 6–7, collected in Petri dishes, and dried at 60 °C for 12 h in the oven. OASL samples were calculated according to the formula given below in Eq. (1)
2.3 Preparation of four LNPS using nanoprecipitation methods
Four different nanoprecipitation approaches were used to prepare LNPs such as LNPAS, LNPAC, LNPDO, and LNPET using acid-base, acetone, dioxin, and ethanol solvents methods from optimized OASL samples, respectively (Fig. 1). Based on the methods developed by Sipponen et al. (2018), Farooq et al. (2018), Zhang et al. (2013) and Agustin et al. (2019). The yield can be calculated based on Eq. (2).
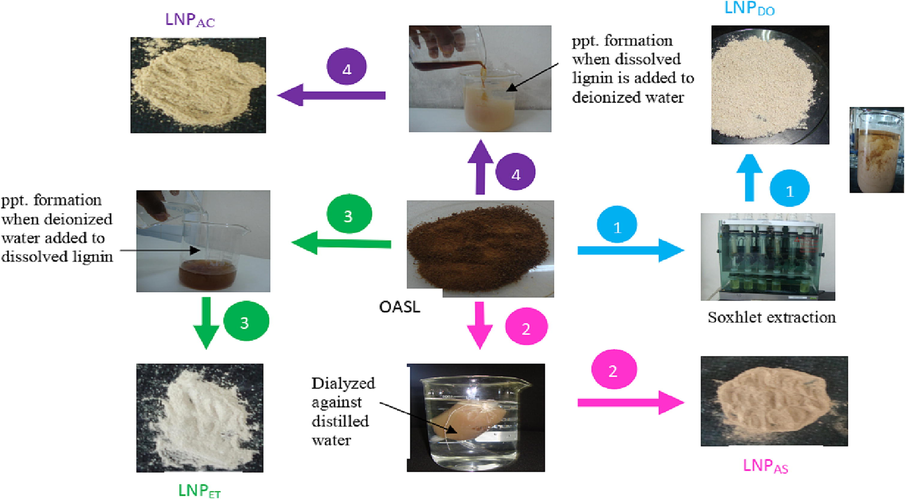
- The procedure that describes the preparation of LNPDO (1), LNPAS(2), LNPET (3) and LNPAC (4) from OASL.
2.4 Testing and characterization
We used the following characterization methods to test and characterize results such as Zeta sizers (Malvern Zeta Nano (ZE3600), dynamic light scattering, UV − vis spectroscopy, X-ray powder diffraction (SHIMADZU XRD-6000), TGA 55-TA instruments, and iS50 FTIRS spectrometer, Scanning electron microscope (high-vac. SED PC-std., 15 kV), Sonicators (Intelligent Ultrasonic Processor), Energy Dispersive X-Ray Analysis (EDX-7000/8100), 1H NMR (δ 4.15–3.85 (m)) and Differential Scanning Calorimetry were used for characterization.
2.5 Statistical analysis
The data reflect the mean of three repeated measurements plus standard deviations, and all measurements were made in triplicate (n = 3). P ≤ 0.05 were used to define significance. Origin 8 software program was used to analyze the data.
3 Result and discussion
3.1 Yields of soda lignin and LNPs
Based on the optimized result, at reaction conditions of 110 °C, 13% NaOH, and 3 h reaction time, the highest OASL (294.0 ± 1.9 mg g-1) yield was obtained. However, in the case of LNPS, the highest yield (88.9 ± 1.0%) was observed in LNPAS samples. When compared to the yield of LNPAS, the LNPET, LNPAC, and LNPDO samples have the lowest yields (28.5 ± 0.9, 40.0 ± 1.1, and 56.4 ± 2.3%, respectively) (Fig. 2a). This demonstrated that the yield of LNPS was influenced by the type and polarity of the solvent employed in the LNP synthesis, as mentioned by Melro et al. (2018). Even though, ethanol is the more polar solvent compared to acetone, LNPET recorded a low yield compared to LNPAC, LNPDO, and LNPAS; this might be due to the low solubility of OASL in ethanol /water, which caused aggregates to form during nanoprecipitation. The variation in the yield of LNP can also be affected by the difference in the molar mass of lignin; with the decrease in the molar mass, the solubility of lignin increases due to an increase in the content of phenolic hydroxyl (Melro et al., 2018), this might be another explanation for low yield of LNPET. The same outcome was found in the work of Figueiredo et al. (2021), who found that the acetone/water (3:1) method produced larger than the 70% ethanol approach. In the LNPAS sample, the highest yield was observed than the rest of the three samples; this is because OASL was relatively more soluble in a basic-acidic solution (NaOH-HCl), and the polar interactions between the solvent and the solute formed a higher yield of LNPAS; this is because ionic solvents are more polar than polar solvents, this property made OASL dissolve in a higher degree than ethanol, acetone or dioxin.
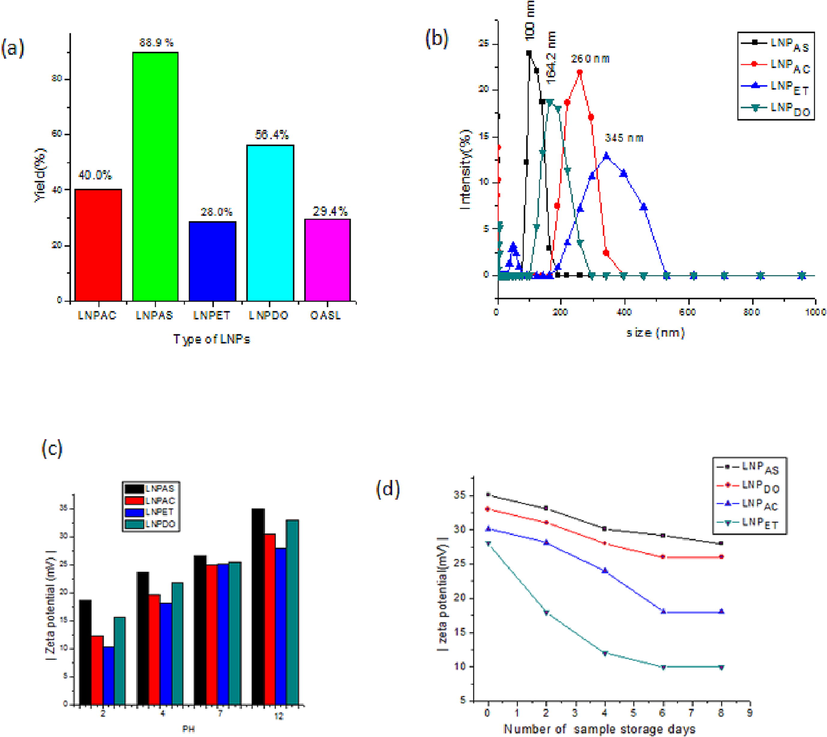
- (a) Yield (a), (b) DLS size distribution, (C) Zeta potential of LNPs at pH value and (d) various day of storage of LNPAS, LNPAC, LNPET and LNPDO samples.
3.2 Zeta-potential of LNPs
Fig. 2c depicts the average zeta potential of four isolated LNPs. At a pH of 12.00, the isolated LNPS had |-35.1 mV|, |–33.0 mV|, |-30.5 mV|, and |-28 mV| zeta potentials for LNPAS, LNPDO, LNPAC, and LNPET, sample respectively. The value of zeta potential decreased to |-18.7 mV|, |-15.6 mV|, |-10.3 mV| and |-12.3 mV| respectively, as the pH of a solution changed to 2.00 at room temperature (Fig. 2d). At low pH, the solution is assumed to contain a high proton concentration, resulting in protonation and a positive charge. However, the low proton concentration in the solution at high pH causes deprotonation of these hydrophilic sites, releasing negative charge and causing the charge to become negative (larger zeta potential) (Roggatz et al., 2016). LNPAS had the largest absolute value zeta potential |-35.1 mV| compared to the other LNP samples (Fig. 2c). This is because more negatively charged phenolic functional groups are available in smaller sizes of LNPs. As the surface area decreases, more phenolic groups are exposed to the solvent and make more changes. The absolute value zeta potential of four LNPs obtained in the current study was higher than that found by Matsakas et al. (2020). According to their finding, a zeta potential value in the range of |-14.0 mV| to |-31.6 mV| and |-11.5 mV| to |-31.4 mV| was obtained for the Birch and Spruce samples, respectively.
3.3 Suspension stability of LNPs
LNP applications require that they be stable in a variety of circumstances. The properties of the effects of some factors, such as ionic strength, pH value, and storage time, on the stability of LNPs, must be evaluated. The aqueous solution for LNP samples maintains their stability at various pH values over time. No sedimentation was initially visible in any LNP suspensions at the bottom of the test tube (Fig. 3a). Nevertheless, the sediments began to flocculate after 1 day of storage for OASL (Fig. 4b). After 4 days of storage, LNPET showed sedimentation (Fig. 3c); After 8 days of storage at room temperature, both LNPAC and LNPDO started sedimentation, but LNPAS did not show any sedimentation (Fig. 3d). This confirmed that LNPAS is more stable than the other three samples. The zeta potential differential between the samples causes this variation in stability. As the zeta potential rises, the repulsive force overcomes the attractive force, making the LNPs more stable. Low absolute zeta potential LNP dispersions tend to coagulate, resulting in poor physical stability (Liu et al., 2019).
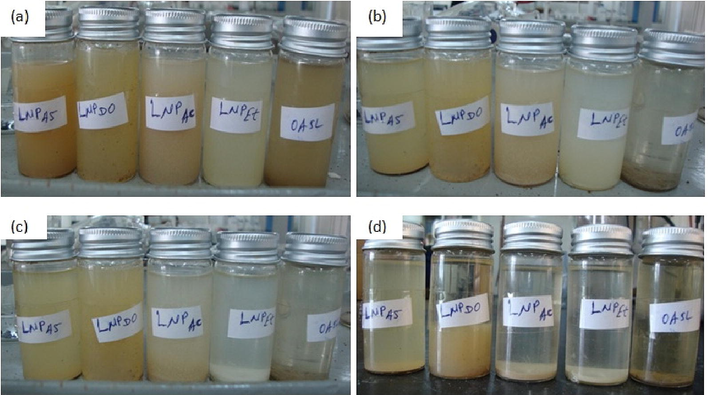
- Suspension stability of LNPAs, LNPDO, LNPAC, LNPET and OASL (a) at the beginning of days of storage after sonication, (b) after 1 days of storage, (c) after 4 days of storage and (d) after 8 days of storage time.
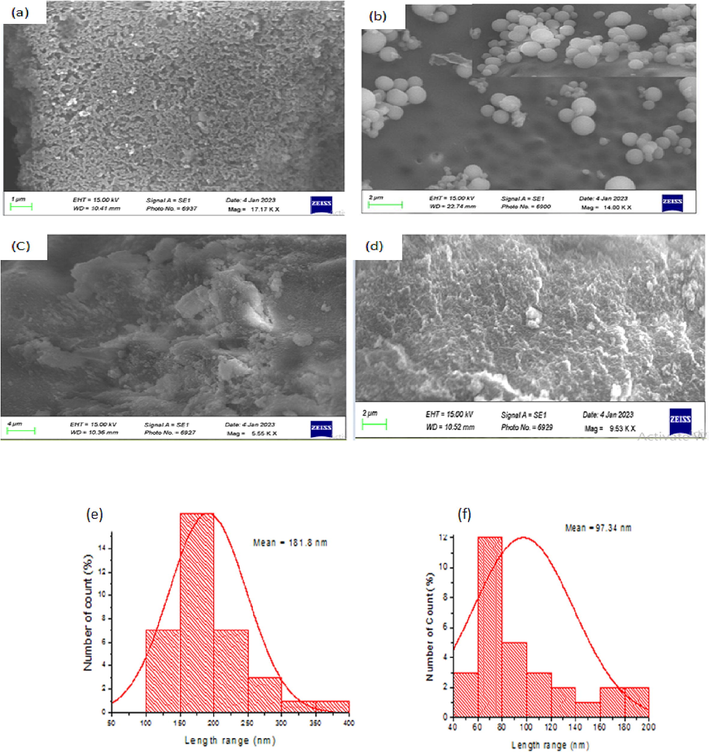
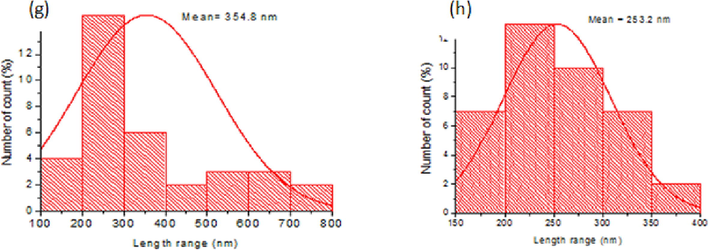
- SEM image of (a) LNPAS, (b), LNPAC, (c), LNPET and (d) LNPDO and size distribution of LNPAC (e), LNPAS (f), LNPET (g) and LNPDO (h).
- SEM image of (a) LNPAS, (b), LNPAC, (c), LNPET and (d) LNPDO and size distribution of LNPAC (e), LNPAS (f), LNPET (g) and LNPDO (h).
3.4 SEM characterization
Fig. 4a-d displays the image from the SEM analysis used to characterize the surface morphologies of the LNPAS, LNPAC, LNPDO, and LNPET samples. The SEM pictures revealed different morphological structures depending on how the LNPs were prepared. A bigger size is shown in LNPET (100 to 800 nm), and a smaller size range is found in the LNPAs (40 to 200 nm) sample (Fig. 4f-h). This size difference between samples occurred due to the difference in the type of solvent and type of lignin (molecular mass), as explained by mLee et al. (2009). The DLS data in Fig. 2b also supports these results. Fig. 5b depicts the forms of LNPAC, which had a spherical shape and mean size of 181.8 nm. However, irregular shapes of LNPAS, LNPDO, and LNPET were observed with mean sizes of 97.34, 253.2, and 354.8 nm, respectively. A self-assembly mechanism formed spherical shapes. Since the lignin molecule is amphiphilic, it contains both a hydrophobic benzene ring and hydrophilic phenolic hydroxyl groups; thus, the hydrophobic skeleton of lignin interacts with acetone, while the hydrophilic groups of lignin interact with water, due to these opposite forces spherical shaped LNPAc is formed as described by Mishra and Ekielski (2019). Non-covalent forces, including π-π- interactions, hydrophobic interactions, and hydrogen bonding, have been found to drive the self-assembly of LNPs to form a spherical shape, as explained in the work of Mishra and Ekielski (2019). However, in LNPAS samples, acidification protonates the charged groups on lignin, which results in precipitation from an alkaline lignin solution that leads to an irregular structure rather than a spherical shape.
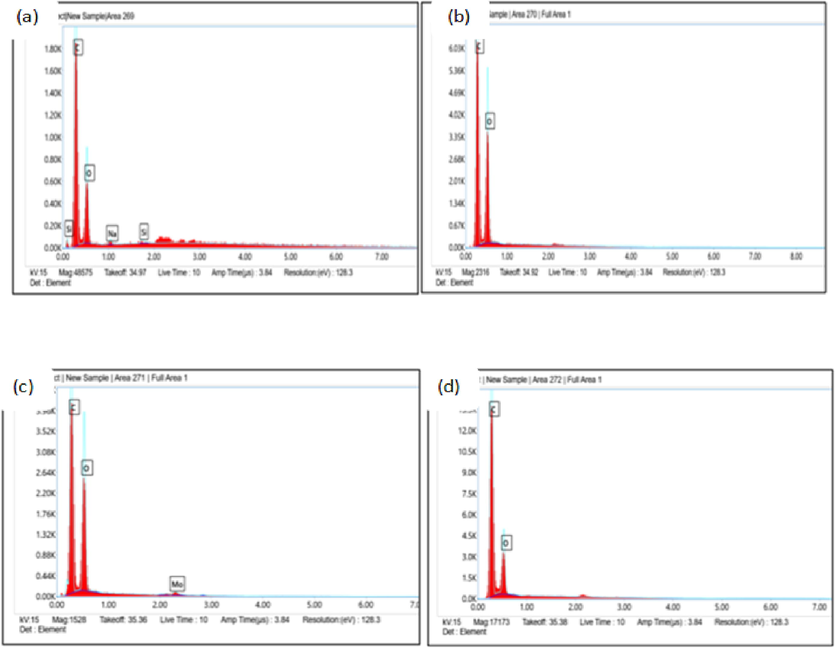
- EDX peaks for four LNPs: LNPAS (a), LNPAC (b), LNPET (c) and LNPDO (d).
Fig. 5 illustrates the precise information EDX data provided regarding the elements in the LNPDO, LNPAS, LNPAc, and LNPET samples. As observed in Fig. 5a, b, c, and d, the elemental carbon and a few oxygen peaks were visible in the EDX profile. LNPAC and LNPDO contain no other elements besides carbon and oxygen; however, LNPAS contains sodium and silicone peaks, indicating the presence of Si and sodium in addition to LNPs. In addition to carbon and oxygen, LNPET contains Mo. All data in Fig. 5 showed that the synthesized were free of sulfur. Thus, it benefits high-value-added industrial applications like bioplastics and biocomposites (Iravani and Varma, 2020).
3.5 1H NMR characterization
1H NMR investigation was carried out to check the presence of some important groups in LNPs. Fig. 6 displayed the 1H NMR spectrum from the LNPAS, LNPDO, and LNPAC investigations. Almost all peaks are similar in structure with little difference in intensity between the samples. This showed that they are different molecules but have similar structures. The signal at 8.00 to 9.34 ppm represents the presence of phenolic groups, and between 6.00 ppm and 8.01 ppm represents aromatic rings in LNPAS, LNPDO, and LNPAC samples. In addition to this methoxyl group (3.40 to 4.00 ppm) and the aliphatic group (0.00 to 2.25 and 4.05 to 6.00) are also present in all samples as described by Nagy et al. (2010). As observed in HNMR peaks, only a weak signal was received from aromatic protons and the phenolic groups, while the aliphatic region was more pronounced in LNPDO (Fig. 6c). However, the aromatic, aliphatic peaks and the phenolic groups are more significant in LNPAs (Fig. 6a); in LNPAC, the aromatic and aliphatic regions are present reasonably. However, the phenolic group exists in smaller amounts (Fig. 6b). The guaiacol units, which are relatively abundant in softwood lignin, are shown at 6.7 and 6.9 ppm peaks, as described by Nawawi et al. (2016). This peak was the highest in LNPAS but the smallest in LNPDO. According to Li and Lundquist (1994), the strong signals at 8.76 and 8.99 correspond to phenolic groups in the acylglycerols β-O-4 and phenylcoumaran β-O-4 structures, respectively. Smaller aliphatic proton was seen in the range (4.2 to 5.6 ppm) in LNPAS but not observed in LNPAC and LNPDO. The peaks between 0.8 and 2 ppm may indicate the aliphatic region associated with different methyl and methylene groups (C–CH2–C, –CH3) as described by Mahmood et al. (2013). These peaks are present in the prepared LNP samples (LNPAS, LNPAC, and LNPDO). Peaks at 2.5 ppm were assigned to the DMSO‑d6 solvent.
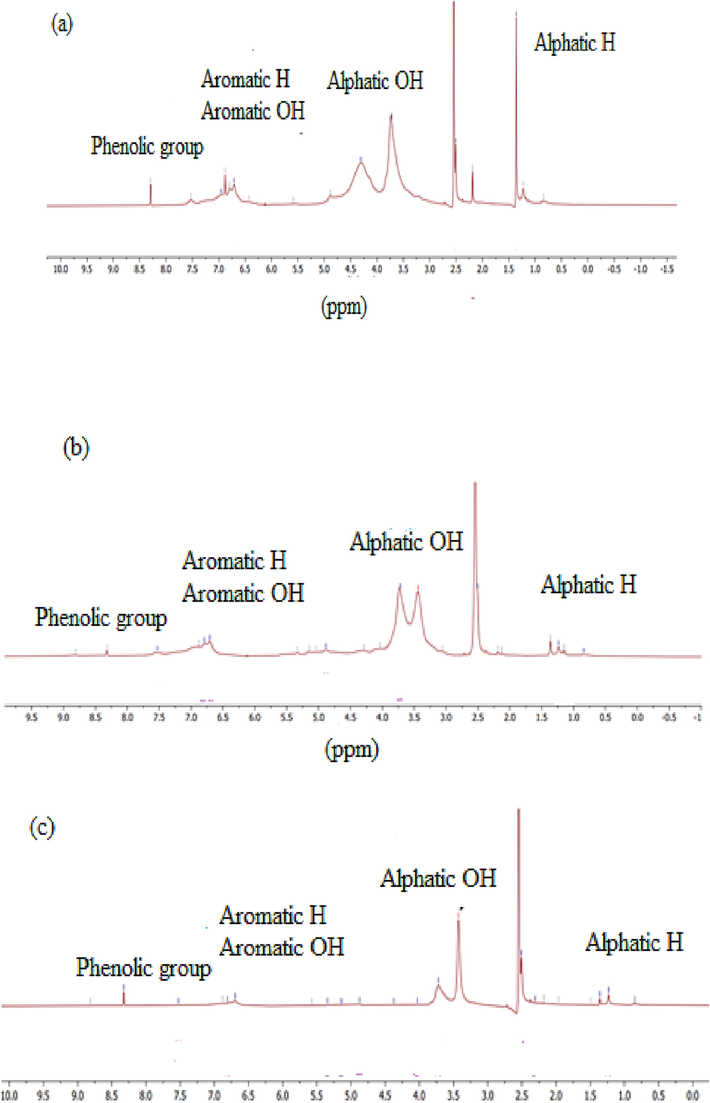
- 1H NMR peaks for LNPs such as LNPAS (a), LNPAC (b), and LNPDO (c).
3.6 UV–Vis spectrophotometry
The UV–Vis absorbance of four extracted from Oxytenanthera abyssinica was conducted using U.V.- a vis instrument at a wavelength range of 200 to 800 nm for checking the presence of LNPS. As seen in Fig. 7a, the highest absorption of all samples was observed at 280 nm, showing the presence of non-conjugated phenolic groups of aromatic rings in the structure of LNPs (Alzagameem et al., 2018). The maximum absorption detected at 281 nm in UV spectra of LNPAS, LNPAC, LNPDO, and LNPET corresponding to the electronic transition of π → π* in guaiacyl (G) units or the aromatic ring of unconjugated phenolic groups or free and etherified hydroxyl group (Li et al., 2010). The absorbance of at around 281 might be due to π-π interaction between OASL molecules during forming LNPs (Wang et al., 2010).
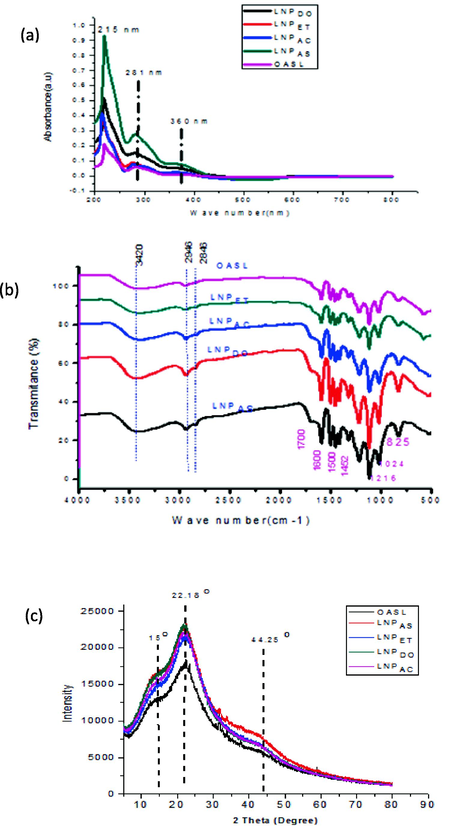
- UV–Vis absorbance peaks (a), FTIR (b) and XRD (c) of OASL, LNPAS, LNPET, LNPAC and LNPDO.
Fig. 7a shows that LNPAS had a higher absorbance than the other three samples. This may indicate the presence of guaiacyl (G) in higher amounts compared to LNPAC, LNPET, and LNPDO (Lin and Dence, 2012). The absorbance of OASL around 280 nm showed the smallest peak. This is because the sample contains some impurities. However, the peak shows some increments when it is converted to nanoparticles. Thus, the nanoparticle preparation increases or improves the purity of lignin. Due to an aromatic ring transition, there is a significant absorption in the 200–220 nm range in all LNP samples, as Bykov et al. (2020) described. Absorption at wavelength 215 nm indicates the presence of π → π* electronic transition in the aromatic ring in all samples. The absorption band above 300 nm indicates the presence of conjugated structure present with the aromatic moieties (Singh et al., 2012). The related hydroxycinnamic acids, such as p-coumaric acids and ferulic, are the cause of the samples' broad shoulder band at their maximum wavelength of about 360 nm, as mentioned by the work of Wang et al. (2010).
3.7 FT-IR spectroscopy
Fig. 7b shows the FT-IR spectra of lignins and LNPs derived from Oxytenanthera abyssinica. The spectrum clearly indicated the existence of different functional groups, including aromatic structure vibrations because of the guaiacyl group, carbonyl stretching due to unconjugated ketone, aromatic C–H in the plane and out-of-plane deformation, hydrogen bonded, and carboxyl group. The broadband that is present in all lignins at 3410–3460 cm-1 is caused by the hydroxyl groups in aliphatic and phenolic structures, and the bands that are centered around 2938 and 2842 cm-1 are primarily brought on by C–H stretching in aromatic methoxyl groups and methylene and methyl groups of side chains. However, the intensity of the band varies between samples. LNPAS showed a very intense band, and OASL showed shallow peaks in this region. The shallow peak of OASL is due to fewer hydroxide groups than the four. Studies showed they have more hydroxide groups than isolated ones because of the smaller surface area. Carbonyl stretching unconjugated ketones and carbonyl groups are responsible for a small peak at 1713 cm1. A high peak represents aromatic skeletal vibrations at 1426, 1508, and 1604 cm−1. The vibrations characteristic of the guaiacol unit (1269 cm1) are visible in the spectra of all samples, but OASL has low and higher intensity (Harahap et al., 2019). The bands (syringyl and guaiacyl) shown at 1134 and 1128 cm-1 are caused by ether stretching (Delgado et al., 2019). According to Ibrahim et al. (2011), guaiacyl (G) units in lignin stimulate the polymerization site.
3.8 XRD characterization
X-ray diffraction analysis is the most commonly used method for determining the degree of crystallinity in a polymer structure. This investigation examined LNPs like LNPAS, LNPAC, LNPET, LNPDO, and OASL using X-ray powder diffraction analysis to determine their morphology. The diffractograms for all five samples revealed a broad peak, indicating that the lignin was only partially crystalline in nature. They have poor crystallinity characteristics. Since lignin comprises a three-dimensional polymer network of phenylpropane molecules, which is not a regular and ordered supermolecular structure (de Haro et al., 2021), the crystallinity characteristics are expected to be lower. Thus, in our experimental result, four LNPs showed lower crystallinity properties than those obtained by cellulose and cellulose nanocrystals found in our previous work by Worku et al. (2022). Fig. 7c and Table 1 showed that the maximum 2θ values for LNPs were 22.08, 21.84, 22.12, 21.80, and 22.96 for LNPAS, LNPAC, LNPET, LNPDO, and OASL with CrI values of 30.51, 29.97, 29.64, 24.93 and 24.20%, respectively. There is no significant difference in the value of CrI between LNPAS, LNPDO, and LNPAC; this showed that the methods used to prepare the three nanoparticles did not significantly change the crystallinity of the sample. From the XRD, it was determined that the crystalline content increased from 24.20% in OASL to 30.51% LNPAS in the case of (Table 1). This increased crystallinity may be due to the preparation conditions of LNPs compared to OASL (Brandstetter et al., 2008). Fig. 7c shows intense peaks around 2θ of 23.37 correspond to LNPs, and a lower peak represents OASL samples. This showed conversion of lignin to LNPs can increase in crystallinity value. In comparison to the work of (Gupta et al., 2014), the current work has a larger CrI value for both lignin and LNPs. Table 1 displays the findings of the predicted mean size of the crystallinity size for OASL (0.31 nm), LNAAS (0.31 nm), LNPAC (0.35 nm), LNPDO (0.36 nm), and LNPET (0.33 nm) using Scherrer's equation. The number is too low to conclude that the sample has a significant degree of crystallinity.
| Sample | 2θ | FWHM (o) | Intensity | CrI (%) | Crystallite size (nm) |
|---|---|---|---|---|---|
| LNPAS | 22.08 | 27.18 | 22,906 | 30.51 | 0.31 nm |
| LNPAC | 21.84 | 23.84 | 22,728 | 29.97 | 0.35 nm |
| LNPDO | 21.80 | 23.84 | 22,179 | 29.64 | 0.36 nm |
| LNPET | 22.12 | 25.39 | 21,201 | 24.93 | 0.33 nm |
| OASL | 22.96 | 27.25 | 17,600 | 24.20 | 0.31 nm |
3.9 TGA characterization
This work examined the effect of altering the OALS and LNPs on its thermal degradation process at a 25 °C/min heating rate was examined using thermogravimetric analysis (TGA) and DTG analysis. Due to the varying thermal stabilities of the numerous oxygen functional groups in the structure, they thermally decompose over a wide temperature range (30 to 700C) (Fig. 8). As shown in Fig. 8a, the peaks at TGA and DTG indicate a three-stage lignin-based decomposition process. In the first stage of decomposition (120 to 250 °C), 5.3 % weight loss occurred almost in all LNP samples and 13.6 % for OASL samples. This is because of moisture and solvent evaporated in the sample. The large difference in the amount of weight lost between OASLs may be due to the size difference between samples. The reduced size of the cavity and voids in the sample, which has a high contribution to trapping moisture and a solvent molecule, made the weight loss smaller. In the second stage, the samples exhibit a wide range of heat degradation between 250 and 400 °C. This stage had the greatest thermal degradation of OASL and samples, as indicated in TGA and DTG curves (Fig. 8b). 35.4, 45.7, 47.9, and 42.9% mass loss were obtained for LNPAS, LNPAC, LNPET, and LNPDO samples. In this stage, hemicelluloses and cellulose are degraded, and some aryl ether bonds in lignin can be cleaved, as described by Worku et al. (2022). In the second stage, the estimated decomposition temperatures (Tg value) for LNPAS, LNPAC, LNPET, LNPDO, and OASL were 340, 310, 298, 324, and 450 °C; this is due to the smaller size of lignin will produce; hence low Tg values. In the last degradation step, from 450 to 700 °C, LNPAC and LNPDO show smaller decomposition temperatures (560 and 570C, respectively) than LNPET and LNPAS (600C). As observed in TGA and DTG peaks, LNPAs showed more stability in this stage than the other samples. The DTGmax of LNPAS, LNPAC, LNPDO and LNPET were observed at 397, 397, 359 and 354 °C. At the end of the TGA process (at 700 °C), the residual mass varied from 52.8% for LNPAS to 76.3% for LNPET. This might be because of the complicated lignin structures and the development of a highly condensed aromatic structure that can produce char (Brebu and Vasile, 2010).
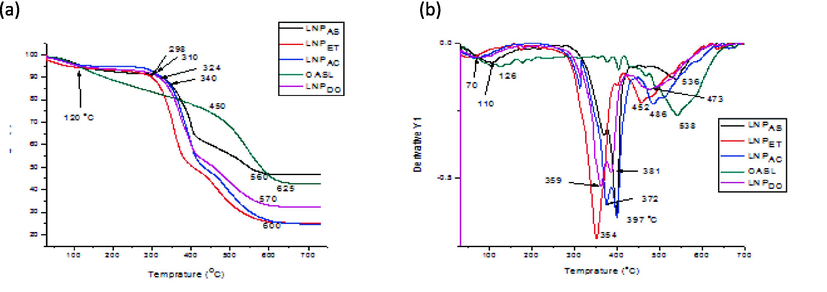
- TGA (a) and DTG (b) peaks for LNPAC, LNPET, LNPDO, OASL and LNPAS sample.
3.10 DSC characterization
Fig. 9 shows the DSC curve of LNP samples. The figure has an endothermic peak followed by a large exothermic peak. The first peaks, found below 100 °C, are associated with dehydration or the removal of water, and the second, above 100 °C, showed the decomposition of the OASL and LNPS formed. In the DSC thermogram peak, an exothermic heat flux indicates the decomposition of LNPs (Haykiri-Acma et al., 2010). In the current work, the DSC analysis revealed that exothermal behavior was observed with the major mass loss is occurred in the temperature region between 400 °C and 500 °C. The maximum decomposition temperature was attained at 435.2, 435, 434.2, and 498.4 °C for LNPAS, LNPAC, LNPET, and OASL. This result is considered with the work of Bernabe et al. (2013) and Sun et al. (2001). According to their result, high intensive peaks are present during the heating of lignin in temperatures between 400 and 500 °C. From DSC peaks in Fig. 9, LNPAS has a higher decomposition temperature (498.4 °C) value than the three LNP samples derived from the OASL.
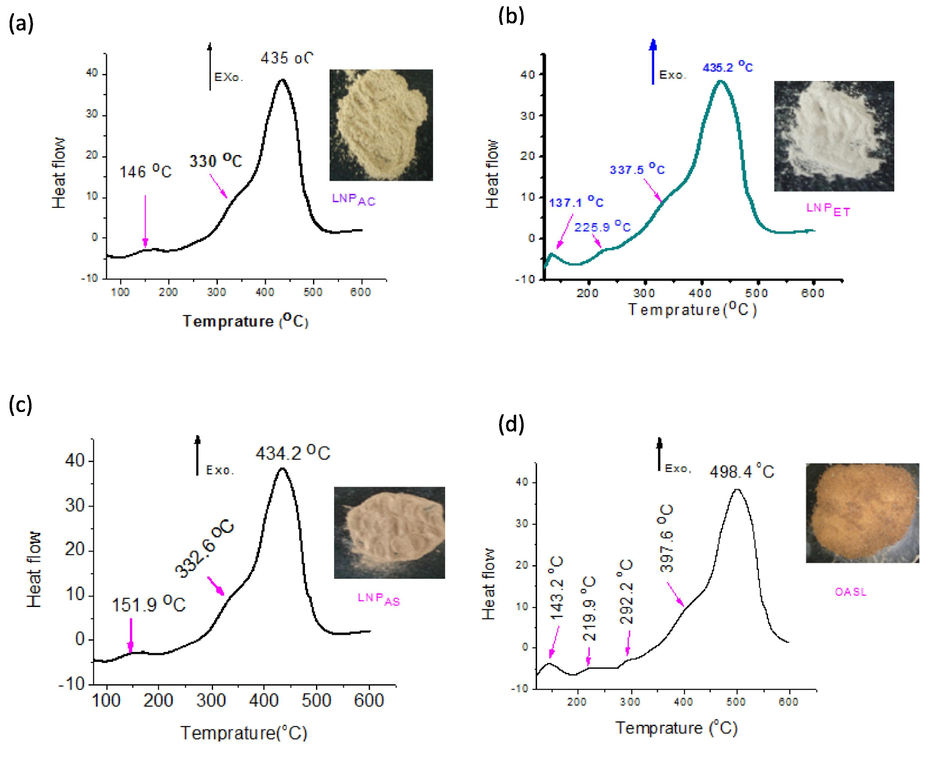
- DSC peaks for LNPAC (a), LNPET (b), LNPAS (c), and OASL (d).
4 Conclusions
In this research work, the nanoprecipitation approach was used to prepare LNPs using soda lignin derived from Oxytenathera abyssinica. A high yield of LNPs (88.9 %) was attained using the base-acid nanoprecipitation method in the LNPAS sample. The lowest yield of LNP (28.0 %) was obtained using ethanol as a solvent and water as an antisolvent in the LNPET sample. Based on SEM characterization, spherical-shaped were obtained in LNPAC (100 400 nm), and irregular shapes were formed in LNPAS (40–200 nm), LNPET (100 to 800 nm), and LNPDO (150–400 nm. A higher zeta potential value of |-35.1 mV| was obtained in LNPAS samples. The value of zeta potential decrease as days of storage and the pH value increase. H-NMR and FITR also confirmed the presence of important functional groups such as the carboxyl group, hydrogen bond, phenolic, aromatic, and aliphatic groups. TGA and DTG showed that more stabilitye is formed than the OASL samples. The synthesis of LNPS were carried out by green solvents such as ethanol, acetones and acid-base solutions and the resulted LNPs is free from pollutants such as sulfur. These showed that they can be used as a potential nanocomposite application such as biofilms, food packaging materials, UV shielding, drug delivery, etc. LNPAS may have more nanocomposite potential than the other because of high thermal and chemical stabilities as well as contain only carbon and oxygen elements.
Acknowledgments
The authors extend their appreciation to Researchers Supporting Project number (RSP2023R165), King Saud University, Riyadh, Saudi Arabia. The Authors thank Addis Ababa Science and Technology University (AASTU).
Declaration of Competing Interest
The authors declare that they have no known competing financial interests or personal relationships that could have appeared to influence the work reported in this paper.
References
- Rapid and direct preparation of lignin nanoparticles from alkaline pulping liquor by mild ultrasonication. ACS Sustain. Chem. Eng.. 2019;7:19925-19934.
- [Google Scholar]
- Lignocellulosic biomass as source for lignin-based environmentally benign antioxidants. Molecules. 2018;23:2664.
- [Google Scholar]
- Thermal behavior of lignin and cellulose from the waste composting process. J. Therm. Anal. Calorim.. 2013;111:589+.
- [Google Scholar]
- Williamson-Hall anisotropy in nanocrystalline metals: X-ray diffraction experiments and atomistic simulations. Acta Materialia. 2008;56:165-176.
- [Google Scholar]
- 228-nm quadrupled quasi-three-level Nd: GdVO4 laser for ultraviolet resonance Raman spectroscopy of explosives and biological molecules. J. Raman Spectrosc. 2020;51:2478-2488.
- [Google Scholar]
- LNPs: Eco-friendly and versatile tool for a new era. Bioresour Technol 2018
- [CrossRef] [Google Scholar]
- Lignin-based polymer electrolyte membranes for sustainable aqueous dye-sensitized solar cells. ACS Sustain. Chem. Eng.. 2021;9:8550-8560.
- [Google Scholar]
- Valorization of Kraft Lignin of Different Molecular Weights as Surfactant Agent for the Oil Industry. Waste Biomass Valorization. 2019;10:3383-3395.
- [Google Scholar]
- Strong, ductile, and waterproof cellulose nanofibril composite films with colloidal lignin particles. Biomacromolecules. 2018;20:693-704.
- [Google Scholar]
- In vitro evaluation of biodegradable lignin-based nanoparticles for drug delivery and enhanced antiproliferation effect in cancer cells. Biomaterials. 2017;121:97-108.
- [Google Scholar]
- Properties and chemical modifications of lignin: Towards lignin-based nanomaterials for biomedical applications. Prog. Mater. Sci.. 2018;93:233-269.
- [Google Scholar]
- Green fabrication approaches of LNPs from different technical lignins: A comparison study. Prog. Mater. Sci.. 2021;14:4718-4730.
- [Google Scholar]
- Lignin for polymer and nanoparticle production: Current status and challenges. Can. J. Chem. Eng.. 2019;97:2827-2842.
- [Google Scholar]
- Synthesis, Characterization, and Application of LNPs. Mater. Focus. 2014;3:444-454.
- [Google Scholar]
- Wet-spinning of cellulose acetate reinforced with acetylated nano-crystalline cellulose as carbon fiber precursors. In: IOP Conference Series: Materials Science and Engineering. IOP Publishing; 2019. p. :012038.
- [Google Scholar]
- Comparison of the thermal reactivities of isolated lignin and holocellulose during pyrolysis. Fuel Process Technol.. 2010;91:759-764.
- [Google Scholar]
- Chemical and thermal properties of lignins from oil palm biomass as a substitute for phenol in a phenol formaldehyde resin production. Carbohydr. Polym. 2011;86:112-119.
- [Google Scholar]
- Extraction and characterization of lignin from black liquor and preparation of biomass-based activated carbon there-from. Carbon letters. 2017;22:81-88.
- [Google Scholar]
- Characterization of extracted lignin of bamboo (Neosinocalamus affinis) pretreated with sodium hydroxide/urea solution at low temperature. BioResources. 2010;5:1762-1778.
- [Google Scholar]
- A new method for the analysis of phenolic groups in lignins by ʹH NMR spectrometry. Nord. Pulp Pap. Res. J.. 1994;9:191-195.
- [Google Scholar]
- Methods in lignin chemistry. Springer Science & Business Media; 2012.
- Defining lignin nanoparticle properties through tailored lignin reactivity by sequential organosolv fragmentation approach (SOFA) Green. Chem.. 2019;21:245-260.
- [Google Scholar]
- Lignin nanoparticles: The next green nanoreinforcer with wide opportunity. Environ. Nanotechnol. Monit. Manag.. 2021;15:100398
- [Google Scholar]
- Production of polyols via direct hydrolysis of kraft lignin: Effect of process parameters. Bioresour. Technol.. 2013;139:13-20.
- [Google Scholar]
- Preparation of low carbon impact LNPs with controllable size by using different strategies for particle recovery. Ind. Crops Prod.. 2020;147:112243
- [Google Scholar]
- The self-assembly of lignin and its application in nanoparticle synthesis: A short review. Nanomaterials. 2019;9:243.
- [Google Scholar]
- Characterization of CO 2 precipitated Kraft lignin to promote its utilization. Green. Chem.. 2010;12:31-34.
- [Google Scholar]
- Characteristics of guaiacyl-syringyl lignin in reaction wood in the gymnosperm Gnetum gnemon L. Holzforschung. 2016;70:593-602.
- [Google Scholar]
- Ocean acidification affects marine chemical communication by changing the structure and function of peptide signalling molecules. Glob. Chang. Biol.. 2016;22:3914-3926.
- [Google Scholar]
- Nanoprecipitation and nanoformulation of polymers: from history to powerful possibilities beyond poly (lactic acid) Soft Matter. 2011;7:1581-1588.
- [Google Scholar]
- Sal (Shorea Robusta) leaves lignin epoxidation and its use in epoxy-based coatings. Am. J. Polym. Sci.. 2012;2:14-18.
- [Google Scholar]
- Understanding lignin aggregation processes. A case study: budesonide entrapment and stimuli controlled release from lignin nanoparticles. ACS Sustain. Chem. Eng.. 2018;6:9342-9351.
- [Google Scholar]
- Physico-chemical and thermal characterization of lignins from Caligonum monogoliacum and Tamarix spp. Polym. Degrad. Stab.. 2001;72:229-238.
- [Google Scholar]
- Tang, Q., Qian, Y., Yang, D., Qiu, X., Qin, Y., Zhou, M.J.P., 2020. Lignin-Based Nanoparticles: A Review on Their Preparations and Applications. 12, 2471.
- Strategies for the Conversion of Lignin to High-Value Polymeric Materials: Review and Perspective. Chem. Rev.. 2016;116:2275-2306.
- [Google Scholar]
- Molecular characteristics of kraft-AQ pulping lignin fractionated by sequential organic solvent extraction. Int. J. Mol. Sci.. 2010;11:2988-3001.
- [Google Scholar]
- Agricultural Residues as Raw Materials for Pulp and Paper Production: Overview and Applications on Membrane Fabrication. Membranes. 2023;13:228.
- [Google Scholar]
- Worku, L.A., Bachheti, R.K. and Tadesse, M.G., 2022. Isolation and characterization of natural cellulose from Oxytenanthera abyssinica (Lowland Ethiopian Bamboo) using alkali peroxide bleaching stages followed by aqueous chlorite in buffer solution. Int. J. Polym. Sci. 2022.
- Extraction, purification, and characterization of lignin fractions from sugarcane bagasse. BioResources. 2013;8:1604-1614.
- [Google Scholar]


