

Translate this page into:
Drinking water as a substantial source of toxic alkali, alkaline and heavy metals: Toxicity and their implications on human health
⁎Corresponding author. m.azzam@psau.edu.sa (Maged A. Azzam)
-
Received: ,
Accepted: ,
This article was originally published by Elsevier and was migrated to Scientific Scholar after the change of Publisher.
Peer review under responsibility of King Saud University.
Abstract
Abstract
Objectives
The objective of the current study was to optimize a highly sensitive method utilizing microwave digestion and iCAP quadrupole inductively coupled plasma mass spectrometry (Q ICP-MS) for the determination of toxic alkali, alkaline and heavy metals in drinking water, and their implications on human health.
Methods
A highly sensitive method based on microwave digestion and iCAP Q ICP-MS have been applied for the determination of potential metals alkali (23Na), alkaline (24 Mg) and heavy metals (75As, 208Pb, 111Cd, 59Co, 66Zn and 63Cu) in drinking water of diverse brand and origin.
Results
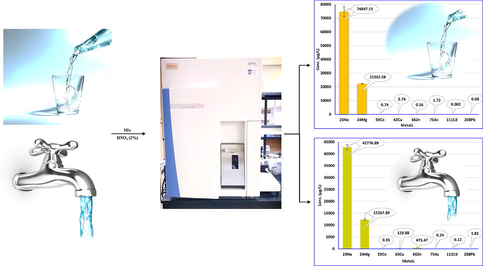
The system has provided excellent quality conditions, such as detection limit (DL, 0.007–0.296 µg/L), quantification limit (QL, 0.023–0.893 µg/L) and coefficient of determination (R2, 0.976–0.998) with recovery >99.95%. Amounts of metals in bottled drinking water (BDW) were ranged from not detected to 74847.15 µg/L, whereas, tap water (TW) constitutes 1.12 to 42776.89 µg/L. Average daily dose (ADD, 0.03–516.715 μg/kg/day), hazard quotient (HQ, 0.001–0.08 μg/kg/day) based on heavy metals oral reference dose, and cancer risk (CR, 0.45–244.67 μg/kg/day) based on heavy metals cancer slope factor were achieved for BDW. Nevertheless, ADD (0.03–1028.19 μg/kg/day), HQ (0.01–0.12 μg/kg/day) and CR (0.42–292.80 μg/kg/day) were obtained for TW. As a result, BDW produced lower toxicity values than TW (high risk). Additionally, BDW was found to be brand specific, particularly for international brands that contained zero or very low levels of metals.
Conclusions
Current investigations have explored the possible impacts of progressively increasing consumption of drinking water, especially in Saudi Arabia. Up to the present time, the levels of potential heavy metal in such water pose predominantly higher toxicity values in TW. Besides, BDW was found to be the brand specific particularly the international brand which contained either zero or low level of metals. As a result, the results highlight the need for strict policies to address the threat of metals in public water.
Keywords
Metals
iCAPQ ICP-MS
Drinking water
Toxicity
Cancer

1 Introduction
Water is the key element of Earth's hydrosphere and the fluids of entirely recognized living creatures (Westall and Brack, 2018). Earth's surface retains nearly 70% of the water, typically in the oceans and seas. A little amounts of water arise as groundwater (1.7%) in the ice caps and glaciers, and 0.001% in the air as vapor and clouds (Berner and Berner, 2012; Molden, 2013). Groundwater is a significant source of freshwater and widely demand for industrial, agricultural and domestic applications (Nawaz et al., 2022; Zektser and Everett, 2000). Nevertheless, the amounts of freshwater for such usage is available at very low amounts (0.01%). Suitable water for human intake is termed as drinking or potable water, and >660 million human population do not have access to safe drinking water (https://www.who.int/news-room/fact-sheets/detail/drinking-water). Conferring to the most recent data from the edition of Beverage Marketing’s The Global Bottled Water Market, the consumption of bottled water is assessed to have put up at 108 billion gallons globally in the year 2020. In the Middle East states, the Saudi Arabia has been placed at the top 20 in per capita bottled water consumption. (https://bottledwater.org/wp-content/uploads/2021/07/2020BWstats_BMC_pub2021BWR.pdf). So, the quality evaluation for drinking water is vital prior to their consumption (Wazeera et al., 2021). The analysis of water contaminants is still an important issue because diverse inorganic elements is a thoughtful menace for the inhabitants worldwide comprising Saudi Arabia.
Numerous published papers have revealed the information relating to the presence of potential inorganic contaminants for instance As, Cd, Pb, Mn, Cu Fe, Cr and Zn in water (Ali et al., 2022; Sharma, 2014; Syeda and Yap, 2022; Zakir et al., 2020). The consumption of metals and other related lethal compounds at higher levels may produce adversative individual’s health influences for instance neurological disorder (Woimant and Trocello, 2014), lung (Naddafi et al., 2022) and renal (Melila et al., 2022), gastrointestinal (Munir et al., 2022), hypertension (Ayuso-Álvarez et al., 2022) and cancer (Kiani et al., 2021; Van Gerwen et al., 2022) illnesses. The highest human health threat evaluations have been associated to metals in water, food, toys, paints, cosmetics and soil (Ahmed et al., 2021; Ali et al., 2022; Alqadami et al., 2017; Kazemi et al., 2022; Khan et al., 2021; Onakpa et al., 2018; Sharma, 2014; Syeda and Yap, 2022; Zakir et al., 2020). As a benefits, some heavy metals at low levels are also important for human diet and their health (Marini et al., 2021; Mehri, 2020; Organization, 1996; Yaqoob et al., 2020; Zhang et al., 2021). Based on experimental and epidemiological investigations presenting a link between heavy metals exposure and cancer occurrence in animals and human beings. The epidemiological research of the influence of metals on humans has revealed an association between its exposure and existence of cancer (Fasinu and Orisakwe, 2013; Lee et al., 2022). Recently, the Environmental Protection Agency (EPA) and the International Agency for Research on Cancer (IARC) have listed some of the heavy metals as probable human carcinogens (Başaran, 2022). The EPA’s National Primary Drinking Water Regulations has lawfully regulated the amounts of heavy metal contaminants in drinking water, and recommended their maximum contaminant level (MCL) and action level (AL) in drinking water (Agency, 2017). For certain inorganic chemicals, the recommended MCL should be 0.010 mg/L (As), 0.005 mg/L (Cd), 2 mg/L (barium), 0.004 mg/L (beryllium), 0.1 (chromium total) and 0.002 mg/L (mercury), and for Cu and Pb, the AL should be 1.3 mg/L, and 0.015 mg/L, respectively (Agency, 2017).
Every day, drinking water with hazardous elements, particularly heavy metals, enters the marketplace due to the growing population, and there is a lower awareness of risks among the maximum population (Azam et al., 2021). On the whole, the exposure of heavy metal creates risk to the human beings particularly children which are supposed to be at larger threat (Azam et al., 2022a; Azam et al., 2022b; Ji et al., 2022; Khan et al., 2021; Liu et al., 2021; Rowan et al., 2022). Studies have revealed that the over-all population (nearly 50%) will be existing in water overstretch provinces, predominantly under developing nations by the year 2025 (Organization, 2013). So as to diminish the negating health impacts produced by means of heavy metals occurs in drinking water, the heavy metals surveil is of greatly prominence for accurate human health risk assessment. In this study, we have applied a highly sensitive method based on microwave digestion and iCAP Q ICP-MS for the determination of alkali (23Na), alkaline (24 Mg) and heavy metals (75As, 208Pb, 111Cd, 59Co, 66Zn and 63Cu) in drinking water of diverse trademark and source.
The results of our study highlight on the requirements for the strict strategies addressing the potential threat of alkali, alkaline and heavy metals in water intended for the public usage. In addition, our research could compromise some awareness into the occurrence of heavy metal in drinking water and are treasured for publics/industrialists in planning defensive actions and health specialists in reducing heavy metal adulteration of drinking water.
2 Materials and methods
2.1 Materials
Digestion reagent nitric acid (HNO3, 65%) was obtained from Loba Chemie, Mumbai, India. For sampling purposes, water was purified by a purification Milli-Q water (free from metals) system, obtained from Millipore (Bedford, USA). For sampling quality assurance purposes, all materials including glassware were immersed in 10% HNO3 for 12 h followed by cleaning a number of times using Milli-Q water. Subsequently, the glassware was dried using high-performance oven from heldon Manufacturing, Inc. (Cornelius, USA). 50 mL centrifuge tubes were purchased from Thermo Scientific (Rochester, USA).
Standards and calibration solutions were prepared after successive dilutions from ICP/MS certified reference material (10 µg/mL). Stock solutions mixture of the studied elements alkali (23Na), alkaline (24 Mg) and heavy metals (75As, 208Pb, 111Cd, 59Co, 66Zn and 63Cu) were purchased from Ultra scientific (Rhode Island, USA). Calibration solutions was prepared ranged from 5 to 1000 µg/L. Samples were analyzed in triplicates (n = 3).
2.2 Sample collection
Nineteen samples of national-type bottled water and five samples of international-type bottled water were obtained from local supermarkets (Riyadh, Saudi Arabia). Water of national type was sourced from wells and water of international type was sourced from springs (valley bottom or side of a hill). An ozonation method was used to treat the water. Desalinated TW was obtained from four locations in the Kingdom, supplied by desalinization plants (Saline Water Conversion Corporation, Saudi Arabia). Polytetrafluoroethylene (PTFE) syringe filter (0.20 μm) was used to filter the samples prior to analysis (Macherey-Nagel, Dueren, Germany). Despite the lack of contamination in BDW, no digestion was performed before analyzing the samples. However, TW contains high amounts of salt in water samples. Thus, TW samples were digested before analysis. In order to avoid any bad disorders of the samples under investigation, samples and calibration solutions were prepared freshly.
2.3 Sample analysis
Sample digestion of desalinated TW were carried out using microwave digestion system. Water samples were measured to 1 mL in 50 mL centrifuge tubes. After that, the sample was transferred into the microwave digestion pressure vessels comprising a coupling cap of polytetrafluorethylene and aluminum rupture disc of model TOPwave, PM 60 from Analytik Jena (Munich, Germany). The microwave digestion pressure vessels were specified as maximum volume (60 mL) pressure (60 bar), temperature (210 °C) with constant operation and lowest fill acid volume higher than 7 mL. HNO3 (65%, 7 mL) was used as digesting reagent, added to the digestion pressure vessel containing the water sample. So as to predigestion of sample, it was left for 2 min at working room temperature. Subsequently, sample was transferred in microwave digestion system (TOPwave, Analytik Jena, Munich, Germany) for pressure digestion. Once the sample digestion completed, it was permitted to steadied and moved to a centrifuge tube (50 mL). Finally, the samples were examined by means of highly sensitive iCAPQ ICP-MS technique, the system is also recognized to be an tremendous technique for multi-elemental analysis in extremely unclean samples (Nelms, 2012; Wills and Kutscher, 2016). As the water heavy metals certified materials are not accessible, the correctness of the procedure was analyzed using addition and recovery estimations. Prior to the sample digestion and iCAPQ ICP-MS analysis, the correctness estimations of the method were performed. A known quantities of alkali, alkaline and heavy metals have been used to fortify the samples individually. Obtained data was compared with fortified and obtained amounts. Blank was analyzed after each samples. The total analysis time was 30 s per samples.
The alkali (23Na), alkaline (24 Mg) and heavy metals (75As, 208Pb, 111Cd, 59Co, 66Zn and 63Cu) quantification was performed by external individual calibration curves, obtained from standard solution mixtures consist of the 75As, 208Pb, 111Cd, 59Co, 66Zn, 63Cu, 24 Mg and 23Na. The studied metals DL and QL based on signal-to-noise (3:1) and (10:1), respectively were assessed by means of the deviation (three-fold) from three replicates (n = 3). Recovery rates were attained by fortifying each water samples with a known amounts of studied elements, estimated as the ratio of variance of analyzed elements concentrations between the fortified and non-fortified water samples to the fortified elements amounts. Two-way analysis of variance (ANOVA) was executed for the statistical sample analysis.
2.4 Metals risk estimation
2.4.1 Metals average daily dose assessment
Metals (75As, 208Pb, 111Cd, 59Co, 66Zn, 63Cu, 24 Mg and 23Na) average daily dose (ADD) for BDW and TW were assessed by means of Equation (1) (Khalid et al., 2020):
Where, C is the metal concentration (mg/L) in BDW and TW samples; IR is the water consumption rate (2 L/day/24 h); EF is the exposure frequency of BDW and TW (365 days/year); ED is the duration of exposure frequency (70 years); BW is the body weight of native people (70 kg); and AT is the average life expectancy (70 years) (Forum, 2005).
2.4.2 Metals hazard quotient assessment
Metals (75As, 208Pb, 111Cd, 59Co, 66Zn, 63Cu, 24 Mg and 23Na) hazard quotient (HQ) for BDW and TW was evaluated by Equation (2) (Khalid et al., 2020):
Where, ADD is the average daily dose; RfD is the metals oral reference dose, values are demonstrated in Table 1. In regard to metal amounts, the water with HQ level lower than 1 is presumed to be nontoxic to the usage for drinking. ADD, average daily dose; HQ, hazard quotient; CR, cancer risk; RfD, reference dose; CSF, cancer slope factor; -a, not described by regulating agencies; -b, not calculated.
Metals
RfD (μg/kg/day)
CSF
(μg/kg/day)Factors
Bottled drinking water (μg/kg/day)
Tap water
(μg/kg/day)
75As
0.40
-a
ADD
0.03 ± 0.001
0.04 ± 0.002
HQ
0.08 ± 0.003
0.10 ± 0.003
CR
-b
-b
208Pb
4.0
8.5
ADD
0.05 ± 0.002
0.05 ± 0.002
HQ
0.01 ± 0.001
0.01 ± 0.001
CR
0.45 ± 0.006
0.42 ± 0.006
111Cd
0.50
6100
ADD
0.04 ± 0.002
0.03 ± 0.002
HQ
0.08 ± 0.003
0.07 ± 0.003
CR
244.67 ± 3.83
207.40 ± 3.34
59Co
-a
-a
ADD
0.04 ± 0.002
0.04 ± 0.002
HQ
-b
-b
CR
-b
-b
66Zn
300
-a
ADD
0.06 ± 0.003
12.79 ± 1.20
HQ
0.0002 ± 0.0001
0.04 ± 0.002
CR
-b
-b
63Cu
40
-a
ADD
0.03 ± 0.001
3.46 ± 0.40
HQ
0.001 ± 0.0001
0.09 ± 0.004
CR
-b
-b
24 Mg
-a
-a
ADD
180.55 ± 2.85
234.10 ± 3.56
HQ
-b
-b
CR
-b
-b
23Na
-a
-a
ADD
516.72 ± 5.39
1028.19 ± 9.88
HQ
-b
-b
CR
-b
-b
2.4.3 Metals cancer risk assessment
Metals (75As, 208Pb, 111Cd, 59Co, 66Zn, 63Cu, 24 Mg and 23Na) cancer risk (CR) was assessed by Equation (3) (Khalid et al., 2020):
Where, ADD is the average daily dose; CSF is the metals cancer slope factor, values are presented in Table 1.
2.5 iCAP quadrupole inductively coupled plasma mass spectrometry (ICP-MS)
A consistent workflow for precise and fast identification of potential pollutants for instance 23Na, 24 Mg, 59Co, 63Cu, 66Zn, 75As, 111Cd and 208Pb pollution is highly required. The iCAPQ inductively coupled plasma mass spectrometry (ICP-MS) system termed as iCAP Q ICP-MS (Thermo Scientific™, Bremen, Germany) is known to be besting in low level identification and quantification of elements particularly heavy metals.
23Na, 24 Mg, 59Co, 63Cu, 66Zn, 75As, 111Cd and 208Pb pollutants in drinking water were determined by iCAP Q ICP-MS system. Intensity corresponds to the mass of the studied elements obtained by iCAP Q ICP-MS system has been displayed in the Fig. 1. iCAP Q ICP-MS technique includes the peristaltic pump, nebulizer (glass concentric form), torch (concentric quartz tubes) with the injector, lens tune (auto), peltier-cooled spray chamber, detector (dual mode secondary electron multiplier), interface, QCell, mass analyzer and a collision cell with cutting-edge flatapole tools that offers a low mass cutoff and reduces internal interference. The instrumental (iCAP Q ICP-MS) operational parameters were: interface temperature (37.4 °C), cool gas flow (13.921 L/min), spray chamber temperature (-20 °C), forward power (1545.9 W), auxiliary gas flow (0.7954 L/min), nebulizer gas flow (0.9724 L/min). The standard operation mode of iCAP Q ICP-MS was applied. The working parameters of the iCAP Q ICP-MS system has been presented in Table 2. The iCAP Q ICP-MS was operated by means of software Qtegra™ Intelligent Scientific data solution (Thermo Scientific™, Bremen, Germany). id, internal diameter: Std, standard; s, second.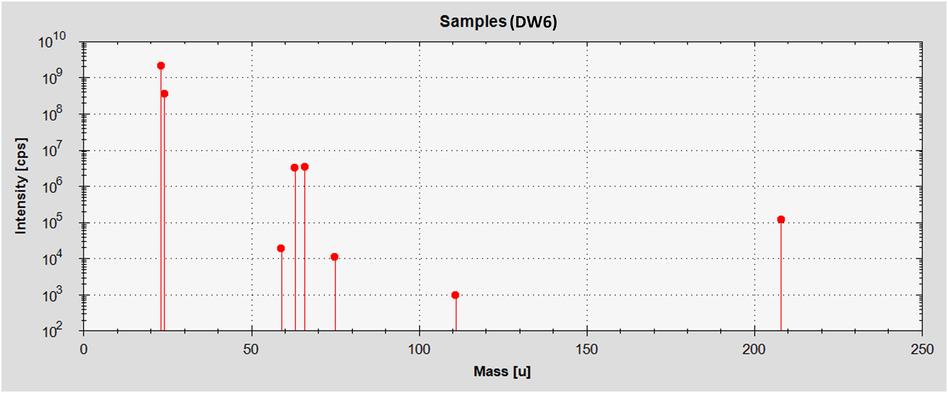
Intensity corresponds to the mass of the studied elements obtained by iCAP Q ICP-MS system.
Parameters
Value
Interface temperature
37.4 °C
Cool gas flow
13.921 L/min
Nebulizer gas flow
0.9724 L/min
Cooling water flow
3.46 L/min
Auxiliary gas flow
0.7954 L/min
Forward power
1545.9 W
Penning pressure
2.943E-7 mbar
Pirani pressure
1.581E + 0 mbar
Peristaltic pump rate
40 rpm
Spray chamber temperature
−20 °C
Injector
2.5 mm id (Quartz)
Star-end mass
4.60–245 u
Sample tubing
0.508 mm id, Std
Drain tubing
1.29 mm id, Std
Sample uptake
40 s
Number of replicates
3
Wash time
30 s
Dwell time
0.01 s
3 Results and discussion
3.1 Analytical results
iCAP Q ICP-MS have been applied for the determination of potential metals alkali (23Na), alkaline (24 Mg) and heavy metals (75As, 208Pb, 111Cd, 59Co, 66Zn and 63Cu) in drinking water of diverse brand and source of origins. The optimized iCAP Q ICP-MS analytical system was put through to the authentication by determining the system linearity, DL, QL, accuracy and precision. The analytical calibration curves of the studied elements have presented the good linearity contained by the working range between 5 µg/L and 1000 µg/L, with R2 values ranged from 0.976 to 998, depending of the types of the elements. As an example, the calibration curves of few elements (24 Mg, 63Cu and 208Pb) have been presented in Fig. 2. The system was found to be very linear from low concentration (5 µg/L) to high concentration (1000 µg/L). The estimated DL (signal-to-noise ratio 3:1) and QL (signal-to-noise ratio 10:1) calculation were established on the standard deviation (SD) of the response (Sy) of the calibration curve and the slope (S) at levels resembling the DL conferring to the formulae: DL = 3.3 (Sy/S) and QL = 10 (Sy/S), respectively. The DL, (0.007–0.296 µg/L) and (QL, 0.023–0.893 µg/L) were identified, with recovery values > 99.95%.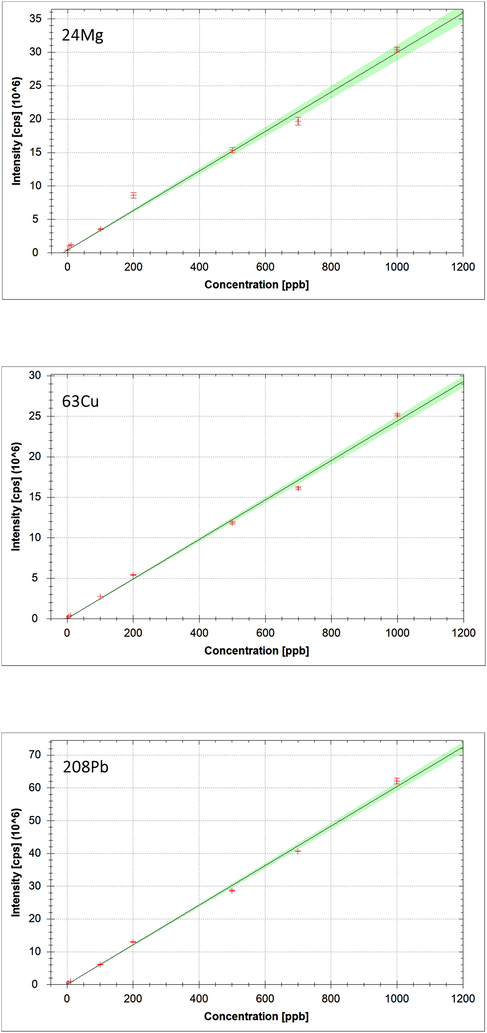
Calibration curves of few elements (24 Mg, 63Cu and 208Pb) obtained using iCAP Q ICP-MS system.
3.2 Metals and toxicity levels in water samples
The amounts of 75As, 208Pb, 111Cd, 59Co, 66Zn, 63Cu, 24 Mg and 23Na in the designated BDW of national and international brand with the sources of well and spring has been examined. The amounts of the identified metals have been illustrated in Table 3. The identified metals ranged from not detected to 74847.15 µg/L. The local brands constitute the higher amounts of studied elements, among them 59Co (1.11–1.74 µg/L), 24 Mg (1168.72–22362.58 µg/L) and 23Na (2236.83–74847.15 µg/L) were found at higher concentrations in all of the analyzed samples. The other elements were found to be at lower concentrations, 75As in five samples (BDW1-2, BDW8-9 and BDW15, 0.63–1.72 µg/L), 208Pb in three samples (BDW1, BDW6 and BDW13, 0.41–0.46 µg/L), 111Cd in eleven samples (BDW1-8, BDW14, BDW16, and BDW19, 1.05–1.81 µg/L), 66Zn in four samples (BDW9, BDW15 and BDW18-19, 1.88–2.45 µg/L) and 63Cu in six samples (BDW6, BDW9-11, BDW14-15, 0.12–2.74 µg/L). A small number of studies have stated the metal amounts in BDW (Zhang et al., 2019), described the levels of Cd, Pb, Cu and Zn in BDW in Guangzhou and Shenzhen cities in China, obtained in considerably greater levels of Pb (0.91–10 µg/L), Cu (60.10–74 µg/L) and Zn (24.3–294 µg/L) except Cd (<0.1–0.33 µg/L) was found lower concentrations than those obtained in the current study. Kilic, S. (2019) has examined the presence of trace elements As, Pb, Cd, and others (not studied in the current study) in bottled natural mineral waters by means of ICP-MS system (Kilic, 2019), identified As (8.9 µg/L) Pb (0.8 µg/L) and Cd (<LOD). The Pb value was found in good agreement with those achieved in the present study, nevertheless, As and Cd were found at substantially higher amounts. The amounts of metals in the analyzed BDW are found lower than the World Health Organization (WHO, As and Pb, 10 µg/L, and Cd 3 µg/L) (WHO, 2011), and the U.S. Environmental Protection Agency (USEPA, Pb, 15 µg/L and Cd 5 µg/L) (Schulman, 2000) recommended values. As a result, the BDW samples conform with the standards pertaining to metal concentration. (Acrylamide, 2009; Schulman, 2000). In another similar study, Baba et al., (2008) have reported the analysis of 15 bottled mineral waters from Turkey for their metal (Al, B, Ba, Cd, Cu, Cr, Fe, Mn Pb and Zn) contents by ICP-AES (Baba et al., 2008). The obtained values for Cd, Cu, Pb and Zn were found to be very closed than those obtained in the present study. Nevertheless, the other elements have not been studies in this investigation. The metals risk assessment was also carried out for both types of water samples, for BDW, the average daily dose (ADD, 0.03–516.715 μg/kg/day), hazard quotient (HQ, 0.001–0.08 μg/kg/day) based on heavy metals oral reference dose, and cancer risk (CR, 0.45–244.67 μg/kg/day) based on heavy metals cancer slope factor were achieved (Table 1). BDW produced nearly equal toxicity values as recommended by the EPA (Forum, 2005). Additionally, the BDW was also found to be the trademark specific mainly the international trademark contained either zero level or low levels of the elements.
Water
Origin
75As
[µg/L ± sd]208Pb [µg/L ± sd]
111Cd
[µg/L ± sd]59Co
[µg/L ± sd]66Zn
[µg/L ± sd]63Cu
[µg/L ± sd]24 Mg
[µg/L ± sd]23Na
[µg/L ± sd]
BDW1
SA
0.74 ± 0.02
0.45 ± 0.03
1.23 ± 0.03
1.26 ± 0.04
nd
nd
3233.47 ± 114.53
17953.43 ± 300.07
BDW2
SA
1.44 ± 0.05
nd
1.44 ± 0.04
1.28 ± 0.05
nd
nd
5164.86 ± 115.25
20819.06 ± 1008.62
BDW3
SA
nd
nd
1.38 ± 0.03
1.12 ± 0.03
nd
nd
19837.80 ± 757.61
3328.30 ± 88.80
BDW4
SA
nd
nd
1.13 ± 0.02
1.20 ± 0.04
nd
nd
15356.98 ± 408.79
15224.51 ± 505.36
BDW5
SA
nd
nd
1.49 ± 0.04
1.51 ± 0.06
nd
nd
2590.54 ± 26.56
23036.68 ± 698.38
BDW6
SA
nd
0.65 ± 0.04
1.63 ± 0.04
1.52 ± 0.06
nd
0.14 ± 0.02
1370.02 ± 52.08
33380.87 ± 1218.60
BDW7
SA
nd
nd
1.35 ± 0.02
1.12 ± 0.04
nd
nd
2936.24 ± 452.40
16045.45 ± 2728.58
BDW8
SA
0.89 ± 0.06
nd
1.36 ± 0.02
1.11 ± 0.04
nd
nd
2924.05 ± 28.24
33460.40 ± 1364.58
BDW9
SA
0.63 ± 0.04
nd
nd
1.18 ± 0.05
2.43 ± 0.09
1.58 ± 0.06
2539.07 ± 33.99
19199.93 ± 369.03
BDW10
SA
nd
nd
nd
1.17 ± 0.03
nd
0.15 ± 0.01
1459.23 ± 15.59
30171.54 ± 1257.85
BDW11
SA
nd
nd
nd
1.14 ± 0.03
nd
0.12 ± 0.01
1168.72 ± 10.88
26640.87 ± 846.19
BDW12
SA
nd
nd
nd
1.19 ± 0.04
nd
nd
3675.47 ± 13.82
13079.43 ± 632.28
BDW13
SA
nd
0.41 ± 0.02
nd
1.17 ± 0.03
nd
nd
1211.75 ± 51.23
15137.63 ± 524.13
BDW14
SA
nd
nd
1.44 ± 0.03
1.15 ± 0.03
nd
0.55 ± 0.03
1466.46 ± 72.88
30378.24 ± 466.09
BDW15
SA
1.72 ± 0.12
nd
1.81 ± 0.07
1.74 ± 0.06
1.88 ± 0.07
2.74 ± 0.10
22362.58 ± 275.51
74847.15 ± 3590.83
BDW16
SA
nd
nd
nd
1.19 ± 0.05
nd
nd
11272.17 ± 71.65
4476.58 ± 144.32
BDW17
SA
nd
nd
nd
1.15 ± 0.03
nd
nd
1628.58 ± 32.67
2236.83 ± 37.75
BDW18
SA
nd
nd
nd
1.33 ± 0.05
1.53 ± 0.06
nd
3864.01 ± 76.00
18427.56 ± 733.68
BDW19
SA
nd
nd
1.05 ± 0.04
1.18 ± 0.04
2.45 ± 0.09
nd
3665.87 ± 128.41
24192.32 ± 1226.80
BDW20
France
0.92 ± 0.03
nd
nd
1.14 ± 0.03
nd
nd
25068.92 ± 688.00
5973.64 ± 159.43
BDW21
Italy
nd
nd
nd
1.15 ± 0.03
nd
nd
3299.29 ± 110.34
219.75 ± 5.44
BDW22
Austria
nd
nd
1.35 ± 0.07
1.19 ± 0.04
nd
nd
5828.17 ± 15.04
955.356 ± 37.95
BDW23
Lebanon
nd
0.36 ± 0.02
nd
1.24 ± 0.05
nd
nd
8667.48 ± 132.40
2067.701 ± 62.96
BDW24
UAE
nd
nd
1.29 ± 0.07
1.16 ± 0.04
nd
nd
1071.24 ± 43.33
2787.52 ± 149.63
TW1
SA
1.24 ± 0.05
1.81 ± 0.03
1.12 ± 0.01
1.35 ± 0.01
475.47 ± 7.25
129.88 ± 5.85
12267.89 ± 307.61
42776.89 ± 1111.69
TW2
SA
1.39 ± 0.07
1.52 ± 0.09
1.18 ± 0.04
1.62 ± 0.05
518.20 ± 12.43
96.34 ± 2.77
6891.44 ± 122.55
33485.42 ± 848.37
TW3
SA
1.51 ± 0.04
1.94 ± 0.01
1.23 ± 0.04
1.46 ± 0.04
402.88 ± 6.20
156.45 ± 8.69
7965.60 ± 196.77
38225.56 ± 986.92
TW4
SA
1.26 ± 0.05
1.67 ± 0.02
1.25 ± 0.03
1.24 ± 0.01
393.48 ± 5.88
101.66 ± 4.74
5648.46 ± 142.99
29458.65 ± 752.10
Four desalinated TW from different locations were studied for the presence of potential metals comprising 75As, 208Pb, 111Cd, 59Co, 66Zn, 63Cu, 24 Mg and 23Na. Metals have been identified in all of the samples, and constitutes the higher levels of the metals than BDW. The levels of detected metals in TW have been demonstrated in Table 3. The concentrations of metal were found between 1.12 µg/L and 42776.89 µg/L in all of analyzed samples. The amounts of 75As (1.26–1.51 µg/L), 208Pb (1.52–1.94 µg/L), 111Cd (1.12–1.25 µg/L) and 59Co (1.24–1.62 µg/L) were found to be in the similar range. Nevertheless, the amounts of other elements show a huge difference with high concentrations for instance 66Zn (393.48–518.20 µg/L), 63Cu (96.34–156.45 µg/L), 24 Mg (6891.44–12267.89 µg/L), 23Na (33485.42–42776.89 µg/L). This cause might be due to the same desalinated water supplied throughout the Kingdom. Variation of alkali (23Na), alkaline (24 Mg) and heavy metals (75As, 208Pb, 111Cd, 59Co, 66Zn and 63Cu) concentrations in BDW and TW (Fig. 3). Barnett-Itzhaki et al. (2019) have studied the heavy metals (Cu, Fe, Pb) concentrations in 24 desalinated water samples, and the maximum amounts of Cu (180 µg/L), Fe (894 µg/L) and Pb (5.1 µg/L) were identified (Barnett-Itzhaki et al., 2019). The amount of Cu was found to be in good agreement than those obtained in the current study, however, the level of Pb was found at higher concentrations than those obtained in this study. Iron (Fe) has not been investigated in the present study. In earlier study, Gao et al. (2020) have reported the assessment of twenty-nine ions and trace elements in desalinated water using ICP-MS, among them the levels of potential elements Cu (2.14 µg/L), Zn (0.01 µg/L), Co (0.16 µg/L), As (1.41 µg/L), Cd (<DL) and Pb (<DL), Na (10781000.1 µg/L) and Mg (1089000.9 µg/L) were obtained (Gao et al., 2020). The different values were found except As level has been reported in the current study. The metals risk assessment for TW was also performed, the ADD (0.03–1028.19 μg/kg/day), HQ (0.01–0.12 μg/kg/day) and CR (0.42–292.80 μg/kg/day) were obtained (Table 1). Comparatively, the BDW produced lower toxicity values (low risk) than the TW (high risk).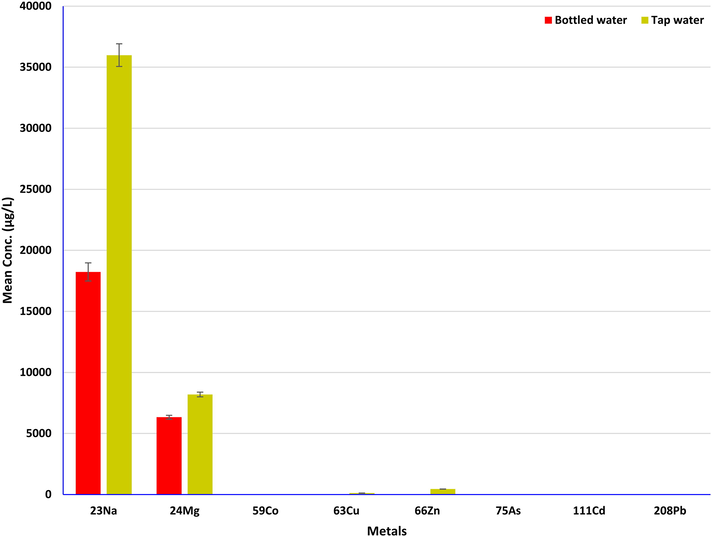
Variation of alkali (23Na), alkaline (24 Mg) and heavy metals (75As, 208Pb, 111Cd, 59Co, 66Zn and 63Cu) concentrations in BDW and TW.
4 Conclusion
A highly sensitive method based on microwave digestion and iCAP Q ICP-MS have been applied for the determination of potential metals alkali (23Na), alkaline (24 Mg) and heavy metals (75As, 208Pb, 111Cd, 59Co, 66Zn and 63Cu) in drinking water of diverse brand and source of origin. The method has offered excellent quality conditions with high recovery rates. Based on outcomes, Current investigation explored probable influence of progressively increasing usage of drinking water in Saudi Arabia. Up to the present time, the levels of potential heavy metal in such water pose higher toxicity values particularly in TW. Besides, BDW was found to be the brand specific particularly the international brand which contained either zero level or very low amounts of metal. The results of our study highlight on the requirements for the strict strategies addressing the potential threat of metals in water intended for the public usage. In addition, we will carry on to determine metals in provided drinking water, with prominence on drinking water provided to susceptible inhabitants.
Acknowledgments
This project was supported by the Deanship of Scientific Research at Prince Sattan Bin Abdulaziz University under project (PSAU-2022/01/20195).
Declaration of Competing Interest
The authors declare that they have no known competing financial interests or personal relationships that could have appeared to influence the work reported in this paper.
References
- Drinking water requirements for states and public water systems. DC: US EPA Washington; 2017.
- Determination of metals in children’s plastic toys using X-ray florescence spectroscopy. Environ. Sci. Pollut. Res. 2021:1-15.
- [Google Scholar]
- Distribution of heavy metals in water and sediment of an urban river in a developing country: a probabilistic risk assessment. Int. J. Sedim. Res.. 2022;37:173-187.
- [Google Scholar]
- Determination of heavy metals in skin-whitening cosmetics using microwave digestion and inductively coupled plasma atomic emission spectrometry. IET Nanobiotechnol.. 2017;11:597-603.
- [Google Scholar]
- Metal and metalloid levels in topsoil and municipal cardiovascular mortality in Spain. Environ. Res.. 2022;204:112395
- [Google Scholar]
- Removal of Chromium (III) and Cadmium (II) Heavy Metal Ions from Aqueous Solutions Using Treated Date Seeds: An Eco-Friendly Method. Molecules. 2021;26:3718.
- [Google Scholar]
- Date pits waste as a solid phase extraction sorbent for the analysis of lead in wastewater and for use in manufacturing brick: An eco-friendly waste management approach. J. Saudi Chem. Soc.. 2022;26:101519
- [Google Scholar]
- Heavy Metal Ions Removal from Aqueous Solutions by Treated Ajwa Date Pits: Kinetic, Isotherm, and Thermodynamic Approach. Polymers. 2022;14:914.
- [Google Scholar]
- An assessment of the quality of various bottled mineral water marketed in Turkey. Environ. Monit. Assess.. 2008;139:277-285.
- [Google Scholar]
- Heavy metal concentrations in drinking water in a country heavily reliant on desalination. Environ. Sci. Pollut. Res.. 2019;26:19991-19996.
- [Google Scholar]
- An assessment of heavy metal level in infant formula on the market in Turkey and the hazard index. J. Food Compos. Anal.. 2022;105:104258
- [Google Scholar]
- Global environment: water, air, and geochemical cycles. Princeton University Press; 2012.
- Heavy metal pollution in sub-Saharan Africa and possible implications in cancer epidemiology. Asian Pac. J. Cancer Prev.. 2013;14:3393-3402.
- [Google Scholar]
- Guidance on selecting age groups for monitoring and assessing childhood exposures to environmental contaminants. US Environmental Protection Agency, Risk Assessment Forum; 2005.
- Occurrence and health risk assessment of trace metals in desalinated seawater using two desalination technologies. Pol. J. Environ. Stud.. 2020;29:3581-3588.
- [Google Scholar]
- Multi-Element Analysis and Origin Discrimination of Panax notoginseng Based on Inductively Coupled Plasma Tandem Mass Spectrometry (ICP-MS/MS) Molecules. 2022;27:2982.
- [Google Scholar]
- Health risk assessment of total chromium in the qanat as historical drinking water supplying system. Sci. Total Environ.. 2022;807:150795
- [Google Scholar]
- Heavy metal contamination and exposure risk assessment via drinking groundwater in Vehari, Pakistan. Environ. Sci. Pollut. Res.. 2020;27:39852-39864.
- [Google Scholar]
- Heavy Metals in Acrylic Color Paints Intended for the School Children Use: A Potential Threat to the Children of Early Age. Molecules. 2021;26:2375.
- [Google Scholar]
- Association between heavy metals and colon cancer: an ecological study based on geographical information systems in North-Eastern Iran. BMC Cancer. 2021;21:1-12.
- [Google Scholar]
- Survey of trace elements in bottled natural mineral waters using ICP-MS. Environ. Monit. Assess.. 2019;191:1-7.
- [Google Scholar]
- Air-polluted environmental heavy metal exposure increase lung cancer incidence and mortality: A population-based longitudinal cohort study. Sci. Total Environ.. 2022;810:152186
- [Google Scholar]
- Ratiometric G-quadruplex assay for robust lead detection in food samples. Biosensors. 2021;11:274.
- [Google Scholar]
- Daily intake of heavy metals and minerals in food–a case study of four Danish dietary profiles. J. Clean. Prod.. 2021;280:124279
- [Google Scholar]
- Trace elements in human nutrition (ii)–an update. International Journal of. Prev. Med. 2020:11.
- [Google Scholar]
- Assessment of renal and hepatic dysfunction by co-exposure to toxic metals (Cd, Pb) and fluoride in people living nearby an industrial zone. J. Trace Elem. Med Biol.. 2022;69:126890
- [Google Scholar]
- Water for food water for life: A comprehensive assessment of water management in agriculture. Routledge; 2013.
- Heavy Metal Contamination of Natural Foods Is a Serious Health Issue: A Review. Sustainability. 2022;14:161.
- [Google Scholar]
- Assessment of burden of disease induced by exposure to heavy metals through drinking water at national and subnational levels in Iran, 2019. Environ. Res.. 2022;204:112057
- [Google Scholar]
- Photocatalytic performance of black titanium dioxide for phenolic compounds removal from oil refinery wastewater: nanoparticles vs nanowires. Appl. Nanosci. 2022:1-17.
- [Google Scholar]
- Multi-element determination in pharmaceutical preparations using the Thermo Scientific iCAP Q ICP-MS. Mercury. 2012;1(7):5.
- [Google Scholar]
- A review of heavy metal contamination of food crops in Nigeria. Ann. Glob. Health. 2018;84:488.
- [Google Scholar]
- Trace elements in human nutrition and health. World Health Organization; 1996.
- Organization, W.H., 2013. Progress on sanitation and drinking water: Fast facts.
- Contribution of household drinking water intake to arsenic and lead exposure among Uruguayan schoolchildren. Chemosphere. 2022;133525
- [Google Scholar]
- Arsenic occurrence in public drinking water supplies. United States Environmental Protection Agency [on line] In: Available From: office of GroundWater and Drinking Water 1200. 2000.
- [Google Scholar]
- Heavy metals in water: presence, removal and safety. Royal Society of Chemistry; 2014.
- A review on three-dimensional cellulose-based aerogels for the removal of heavy metals from water. Sci. Total Environ.. 2022;807:150606
- [Google Scholar]
- The role of heavy metals in thyroid cancer: A meta-analysis. J. Trace Elem. Med Biol.. 2022;69:126900
- [Google Scholar]
- Assessment of the design, operation, and economy of the seawater reverse osmosis plant in Al-Jubail region, Saudi Arabia. Desalination Water Treat. 2021;222:60-80.
- [Google Scholar]
- Guidelines for drinking-water quality. World health organization. 2011;216:303-304.
- [Google Scholar]
- Analysis of pharmaceutical products for their elemental impurities with the Thermo Scientific iCAP RQ ICP-MS. Power (W). 2016;1:200.
- [Google Scholar]
- Cellulose derived graphene/polyaniline nanocomposite anode for energy generation and bioremediation of toxic metals via benthic microbial fuel cells. Polymers. 2020;13:135.
- [Google Scholar]
- Assessment of health risk of heavy metals and water quality indices for irrigation and drinking suitability of waters: a case study of Jamalpur Sadar area. Bangladesh. Environmental Advances. 2020;2:100005
- [Google Scholar]
- Groundwater and the environment: applications for the global community. CRC Press; 2000.
- Heavy metals in human urine, foods and drinking water from an e-waste dismantling area: Identification of exposure sources and metal-induced health risk. Ecotoxicol. Environ. Saf.. 2019;169:707-713.
- [Google Scholar]
- Label-free DNAzyme assays for dually amplified and one-pot detection of lead pollution. J. Hazard. Mater.. 2021;406:124790
- [Google Scholar]


