

Translate this page into:
Salt stress effects on growth, physiology, and ionic concentrations in hydroponically grown barley genotypes
⁎Corresponding authors at: Department of Soil and Environmental Sciences, Faculty of Agriculture and Environmental Sciences, Muhammad Nawaz Shareef University of Agriculture, Multan 66000, Pakistan (Q.A. Sadiq). State Key Laboratory of Desert and Oasis Ecology, Key Laboratory of Ecological Safety and Sustainable Development in Arid Lands, Xinjiang Institute of Ecology and Geography, Chinese Academy of Sciences, Urumqi 830011, PR China (M. Nazim). quratulainsadiq20@gmail.com (Qurat-Ul-Ain Sadiq), nazimaslam53@gmail.com (Muhammad Nazim)
-
Received: ,
Accepted: ,
This article was originally published by Elsevier and was migrated to Scientific Scholar after the change of Publisher.
Abstract
Abstract
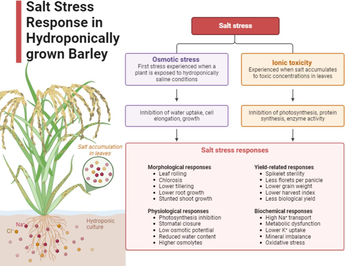
Soil salinity is a major abiotic stress that severely affects crop production in different regions of the globe. Barley is an essential cereal crop and there is a significant genetic variation among barley varieties for tolerance towards salt stress. Understanding of salinity tolerance mechanisms assists in developing salt tolerant barley varieties in a hydroponics experiment. There were twelve barley varieties and two NaCl stress levels (Control, 100 and 200 mM) in this study. The nursery of barley was seeded in sand and at two-leaf stage; plants were transplanted into hydroponic tubs. The plants were grown under salt stress for 65 days and data regarding several morpho-physiological parameters were collected. The statistical analysis of the collected data was implemented by using completely randomized design (CRD) with factorial arrangement. Exposure to NaCl stress significantly reduced shoot and root growth and relative leaf water contents (RLWC), while increasing Na+ concentration, with B-9006 showing the highest root dry weight (0.39 g) and YSM1 recorded the lowest root dry weight (0.10 g) under 100 mM NaCl. The maximum (232 ppm) Na+ concentration in leaf sap was observed in variety B-15011 (70 % from control) and minimum was observed in B-15018. Maximum K+ mM concentration in leaf sap was found as 72 % in Aia-03 and minimum was observed as 50 % in B-15035. At stress level of 200 mM, highest shoot dry weight (2.52 g) was observed in ZP2 (73 % decreased from control) while minimum shoot dry weight (0.19 g) (96 % decrease from control) was recorded in Franklin genotype. Maximum root dry weight (0.24 g) was observed in B-9006 genotype while minimum root dry weight (0.04 g) was recorded in Gairdner. Maximum K+/Na+ ratio (1.20) was recorded in B-15018 and minimum (0.14) was seen in B-15035. Therefore, based on our results, barley genotypes can be classified into salt-tolerant (B-9006, B-15018, Yerong, Aia-03), salt-sensitive (Gairdner, Franklin, B-15035, B-05011), and moderately tolerant groups at both 100 and 200 mM NaCl levels.
Keywords
Barley (Hordeum vulgare L.)
Hydroponics culture
Physiological mechanism
Salinity stress
Ionic concentrations
Salt tolerance

1 Introduction
Salinity is a major environmental alarm that can affect quality and productivity of any crop, almost 20 % of farmland is subjected to saline-alkali and salt stress. (El-Ramady et al., 2024), It can cause a decline in the cultivated land area (Hassani et al., 2021). Salt stress is a very important and common abiotic stress which has affected one third of the world’s irrigated land making it unsuitable and unavailable for cultivation purposes (Hualpa-Ramirez et al., 2024). Climate change, poor irrigation management, soil erosions and anthropogenic activities are some of the leading causes of increased salinization (Eswar et al., 2021). Salt stress is a severe problem in all the arid and semi-arid Land, causing 50 % crop productivity losses (Ali et al., 2023). Plants growth processes like seed germination, seedling development and vigor, flowering, fruit setting etc. are adversely affected by salinity stress (Irik and Bikmaz, 2024). Therefore, salinity not only depresses the quality of the crop but also cuts 50 % yield production (Muhammad et al., 2023). Plants respond to this stress in different ways i.e. preventing the entry of salts (at cellular or the whole plant level), taking extra water from soil, reducing the concentration of the salts in the cytoplasm etc. (Nasiri et al., 2024). There are four main damaging and hazardous effects of salt stress on plant growth, which includes less availability of water due to high osmotic stress (Mahboob et al., 2023), stimulated by large quantities of salts dissolved in soil, specific ion toxicity occurred due to high concentrations of sodium, chloride and magnesium ions, nutritional imbalances such as potassium deficiency and production under salt stress (Tabassum et al., 2024). Similarly, physiological processes like photosynthesis, lipid metabolism and protein synthesis are also hampered (Zahra et al., 2022), which have an adverse effect on development, performance and yield of plants under salinity stress. Furthermore, accumulation of Na+ in the cytosol due to leaky cell membrane causes ion toxicity and cell death (Arif et al., 2020). Under high salinity plants activate their internal physiological processes for defense like antioxidant defense system, photosynthetic capacity and also upregulation of calvin-cycle (ElSayed et al., 2022) (see Table 1).
Sr. No.
Salts
Stock (g L−1)
mL stock solution for 1 L
Macronutrients
1
KH2PO4
136
0.5 ml
2
KNO3
101
2.5 ml
3
Ca (NO3)2 4H2O
236
2.5 ml
4
MgSO4.7H2O
246
1.0 ml
Micronutrients
1
H3BO3
2.86
1.0 ml
2
MnCl2.4H2O
1.81
1.0 ml
3
ZnSO4.7H2O
0.22
1.0 ml
4
CuSO4.5H2O
0.08
1.0 ml
5
H2MoO4.H2O
0.02
1.0 ml
6
Fe-EDTA
37.33
1.0 ml
Barley is an essential cereal crop and species in the field of environmental sciences. It can be grown in various climatic conditions due to its short life cycle (Kumar et al., 2022). Barley grain is highly rich in vitamins, minerals, fibers and helps in promoting human health (Raj et al., 2023). It can be used as food, feed and fodder (Devendar et al., 2020). Different barley cultivars depict great genetic distinction for salinity tolerance and classified as highly salt tolerant (Mwando et al., 2020). Different salt tolerance studies described that barley shows glycophytic characters (a good potential of excluding Na+ from uptake by the roots of salt tolerant genotypes) in comparison with salt sensitive genotypes (Hassan et al., 2021). While others reveal halophytic characters (barley special capacity to sequester Na+ in the vacuole) and therefore, maintaining high levels of K+/Na+ in the cytosol while minimizing damage due to toxicity of Na+ (Ghazaryan et al., 2023). Chemical reclamation of salt-affected lands is an expensive practice; however, these areas can be exploited by growing salt tolerant plant species (Mukhopadhyay et al., 2021). However, significant genetic variability for salt-tolerance has been testified among barley germplasm. Therefore, existing local and exotic barley germplasm can be screened to select and develop favorable salt tolerant varieties of barley to grow on salt affected lands with minimal yield reduction.
The objectives of this study are to classify promising exotic and local barley varieties based on their salt tolerance and to identify reliable indicators for screening salinity stress, establishing the relationship between ion concentration and salinity tolerance. This research aims to bridge the knowledge gap in barley response towards salinity stress.
2 Materials and methods
2.1 Experimental site, plan and treatments
This reported study was carried out in a hydroponic experiment unit at the Department of Soil and Environmental Sciences, Faculty of Agriculture and Environmental Sciences, MNS-University of Agriculture, Multan, Pakistan, during the year 2020. The experiment was laid out as CRD with factorial arrangement under hydroponic environment. There were 12 varieties of barley and 2 salinity levels (Control, 100 and 200 mM) in this study. Randomization of the five replications of each variety was done in all the treatments. Varieties were signified as follows: (Local) G1 = B-9006, G2 = B-05011, G3 = B-15018, G4 = B-15035, (Exotic) G5 = Aia-03, G6 = Franklin, G7 = YSM1, G8 = ZUG 293, G9 = ZP2, G10 = Dayton, G11 = Gairdner and G12 = Yerong. The seeds of barley were obtained from the Ayyub Agriculture Research Institute, Faisalabad, Pakistan and University of Tasmania, Hobart, Australia. The nursery of barley seeds was sown on 8th October 2020 in the iron trays containing thoroughly washed fine river sand. The trays were placed on the bench top in the net house and watered regularly till transplantation.
2.2 Growth conditions
Nursery of barley plants was grown in the sand culture. The seedlings of barley at the two leaf stage were transferred into the holes of the thermopore sheets floating on the ½ strength Hoagland’s solution in iron tubs lined with the polythene sheets after wrapping in foam (Hoagland and Arnon, 1950).
2.3 Setup of hydroponic system and pH adjustment
Seedlings of barley were transplanted into a hydroponic system containing half strength Hoagland’s solution by (Hoagland and Arnon, 1950). Aeration was provided with the help of aeration pumps. Hydroponic system was comprised of iron tubs (size: 3 ft × 2 ft × 0.5 ft) of 100 l capacity (Fig. 1). The tubs were lined from inside with polyethylene sheet. The pH of the Hoagland’s solution was maintained daily at 6.5.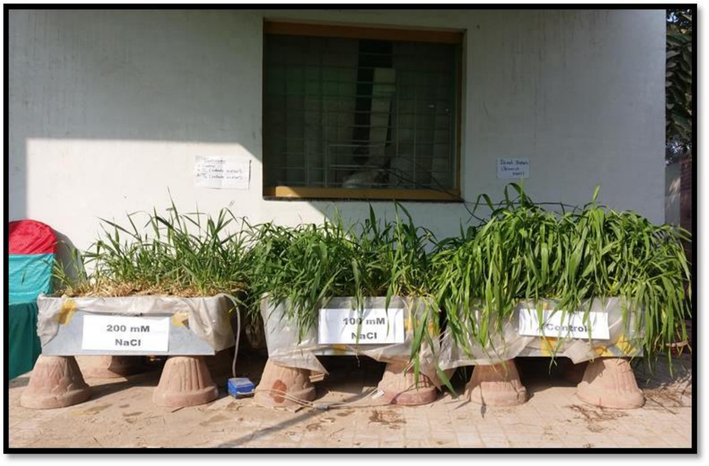
Illustrated the variation among barley genotypes under control condition and with 100 mM and 200 mM NaCl treatments.
2.4 Data collection
Plants were harvested 65 days after exposure to 100 and 200 mM NaCl salinity stress and separated into the shoots and roots. The fresh weight of roots and shoots were recorded immediately after harvesting. To obtain dry weight, plants were dried in drying oven at 65 °C for 72 h. The roots were washed with isotonic solution after harvesting. The ions including Na+ and K+ were determined in 2nd fully expanded leaf from the top. Plants from each pot were harvested and their lengths were measured in cm with the help of a scale, from base to top and then calculated average of all replications. For the determination of root length, plants were harvested. Plant samples, then washed thoroughly under tap water and air dried. Length of main root was measured by using measuring tape and then calculated the average. Plants from each tub were harvested and fresh samples of root and shoot were separately weighed for root and shoot fresh weight by using a portable analytical balance. Plants from each tub were harvested. Well prepared samples were air dried and then placed in an oven for moisture removal at 67 ⁰C upto constant weights. After moisture removal, percent dry weight was also calculated. SPAD values were taken by using the SPAD meter (model: SPAD-502 Plus made by Konica Minolta, Europe) for the determination of chlorophyll contents in the plants of barley. SPAD values were taken two times in the gap of two weeks for checking the difference in the values. No. of tillers were counted per plant at the time of harvesting. After harvesting plants from every tub no. of tillers were calculated. Relative water content (LWC) of leaves was determined by using the following formula as described by Mayak et al. (2004). Fresh second flag leaves were separated from all the plants and fresh weight was recorded. The fully turgid weight of leaf was taken after diping it in 100 % moisture in the dark for 48 h. Dry weight was taken after drying the turgid leaf samples in the oven at 67 °C for 24 h up to the constant weight.
2.5 Statistical analysis
All the recorded data were analyzed statistically by using Statistix 8.1. Completely Randomized Design with factorial arrangement was applied and the treatment means were compared by using DMR test (Steel et al., 1997).
3 Results and discussions
3.1 Effect of salinity on morphological traits
3.1.1 Shoot length (cm)
The data related to variation in shoot length of different barley genotypes under salinity stress was shown in (Table 2) and clearly showed that variation in plant height at different salinity levels was highly significant (p ≤ 0.01). Salinity levels affected plant height of all the genotypes of barley as compared to control treatment, however, variations in plant height were may be due to genetic variations in barley genotypes. Under salinity, plant height of all genotypes was decreased as compared to control. At salinity stress of 100 mM NaCl maximum plant height (28.5 cm) was recorded in genotype Franklin, while minimum was found in Aia-03 (19.5 cm), which accounts for lowest decrease of 46 % in Franklin genotype and highest decrease of 58 % in genotype Aia-03 when compared with control. At 200 mM NaCl stress maximum plant height was observed in Franklin (25.0 cm) genotype while plant height was minimum in Yerong (14.4 cm). Minimum 47 % decrease was observed in Franklin as compared to control. Whereas, Yerong showed the highest decrease of 61 % in plant height as compared to control treatment. The reduction in plant height under salinity may be due to salinity induced reduction in turgor pressure of cells which results in slow cell division and production of small sized cells (Sabagh et al., 2019).
Barley genotypes
Salinity levels
(NaCl)Shoot length (cm)
Root length
(cm)
Shoot fresh
weight (g)
Root fresh weight (g)
Shoot dry
weight (g)
Root dry
weight (g)
No. of tillers plant-1
B-9006
Non-saline
36.5e
30.3b-d
72.1c
15.2b-e
6.7b
0.3b-c
21.3b-c
100 mM
22.3f-j
16.0f-h
36.3e-i
6.9g-m
2.1f-j
0.35c-d
11.3f
200 mM
23.1f-j
7.16m-n
8.59m-o
3.9j-m
0.7k-m
0.2g-i
5.0k-q
B-05011
Non-saline
37.7e
32.0a-c
125.7b
19.4b
8.8a
0.4b
20.0c-d
100 mM
22.1f-k
13.5g-j
26.0h-n
9.5 e-j
1.3 i-m
0.2 j-m
6.7h-m
200 mM
20.1 i-k
9.0k-n
8.2n-o
3.9j-m
0.4l-m
0.2m-o
4.3m-s
B-15018
Non-saline
45.9b
28.8c-d
47.3e-f
16.3b-d
4.1c-d
0.3d-e
8.0g-i
100 mM
22.0f-k
15.6f-h
24.6h-n
12.9c-g
1.8g-k
0.2h-i
4.0n-t
200 mM
21.9g-k
13.1g-k
14.4j-o
7.2g-l
0.9j-m
0.2i-l
2.3r-u
B-15035
Non-saline
42.7b-d
36.0a
177.3a
76.0a
9.9a
0.6a
23.3a-b
100 mM
22.1f-k
11.8h-l
46.5e-g
19.8b
3.2c-f
0.24f-h
14.3e
200 mM
19.2i-k
10.0j-m
27.8g-l
14.9b-f
1.6h-l
0.14j-l
5.3 j-p
Aia-03
Non-saline
46.4b
29.7b-d
68.9c-d
5.8h-m
3.4c-e
0.2h-j
25.0a
100 mM
20.0i-k
12.0g-l
31.5f-k
3.6j-m
0.6k-m
0.2j-m
7.0h-l
200 mM
21.1h-k
10.7i-m
15.3j-o
2.6k-m
0.4l-m
0.1m-p
3.7o-t
Franklin
Non-saline
51.7a
19.3e-f
51.7d-e
5.8h-m
4.2c
0.3e
18.7d
100 mM
26.9f
13.0g-k
18.2i-o
4.7j-m
1.4i-m
0.2h-i
7.7g-j
200 mM
23.5f-i
9.3j-n
4.5o
1.7l-m
0.2m
0.2 i-k
2.7q-u
YSM1
Non-saline
46.9a-b
27.2d
40.5e-h
16.6b-d
3.1c-f
0.3e-f
23.0a-b
100 mM
21.4h-k
16.3f-g
31.9j
8.2g-k
2.8e-h
0.1m-q
11.3f
200 mM
18.5j-k
10.5j-m
15.2j-o
2.6k-m
0.7k-m
0.1o-r
6.0i-o
Dayton
Non-saline
45.2bc
21.0e
27.1h-n
15.2b-e
2.4e-i
0.3efg
7.3g-k
100 mM
22.4F-J
15.3fgh
23.6h-n
5.5i-m
0.8klm
0.2j-m
5.3j-p
200 mM
19.2ijk
10.8i-m
13.3j-o
3.7jk
0.6klm
0.1o-r
4.3m-s
Gairdner
Non-saline
40.9cde
33.8ab
46.5efg
12.1d-h
3.3c-f
0.2ghi
9.0fgh
100 mM
20.9h-k
15.0f-i
15.4j-o
7.6g-l
2.1f-i
0.2l-o
2.0stu
200 mM
20.1ijk
9.8j-n
9.2l-o
4.3j-m
0.9j-m
0.1qr
1.0u
Yerong
Non-saline
26.7fg
15.0f-i
18.8i-o
4.0j-m
1.3i-m
0.1j-n
14.0e
100 mM
23.2f-j
8.0lmn
14.0j-o
2.4klm
0.8klm
0.1m-p
6.3i-n
200 mM
17.2k
5.5n
10.8l-o
0.7m
0.5lm
0.05r
3.0p-u
ZUG-293
Non-saline
25.7fgh
30.7bcd
41.9efgh
16.5bcd
3.1d-g
0.3ef
4.7l-r
100 mM
23.1f-j
18.3ef
9.7l-o
8.8f-k
0.8klm
0.2i-l
1.7tu
200 mM
22.0g-k
8.5lmn
4.1o
4.2j-m
0.5lm
0.1n-q
1.0u
ZP2
Non-saline
38.2de
18.3ef
71.6c
18.7bc
7.1b
0.2ghi
21.0bcd
100 mM
25.1fgh
12.3g-l
27.5g-m
11.5d-i
3.6cde
0.1k-n
9.7fg
200 mM
20.0ijk
9.8j-n
12.5k-o
8.5g-k
1.8g-k
0.1pqr
6.0i-o
3.1.2 Root length (cm)
The data related to variations in root length of different barley genotypes under salt stress is shown in the (Table 2) which evidently displays that effect of different salinity levels on root length of barley was also statistically highly significant (p ≤ 0.01). Under salinity root length of all the barley genotypes was decreased as compared to control however, there was significant variation for root length among barley genotypes. Salt stress affected root length of all the twelve genotypes of barley as compared to controlled treatments. At salinity stress of 100 mM, NaCl stress maximum root length was observed in ZUG 293 (21.2 cm) genotype and followed by YSM1, B-9006 and B-15018 genotypes, while minimum root length was recorded in Yerong (9 cm) genotype. It was found that the reduction in root length of ZUG-293 was 44 %, whereas, in Yerong it was 60 % as compared to control. At salinity stress of 200 mM, NaCl maximum root length was observed in B-15018 (14.5 cm) genotype followed by Dayton, Aia-03 and YSM1 however, minimum root length (4 cm) was recorded in Yerong genotype. Genotype B-15018 exhibited 51 % decrease in root length and Yerong expressed 84 % as compared to control. The reason of reduced root length is osmotic effects caused by increasing amounts of NaCl (Narimani et al., 2020).
3.1.3 Shoot fresh weight (g)
The data related to changes in shoot fresh weight of different barley genotypes under salt stress is shown in (Table 2) visibly shows that effect of different salinity levels on shoot fresh weight of barley was also statistically highly significant (p ≤ 0.01). Salinity affected shoot fresh weight of all the genotypes of barley as compared to non-saline control treatment. However, variation in shoot fresh weight was observed among barley genotypes under salt stress levels. Due to salinity, shoot fresh weight of all the genotypes was reduced as compared to control plants. At salinity stress of 100 mM NaCl, highest shoot fresh weight was witnessed in B-15035 (47.2 g) genotype and also followed by B-9006, ZP2 and YSM1 while lowest shoot fresh weight was observed in ZUG-293 (11.7 g) genotype of barley. 66 % reduction of fresh weight was observed in B-15035 and 74 % was examined in ZUG-293. At salinity stress of 200 mM NaCl maximum shoot fresh weight (29.3 g) was observed in B-15035 genotype and accompanied by Aia-03, YSM1 and B-15018. While minimum fresh weight was noted in ZUG-293 (5.75 g) genotype. Lowest 79 % decrease was seen in shoot fresh weight of B-15035 and highest 87 % decrease was observed in ZUG-293 as compared to control.
3.1.4 Shoot dry weight (g)
The data about changes in shoot dry weight of different barley genotypes under salinity stress is presented in (Table 2) which shows the response of barley genotypes and salinity levels and their interactive effects are statistically highly significant (p ≤ 0.01). As compared to control, salinity affected shoot dry weight of all the genotypes of barley. Due to salinity stress, shoot dry weight of all genotypes was decreased as compared to control. At stress level of 100 mM, increased shoot dry weight (5.5 g) was recorded in ZP2 genotype (42 % decreased from control) followed by B-15035, Gairdner and B-9006 while, minimum shoot dry weight (1.89 g) was observed in Aia-03 genotype (76 % decreased from control). At stress level of 200 mM, highest shoot dry weight (2.52 g) was observed in ZP2 genotype (73 % decreased from control) while minimum shoot dry weight (0.19 g) (96 % decrease from control) was recorded in Franklin genotype. The reason of drastic decrease in shoot dry weight is extreme increase in salinity which caused decrement in the shoot length (Zeeshan et al., 2020).
3.1.5 Root fresh weight (g)
Following data related to changes in root fresh weight of different barley genotypes under salinity stress is shown in (Table 2) clearly displays that effect of different salinity levels on root fresh weight of barley was statistically highly significant (p ≤ 0.01). Salinity affected root fresh weight of all the genotypes of barley as compared to controlled treatment. At salinity stress of 100 mM, NaCl minimum root fresh weight (1.5 g) was perceived in Yerong genotype while maximum root fresh weight (21.03) was recorded in B-15035 genotype. At salinity stress of 200 mM, NaCl maximum root fresh weight (14.5 g) was observed in B-15035 genotype while minimum root fresh weight (1.5 g) was recorded in Franklin genotype. Zeeshan et al. (2020) reported that decreased root growth contributed to a significant decrease in the root fresh weight of the barley genotypes. Shortest lengths had the decreased weights.
3.1.6 Root dry weight (g)
In (Table 2) data related to changes in root dry weight of different barley genotypes under salinity stress is displayed which shows that different salinity levels showed statistically highly significant result on root dry weight (p ≤ 0.01). At salinity stress of 100 mM, highest root dry weight (0.39 g) was recorded in B-9006 genotype which was chased by B-15035, B-15018 and Franklin while lowest root dry weight (0.1 g) was found in YSM1 genotype. At salinity stress of 200 mM, maximum root dry weight (0.24 g) was observed in B-9006 genotype followed by B-15035, B-15018 and Franklin however, minimum root dry weight (0.04 g) was notified in Gairdner genotype. Root dry weights hold the same reason of reduction as observed previously in case of shoot fresh weight of the plant.
3.1.7 Number of tillers Plant−1
Changes in number of tillers plant−1 of different barley genotypes under salinity stress is shown in (Table 2) while effect of different salinity levels on tillers plant−1 of barley was highly significant (p ≤ 0.01). Salinity affected no. of tillers plant−1 of all the genotypes of barley compared to controlled treatments. Due to salinity, no. of tillers plant−1 of all genotypes was decreased compared to control. At salinity stress of 200 mM, maximum no. of tillers plant−1 (7) was observed in YSM1 genotype accompanied by ZP2 and B-15035, however, minimum no. of tillers plant−1 (1) was recorded in ZUG-293 genotype. At salinity stress of 100 mM, minimum no. of tillers plant−1 (1) was observed in ZUG-293 genotype while maximum no. of tillers plant−1 (16) was recorded in B-15035 genotype followed by YSM1, B-9006 and ZP2. Hammami et al. (2016) Evaluated that tillering capacity of the barley genotypes varied because of improper uptake of nutrients due to excessive salts.
3.2 Effect of salinity on physiological traits
3.2.1 Relative leaf water contents (RLWC) (%)
Material related to variations in relative leaf water contents of different barley genotypes under salinity stress is shown in (Fig. 2) which shows that response of barley genotypes was statistically highly significant (p ≤ 0.01) while effect of different salinity levels on RLWC of barley was statistically non-significant (p ≤ 0.05). At salinity stress of 100 mM, minimum RLWC (65 %) was observed in Dayton genotype while maximum RLWC (91 %) was recorded in ZP2 genotype followed by Franklin, YSM1 and ZUG-293. At salinity stress of 200 mM, maximum RLWC (85 %) were observed in B-15018 genotype and followed by YSM1, Franklin and B-9006 while, minimum RLWC (58 %) were recorded in Yerong genotype. Salinity affected RLWC of all the genotypes of barley compared to controlled treatments. Pazirandeh et al. (2015) revealed that high Na+ ion absorption in the plant from salt stressed environment can damage the ability of plant to absorb more water due to which RLWC are decreased in the plants.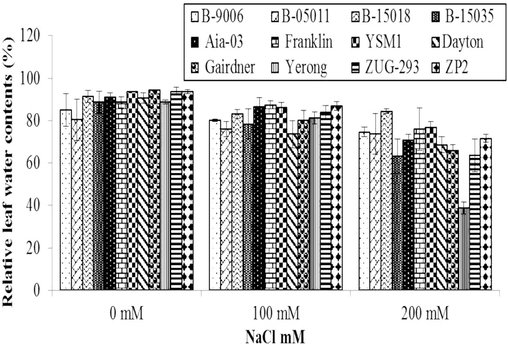
Variations in Relative Leaf Water Contents of different genotypes of barley at different level of salinity in hydroponics system. Error bars are ±SEM.
3.2.2 SPAD value
Variations in SPAD value (Soil Plant Analysis Development) of different barley genotypes under salinity stress is shown in (Fig. 3) which evidently displays the response of salinity levels on chlorophyll contents of barley was statistically significant (p ≤ 0.01). Chlorophyll contents of all the genotypes of barley are affected by salt stress compared to controlled treatments. Decline in SPAD value due to increase in salt stress was also testified by Yousfi et al. (2012) and Mahlooji et al. (2017) in their study and they also suggested a decrease in SPAD values. At salt stress of 100 mM, maximum chlorophyll contents (33.7) were observed in Dayton genotype followed by YSM1, B-05011 and ZUG-293 while minimum chlorophyll contents (17.4) were recorded in Yerong genotype. At salt stress of 200 mM, maximum chlorophyll contents (26.9) were observed in YSM1 genotype followed by Dayton and ZUG-293 genotype. While minimum chlorophyll contents (11.2) were recorded in Aia-03 genotype. Akhter et al. (2021) reported that impact of salinity stress on barley genotypes decreased chlorophyll-a (fluorescence).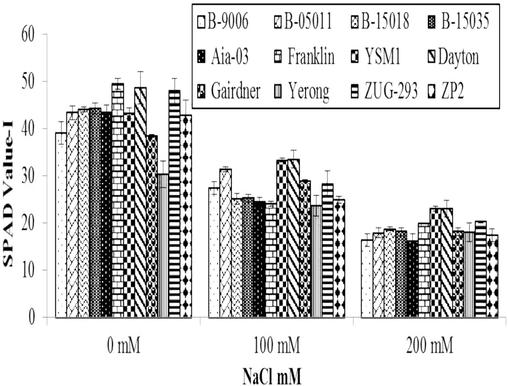
Variations in SPAD value of different genotypes of barley to different level of salinity under hydroponics conditions. Error bars are ±SEM.
3.2.3 Na+ (ppm) concentration in leaf sap
The data related to changes in Na+ concentration of different barley genotypes under salinity stress is shown in (Fig. 4). It displays that effect of different salinity levels on Na+ uptake of barley is also statistically highly significant (p ≤ 0.01). Salinity affected Na+ uptake in all the genotypes of barley compared to controlled treatments. However, variations in Na+ concentrations were observed due to genetic variations in barley genotypes. Due to salinity, Na+ concentration of all genotypes was increased compared to control (Fig. 4). At salt stress of 100 mM, maximum Na+ concentration (232 ppm) with 70 % increase from control was calculated in B-05011 followed by YSM1, Dayton and Gairdner genotypes. While minimum Na+ concentration (77 ppm) with 48 % increase from control was recorded in ZUG-293 genotype. At salinity stress of 200 mM, maximum Na+ concentration (306 ppm) with 92 % increase as compared to control was observed in Gairdner genotype followed by Franklin, B-15035 and ZUG-293 while minimum Na+ concentration (172 ppm) with 74 % increase as compared to control was recorded in Yerong genotype.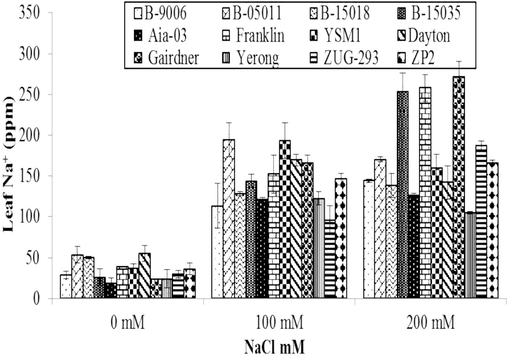
Variations in Na+ (ppm) concentration in leaf sap of different genotypes of barley to different level of salinity under hydroponics conditions. Error bars are ±SEM.
3.2.4 K+ (ppm) concentration in leaf sap
Variations in K+ concentrations of different barley genotypes under salinity stress is shown in (Fig. 5) which undoubtedly shows that response of barley genotypes was statistically highly significant (p ≤ 0.01) while effect of different salinity levels on K+ ppm concentration of barley was also statistically highly significant (p ≤ 0.01). Salinity affected K+ concentration in all the genotypes of barley compared to controlled treatments. However, changes in K+ concentrations were observed due to genetic variations in barley genotypes. Due to salinity, K+ concentration of all genotypes was increased compared to control (Fig. 5). At salt stress of 200 mM NaCl, maximum K+ concentration (132.2 ppm) with 95 % increase was observed in Aia-03 genotype followed by YSM1, Gairdner and B-15035 as compared to control. While, minimum K+ concentration (96 ppm) with 69.5 % was recorded in yerong genotype. At salt stress of 100 mM NaCl, maximum K+ concentration (100.7 ppm) with 72 % increase was witnessed in Aia-03 genotype followed by Yerong, B-9006 and ZP2 as compared to control. However, minimum K+ concentration (81 ppm) with 50 % increase was noted in B-15035 genotype. Plants with more K+ ion accumulation was less affected with Na+ ions. Decrease in K+/Na+ ratio concentration due to salinity stress was also described by Barati et al. (2017).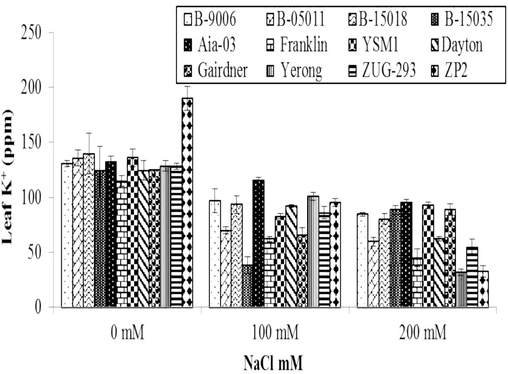
Variations in K+ (ppm) concentration in leaf sap of different genotypes of barley to different level of salinity under hydroponics conditions. Error bars are ±SEM.
3.2.5 K+/Na+ ratio in leaf sap
The information related to variations in K+/Na+ ratio of diverse barley genotypes under salinity stress is shown in (Fig. 6) which clearly exhibits that response of different salinity levels on K+/Na+ ratio of barley was also statistically highly significant (p ≤ 0.01). Salinity affected K+/Na+ ratio in all the genotypes of barley compared to controlled treatments. Due to salinity, K+/Na+ ratio concentration of all genotypes was increased compared to control (Fig. 6). At salinity stress of 100 mM, maximum K+/Na+ ratio concentration (1.66) was observed in ZUG-293 genotype while minimum K+/Na+ ratio concentration (0.39) was recorded in B-15035 genotype. At salinity stress of 200 mM, maximum K+/Na+ ratio concentration (1.20) was observed in B-15018 genotype while minimum K+/Na+ ratio concentration (0.14) was recorded in B-15035 genotype. Decrease in K+/Na+ ratio concentration due to salinity stress was also described by Izadi et al. (2014) and Mahlooji et al. (2018).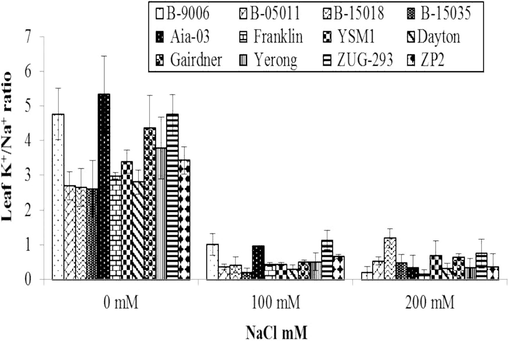
Variations in K+/Na+ ratio in leaf sap of different genotypes of barley to different levels of salinity under hydroponics conditions. Error bars are showing ± Standard error of mean.
3.2.6 Ca++/Na+ ratio in leaf sap
The data associated to variations in Ca++/Na+ ratio of different barley genotypes under salt stress is shown in (Fig. 7). Graph evidently shows response of different salinity levels on Ca++/Na+ ratio concentrations of barley and it was also statistically highly non-significant (p ≤ 0.01). Salinity affected Ca++/Na+ ratio in all the genotypes of barley compared to controlled treatments. However, variations in Ca++/Na+ concentrations were witnessed due to genetic variations in barley genotypes. Due to salinity, Ca++/Na+ ratio concentration of all genotypes was increased compared to control. At salinity stress of 100 mM, minimum Ca++/Na+ ratio (0.11) was observed in Dayton genotype while maximum Ca++/Na+ ratio (0.14) was recorded in ZUG-293 genotype (Fig. 7). At salinity stress of 200 mM, maximum Ca++/Na+ ratio (0.12) was observed in B-15035 genotype while minimum Ca++/Na+ ratio (0.10) was recorded in B-15018 genotype. Decline in Ca++/Na+ ratio due to salt stress was also stated by Askari et al. (2016) and Parida et al. (2016).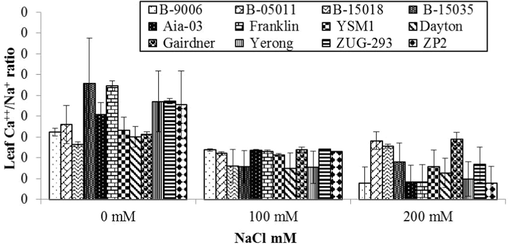
Variations in Ca++/Na+ ratio in leaf sap of different genotypes of barley to different level of salinity under hydroponics conditions. Error bars are showing ± Standard error of mean.
4 Conclusion
It can be concluded from the above experiment that tolerant barley varieties effectively restricted the entry of Na+ ion into their leaves, however, efficiently maintained K+ concentration, whereas, sensitive genotypes were badly affected by salt stress and cannot regulate K+ ion uptake. The K+/Na+ ratio is the key factor which clearly signifies the tolerant and sensitive varieties. The barley varieties B-9006, B-15018, Yerong and Aia-03 are found to be the most tolerant from the above 12. The first effect of salinity on plant growth and development is osmotic effect and it was found that B-15018 showed higher percentage of RLWC under saline conditions. Yerong and B-9006 exhibited maximum SPAD values and B-9006 expressed higher root-shoot fresh weights and number of tillers plant-1 under 100 mM NaCl stress. These genotypes showed higher values of K+/Na+ ratio under both (100 and 200 mM NaCl) stress levels.
CRediT authorship contribution statement
Qurat-Ul-Ain Sadiq: Writing – review & editing, Writing – original draft, Visualization, Validation, Supervision, Software, Methodology, Investigation, Formal analysis, Data curation, Conceptualization. Muhammad Nazim: Writing – review & editing, Visualization, Validation, Supervision, Resources, Methodology, Investigation, Formal analysis, Data curation, Conceptualization. Tanveer ul haq: . Mehak Fatima: . Abida Hussain: . Muqarrab Ali: . Bhupendra Mathpal: Writing – review & editing, Visualization, Validation, Resources. Mona S. Alwahibi: Visualization, Validation, Supervision, Resources, Project administration, Investigation, Funding acquisition, Conceptualization.
Acknowledgement
Authors acknowledge the support of Department of Soil and Environmental Sciences, MNS- University of Agriculture Multan-Pakistan for offering the research facilities during the course of investigation of this research. The authors extend their appreciation to the Researchers supporting project number (RSP2024R173), King Saud University, Riyadh, Saudi Arabia.
Declaration of competing interest
The authors declare that they have no known competing financial interests or personal relationships that could have appeared to influence the work reported in this paper.
References
- Influence of salinity stress on PSII in barley (Hordeum vulgare L.) genotypes, probed by chlorophyll-a fluorescence. J. King Saud Univ.-Sci.. 2021;33(1):101239
- [Google Scholar]
- Comparative efficacy of different salt tolerant rhizobial inoculants in improving growth and productivity of (Vigna radiata L.) under salt stress. Sci. Rep.. 2023;13(1):17442.
- [Google Scholar]
- Salinity induced physiological and biochemical changes in plants: An osmic approach towards salt stress tolerance. Plant Physiol. Biochem.. 2020;156:64-77.
- [Google Scholar]
- Salt tolerance assessment of barley (Hordeum vulgare L.) genotypes at germination stage by tolerance indices. Open Agric.. 2016;1:1-7.
- [Google Scholar]
- Identification of QTLs Associated with Agronomic and Physiological Traits under Salinity Stress in Barley. J. Agric. Sci. Technol.. 2017;19:185-200.
- [Google Scholar]
- Growth performance, nutrient utilization and carcass characteristics of sheep fed hydroponic barley fodder. Anim. Nutr. Feed Technol.. 2020;20(2):321-331.
- [Google Scholar]
- Review of crop response to soil salinity stress: Possible approaches from leaching to nano-management. Soil Systems. 2024;8(1):11.
- [Google Scholar]
- Polyamines mitigate the destructive impacts of salinity stress by enhancing photosynthetic capacity, antioxidant defense system and upregulation of calvin cycle-related genes in rapeseed (Brassica napus L.) Saudi J. Biol. Sci.. 2022;29(5):3675-3686.
- [Google Scholar]
- Drivers of soil salinity and their correlation with climate change. Curr. Opin. Environ. Sustain.. 2021;50:310-318.
- [Google Scholar]
- Study of tolerance and phytodesalination potential of wheat, oat, emmer, and barley for sustainable saline agriculture. Appl. Ecol. Environ. Res.. 2023;21(5)
- [Google Scholar]
- Evaluation of performance of different barley genotypes irrigated with saline water in South Tunisian Saharan conditions. Environ. Experimental Biol.. 2016;14(1)
- [Google Scholar]
- Foliar application of ascorbic acid enhances salinity stress tolerance in barley (Hordeum vulgare L.) through modulation of morpho-physio-biochemical attributes, ions uptake, osmo-protectants and stress response genes expression. Saudi J. Biol. Sci.. 2021;28(8):4276-4290.
- [Google Scholar]
- Global predictions of primary soil salinization under changing climate in the 21st century. Nat. Commun.. 2021;12(1):6663.
- [Google Scholar]
- The water-culture method for growing plants without soil. Cir. Calif. Agric. Exp. Stn.. 1950;2:347-349.
- [Google Scholar]
- Stress salinity in plants: New strategies to cope with in the foreseeable scenario. Plant Physiol. Biochem.. 2024;108507
- [Google Scholar]
- Effect of different salinity on seed germination, growth parameters and biochemical contents of pumpkin (Cucurbita pepo L.) seeds cultivars. Sci. Rep.. 2024;14(1):6929.
- [Google Scholar]
- Effects of salinity stress on physiological performance of various wheat and barley cultivars. J. Plant Nutr.. 2014;37:520-531.
- [Google Scholar]
- Salinity stress tolerance and omics approaches: revisiting the progress and achievements in major cereal crops. Heredity. 2022;128(6):497-518.
- [Google Scholar]
- Salinity tolerance in wheat: responses, mechanisms and adaptation approaches. Appl. Ecol. Environ. Res.. 2023;21(6)
- [Google Scholar]
- Effect of salt stress on photosynthesis and physiological parameters of three contrasting barley genotypes. Photosynthetica. 2018;56:549-556.
- [Google Scholar]
- Soil salinity under climate change: Challenges for sustainable agriculture and food security. J. Environ. Manage.. 2021;280:111736
- [Google Scholar]
- Genome-wide association study of salinity tolerance during germination in barley (Hordeum vulgare L.) Front. Plant Sci.. 2020;11:118.
- [Google Scholar]
- Physiological and biochemical evaluation of barley (Hordeum vulgare L.) under salinity stress. J. Agric. Sci. Technol.. 2020;22(4):1009-1021.
- [Google Scholar]
- Physiological, anatomical and metabolic implications of salt tolerance in the halophyte (Salvadora persica L.) under hydroponic culture condition. Front. Plant Sci.. 2016;7:351-357.
- [Google Scholar]
- Effect of methyl jasmonate in alleviating adversities of water stress in barley genotypes. Int J Farm Allied Sci. 2015;4(2):111-118.
- [Google Scholar]
- Barley phytochemicals and health promoting benefits: A comprehensive review. J. Agric. Food Res.. 2023;14:100677
- [Google Scholar]
- Drought and salinity stresses in barley: consequences and mitigation strategies. Aust. J. Crop Sci.. 2019;13(6):810-820.
- [Google Scholar]
- Principles and Procedures of Statistics: A Biometrical Approach. Singapore: McGraw Hill Book International Co.; 1997.
- Chitosan modulated antioxidant activity, inorganic ions homeostasis and endogenous melatonin to improve yield of (Pisum sativum L.) accessions under salt stress. Scientia Horticult.. 2024;323:112509.
- [Google Scholar]
- Physiological responses of wild and cultivated barley to the interactive effect of salinity and iron deficiency. Isrn.agron.. 2012;5:1-8.
- [Google Scholar]
- Regulation of photosynthesis under salt stress and associated tolerance mechanisms. Plant Physiol. Biochem.. 2022;178:55-69.
- [Google Scholar]
- Comparison of biochemical, anatomical, morphological, and physiological responses to salinity stress in wheat and barley genotypes deferring in salinity tolerance. Agronomy. 2020;10(1):127.
- [Google Scholar]


