

Translate this page into:
ISSRs profiles and protein patterns related to yield and yield compositions in several bread wheat genotypes growing under thermal stress
⁎Corresponding author. esam@oiu.edu.sd (Esam M. Mohamedahmed),
-
Received: ,
Accepted: ,
This article was originally published by Elsevier and was migrated to Scientific Scholar after the change of Publisher.
Abstract
Objectives
Six wheat cultivars (Triticum aestivum L.) from the Sudan collection were studied for their capacity to withstand thermal stress, depending on protein and ISSR markers profiling.
Methods
Yield and yield components were determined under different sowing dates applied through a field experiment for season 14/2015. Both the DNA and protein patterns were profiled using inter-simple sequence repeats (ISSRs) and sodium dodecyl sulphate (SDS-PAGE) markers, respectively.
Results
The cultivars showed the same protein profile under the three treatments, indicating no association between the detected protein patterns (144 bands) and responses to different sowing dates. 415 fragments of DNA were generated by the six ISSR primers, of which 64.5 % were polymorphic. Values for polymorphism information content (PIC) were determined and ranged from 0.11 to 0.73. Three of the alleles that were detected for the Argine cultivar at late sowing may be considered candidates for heat stress tolerance.
Conclusion
According to the findings of this study, cultivar Argine is the most heat-tolerant of the six cultivars studied and may be useful for wheat breeding strategies, whereas cultivar Condor may be grown in regions where the winter season is shorter or the sowing date is delayed. ISSR markers were found to be more efficient in estimating the variability within wheat cultivars compared with SDS-PAGE protein profiles.
Keywords
Wheat
Heat stress
SDS-PAGE
ISSR

1 Introduction
One of the most important and widely consumed cereal crops worldwide is wheat (Triticum aestivum L). More than 30 % of people worldwide use it as their major source of nutrition, and it provides roughly 20 % of their daily caloric needs (Mohamedahmed et al., 2021, Lastochkina and Bosacchi, 2023). Usually, wheat is cultivated where cool temperatures prevail, but due to the increasing demand for human consumption, its cultivation has been expanding into areas considered improper for the best development of the crop. It often includes lower-latitude areas where thermal stress is the primary constraint to grain production (Pimentel et al., 2015). Although traditional plant breeding has been successful for crop improvement, molecular breeding has provided additional modern methods to improve desirable traits as well as reduce time and cost. Molecular marker technology gives a wide range of new approaches to improving selection strategies. They are likely to be extremely valuable in breeding programmes for characterizing and estimating the genetic variation in germplasm (Jain and Parihar, 2019). Studies have demonstrated that ISSRs are technically simple, affordable, quick, require a tiny amount of DNA, and do not require knowledge of the sequencing primer information in advance (Nordiana et al., 2014, Azizi et al., 2021). Therefore, among the molecular markers, ISSR markers may be helpful for distinguishing the genetic variety of bread wheat genotypes and effective for figuring out wheat germplasm intercorrelation (El-Esawi et al., 2023). Additionally, seed protein electrophoresis patterns have been effectively used to establish the taxonomic, evolutionary connections between crops, their wild relatives, and identify genetic homology at the molecular level. They can also be employed to differentiate between cultivars of specific crop species. Due to its efficiency and ease. SDS-PAGE is extensively used for describing the genetic structure of crop germplasm because it is simple and effective (Hayee, et al., 2020). Mature kernels of wheat have a protein content of 8–16 %, of which 80–85 % is gluten, made up of 40 % gliadins and 40 % glutenin subunits. SDS-PAGE can separate glutenins into high-molecular-weight glutenin subunits (HMW-GS) and low-molecular-weight glutenin subunits (LMW-GS), which are two of the most important quality factors (Mihalikova et al., 2016). According to Patil et al. (2015), the total GS is composed of 30 % LMW-GS and 10 % HMW-GS. Alleles of individual LMW-GS have significance in wheat breeding (Cho et al., 2021).
This study's goal was to investigate the impact of heat stress on six bread wheat cultivars (Triticum aestivum L.) using protein and DNA profiling with SDS-PAGE and ISSR markers, respectively. Cultivar with superior performance would be recommended for future heat stress tolerance breeding programs.
2 Materials and methods
Six wheat (Triticum aestivum L.) cultivars obtained from the Wheat Research Program of the Agricultural Research Corporation (ARC), Sudan, were evaluated in a field experiment in season 14/2015 on the demonstration farm of the College of Agriculture, University of Khartoum, Sudan. These were (Table 1): Argine, Debeira, Sasaraib, Condor, Elneelain, and Wadielneel. Different sowing dates (7 November, 22 November, and 7 December) were applied. Four replications were used in the split-plot design of the experiment.
Cultivar
Origin
Release date
Pedigree
Condor
Australia
1978
Pintospteccoz/Nainari60/4/2*LernaRajo/Norin10/Bervor(selen14)
Debeira
India
1882
HybridDelhi160/Tobri/23854/3Niari60/ Titmouse/Sonora64/4/1ermaRajo/ sonora64
Sasaraib
Mexico
1982
Karkz/Buho//Kalyasona/Blue Bird = Veery5
Wadielneel
Egypt
1987
Chenab 70/Giza 155
Elneelain
Mexico
1990
S948-A1/7*Santa Elena
Argine
Local cross (Sudan)
1996
Povan“s” x Condor “s”
2.1 Yield and yield components
Days to heading were calculated from sowing to 50 % heading of plants.
At maturity, spikes were cut and threshed manually. The number of spikes per m2 was calculated from the net area (0.5 × 0.5 m). Kernels per spike and the 1,000-grain weight were determined from a sub-sample of ten spikes selected at random from the same area. The grain’s yield (g/m2) was then calculated as follows:
2.2 SDS-PAGE electrophoresis for proteins
2.2.1 Protein extraction
After grinding the wheat's grains to a fine powder, 0.05 g of this was put into a 1.5 ml Eppendorf tube. The tube was then filled with 400 l of protein extraction buffer, which contained 5 M urea, 0.4 M SDS, 1.5 % 2-Mercaptoethanol, and 0.05 M Tris-HCL buffer (PH 8.0). The material was combined for 10 min in a vortex mixer and then centrifuged for 10 min at room temperature at 12000 rpm. SDS-polyacrylamide gel electrophoresis was used to size-fractionate the isolated protein (in the supernatant).
2.2.2 SDS-PAGE of extracted proteins
SDS-PAGE electrophoresis was used to analyze the variability of seeds storage proteins using the Laemmli method (1970).
2.3 Evaluation of wheat cultivars' genetic diversity
The genetic variation in the wheat cultivars was identified and determined using inter-simple sequence repeat (ISSR) markers.
2.3.1 Extraction of genomic DNA
A modified CTAB method suggested by Mace et al. (2003) was used to extract complete DNA from fresh leaves of each cultivar (under various planting dates).
2.3.2 Amplification of extracted DNA using ISSR markers
Wheat genomic DNA was amplified using six ISSR primers. The source of all primers was Macrogen Inc. in Seoul, Korea. The codes and sequences (5′-3′) of these primers are as follows:
1. UBC899:
CATGGTGTTGGTCATTGTTCCA
2. UBC828:
TGTGTGTGTGTGTGTGA
3. UBC878:
GGATGGATGGATGGAT
4. BT05:
AGAGAGAGAGAGAGAGAGAGT
5. BT10:
CACACACACACAGG
6. BT12:
CACACACACACACACAA
7. BT14:
CTCTCTCTCTCTCTCTCTCTA
2.3.3 Polymerase chain reaction (PCR)
Maxime PCR PreMix Kit (i-Taq) from iNtRoN was used to conduct the PCR amplification reactions (Cat. No.25025). The components of the PCR mix were dissolved in distilled water to a total volume of 20 µl including 1.5 µl of template DNA and 2 µl of primer.
2.3.4 PCR program for ISSR
DNA was amplified in a thermal cycler (Techne / Flerxigene) as follows:
95 °C for 5 min as initial denaturation, 35 denaturation cycles at 95 °C for 1 min, 1 min for annealing at 47 °C (some primers at 50 °C), 1 min of extension at 72 °C, followed by 7 min as a last extension at 72 °C.
2.3.5 Agarose gel electrophoresis
Products of amplification were electrophoresed in a 1.3 % agarose gel {1.3 g of agarose were dissolved in 100 ml of 0.5X TBE buffer (0.089 mol/L Tris-borate and 0.002 mM EDTA, pH 8)} (Sawada et al., 1995), and then 6 µl of ethidium bromide were added. An amount of 5 µl from each PCR products was loaded to the gel's wells. The molecular weight marker was a 1.5 kb DNA ladder (invetrogen). Gels have been run on 0.5X TBE buffer for 70 min at 80 V, then visualised in a transillumination cabinet, and the images were captured.
2.4 Statistical analysis
The MSTATC software carried out a statistical analysis of the agronomical data (Tables 2-4). ** = Highly significant difference. * = significant difference. NS = No significant difference. df = Degree of freedom. At p ≤ 0.05, means with distinct small- or upper-case letters in the same column* or raw**, respectively, are statistically different. At p ≤ 0.05, means with distinct small- or upper-case letters in the same column* or raw**, respectively, are statistically different.
Source of variation
df
Mean square
Days to heading
No. of spike/m2
Kernels per spike
1000-kernels weight
Grains yield
Sowing dates
2
34.125**
234.000 NS
188.431**
184.701**
2357.181NS
Cultivars
5
165.992**
3596.900*
90.914**
25.342*
7703.520**
Sowing × Cultivars
10
17.642**
1622.400 NS
37.531 NS
11.000 NS
2037.714 NS
Sowing dates
Early
Medium
Late
Mean
cultivar
DH
s/m2
K/S
DH
s/m2
K/S
DH
s/m2
K/S
DH
s/m2
K/S
Argine
65.25
140.50
33.25
63.75
112.00
31.25
63.00
124.00
27.75
64.00c
125.5ab
30.75a
Debeira
67.50
160.00
32.50
67.75
123.00
35.50
63.75
128.00
31.25
66.33d
137.00a
33.08a
Sasaraib
65.50
94.50
32.50
64.75
116.50
37.50
62.00
98.50
23.50
64.08c
103.17b
31.17a
Condor
54.00
164.00
26.50
57.25
139.00
30.00
58.25
117.50
31.50
56.50a
140.17a
29.33ab
Elneelain
61.00
93.00
25.25
64.75
92.50
30.50
60.75
131.50
22.50
62.17b
105.67b
26.08b
Wadielneel
70.25
83.50
25.25
66.00
116.50
29.75
63.75
109.00
24.50
66.67d
103.00b
26.50b
Mean**
63.92A
122.58B
29.21B
64.04A
116.58B
32.42A
61.92B
118.08B
26.83B
Sowing dates
Early
Medium
Late
Mean
Cultivar
KW
g/m2
KW
g/m2
KW
g/m2
KW
g/m2
Argine
36.42
174.70
27.98
110.80
34.08
116.65
32.83 a
134.05 ab
Debeira
31.63
164.98
26.10
111.43
32.75
136.32
30.16b
137.57 a
Sasaraib
30.58
95.72
26.75
115.03
33.20
77.43
30.17b
96.06 bc
Condor
35.15
162.75
29.73
119.80
36.45
131.02
33.77 a
137.86 a
Elneelain
32.10
81.00
31.30
86.93
33.67
98.30
32.36 ab
88.74c
Wadielneel
33.75
70.88
30.00
102.00
31.50
88.40
31.75 ab
87.09c
Mean**
33.27A
125.00B
28.74B
107.66B
33.61 A
108.02B
The bands of the ISSR and the SDS-PAGE were graded as present (1) or absent (0) and were handled separately. Similarities between cultivars were analysed based on their scores. The data was used as a matrix for genetic relationship analysis by the PAST program. Dendrograms were constructed according to the Jaccard similarity coefficient utilizing the unweighted pair group with arithmetic mean (UPGMA) technique as defined by Michener and Sokal, 1958. Percentages of polymorphism were indicated for each primer used, and the values of polymorphism information content (PIC) were counted as described by Anderson et al. (1993). PIC = 1- ∑ Pij2
in which Pij represents the frequency of the jth allele for the ith ISSR location, and summing covers every allele. PIC values of markers are considered slightly informative when they are less than 0.25; over 0.50 is highly informative; and they are informative between 0.25 and 0.50 (Botstein et al., 1980).
3 Result
3.1 Yield
No significant variation in grain yield (g/m2) was found across sowing dates, although extremely significant differences (p ≤ 0.01) were seen between cultivars. A high grain yield was recorded for Condor, Debeira, and Argine (Table 4). Argine had a good performance in grain yield, while Condor had the best performance during late planting.
3.2 Molecular analysis
3.2.1 SDS-PAGE
Protein profiling utilizing SDS-PAGE analysis was conducted to identify the protein profile of each of the six wheat cultivars under three different sowing dates. A total of 144 bands, corresponding to HMW-GS and LMW-GS, were observed among the eighteen treatments (6 cultivars × 3 sowing dates), with an average of eight bands per treated cultivar (Fig. 1). HMW-GS ranged between 135 and 85 kilo Daltons (kDa), while LMW-GS was in the range of 75–28 kDa. Each cultivar showed the same protein profile under the three treatments indicating no association between the detected protein profile and response to different sowing dates.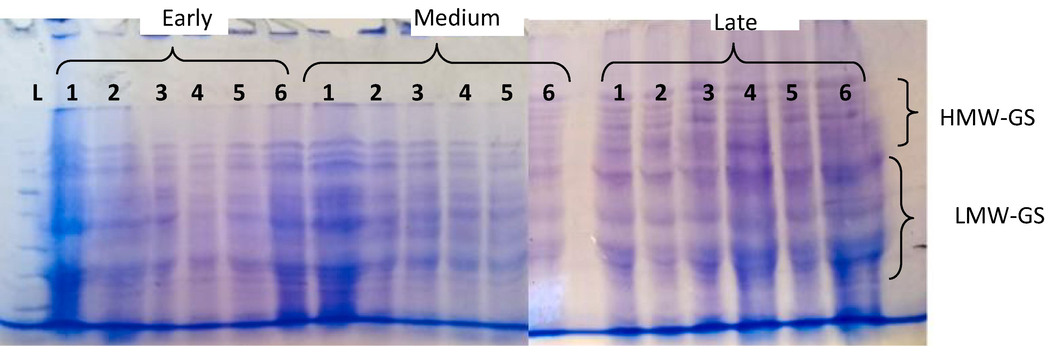
SDS-PAGE separating of HMW-GS and LMW-GS from different wheat cultivars sown at different dates (early, medium and late). Lanes: L = Ladder; 1–6 = cultivars as follows: 1 = Argine, 2 = Debeira, 3 = Sasaraib, 4 = Condor, 5 = Elneelain and 6 = Wadielneel.
3.2.2 ISSR markers analysis
Results of ISSRs analysis are shown in Fig. 2. Six out of seven (85.7 %) primers produced fragments of different sizes with one or more of the tested cultivars. No amplification product was discovered for the primer UBC828. The six primers produced a total of 415 DNA fragments, ranging in size from 220 to 1500 bp. The number of bands generated by the tested primers was between two (for primer BT05) and ten (for primer BT12), with 5.2 bands on average for each primer. As is clear from Table 5, 64.5 % out of 415 detected fragments were polymorphic, and the percentage of polymorphism scored for individual primers ranged from 100 (recorded for primer BT05) to 40 % (for primer BT12). The values for the polymorphism information content (PIC) calculated ranged from 0.11 (for primer BT05) to 0.73 (for primer BT14). The highest number of amplified fragments (27) per treated cultivar for all of the tested ISSR primers was recorded for Elneelain under late sowing, while the lowest (19) were detected for Argine when sown early and Wadielneel under medium sowing.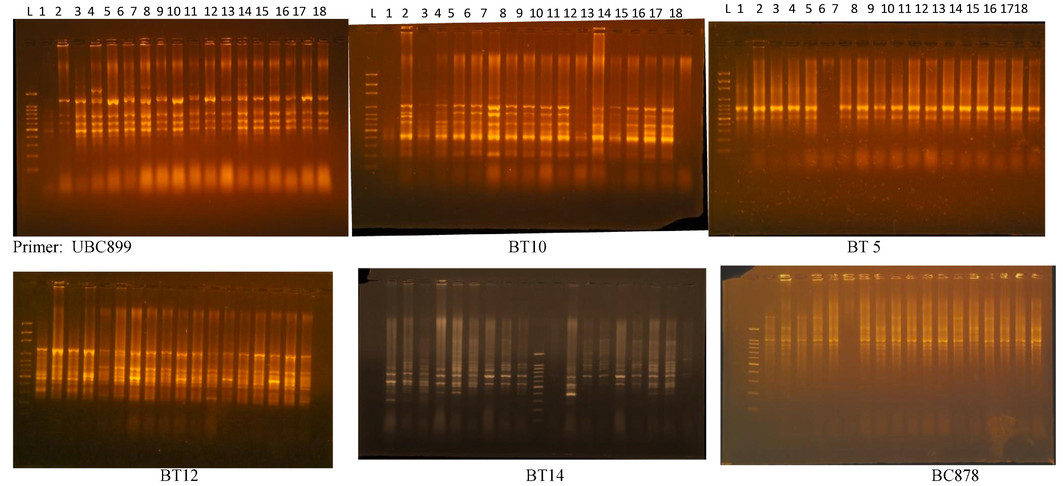
ISSR banding profiles of six wheat cultivars, sown at different sowing dates (early, medium and late), genomic DNA amplified by some primers. Lanes: L = Ladder, 1 = Argine ES, 2 = Debeira ES, 3 = Sasaraib ES, 4 = Condor ES, 5 = Elneelain ES, 6 = Wadielneel ES. 7 = Argine MS, 8 = Debeira MS, 9 = Sasaraib MS, 10 = Condor MS, 11 = Elneelain MS, 12 = Wadielneel MS, 13 = ArgineLS, 14 = Debeira LS, 15 = Sasaraib LS, 16 = Condor LS, 17 = Elneelain LS and 18 = Wadielneel LS. ES = Early sowing; MS = Medium sowing; LS = Late sowing.
Primers
Total bands produced
Total polymorphic bands
Percentage of polymorphism
PIC
UBC878
3
2
66.7
0.31
UBC899
5
3
60
0.36
BT05
2
2
100
0.11
BT10
5
4
80
0.29
BT12
10
4
40
0.46
BT14
6
5
83.3
0.73
Total
31
20
64.5
4 Discussion
A high grain yield was recorded for Condor, Debeira, and Argine due to the high density of spikes per square meter, the high density of grains per spike, and a heavier kernel weight as well. These results reflected the efficiency of these cultivars to achieve high productivity. Argine had a good performance in grain yield, while Condor had the best performance during late planting, probably because of its early maturity and its escape from heat stress or due to its efficiency in tolerating heat stress. The high molecular weight of protein subunits in this study is within the range reported by Shin et al. (2020). Similarly, Mihalikova et al. (2016) discovered an HMW-GS in the 136–92 kDa range and an LMW-GS in the 85–30 kDa range. The application of the protein electrophoresis method is an important tool for defining the genetic makeup of crop germplasms, However, using conventional electrophoretic techniques, it is frequently challenging to identify minute variations between individual subunits (Nucia et al., 2019). It is expected that bread wheat contains up to six distinct HMW-GS. In reality, the majority of bread wheat varieties only have three, four, or five subunits because some genes are silenced. (Gao et al., 2018). A previous study of some wheat lines showed identical HMW-GS composition (Xiang et al., 2019). Furthermore, the characterization of LMW-GS is difficult, mainly due to their mutagenic nature and poor solubility following reduction of the intermolecular disulfide bonds (Zang et al., 2022). Lee et al. (2017) reported, Although SDS-PAGE is a quick and relatively easy technique for analyzing the LMW-GS composition, the similar protein mobilities make it hard to distinguish specific alleles. While the lowest size of ISSR bands (220 bp) is similar to that obtained by Goyal et al. (2015) for 14 wheat genotypes using ISSRs), the average (5.2) of bands is less than that found by them. Three of the alleles that were detected for the cultivar Argine only at late sowing may be considered candidates for heat stress tolerance. In addition, such an outcome is consistent with the superior results for yield components reported for this cultivar. So this cultivar could be considered the most heat-tolerant among the all cultivars under study. Primer BT14 produced unique, different-sized fragments (300 bp), particularly with cultivar Argine at early sowing. Such a unique fragment may be used to characterize and identify its respective cultivar (positive marker). Usually, treated cultivars without a common band are referred to as “negative primers” and could also be used as a discriminating feature. Two negative fragments were observed for the cultivar Argine at early sowing using primer UBC899 (730 bp) and for the cultivar Wadielneel at early sowing using primer BT05 (750 and 500 bp). The variability in polymorphism may be attributed to cultivars and primer types. El-Esawi et al., (2023) reported, because ISSR markers are so effective, only two primers were needed to differentiate several wheat cultivars under study. The values for the polymorphism information content (PIC) calculated (0.11 to 0.73) were more than what reported by Motawea et al. (2015) (0.08 to 0.28) using ISSR in bread wheat and differ from Mehdiabadi et al. (2015) (0.15 to 0.39). The variable nature of the wheat accessions and/or the highly informative ISSR primers may be blame for the moderate values of PIC for the ISSR primers (Khaled et al., 2015).
5 Conclusions
-
The best studied cultivars for grain yield are Condor, Debeira, and Argine.
-
There is an indicator that cultivar Argine is containing heat tolerance gene, so it can be recommended for heat stress tolerance breeding programs.
-
ISSR markers are more efficient at estimating the variability within wheat cultivars compared with SDS-PAGE.
-
Wheat growers and breeders should be aware of how heat affects yield; therefore, the suitable sowing date should not be missed during the growing season.
Acknowledgment
Thanks to Dr. Abdul Wahab Abdullah, Faculty of Agriculture, University of Khartoum, for assistance during the field experiment.
Declaration of competing interest
The authors declare that they have no known competing financial interests or personal relationships that could have appeared to influence the work reported in this paper.
References
- Construction of genetic linkage map in human using Restriction Fragment Length Polymorphism. Am. J. Hum. Genet.. 1980;32:314-331.
- [Google Scholar]
- Proteomic Determination of Low-Molecular-Weight Glutenin Subunit Composition in Aroona Near-Isogenic Lines and Standard Wheat Cultivars. Int. J. Mol. Sci.. 2021;22(14):7709.
- [CrossRef] [Google Scholar]
- Analysis of Genetic Diversity and Phylogenetic Relationships of Wheat (Triticum aestivum L.) Genotypes Using Phenological, Molecular and DNA Barcoding Markers. Genes. 2023;14:34.
- [CrossRef] [Google Scholar]
- Effects of HMW-GS Ax1 or Dx2 absence on the glutenin polymerization and gluten micro structure of wheat (Triticum aestivum L.) Food Chem.. 2018;240:626-633.
- [CrossRef] [Google Scholar]
- Application of inter simple sequence repeat markers to analyze molecular relationships in wheat (Triticum aestivum L. em. Thell) Agric. Sci. Digest.. 2015;35:195-198.
- [Google Scholar]
- Hayee, S.A., Rizwan, S., Sajjad, A., Jabeen, U., Bashir, F., Mushtaq, A., Behli, F., Anjum, S., Ismail, T., Hafeez, I., 2020. Seed storage protein electrophoretic profile among popular cultivars of date palm (Phoenix dactylifera L.) 49.https://doi.org/10.3329/bjb.v49i4.52540.
- Jain, A., Parihar, DK., 2019. Molecular marker based genetic diversity study of wild, cultivated and endangered species of Curcuma from Chhattisgarh region for in situ conservation. Biocatal Agric Biotechnol 2019; 18: 101033. https://doi.org/10.1016/j.bcab.2019.101033.
- Identification of ISSR and RAPD markers linked to yield traits in bread wheat under normal and drought conditions. J. Genet. Eng. Biotechnol.. 2015;13(2):243-252.
- [CrossRef] [Google Scholar]
- Cleavage of structural proteins during the assembly of the head of bacteriophage T4. Nature. 1970;227:680-685.
- [Google Scholar]
- Lastochkina, O. and Bosacchi, M. 2023. Potential roles of plant growth-promoting microbes in wheat adaptation and tolerance to herbicide and drought stress combination. Turkish Journal of Agriculture and Forestry: Vol. 47: No. 5, Article 10. https://doi.org/10.55730/1300-011X.3121.
- Allelic analysis of low molecular weight glutenin subunits using 2-DGE in Korean wheat cultivars. Breed. Sci.. 2017;67(4):398-407.
- [CrossRef] [Google Scholar]
- A high throughput DNA extraction protocol for tropical molecular breeding programs. Plant Mol. Biol. Reporter. 2003;21(4):459-460.
- [Google Scholar]
- Evaluation of genetic diversity in durum wheat advanced lines. Biological Forum-an International J.. 2015;7(1):236-240.
- [Google Scholar]
- Polymorphism of protein in selected Slovak winter wheat genotypes using SDS-PAGE. J. Central Eur. Agric.. 2016;17(4):970-985.
- [Google Scholar]
- Mohamedahmed, E. M., El Siddig, M. A., El Hussein, A. A., Mohammedali, M. A., 2021. Agro-morphologic characters and Protein Content of some wheat (Triticum aestivum L.) Cultivars grown at Different sowing dates in Sudan. University of Khartoum Journal of Agricultural sciences. Vol 29(1), 81-104.
- ISSR markers-trait associations and stability analysis in bread wheat varieties. Plant Breed. Biotech.. 2015;3:167-177.
- [Google Scholar]
- Evaluation of inter-simple sequence repeat (ISSR) markers for genetic mapping of an oil palm interspecific hybrid mapping population. J. Oil Palm Res.. 2014;26:214-225.
- [Google Scholar]
- Characterization of HMW glutenin subunits in European spring common wheat (Triticum aestivum L.) Genet Resour Crop Evol. 2019;66:579-588.
- [CrossRef] [Google Scholar]
- Genetic variation in glutenin protein composition of aestivum and durum wheat cultivars and its relationship with dough quality. Int. J. Food Prop.. 2015;18:2393-2408.
- [Google Scholar]
- Characterization of heat tolerance in wheat cultivars and effects on production components. Revista Ceres. 2015;62:191-198.
- [Google Scholar]
- PCR detection of Ti and Ri plasmids from phytopathogenic Agrobacterium strains. Appl. Environ. Microbiol.. 1995;61(2):828-831.
- [Google Scholar]
- Rapid and Easy High-Molecular-Weight Glutenin Subunit Identification System by Lab-on-a-Chip in Wheat (Triticum aestivum L.). Plants (Basel. Switzerland). 2020;9(11):1517.
- [CrossRef] [Google Scholar]
- Enriching LMW-GS alleles and strengthening gluten properties of common wheat through wide hybridization with wild emmer. 3. Biotech. 2019;9(10):355.
- [CrossRef] [Google Scholar]
- Recent Advances in the Study of Wheat Protein and Other Food Components Affecting the Gluten Network and the Properties of Noodles. Foods (basel, Switzerland). 2022;11(23):3824.
- [CrossRef] [Google Scholar]


