

Translate this page into:
Isolation and characterization of the lytic bacteriophages and their application in combination with amoxicillin against Aeromonas dhakensis
⁎Corresponding author. onanong@g.swu.ac.th (Onanong Pringsulaka) opringsulaka@gmail.com (Onanong Pringsulaka)
-
Received: ,
Accepted: ,
This article was originally published by Elsevier and was migrated to Scientific Scholar after the change of Publisher.
Abstract
Aeromonas dhakensis stands out as the most potent Aeromonas species causing a range of human diseases. This research marks the pioneering effort in isolating and characterizing virulent phages targeting A. dhakensis. Only the AM isolate among the Aeromonas isolates showed compatibility for phage isolation and was identified as A. dhakensis. Computational analysis identified the presence of virulence factors and antimicrobial resistance genes in A. dhakensis AM. Phage isolation was conducted using this particular strain as the host, resulting in the isolation of four virulent phages: vB_AdhM_DL, vB_AdhS_TS3, vB_AdhM_TS9, and vB_AdhS_M4. Bacterial numbers significantly decrease after both pre-treatment and post-treatment with individual phages and phage cocktails, ranging from 2.82 to 6.67 log CFU/mL and 4.01 to 6.49 log CFU/mL, respectively. Combining a phage cocktail with sub-MIC amoxicillin led to complete inactivation in both pre-treatment and post-treatment scenarios within a 200 µL volume. The complete genomes of phages vB_AdhM_DL, vB_AdhS_TS3, and vB_AdhM_TS9 were determined to be 42,388 bp, 115,560 bp, and 115,503 bp, respectively. This study establishes the effectiveness of using phages as an complement with sublethal antibiotic concentrations, presenting a potential and effective therapeutic approach.
Keywords
Aeromonas dhakensis
Phage−antibiotic synergy
Phage therapy
Genome analysis

1 Introduction
Aeromonas dhakensis, a member of the Aeromonas genus, represents a significant pathogenic species with distinct characteristics and implications for human health. Prior to the identification of A. dhakensis, the most prevalent Aeromonas species included A. hydrophila, A. caviae, and A. veronii. However, A. dhakensis, formerly synonymous with A. hydrophila subsp. dhakensis (Huys et al., 2002) and A. aquariorum (Martinez-Murcia et al., 2008), presents a unique challenge in identification. Phenotypic methods often misidentify it as A. hydrophila (Beaz-Hidalgo et al., 2013), and 16S rRNA sequencing has been deemed unreliable for distinguishing Aeromonas species at the species level (Janda and Abbott, 2010). Despite these challenges, A. dhakensis has garnered increasing attention due to its capacity to cause a spectrum of infections in humans, including gastroenteritis, wound infections, bacteremia, skin and soft-tissue infections, and respiratory infections (Janda and Abbott, 2010; Beaz-Hidalgo et al., 2013).
A. dhakensis exhibits distinct geographic prevalence, primarily in hot climate countries like Bangladesh, Taiwan, Australia, Malaysia, and Thailand (Huys et al., 2002; Chen et al., 2014; Aravena-Roman et al., 2011; Puthucheary et al., 2012; Yano et al., 2015). A. dhakensis's enhanced virulence is attributed to its various virulence factors, including hemolysins and extracellular enzymes, contributing significantly to its invasiveness (Cascon et al., 2000). Clinical strains are found in various anatomical sites, from stool to blood and wounds (Chen et al., 2014). Antibiotics play a vital role in treating A. dhakensis infections, yet increasing resistance to agents like amoxicillin, cephalothin, and cefoxitin is concerning (Figueras et al., 2009). Additionally, the biofilm-forming ability of some strains complicates treatment by allowing adherence to surfaces, evading conventional medications. Given these challenges, exploring alternative treatments is crucial.
Bacteriophages are viruses that kill specific bacteria without disturbing other flora. Many studies have isolated phages against A. hydrophila and have determined their efficacy for protective and therapeutic effects against disease (Jun et al., 2015; Easwaran et al., 2017; El-Araby et al., 2016). However, there have been few reports on the isolation and characterization of lytic phages specific to A. dhakensis. The objective of this study was to isolate and characterize a new lytic phage from water that infects A. dhakensis. This study also investigated the lytic activity of the isolated phage and its combination with antibiotics against A. dhakensis in vitro.
2 Materials and methods
2.1 Isolation of Aeromonas
To isolate Aeromonas species, 30 samples were collected from different sources, including fishponds, canal water, and rivers in Bangkok, Thailand. The samples were streaked onto an Aeromonas isolation medium (HiMedia, India) supplemented with ampicillin. The plates were incubated for 24 h at 30 °C. The dark green colonies resembling Aeromonas sp. were selected. Gram-negative bacteria capable of degrading nitrates to nitrites, glucose fermenters, oxidase, and catalase-positive isolates resembling the genus Aeromonas were selected for 16S rRNA gene sequencing analysis. Other biochemical tests were used to differentiate between Aeromonas genera. L-arabinose fermentation was also differentiated between A. hydrophila and A. dhakensis. Likewise, salicin fermentation allowed differentiation between A. hydrophila and A. dhakensis from A. hydrophila subsp. ranae (Beaz-Hidalgo et al., 2013).
2.2 Identification of Aeromonas spp
The genomic DNA obtained from the Aeromonas isolate underwent extraction utilizing the AccuPrep® Genomic DNA Extraction Kit (Bioneer, Korea) and was employed as templates for PCR amplification. The 16S rRNA gene was amplified using a pair of universal primers, 27F (5′-AGAGTTTGATCCTGGCTCAG-3′) and 1492R (5′-GGCTACCTTGTTACGACTT-3′) as described by Lane (1991). Subsequently, the sequenced fragments were compared to the GenBank database through the Basic Local Alignment Search Tool (BLAST), and phylogenetic trees were constructed using the neighbor-joining method in the MEGA 5.1 software package.
2.3 Antimicrobial susceptibilities of Aeromonas isolates
Aeromonas isolates were underwent MIC testing using MIC test strips, which included amoxicillin, chloramphenicol, doxycycline, gentamicin, and tetracycline (Liofilchem® MTS™, Italy). The interpretative criteria were in accordance with the Clinical and Laboratory Standards Institute (CLSI) VET04 guidelines (CLSI, 2020).
2.4 Phage isolation and detection
The isolated Aeromonas strains served as hosts for bacteriophage isolation, following the method described by Sunthornthummas et al. (2017). The presence of phages was determined using the double-layer agar plate method on NA medium. Phage plaques were counted following an overnight incubation at 30 °C and expressed as plaque-forming units (PFU/mL).
2.5 Electron microscopy
Phage morphology was visualized by transmission electron microscopy (TEM) using carbon-formvar-coated grids, 1% (w/v) uranyl acetate staining (pH 4.5), and a TECNAI 20 TWIN transmission electron microscope operating at 120 kV with a magnification of 120,000×.
2.6 Host-range determination and determination of optimal multiplicity of infection (MOI)
The host range of the isolated phages was determined using the spot test method. Other reference strains of Aeromonas were tested for susceptibility to phages. Bacterial sensitivity to the phage was indicated by the presence of a plaque at the spot. Additionally, a host strain suspension (108 CFU/mL) in NB was mixed with the phage stock at four different ratios (0.01, 0.1, 1, and 10 PFU/CFU) to determine the optimal MOI. The ratio with the highest phage titer was considered the optimal MOI (Pringsulaka et al., 2011).
2.7 One-step growth curve experiments
A one-step growth curve for each phage isolate was performed as Sunthornthummas et al. (2017). The latent period, rise period, and burst size were calculated using the one-step growth curve (Adams, 1959).
2.8 pH and thermal stability
For the pH stability tests, NB was pre-adjusted to a range of pH values (pH 2.0–11.0). A phage suspension (1010 PFU/mL) was inoculated and incubated for 90 min at 30 °C. For thermal inactivation experiments, phage lysates (1010 PFU/mL) were subjected to heat treatment at 4, 30, 37, 45, 63, 72, and 100 °C in NB. The phage titer was determined using the double-layer agar plate method for both the pH stability tests and thermal inactivation experiments.
2.9 Whole genome sequencing and computational analyses
2.9.1 DNA extraction and sequencing
Genomic DNA of Aeromonas sp. AM was extracted using an AccuPrep Genomic DNA Extraction Kit (Bioneer, Daejeon, Korea). Phage DNA was isolated as previously described (Sunthornthummas et al., 2017). The purified genomic DNA was sent to the Beijing Genomics Institute (BGI) in China for short-read sequencing.
2.9.2 Genome assembly and annotation
De novo assembly of Aeromonas sp. AM and three phage genome sequences were constructed using SPAdes 3.12 (Bankevich et al., 2012). The examination of read quality was conducted using FASTQC (Brown et al., 2017), and trimming was performed using Trimmomatic 0.39 (Bolger et al., 2014). Functional annotation was performed using Prokka v1.14 (Seemann, 2014).
2.9.3 Bioinformatics analyses
Nucleotide and amino acid sequences were compared using Blastn software. Translated open reading frames (ORFs) were compared to the non-redundant GenBank protein database using the Blastp software. To further improve the annotation of predicted proteins, we utilized tools such as the hhpred server (https://toolkit.tuebingen.mpg.de/tools/hhpred). Additionally, the genomic DNA of A. dhakensis AM and three phages was screened for the presence of virulence genes using the Virulence Factors of Pathogenic Bacteria (VFDB) (Liu et al., 2022a), PlasmidFinder 2.1 (Carattoli et al., 2014), Comprehensive Antibiotic Resistance Database (CARD) databases (Alcock et al., 2020), and PHASTER was used to identify prophages in bacterial genomes (Zhou et al., 2011). The genome of Aeromonas sp. AM and the three phages were visualized using the CGView webserver (https://beta.proksee.ca/) (Grant and Stothard, 2008).
2.9.4 Accession numbers
The genome sequences of A. dhakensis AM were deposited in the NCBI database under accession number JAPHNH000000000, and the genome sequences of phage vB_AdhS_TS3, vB_AdhM_TS9, and vB_AdhM_DL were deposited in the NCBI database under accession number OP820700, OP820701, and OP820702, respectively.
2.10 A. dhakensis growth inhibition by single phage and phage cocktail in vitro
Phage therapy was divided into two treatments: pre- and post-treatment. In the pre-treatment experiment, phages or phage cocktail were added before inoculation with A. dhakensis AM (1 × 10⁸ CFU/mL), resulting in MOIs of 0.1, 1, and 10. In the post-treatment experiment, A. dhakensis AM suspensions (1 × 10⁸ CFU/mL) were inoculated into NB and incubated for 3 h. Equal volumes of phages or phage cocktail were added at MOIs of 0.1, 1, and 10. Both treatments were performed in a 250 mL Erlenmeyer flask containing 50 mL of NB at 200 rpm and incubated at 30 °C for 48 h. For each assay, two control samples were set: the bacterial control and the phage control. The bacterial control was inoculated with A. dhakensis but not phages, and the phage controls were inoculated with phages but not bacteria. The control and test samples were incubated under the same conditions. Aliquots of the test samples and their controls were sampled at 0, 6, 12, and 24 h of incubation. In all assays, phage titer was determined in triplicate using the double-layer agar plate method. The bacterial concentration was determined in triplicate in the NA medium. Three independent experiments were performed for each condition.
2.11 A. dhakensis growth inhibition by phage cocktail and antibiotics combination
The inhibitory effects of the selected two-phage cocktail with effective MOIs in combination with antibiotics at sub-MIC (1/2 MIC) were determined as previously described. In the pre-treatment experiment, a combination of the selected two-phage cocktail with effective MOIs and amoxicillin at sub-MIC was added before inoculation with A. dhakensis AM (1 × 10⁵ CFU/mL). In the post-treatment experiment, A. dhakensis AM suspensions (1 × 10⁵ CFU/mL) were inoculated into NB and incubated for 3 h. Equal volumes of the selected three-phage cocktail with effective MOIs and amoxicillin at sub-MICs were added. Only the phage cocktail and antibiotics at MIC were also administered in both pre-and post-treatment. Phage and bacterial counts were determined in NB in two different volumes: 200 μL in 96-well microtiter plates and 20 mL in 250 mL Erlenmeyer flasks. The latter was incubated on an orbital shaker with a shaking speed of 200 rpm. After incubation at 30 °C, the aliquots of each sample and their controls were collected every 6 h for 48 h and were serially diluted to determine viable bacteria (CFU/mL) in NA plates incubated for 24 h at 30 °C.
2.12 Statistical analysis
Statistically significant differences in all experiments were determined by one-way analysis of variance (ANOVA), and post-hoc Tukey’s test was applied to illustrate significant differences between bacterial concentrations between treatment groups over time. A p-value < 0.05 was considered to indicate statistical significance. SPSS statistical software package (version 13.0) was used for all analyses.
3 Results and discussion
3.1 Aeromonas isolation and identification
Three of the 40 isolates from 30 collection sites were preliminarily identified as Aeromonas by biochemical tests. These Aeromonas strains were then used as hosts for phage isolation. However, only the Aeromonas isolate AM was able to isolate phages using the enrichment technique. The isolated AM was further characterized using 16S rRNA gene sequencing, revealing a 99% identity with A. dhakensis. The neighbor-joining tree indicated that strain AM was most closely related to A. dhakensis (Fig. 1). The biochemical tests of A. dhakensis AM are shown in Table 1. To distinguish A. dhakensis from A. hydrophila subsp. hydrophila and A. hydrophila subsp. ranae, the results confirmed that strain AM was negative for L-arabinose and positive for salicin fermentation, confirming its classification as A. dhakensis. Furthermore, for more comprehensive characterization, a whole genome sequence analysis of strain AM was included in this study. + represents positive, − represents negative, and F represents fermentation.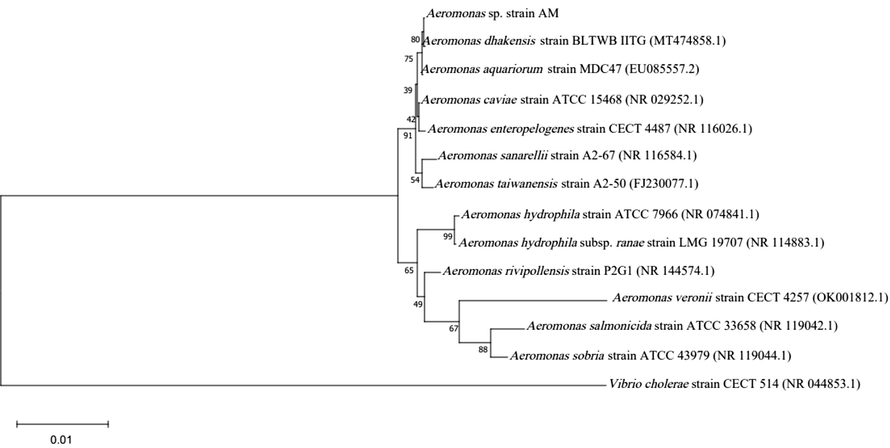
Phylogenetic tree of Aeromonas spp. based on the 16S rRNA gene using neighbor-joining method. Bootstrap values (%) of 1000 replicates are represented on the branches.
Biochemical tests
Results
Indole
+
Methyl red
+
Voges-Proskauer
+
Citrate
+
Hemolysis
β
Deoxyribonuclease
+
Gelatinase
+
Catalase
+
Oxidase
+
Oxidative/fermentation glucose test
F
Motility
+
Urease
+
Nitrate
+
TSI (Acid/Alkali)
A/A
Arginine dihydrolase
+
Lysine decarboxylase
+
Ornithine decarboxylase
–
Acid from
Lactose
–
Sucrose
+
L-arabinose
–
Mannitol
+
Salicin
+
3.2 Antimicrobial susceptibility of A. dhakensis AM
The MICs of six antimicrobial agents against A. dhakensis AM were evaluated. Notably, amoxicillin had the highest MIC of 64 µg/mL among the antibiotics, a value significantly higher than the Clinical and Laboratory Standards Institute (CLSI) MIC breakpoints (>8 µg/mL) (data not shown). Considering the limited availability of information regarding the susceptibility profiles of A. dhakensis, our findings provide valuable insights into the antibiotic susceptibility of A. dhakensis AM. Specifically, our results demonstrate that A. dhakensis AM displays susceptibility to chloramphenicol, doxycycline, and gentamicin. Traditionally, Aeromonas have shown susceptibility to a range of antimicrobial agents, including 4th-generation cephalosporins, aminoglycosides, fluoroquinolones, tetracycline, and trimethoprim-sulfamethoxazole (Aravena-Roman et al., 2012). It is important to highlight that only a limited selection of antimicrobial agents, including oxytetracycline, amoxicillin, sulfadimethoxine/ormetoprim, and enrofloxacin, have been approved for use in aquaculture in Thailand (Baoprasertkul et al., 2012). Our results underscore the resistance rate to amoxicillin, in line with the report by Aravena-Roman et al. (2011), which noted that only 1.6% of 193 Aeromonas isolates were susceptible to amoxicillin. Recognizing the unique resistance pattern of amoxicillin against the target bacteria, we chose to incorporate amoxicillin at sub-MIC levels for our evaluation of synergism between the antibiotics and the phage cocktail. This choice was driven by the need to explore alternative treatment strategies given the observed resistance and to assess the potential of phages in complementing amoxicillin's limited efficacy in addressing A. dhakensis AM infections.
3.3 Genomic features of A. dhakensis AM
The in silico genome of A. dhakensis AM comprises one circular chromosome of 4,884,279 bp with a G + C content of 61.9% (Fig. 2). The genome contained 4256 coding DNA sequences (CDSs). We emphasized the antimicrobial resistance genes and virulence factors corresponding to the main bacterial virulence determinants. Antimicrobial resistance genes were identified in the genome of A. dhakensis AM (Table S1). Virulence factor genes were identified in the genome of A. dhakensis AM (Table S2). Several typical toxin-encoding genes have been identified, such as aerolysin, hemolysin, and exotoxin. Five prophages were identified in the genome (Table S3), and no plasmids were found during genome analysis.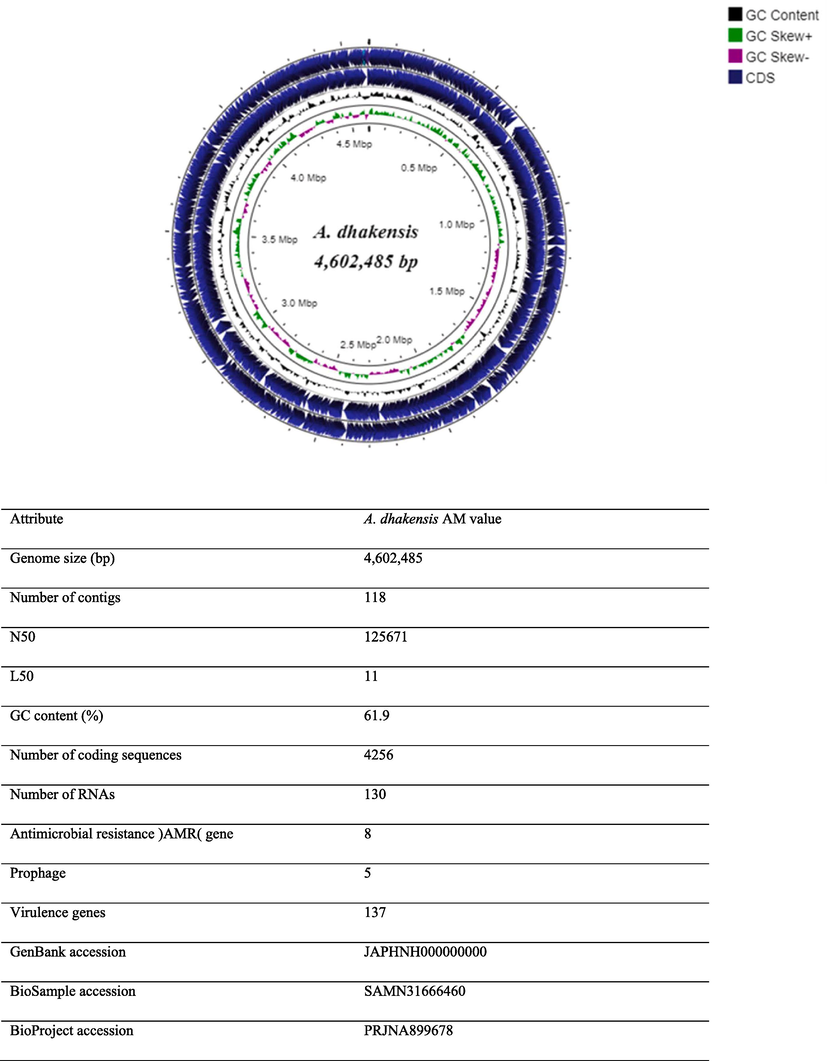
Genome features of A. dhakensis AM. Circular representation of the following characteristics are shown from the outside to the center of the diagram. Circle 1: coding sequence (CDS) on the reverse strand, circle 2: coding sequence (CDS) on the forward strand, circle 3: GC contents, circle 5: GC skew values (GC skew + shown in green, GC skew- shown in pink).
3.4 Phage isolation, purification and phage morphology
Four phages, designated as vB_AdhS_TS3, vB_AdhM_TS9, vB_AdhM_DL, and vB_AdhS_M4 were isolated using A. dhakensis AM as the host. These phages exhibited clear plaques with diameters ranging from 1.7 to 2.0 mm (Fig. 3). The electron micrographs revealed distinct morphologies for the isolated phages. Phage vB_AdhS_TS3 exhibited an icosahedral head of approximately 75.2 nm and a contractile tail with a length of 225.3 nm, while phage vB_AdhS_M4 had an icosahedral head of approximately 64.8 nm and a tail length of 185.4 nm. In contrast, phages vB_AdhM_DL and vB_AdhM_TS9 displayed different morphologies, with phage vB_AdhM_DL possessing an icosahedral head with dimensions of 50.4 nm and a tail length of 210.4 nm, and phage vB_AdhM_TS9 featuring an icosahedral head of approximately 85.1 nm and a shorter tail measuring 101.4 nm (Fig. 3). In a study by Bai et al. (2019), it was reported that among 51 complete genome sequences of Aeromonas phages in GenBank, the majority of Aeromonas phages were classified into different families. However, it's important to note that the ICTV's updated classification emphasizes that these morphological categories do not hold formal taxonomic significance in the classification of phages.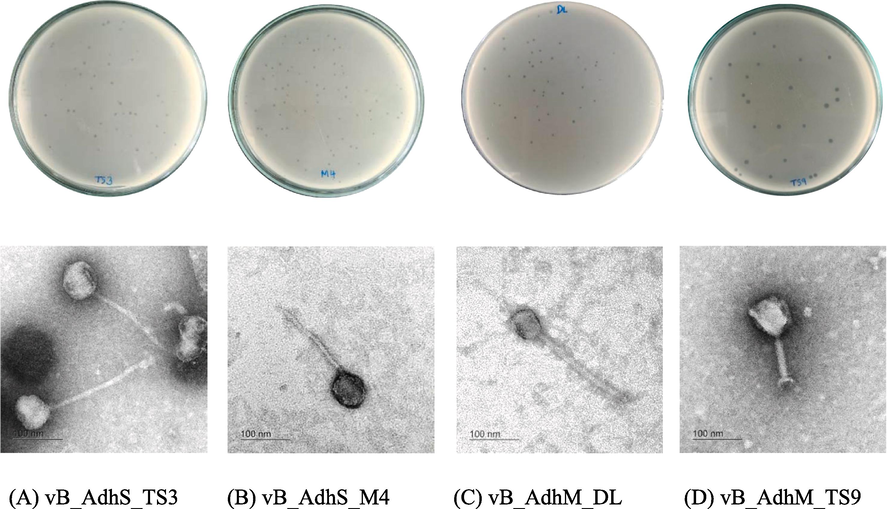
Plaques and TEM images of phage vB_AdhS_TS3 (A), vB_AdhS_M4 (B), vB_AdhM_DL (C), and vB_AdhM_TS9 (D). Scale bar = 100 nm.
3.5 Host range determination
All phages were infected only with A. dhakensis and did not infect other Aeromonas spp., such as A. hydrophila, A. caviae, A. sobria, A. trota, or A. veronii (data not shown). Bacteriophage vB_AdhM_TS3 and vB_AdhM_TS9 are the broadest host range phage, able to infect A. dhakensis in five out of the six strains tested.
3.6 Optimal multiplicity of infection determination (MOI) and one-step growth curve
Phage vB_AdhS_TS3, vB_AdhM_DL, vB_AdhS_M4 and vB_AdhM_TS9 generated a maximum titre of 9.68 ± 0.05, 9.94 ± 0.05, 10.41 ± 0.06 and 8.85 ± 0.25 PFU/mL when infected at an optimal MOI of 10 (data not shown). The one-step growth curve of the phages revealed latent periods of approximately 40, 30, 50, and 30 min for vB_AdhS_TS3, vB_AdhM_DL, vB_AdhS_M4, and vB_AdhM_TS9, respectively. The burst sizes for these phages were estimated as 1380, 1280, 253, and 630 PFUs/infected cells, respectively (data not shown). Among the four phages, phage vB_AdhS_M4 had the longest latent period, smallest burst size, and narrowest host range. Therefore, we selected the other three phages, vB_AdhS_TS3, vB_AdhM_DL, and vB_AdhM_TS9, for further studies.
3.7 pH and thermal stability
All phages were resistant to a wide range of pH values after 2 h of incubation, and the optimum range was pH–6–8 (data not shown). No plaques were seen at pH 2. Regarding thermal stability, the phages maintained their stability relatively well after a 60-minute incubation at 4 °C, 25 °C, 30 °C, and 37 °C but were sensitive to higher temperatures (data not shown).
3.8 Whole genome sequencing and computational analyses
The genome size of vB_AdhS_TS3 was 115,560 bp with a G + C content of 41.10% (Fig. 4). The open reading frames (ORFs) of vB_AdhS_TS3 were identified with a total of 272 predicted ORFs. Among these genes, 58 were predicted to have known functions (Table 2, Fig. 4), and 184 ORFs were predicted to encode hypothetical proteins. Similarly, the genome size of vB_AdhM_TS9 was 115,503 bp, with a G + C content of 35.34%, and encoded 199 proteins. Out of 199 ORFs, 136 ORFs were hypothetical, whereas only 63 ORFs predicted functions (Table 2, Fig. 4). The genome size of vB_AdhM_DL was 42,388 bp, with a G + C content of 34.43% and 79 proteins, respectively. Of the 79 encoded proteins, Only 29 out of 79 encoded predicted functions, whereas 50 ORFs were hypothetical (Table 2, Fig. 4). We did not find an ORF encoding a protein with known toxins, antibiotic-resistant genes (ARGs), virulent factors (VFs) of bacterial origin, or lysogenic markers such as integrase, recombinase, repressor/anti-repressor protein, and excisionase in all three phage genomes.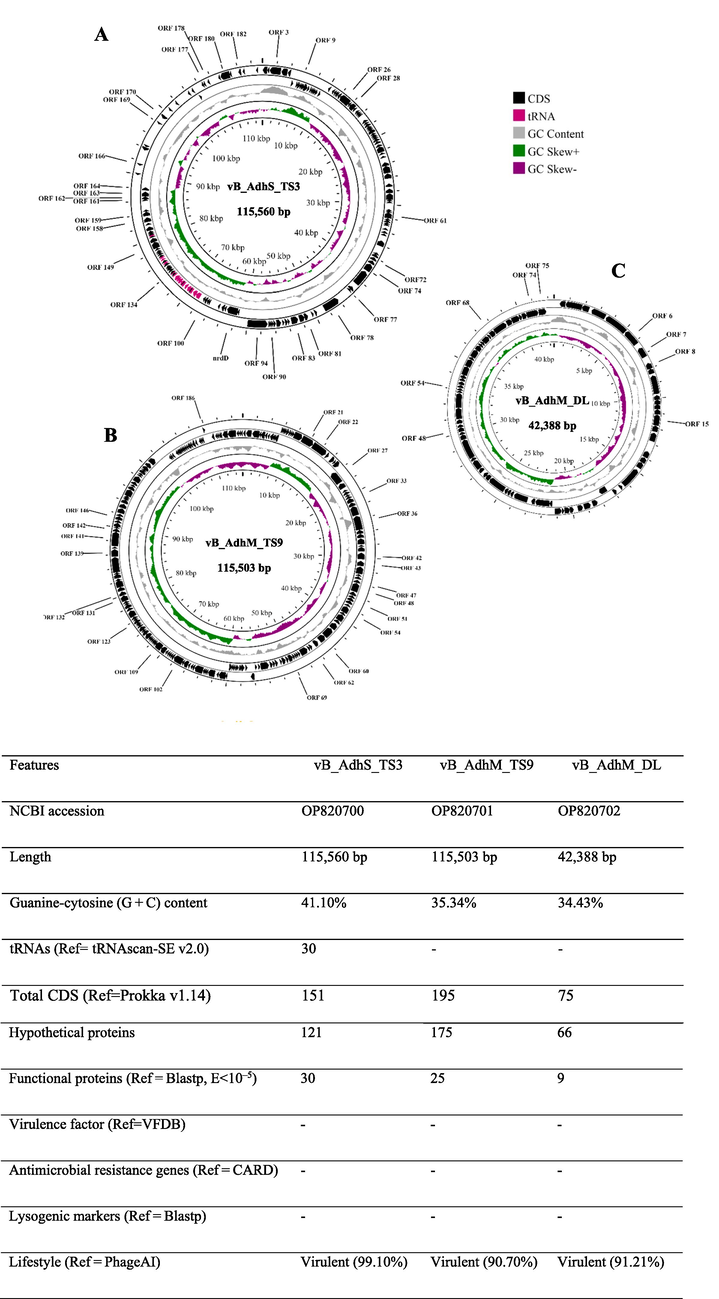
Genomic characterization of three bacteriophages targeting A. dhakensis AM, A) vB_AdhS_TS3 B) vB_AdhM_TS9 C) vB_AdhM_DL. Circles from outermost to innermost correspond to predicted genes (BLASTp, nr database, E value of 〈10−5) on the forward strand, reverse strand, and GC content.
ORF
start
stop
strand
Predicted function
Probability
E value
Conserved domain no.
phage vB_AdhS_TS3
1
691
29
–
Hydrolase
99.74
1.60 × 10⁻¹⁶
2GO7_C
3
2625
1045
–
UDP-2,3-diacylglucosamine hydrolase
98.95
2.30 × 10⁻⁸
5K8K_A
15
7483
7596
+
Fimbrial protein
98.4
9.10 × 10⁻⁷
4IXJ_B
29
13,672
12,083
–
Nicotinamide phosphoribosyltransferase
100
6.40 × 10−75
8DSC_B
31
14,698
13,916
–
Ribose-phosphate pyrophosphokinase
100
2.00 × 10−38
5MP7_A
32
14,979
14,695
–
Pyrophosphatase
98.22
2.80 × 10⁻⁵
2GTA_C
52
22,228
21,368
–
Membrane protein
100
2.80 × 10⁻²⁹
7VHP_G
57
24,326
23,766
–
lemA protein
99.82
1.30 × 10⁻¹⁸
2ETD_A
59
26,185
25,436
–
Serine/Threonine phosphatases
99.95
1.20 × 10⁻²⁵
1G5B_B
63
28,284
27,661
–
DNA polymerase III subunit epsilon
99.42
1.50 × 10⁻¹¹
5M1S_D
81
34,516
34,310
–
Thioredoxin glutathione reductase
98.23
7.60 × 10⁻⁵
7B02_A
82
36,153
35,326
–
Putative ATP-dependent Clp protease proteolytic subunit
99.72
6.80 × 10⁻¹⁶
1TG6_E
83
36,371
36,150
–
Deoxynucleoside monophosphate kinase
99.06
2.20 × 10⁻⁹
1DEK_B
88
38,453
37,983
–
Ribonuclease H
99.73
5.90 × 10⁻¹⁵
3H08_B
89
39,040
38,522
–
Dihydrofolate reductase
99.91
3.50 × 10⁻²³
3CSE_A
90
40,222
39,101
–
Ribonucleotide reductase R2
100
9.80 × 10−53
1MXR_A
91
42,660
40,411
–
Ribonucleoside-diphosphate reductase 1 subunit alpha
100
1.80 × 10−113
2XAP_C
93
43,815
43,324
–
Phosphate starvation-inducible protein
99.51
6.70 × 10⁻¹²
3B85_A
94
44,031
43,831
–
RNA complex
98.27
2.20 × 10⁻⁶
2XZO_A
100
48,501
46,093
–
DNA polymerase
100
4.80 × 10−73
4XVK_A
102
48,947
48,792
–
DNA primase
98.24
3.40 × 10⁻⁶
5VAZ_A
104
50,009
49,644
–
DnaB-like replicative helicase
99.39
4.70 × 10⁻¹¹
8DUE_B
109
51,631
51,071
–
snRNA-activating protein complex subunit 4
99.35
3.20 × 10⁻¹⁰
7XUR_A
110
52,415
51,624
–
DNA ligase
99.97
8.80 × 10⁻²⁹
1DGS_B
111
53,608
52,598
–
DNA ligase
100
8.00 × 10−73
4GLX_A
112
53,819
53,640
–
DNA binding protein
99.52
4.20 × 10⁻¹³
5A4O_A
115
54,925
54,623
–
Homing endonuclease-DNA
99.42
4.30 × 10⁻¹³
1A73_A
117
55,801
55,109
–
DNA binding protein
99.04
1.60 × 10⁻⁸
2LVS_A
122
59,955
57,031
–
Eukaryotic initiation factor
99.77
2.00 × 10⁻¹⁶
5ZC9_A
127
61,708
63,414
+
Anaerobic ribonucleotide-triphosphate reductase
100
1.70 × 10−54
1HK8_A
129
63,875
64,339
+
Outer membrane protein A
99.43
4.60 × 10⁻¹¹
3NB3_B
136
66,830
67,258
+
Endonuclease V
100
5.40 × 10−43
2END_A
152
69,872
70,051
+
Antitermination protein
97.97
1.60 × 10⁻⁵
7UBN_Q
175
74,745
74,855
+
30S ribosomal protein
98.9
1.10 × 10⁻⁸
2K4X_A
186
78,078
78,416
+
Circadian Clock Protein
98.81
3.30 × 10⁻⁸
1R8J_B
187
78,413
79,444
+
Transcriptional regulator NadR
100
4.20 × 10⁻³⁵
1LW7_A
188
79,441
80,118
+
Nicotinamide riboside transporter
100
1.40 × 10−42
4QTN_A
197
83,112
83,480
+
DNA binding protein
99.37
2.80 × 10⁻¹²
2A1K_B
198
83,707
84,393
+
Nuclease SbcCD subunit D
99.66
8.20 × 10⁻¹⁵
7DOG_B
204
86,807
87,541
+
Exodeoxyribonuclease
100
1.80 × 10⁻³¹
5HML_B
205
87,726
88,226
+
Deoxyuridine 5′-triphosphate nucleotidohydrolase
99.95
3.00 × 10⁻²⁵
3MDX_A
209
89,272
89,156
–
Muramidase Lysozyme-like Peptidoglycan-binding
98.76
5.90 × 10⁻⁸
6V3Z_B
210
89,551
89,420
–
Muramidase Lysozyme-like Peptidoglycan-binding
99.21
2.20 × 10⁻¹¹
6V3Z_B
218
93,068
92,955
–
Large tail fiber protein P34
98.11
8.60 × 10⁻⁶
4UXF_C
224
95,866
95,729
–
Probable central straight fiber
98.97
6.50 × 10⁻¹⁰
7ZQB_i
225
96,037
95,885
–
Probable central straight fiber
98.83
9.60 × 10⁻¹⁰
7ZQB_i
228
97,213
97,067
–
Probable central straight fiber
99.72
3.00 × 10⁻¹⁸
7ZQB_i
230
98,169
97,900
–
Baseplate
99.31
2.80 × 10⁻¹¹
8GTC_O
233
98,787
98,620
–
Tip attachment protein
99.04
5.10 × 10⁻¹⁰
8IYK_J
234
99,393
98,908
–
Probable baseplate hub protein
99.66
1.90 × 10⁻¹⁵
7ZHJ_c
238
100,667
100,473
–
Distal tail protein
99.06
1.30 × 10⁻⁹
6F2M_C
253
106,959
106,681
–
Tail tube protein
99.51
7.40 × 10⁻¹⁴
5NGJ_A
254
107,559
107,401
–
Tail tube protein
98.92
2.70 × 10⁻⁹
5NGJ_A
258
109,315
109,010
–
Neck protein
99.46
1.10 × 10⁻¹²
6TE9_C
259
110,749
109,370
–
Major capsid protein
100
1.10 × 10⁻³⁰
6TSU_J4
264
112,437
112,033
–
Portal protein
99.65
1.90 × 10⁻¹⁴
8FQL_E
265
112,737
112,504
–
Portal protein
99.45
1.10 × 10⁻¹²
8FQL_E
267
113,538
113,413
–
Terminase large subunit
98.47
4.60 × 10⁻⁷
2WBN_A
phage vB_AdhM_TS9
2
1373
516
–
HNH restriction endonuclease
98.93
6.00 × 10⁻⁹
3M7K_A
3
2597
1494
–
RNA ligase
100
5.30 × 10−47
6VTB_A
6
3846
3484
–
Deoxycytidylate deaminase
99.77
4.50 × 10⁻¹⁷
2W4L_D
11
5550
5029
–
Ribonuclease HI
98.6
3.10 × 10⁻⁵
2E4L_A
20
7598
8854
+
AAA ATPase
100
8.80 × 10−46
8BNS_B
21
8871
10,661
+
DNA primase/helicase
100
1.70 × 10−53
6N7I_D
22
10,673
12,955
+
DNA polymerase
100
1.30 × 10−50
1X9M_A
23
13,082
13,474
+
HNH homing endonuclease
99.74
9.20 × 10⁻¹⁷
1U3E_M
24
13,686
13,892
+
DNA polymerase
97.95
2.40 × 10⁻⁵
1X9M_A
25
13,931
14,488
+
Helix-destabilizing protein
99.85
5.00 × 10⁻²⁰
1JE5_A
28
17,556
15,607
–
Tailspike protein
99.92
2.20 × 10⁻²¹
6NW9_A
29
18,558
17,695
–
Ribosome
99.55
3.90 × 10⁻¹⁴
7ANE_at
30
19,162
18,899
–
Ribosome
99.56
2.40 × 10⁻¹⁴
7ANE_at
33
20,422
20,012
–
Tail fiber assembly protein
99.41
2.10 × 10⁻¹¹
5YVQ_B
35
21,764
21,150
–
Baseplate wedge protein
99.89
2.40 × 10⁻²¹
7KH1_B2
36
23,276
21,777
–
Baseplate wedge protein
100
7.60 × 10−38
7KH1_I5
38
26,234
25,623
–
Baseplate
99.82
5.30 × 10⁻¹⁹
7YFZ_p
39
26,879
26,244
–
Baseplate
99.95
4.10 × 10⁻²⁶
4RU3_A
40
27,875
26,961
–
Baseplate
100
3.50 × 10⁻²⁹
8EON_E
41
28,289
27,963
–
Baseplate
99.92
5.90 × 10⁻²⁴
7YFZ_h
42
29,017
28,289
–
Baseplate complex
99.92
1.00 × 10⁻²³
7KH1_D3
45
32,552
31,395
–
DUF4379 domain-containing protein
99.85
1.40 × 10⁻²⁰
6YXX_E2
48
34,011
33,538
–
Sheath-tube
99.97
6.40 × 10⁻²⁹
8HDW_n
49
35,430
34,036
–
Tail sheath protein
100
4.90 × 10−57
7KJK_C6
50
36,034
35,492
–
E217 gateway protein
99.94
6.60 × 10⁻²⁵
8FVH_b
51
36,463
36,044
–
Head completion protein
99.74
6.10 × 10⁻¹⁷
7KJK_A4
55
39,046
38,006
–
Major capsid protein
100
2.90 × 10⁻³⁵
6XGP_B
56
39,443
39,066
–
Head decoration protein
99.71
5.70 × 10⁻¹⁶
1TD4_A
59
42,170
41,184
–
DUF4379 domain-containing protein
99.67
3.30 × 10⁻¹⁶
6YXX_E2
60
43,797
42,250
–
Portal protein
100
8.30 × 10−37
5NGD_D
61
44,884
43,829
–
Large subunit terminase
99.75
1.20 × 10⁻¹⁶
5OE8_B
62
45,891
45,199
–
HNH homing endonuclease
99.91
9.40 × 10⁻²⁴
1U3E_M
63
46,728
46,330
–
Large subunit terminase
99.42
2.60 × 10⁻¹²
5OE8_B
65
48,423
47,194
–
DUF4379 domain-containing protein
99.9
1.80 × 10⁻²³
6YXX_E2
70
50,487
49,771
–
Serine/Threonine protein phosphatases
99.95
2.60 × 10⁻²⁵
1G5B_B
72
51,548
50,973
–
Phage terminase large subunit
99.78
4.30 × 10⁻¹⁷
7KS4_B
76
54,958
53,627
–
Apicoplast DNA polymerase
99.47
1.30 × 10⁻¹²
7SXQ_A
79
56,048
56,602
+
ATP-dependent protease subunit
99.6
3.80 × 10⁻¹⁴
6KR1_J
89
60,225
61,226
+
DUF4379 domain-containing protein
99.66
8.90 × 10⁻¹⁶
6YXX_E2
91
61,794
62,804
+
DUF4379 domain-containing protein
99.65
8.70 × 10⁻¹⁶
6YXX_E2
95
63,585
64,844
+
DUF4379 domain-containing protein
99.9
4.70 × 10⁻²³
6YXX_E2
98
65,569
65,874
+
Putative pyrophosphohydrolase
99.67
4.80 × 10⁻¹⁵
4YF1_C
101
66,802
68,175
+
DNA ligase
100
4.10 × 10−62
6DT1_E
102
68,190
68,552
+
Hydrolase
99.4
3.70 × 10⁻¹¹
2Q73_B
107
69,697
70,458
+
HNH homing endonuclease
99.07
2.40 × 10⁻¹⁰
1U3E_M
108
70,448
71,497
+
Ribonuclease H
99.94
1.00 × 10⁻²⁵
3H7I_A
116
73,445
74,005
+
Crossover junction endodeoxyribonuclease
99.93
1.00 × 10⁻²³
7XHJ_B
118
74,196
74,768
+
Recombination endonuclease VII
100
6.30 × 10⁻³³
1E7L_B
122
75,504
76,004
+
Spore cortex-lytic enzyme
99.93
5.70 × 10⁻²⁴
4F55_A
125
76,580
77,542
+
DNA polymerase III subunit epsilon
99.35
7.90 × 10⁻¹²
5M1S_D
127
78,015
78,590
+
5′-Nucleotidase
99.88
4.80 × 10⁻²¹
4L57_A
130
79,134
79,979
+
Thymidylate synthase
100
1.90 × 10−57
3V8H_B
131
80,000
80,548
+
Dihydrofolate reductase
99.93
4.50 × 10⁻²³
8SSX_A
133
81,217
82,260
+
DUF4379 domain-containing protein
99.64
2.40 × 10⁻¹⁵
6YXX_E2
138
83,439
85,700
+
Ribonucleoside-diphosphate reductase 1 subunit alpha
100
4.10 × 10−112
2XAP_C
139
85,754
86,842
+
Ribonucleotide reductase
100
9.30 × 10−53
1MXR_A
140
86,916
87,191
+
Circadian clock protein
99.01
3.50 × 10⁻⁸
5JWO_B
141
87,288
89,378
+
Anaerobic ribonucleoside-triphosphate reductase
100
5.30 × 10−70
8P28_A
142
89,375
89,848
+
Molybdenum cofactor biosynthesis protein A
99.45
9.10 × 10⁻¹³
1TV8_A
148
92,147
92,887
+
Phosphate starvation-inducible protein
99.89
8.00 × 10⁻²⁰
3B85_A
155
95,869
96,417
+
lemA protein
99.85
1.00 × 10⁻¹⁹
2ETD_A
158
97,221
98,105
+
Proteasome
99.61
4.40 × 10⁻¹⁴
2JAY_A
196
114,449
113,181
–
Apicoplast DNA polymerase
99.55
1.30 × 10⁻¹³
7SXQ_A
phage vB_AdhM_DL
1
346
2
–
Major capsid protein
99.21
9.00 × 10⁻¹¹
7SJ5_A
2
743
366
–
Head decoration protein
99.72
2.80 × 10⁻¹⁶
1TD4_A
4
2312
1827
–
Prohead core protein protease
92.43
3.9
5JBL_B
5
3470
2484
–
DUF4379 domain-containing protein
99.67
3.30 × 10⁻¹⁶
6YXX_E2
6
5097
3550
–
Portal protein
100
8.30 × 10−37
5NGD_D
7
6184
5129
–
Large subunit terminase
99.75
1.20 × 10⁻¹⁶
5OE8_B
8
7191
6499
–
HNH homing endonuclease
99.91
9.90 × 10⁻²⁴
1U3E_M
9
8028
7630
–
Large subunit terminase
99.42
2.60 × 10⁻¹²
5OE8_B
11
9729
8494
–
DUF4379 domain-containing protein
99.9
5.40 × 10⁻²³
6YXX_E2
16
11,787
11,071
–
Serine/Threonine protein phosphatases
99.95
2.60 × 10⁻²⁵
1G5B_B
18
12,848
12,273
–
Phage terminase large subunit
99.78
4.30 × 10⁻¹⁷
7KS4_B
23
16,258
14,927
–
Apicoplast DNA polymerase
99.47
1.30 × 10⁻¹²
7SXQ_A
26
17,348
17,902
+
ATP-dependent protease subunit
99.56
1.70 × 10⁻¹³
6KR1_J
36
21,525
22,526
+
DUF4379 domain-containing protein
99.66
8.90 × 10⁻¹⁶
6YXX_E2
38
23,094
24,104
+
DUF4379 domain-containing protein
99.65
7.10 × 10⁻¹⁶
6YXX_E2
42
24,885
26,144
+
DUF4379 domain-containing protein
99.91
1.20 × 10⁻²³
6YXX_E2
44
26,496
26,726
+
DUF4379 domain-containing protein
99.91
1.20 × 10⁻²³
6YXX_E2
45
26,869
27,174
+
Putative pyrophosphohydrolase
99.66
5.40 × 10⁻¹⁵
4YF1_C
48
28,102
29,475
+
DNA ligase
100
4.10 × 10−62
6DT1_E
54
30,997
31,758
+
HNH homing endonuclease
99.07
2.40 × 10⁻¹⁰
1U3E_M
55
31,748
32,797
+
Ribonuclease H
99.94
1.00 × 10⁻²⁵
3H7I_A
63
34,745
35,305
+
Crossover junction endodeoxyribonuclease
99.93
1.00 × 10⁻²³
7XHJ_B
65
35,496
36,068
+
Recombination endonuclease VII
100
5.60 × 10⁻³³
1E7L_B
69
36,804
37,304
+
Spore cortex-lytic enzyme
99.93
5.20 × 10⁻²⁴
4F55_A
72
37,880
38,842
+
DNA polymerase III subunit epsilon
99.35
1.10 × 10⁻¹¹
5M1S_D
74
39,315
39,890
+
5′-Nucleotidase
99.88
4.80 × 10⁻²¹
4L57_A
77
40,434
41,279
+
Thymidylate synthase
100
1.80 × 10−57
3V8H_B
78
41,300
41,848
+
Dihydrofolate reductase
99.93
4.50 × 10⁻²³
8SSX_A
3.9 Effect of single in pre- and post-treatment to control A. dhakensis AM growth
The lytic effect of individual phages on the growth of A. dhakensis AM was evaluated at different MOIs. Both pre-and post-treatment, the maximum cell decrease for all phages was observed during 6–12 h of incubation at all MOIs compared with the uninfected bacterial control. The pre-treatment with phages vB_AdhS_TS3, vB_AdhM_DL, and vB_AdhM_TS9 reduced the maximum bacterial count by 5.40, 6.67 and 3.91 log CFU/mL, respectively, after 6 h of incubation. In post-treatment, the maximum inactivation was achieved at 12 h with the log reduction number of 4.68, 5.25 and 4.43 log CFU/mL, respectively. The growth of bacteria cultured with phages decreased remarkably depending on the regrowth of bacteria at 48 h in all treatments (Fig. 5). When the phages were incubated in the presence of the host, the phages gradually increased and then became stable over 48 h of incubation. Based on the maximum inhibition, the combination of two phages as a phage cocktail in pre- and post-treatment with optimal MOIs was chosen, as shown in Fig. 6.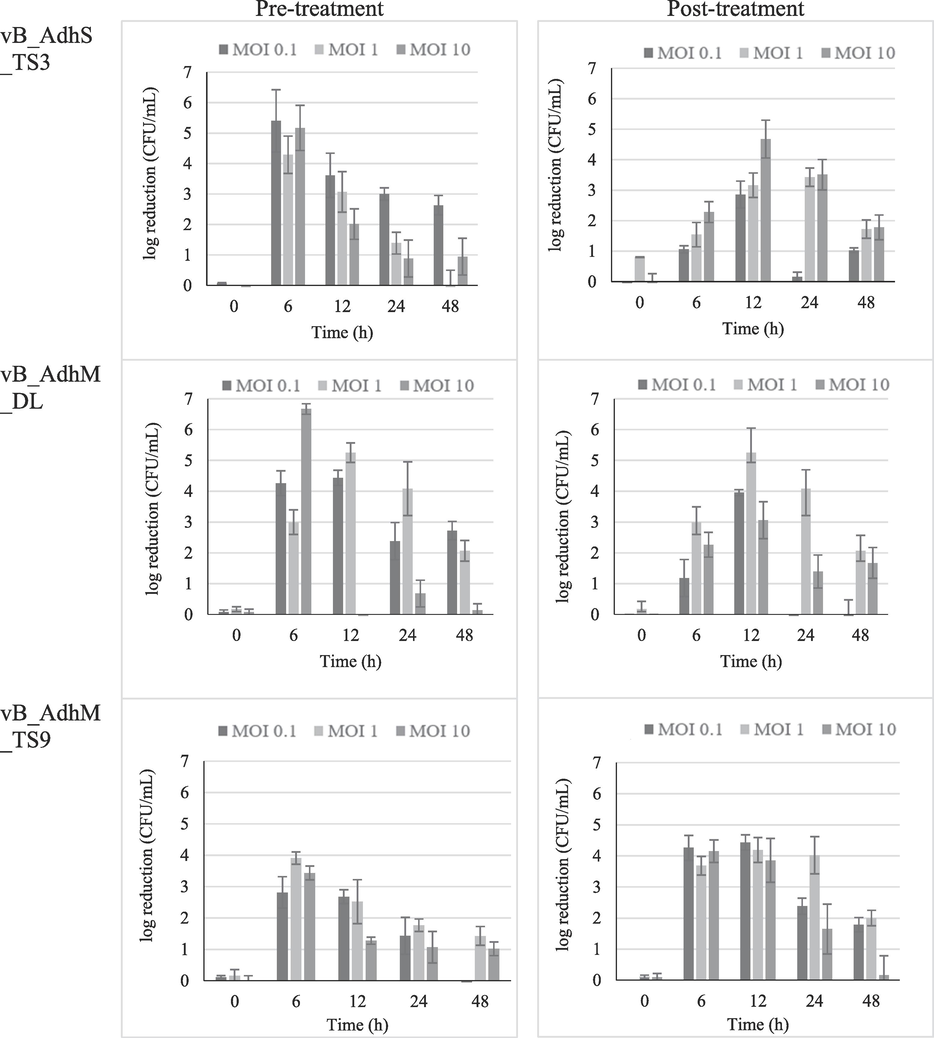
The log reduction in A. dhakensis number in pre- and post-treatment using single phage vB_AdhS_TS3, vB_AdhM_DL and vB_AdhM_TS9. The data were expressed as mean ± SD. All assays were carried out in triplicates.
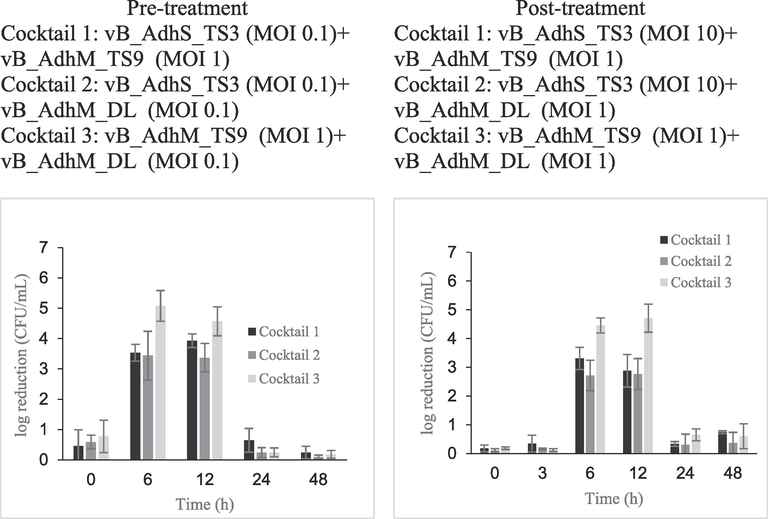
The log reduction in A. dhakensis number in pre- and post-treatment groups using phage cocktail vB_AdhS_TS3, vB_AdhM_DL and vB_AdhM_TS9. The data are expressed as mean ± SD. All assays were carried out in triplicates.
3.10 Effect of phage cocktail in pre- and post-treatment to control A. dhakensis AM growth
The effectiveness of the phage cocktail in the reduction of A. dhakensis AM is shown in Fig. 6. Cocktail 3, composed of phages vB_AdhM_TS9 and vB_AdhM_DL, was more effective against A. dhakensis AM than the other cocktails. Upon pre-treatment, the maximum inactivation with cocktail 3 (vB_AdhM_TS9 (MOI 1) + vB_AdhM_DL (MOI 0.1)) was 5.08 ± 0.51 log CFU/mL after 6 h of incubation compared with uninfected control. In post-treatment, the maximum reduction with cocktail 3 (vB_AdhM_TS9 (MOI 1) + vB_AdhM_DL (MOI 1)) was 4.71 ± 0.49 log CFU/mL after 12 h of incubation when compared with those of the bacterial control. Bacterial regrowth was observed at 24 h in all treatments. The phage alone was constant throughout the experiment. While phage cocktails hold promise in preventing the emergence of phage-resistant mutants, it's essential to acknowledge that prolonged incubation of phages and bacteria may lead to the development of phage-resistant strains (Malik et al., 2021). Another challenge in phage therapy is the high specificity of phages for their target bacteria. Each bacterial strain often requires a specific phage, and identifying the right phage for a particular infection can be a time-consuming process. In urgent or novel situations, this may not always be feasible. Thus, we have investigated the combination of phages with antibiotics as a strategy to mitigate potential limitations and expand the scope of treatment.
3.11 A. dhakensis growth inhibition by phage cocktail and antibiotics combination
To establish the phage-antibiotic synergy (PAS) effect, we determined the bacterial inactivation by three combinations of phage cocktails with amoxicillin at sub-MIC (32 μg/mL) in different volumes (200 µL and 20 mL). In the presence of amoxicillin and phage alone, the antibiotic- and phage-resistant variants rapidly grew after 6 h of incubation. In the pre-treatment, the combination of phage cocktail 1 or 2 with amoxicillin at sub-MIC resulted in complete inhibition during 48 h and 12 h in a volume of 200 µL and 20 mL, respectively (Fig. 7). At a volume of 20 mL, a significant reduction in bacterial numbers was observed when treated with a combination of phage cocktail 1 or 2 and sub-MIC amoxicillin at 48 h of incubation (p < 0.05). After post-treatment, the combination of phage cocktail 1 or 2 with amoxicillin at sub-MIC resulted in complete inhibition for 48 h in 200 µL (Fig. 7). However, only partial inhibition was observed after 12 h at a volume of 20 mL. Bacterial regrowth gradually increased after 12 h, and no significant reduction in viable bacteria was observed after 48 h of incubation compared to the phage cocktail of antibiotics alone. In this study, the bacterial concentration in this treatment (1 × 10⁵ CFU/mL) was much higher than in natural bacterial contamination. Moreover, this study was performed in a higher volume of medium (20 mL), which may reduce the interaction between phages and/or antibiotics before reaching the bacteria. However, phage cocktails 1 and 2 decreased the CFU 1.2–1.7 log CFU/mL compared to the control and other groups treated individually after incubation for 48 h. Our study strongly suggests that the synergistic antibacterial effects of antibiotics and phages should be performed in the early stages when the bacterial number is low. The first use of the phage–antibiotic synergy (PAS) strategy was described by Comeau et al. (2007). Sublethal concentrations of antibiotics may help lytic bacteriophages reproduce rapidly and promote their antibacterial effects. Additionally, in combination with antibiotics, phages have multiple mechanisms to augment antibiotic effectiveness. They can break down bacterial biofilms using phage enzymes such as depolymerases and lysins, rendering bacteria more susceptible to antibiotics (Liu et al., 2022b). Additionally, this combination therapy can reduce the likelihood of bacterial resistance development to both phages and antibiotics (Segall et al., 2019). Our study underscores the potential of phage-based approaches in combating A. dhakensis and demonstrates the efficacy of combination therapy utilizing phage cocktails and sublethal antibiotic concentrations. Furthermore, the ability of phages to target antibiotic-resistant strains, which are often challenging to treat with antibiotics alone, adds to the value of this approach. By focusing on A. dhakensis, we provide insights that extend to the broader challenge of antimicrobial resistance, emphasizing the importance of exploring innovative strategies to combat this critical global health issue.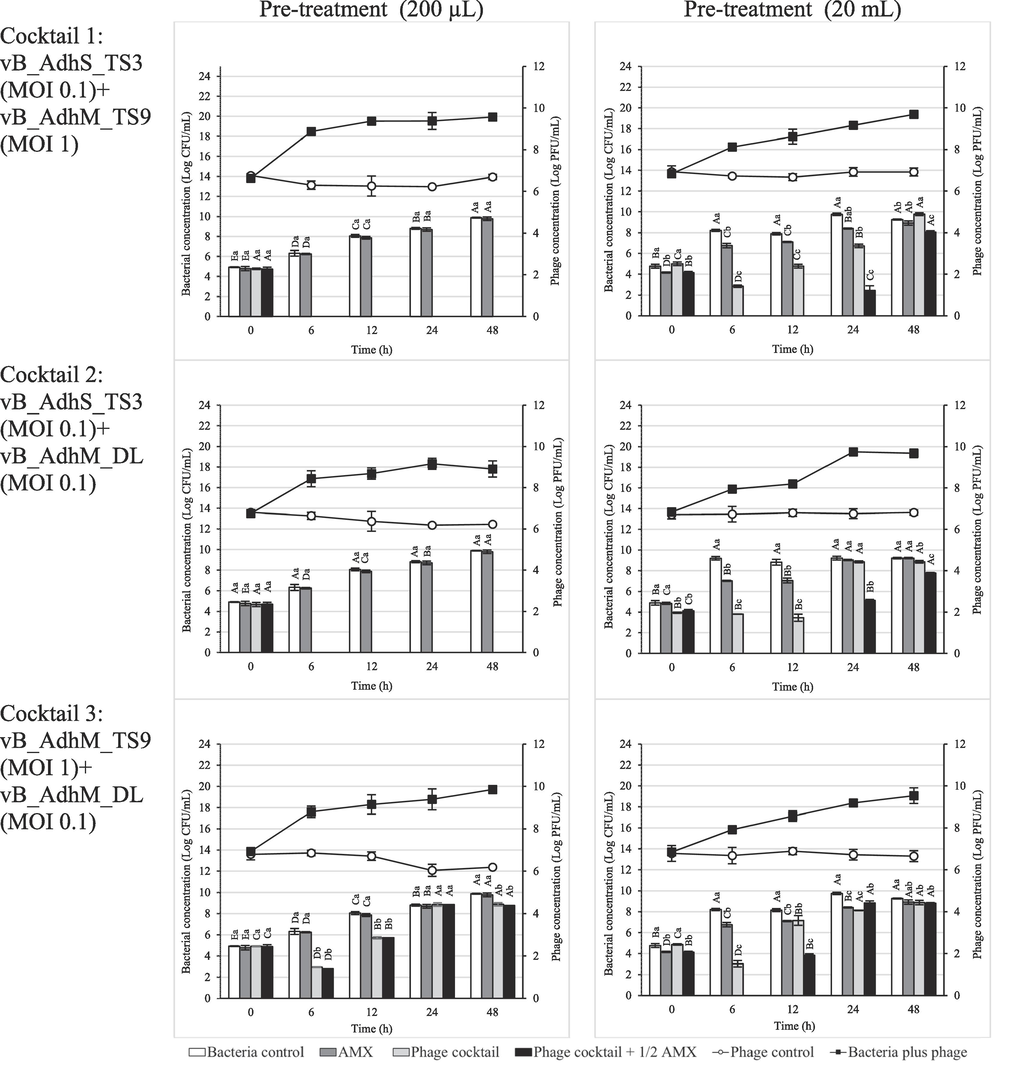
Effect of phage cocktail and amoxicillin combination at 1/2 MIC against A. dhakensis AM. The bar graph represents the bacterial concentration (log CFU/mL), and the line graph represents the phage concentration (log PFU/mL). The data are expressed as mean ± SD. All assays were carried out in triplicates. Each lowercase label corresponds to a significantly different (p < 0.05) bacterial concentration within each time point. Capital letters denote significantly distinct (p < 0.05) bacterial concentrations and time points compared to each other time point within the same conditions.
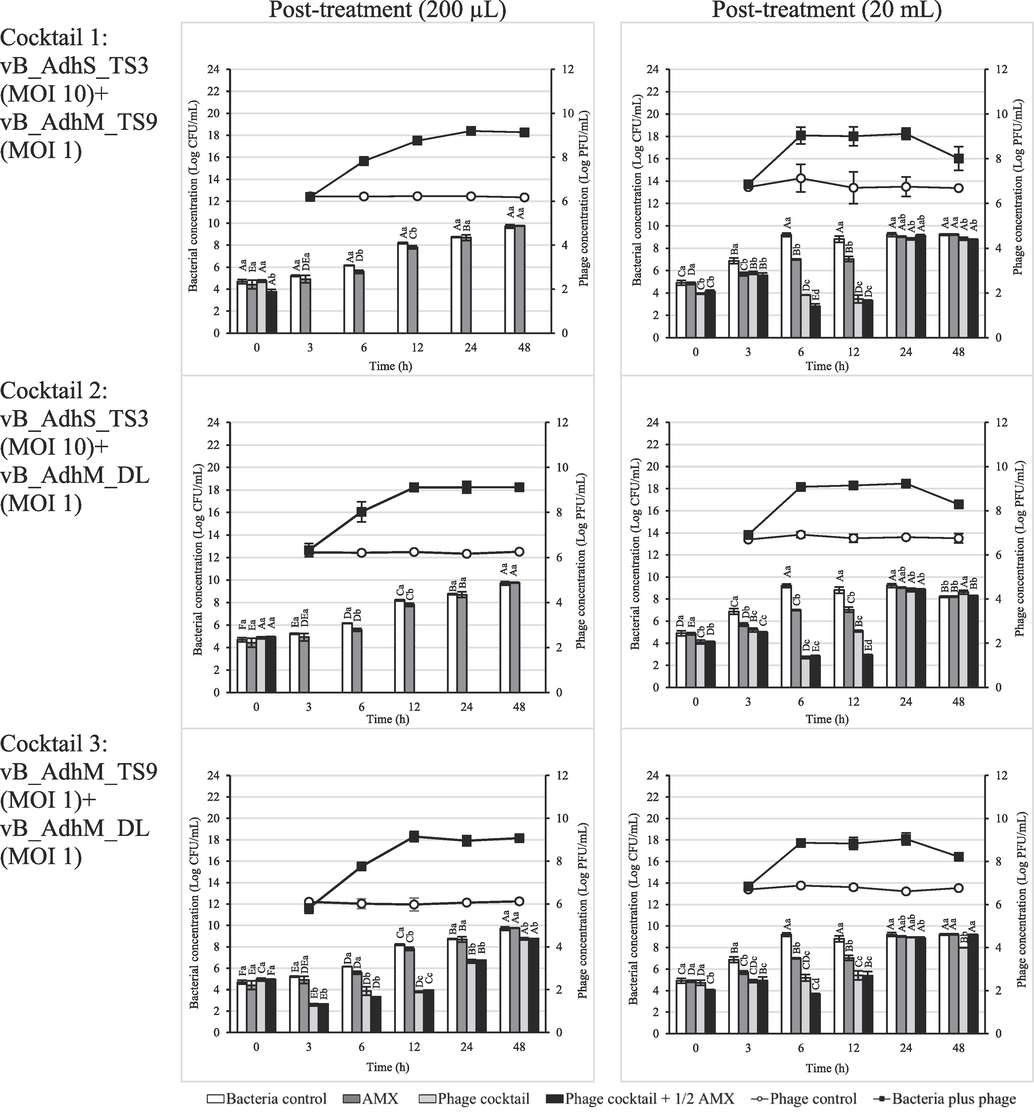
Effect of phage cocktail and amoxicillin combination at 1/2 MIC against A. dhakensis AM. The bar graph represents the bacterial concentration (log CFU/mL), and the line graph represents the phage concentration (log PFU/mL). The data are expressed as mean ± SD. All assays were carried out in triplicates. Each lowercase label corresponds to a significantly different (p < 0.05) bacterial concentration within each time point. Capital letters denote significantly distinct (p < 0.05) bacterial concentrations and time points compared to each other time point within the same conditions.
Our study demonstrates that phage-based approaches are an attractive way to inactivate A. dhakensis in vitro. The cocktail of three different bacteriophages (phage vB_AdhS_TS3, vB_AdhM_DL and vB_AdhM_TS9) revealed promising in vitro lytic activity on A. dhakensis. Furthermore, the combination therapy using phage cocktails and antibiotics showed greater promise compared with either therapy alone. Moreover, combination therapy can also prevent the development of resistant mutants that would otherwise develop rapidly when exposed to antibiotics or phages. This demonstrates that using phages as an adjuvant with a sublethal concentration of antibiotics is an effective therapeutic strategy.
Acknowledgements
This work was supported by Fundamental Fund (2021), Thailand Science Research and Innovation (TSRI) (grant number 031/2564), and graduate school fund, Faculty of Science, Srinakarinwirot University.
Declaration of Competing Interest
The authors declare that they have no known competing financial interests or personal relationships that could have appeared to influence the work reported in this paper.
References
- Bacteriophages. New York: Interscience Publishers; 1959.
- CARD 2020: antibiotic resistome surveillance with the comprehensive antibiotic resistance database. Nucleic Acids Res.. 2020;48(D1):D517-D525.
- [Google Scholar]
- Aeromonas aquariorum is widely distributed in clinical and environmental specimens and can be misidentified as Aeromonas hydrophila. J. Clin. Microbiol.. 2011;49(8):3006-3008.
- [Google Scholar]
- Antimicrobial susceptibilities of Aeromonas strains isolated from clinical and environmental sources to 26 antimicrobial agents. Antimicrob. Agents Chemother.. 2012;56(2):1110-1112.
- [Google Scholar]
- Nine novel phages from a plateau lake in southwest China: insights into Aeromonas phage diversity. Viruses.. 2019;11(7):615.
- [Google Scholar]
- SPAdes: a new genome assembly algorithm and its applications to single-cell sequencing. J. Comput. Biol.. 2012;19(5):455-477.
- [Google Scholar]
- Use of veterinary medicines in Thai aquaculture: Current status. In: Bondad-Reantaso M.G., Arthur J.R., Subasinghe R.P., eds. Improving Biosecurity Through Prudent and Responsible Use of Veterinary Medicines in Aquatic Food Production. Italy: Rome, FAO; 2012. p. :83-89.
- [Google Scholar]
- Reclassification of Aeromonas hydrophila subsp. dhakensis Huys et al., 2002 and Aeromonas aquariorum Martinez-Murcia et al., 2008 as Aeromonas dhakensis sp. nov. comb nov. and emendation of the species Aeromonas hydrophila. Syst. Appl. Microbiol.. 2013;36(3):171-176.
- [Google Scholar]
- Trimmomatic: a flexible trimmer for Illumina sequence data. Bioinformatics. 2014;30(15):2114-2120.
- [Google Scholar]
- FQC dashboard: integrates FastQC results into a web-based, interactive, and extensible FASTQ quality control tool. Bioinformatics. 2017;33(19):3137-3139.
- [Google Scholar]
- PlasmidFinder and pMLST: in silico detection and typing of plasmids. Antimicrob. Agents Chemother.. 2014;58(7):3895-3903.
- [Google Scholar]
- A major secreted elastase is essential for pathogenicity of Aeromonas hydrophila. Infect. Immun.. 2000;68(6):3233-3241.
- [Google Scholar]
- A comparative study of clinical Aeromonas dhakensis and Aeromonas hydrophila isolates in southern Taiwan: A. dhakensis is more predominant and virulent. Clin. Microbiol. Infect.. 2014;20(7):O428-O434.
- [Google Scholar]
- Performance standards for antimicrobial susceptibility testing of bacteria isolated from aquatic animals (third ed.). Wayne, PA: Clinical and Laboratory Standards Institute; 2020.
- Phage-Antibiotic Synergy (PAS): β-lactam and quinolone antibiotics stimulate virulent phage growth. PLoS ONE. 2007;2(8):e799.
- [Google Scholar]
- Characterization of bacteriophage pAh-1 and its protective effects on experimental infection of Aeromonas hydrophila in Zebrafish (Danio rerio) J. Fish Dis.. 2017;40(6):841-846.
- [Google Scholar]
- New approach to use phage therapy against Aeromonas hydrophila induced motile Aeromonas septicemia in Nile tilapia. J. Mar. Sci., Res. Dev.. 2016;6(194):2.
- [Google Scholar]
- Clinical relevance of the recently described species Aeromonas aquariorum. J. Clin. Microbiol.. 2009;47(11):3742-3746.
- [Google Scholar]
- The CGView server: a comparative genomics tool for circular genomes. Nucleic Acids Res.. 2008;36(2):W181-W184.
- [Google Scholar]
- Aeromonas hydrophila subsp. dhakensis subsp. nov., isolated from children with diarrhoea in Bangladesh, and extended description of Aeromonas hydrophila subsp. Int. J. Syst. Evol.. 2002;52(Pt 3):705-712. hydrophila (Chester 1901) Stanier 1943 (approved lists 1980
- [Google Scholar]
- The genus Aeromonas: taxonomy, pathogenicity, and infection. Clin. Microbiol. Rev.. 2010;23(1):35-73.
- [Google Scholar]
- Genomic structure of the Aeromonas bacteriophage pAh6-C and its comparative genomic analysis. Arch. Virol.. 2015;160(2):561-564.
- [Google Scholar]
- 16S/23S rRNA sequencing. In: Stackebrandt E., Goodfellow M., eds. Nucleic Acid Techniques in Bacterial Systematics. New York: Wiley; 1991. p. :115-175.
- [Google Scholar]
- Phages against pathogenic bacterial biofilms and biofilm-based infections: a review. Pharmaceutics. 2022;14(2):427.
- [Google Scholar]
- VFDB 2022: a general classification scheme for bacterial virulence factors. Nucleic Acids Res.. 2022;50(D1):D912-D917.
- [Google Scholar]
- Bacteriophage cocktail and phage antibiotic synergism as promising alternatives to conventional antibiotics for the control of multi-drug-resistant uropathogenic Escherichia coli. Virus Res.. 2021;198496
- [Google Scholar]
- Aeromonas aquariorum sp. nov., isolated from aquaria of ornamental fish. Int. J. Syst. Evol.. 2008;58(Pt 5):1169-1175.
- [Google Scholar]
- Isolation and characterization of a novel Podoviridae-phage infecting Weissella cibaria N22 from Nham, a Thai fermented pork sausage. Food Microbiol.. 2011;28:518-525.
- [Google Scholar]
- Molecular characterization of clinical isolates of Aeromonas species from Malaysia. PLoS ONE. 2012;7(2):e30205.
- [Google Scholar]
- Prokka: rapid prokaryotic genome annotation. Bioinformatics. 2014;30(14):2068-2069.
- [Google Scholar]
- Stronger together? Perspectives on phage-antibiotic synergy in clinical applications of phage therapy. Curr. Opin. Microbiol.. 2019;51:46-50.
- [Google Scholar]
- Isolation and characterization of Lactobacillus paracasei LPC and phage ΦT25 from fermented milk. Food Control.. 2017;73(Pt 8):1353-1361.
- [Google Scholar]
- Occurrence, molecular characterization, and antimicrobial susceptibility of Aeromonas spp. in marine species of shrimps cultured at inland low salinity ponds. Food Microbiol.. 2015;47:21-27.
- [Google Scholar]
Appendix A
Supplementary data
Supplementary data to this article can be found online at https://doi.org/10.1016/j.jksus.2024.103111.
Appendix A
Supplementary data
The following are the Supplementary data to this article:


