

Translate this page into:
Investigation of optical, electrical and magnetic properties of hematite α-Fe2O3 nanoparticles via sol-gel and co-precipitation method
⁎Corresponding author. fakharphy@gmail.com (M. Fakhar-e-Alam)
-
Received: ,
Accepted: ,
This article was originally published by Elsevier and was migrated to Scientific Scholar after the change of Publisher.
Peer review under responsibility of King Saud University.
Abstract
Hematite (α-Fe2O3) nanoparticles were synthesized using co-precipitation and sol–gel methods. X-ray diffraction (XRD) technique was employed to structural properties of the synthesized α-Fe2O3 nanoparticles and SEM(scanning electron microscopy) was used to analyze the morphological structure. The crystallite size is determined Sample-A (33 nm) and Sample-B (29 nm) by Scherer formula, while Volume of unit cell is measured 301.8 x10⁶ pm3 and 301.8 x10⁶ pm3 respectively. The X-ray density is found in the Sample-A 5.27 (g/cm3) and Sample-B 5.26 (g/cm3). The optical band gap energy measured 2.4–2.6 eV, calculated by the Tauc plot with the optical absorption data. The electrical characteristics of the samples were examined by using two probe methods and the possible impact of temperature on the electrical properties of α-Fe2O3 was investigated. Dielectric analysis reveals an inverse relationship between the permittivity of α-Fe2O3 samples and frequency that fulfills the Maxwell Wagner Model. The magnetic parameters were observed Ms = 9.29 emu, 1.72 emu and coercivity Hc = 1404(G) as well as Hc = 1040(G). The observed values of these factors indicate that the materials can be employed in a variety of applications such as catalysis, sensors and water purification.
Keywords
Co-precipitation
Sol-gel
Hematite (α-Fe2O3)
X-ray diffraction
Dielectric response
AC conductivity
Band gap
M−H loop

1 Introduction
Iron oxides are specifically of great importance due to their wide range applications in magnetic storage, rechargeable lithium batteries, catalysis, absorption at nanoscale (Kanungo et al., 1996). Iron oxides exist naturally in many different forms, hematite (α-Fe2O3), maghemite (γ-Fe2O3) and magnetite (Fe3O4) are most common (Khollam et al., 2002). Among all these types of iron oxides most stable is hematite having corundum structure R3c exhibit weak ferromagnetic pattern. Hematite shows 2.1 eV band gap in bulk form and it’s a n-type semiconductor. It has attracted many researchers due to its unique structural, optical, electrical and magnetic properties. Abaker et al., (2011) has synthesized α-Fe2O3 nanoparticles. The magnetic and optical properties show unusual behavior due to crystallite size and shape. (Assefa et al., 2022) has studied the Zn based spinel ferrite nanofibers prepared by electro spinning method. Dawit Gudeta (Gunjo et al., 2022) a paraffin-based nanofluid, blended with aluminum oxide (Al2O3) nanoparticles has been studied bio-applications. It can be inferred that combining latent heat storage devices (LHSD) with a solar water heater may be used in technologies such as biogas generation. It is noteworthy, (Nosheen et al., 2022) has been synthesized Al0.5Cr0.5Zn0Fe2O4 and Zn0.5Cr0.5Al0Fe2O4 ferrites via sol–gel auto combustion method. The study showed correlations between coercivity and crystallite size. In the both investigation reports, the materials have numerous applications in electronic, microwave fields and medical appliances. According to (Bahamonde et al., 2018) reports Biosensors are highly selective devices that are being employed in interdisciplinary research that connects the principle of fundamental science with biomedicine. Recent advancements in the field of applications, many methods have been used for the synthesis of iron oxide nano-powders. Now we going to synthesized same compound iron oxide nano-powders with two different methods such as co-precipitation and Sol-gel method. (Mustafa, et al., 2015a, 2015b). Preparation methods and mechanism of crystal growth of Fe2O3 nanoparticle has been reported with various shapes like nanowires, nano-plates, nano-rods and cubes and all the shapes of the materials depend upon the synthetic parameters, such as temperature, pH, Fe2+/Fe3+ ratio, annealing temperatures and mild reducing agent. Magntic nanoparticles towards biomedical applications show excellent potential especially for cancer treatment purpose (Abbas et al., 2022; Alam et al., 2021; Atif et al., 2010, 2011, Fakhar-e-Alam et al., 2020a,b, Hassan et al., 2022a,b; Mahmood et al., 2022).
The aim of current work is to synthesize materials with desirable applications such as -Fe2O3 nanoparticles at a low cost. It will be enthralling to examine different methodology co-precipitation and Sol-gel and its influence on the structural and optical, dialectical and magnetic properties. In this study, we investigate hematite (α-Fe2O3) nanoparticles to better understand the role of various methodologies and their impact on structural, optical, dialectical, and magnetic properties.
2 Materials and methods
2.1 Samples preparation
Synthesize and characterizations of Iron oxides powders by using the co-precipitation method. The desired product was obtained using a Fe(NO3)3·9H2O purity 98%, Sigma Aldrich, and sodium Hydroxide NaOH. 99% pure, Florida. These materials were mixed in the deionized water. NaOH solution was used for maintaining the pH level at 11, magnetic stirrer was used for this process. The precipitate obtained after magnetic stirrer process was digested in a preheated water at 75 °C for 1 h. For removing the byproducts, the precipitate was washed many times through deionized water and ethanol. Last step for getting required product was dry at 90 °C in an electrical oven for 24 h. With the help of mortar, the dried samples were grinded, and annealed at 500 °C for 3 h.
Another way to prepared Iron oxides powders with the Sol-gel method. The Fe(NO3)3·9H2O purity 98%, Sigma Aldrich, acetic acid C6H8O7 H2O, purity 98%, Fisher Scientific, deionize water and ammonia solution (32%) were used to control the pH 7. The prepared Fe(NO3)3·9H2O and acetic acid solutions were mixed and heated round about at 80 °C for 3 h, and then suitable amount of ammonia solution (32%) was added to control the pH 7. In this chemical procedure, the sol (or solution) gradually changes towards the formation of a gel. Similar experiment has been employed for variety of sample preparations (Atif et al., 2019; Atif et al., 2021; Fakhar et al., 2022). To obtain the powders were annealed at the same conditions, Pellets of these samples having thickness of 0.30 cm were made using hydraulic press by applying 35 kN load and sintered temperature 500 °C for 3 h. In order to get pallets with smooth surface, these were polished. The schematic diagram of the both methods sol–gel and co-precipitation is present in the Fig. 1.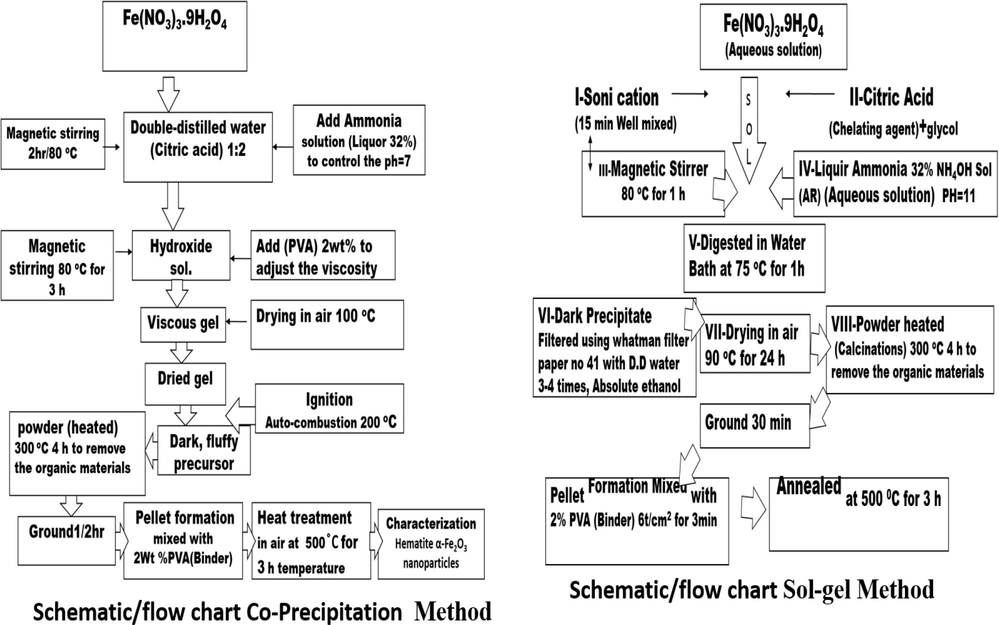
Schematic diagram of the sol–gel and co-precipitation method.
2.2 Characterizing techniques
XRD patterns were acquired at room temperature with powder samples applying an Xpert Pro PANalytical diffractometer with Nickel filtered Cu-Kα radiation λ = 1.5405 Å for internal structure study. Morphological study of the prepared sample was performed by SEM Manufacturer: JEOL Model: -JSM 5910. The Raman spectroscopy was done by using a Manufacturer company: HORIBA France SAS spectrometer, having argon-ion laser wavelength (623.8 nm). The obtained pattern by Raman spectroscopy was in back-scattering geometry by the powder between 250 and 800 cm−1. For optical analysis of the prepared sample, Shimadzu UV-2550 PC UV–Vis Spectrophotometers with wavelength with range from 200 to 1100 nm was used. The dielectric analysis of Iron oxides samples was obtained at room temperature by using Wayn Ker WK-6500B series precision impedance analyzers instrument. With the help of Vibrating sample magnetometer (VSM) Manufacturer company: Lake Shore Model: 7407 series magnetic properties were measured at room temperature.
The data obtained from XRD analysis was used to measure the physical parameters like lattice constant, volume of a unit cell, crystallite size and X-ray density by these formulas as listed below (Hassan et al., 2022a; Goldman et al., 2006).
Where a and c are lattice parameter, is unit cell volume, (hkl) are Miller indices, Z is the number of molecules per unit cell of the structure, NA show Avogadro's number (6.021023 g/mol), and M is molecular weight. The crystallite size (D) nm was calculated using Scherer's formula, as indicated by equation (3), Here K is shape factor, λ is wavelength of X-ray and θ is angle of diffraction.
Lattice strain and B is the full width at half maximum (FWHM). Here (δ) is represent dislocation density.
The samples were fabricated in the capacitor form for the response of the dielectric characteristics (Dielectric constant (ε′), Loss tangent (tan δ), and AC conductivity) and may be assumed electrically equal to capacitance Cp in parallel with resistance Rp. These values (Cp and Rp) were determined by applying an impedance analyzer, and the electrical parameters were determined by applying the below equations (Graca et al., 2007).
3 Results and discussion
3.1 X-ray diffraction analysis
The comparison of two different methodologies employed to observed structural evolution. The crystalline phases were identified using a (XRD) X-ray diffractometer for the structural analysis. Fig. 1 reveals the XRD patterns, Sample-A Iron oxides prepared by using co-precipitation method while Sample-B synthesized by another way Sol-gel method. Diffracted peaks were indexed according to (Chaudhari, et al., 2009) reported that samples have the rhombohedral structure of hematite α-Fe2O3, which were in similarity with JCPDS no.33–0664. The sharp diffracted peaks exhibited completely crystallinity of the given samples reported by (Mustafa et al., 2015a, 2015b). The peak location 2θ = 33.16° of the Sample-A shows the presence of α-Fe2O3, as it is the prominent peak related to the (1 0 4) plane similar results reported by (Lassoued et al., 2017). However, additional peaks located at 2◦θ = 24.18°, 35.68°,49.48° and 54.10° could not be linked to any diffracted intensity of Fe2O3 planes. According to (Justus et al., 2016) the additional peaks, the FeO2 and FeO phases of iron oxide can be associated.
The XRD patterns of hematite are shown in Fig. 2(b). hematite has eight prominent strong peaks which labeled with d spacing. Here, considered both Samples-A as well as Samples-B have same crystal structures. However, the peak intensities of the Sample-A are greater than Sample-B as prepared via co-precipitation method, the thin peaks behaviors which reflects the crystallite size of the particles result relates with a γ → α-Fe2O3 phase alteration, that occurred during calcination process at 500 °C and the faint peaks were seen at d-spacing of 2.86, 2.030, 1.7921, 1.5704 and 1.5382 Å, correspond to (phase rhombohedral structure) moderate crystalline of α-Fe2O3 was identified (Kumar et al., 2008). Low intense peaks confirm the phase formation of Fe2O3, however position of intense peak at d = 2.4724 Å corresponds to the FeO2 phase imply that the formation of Fe2O3 was not complete.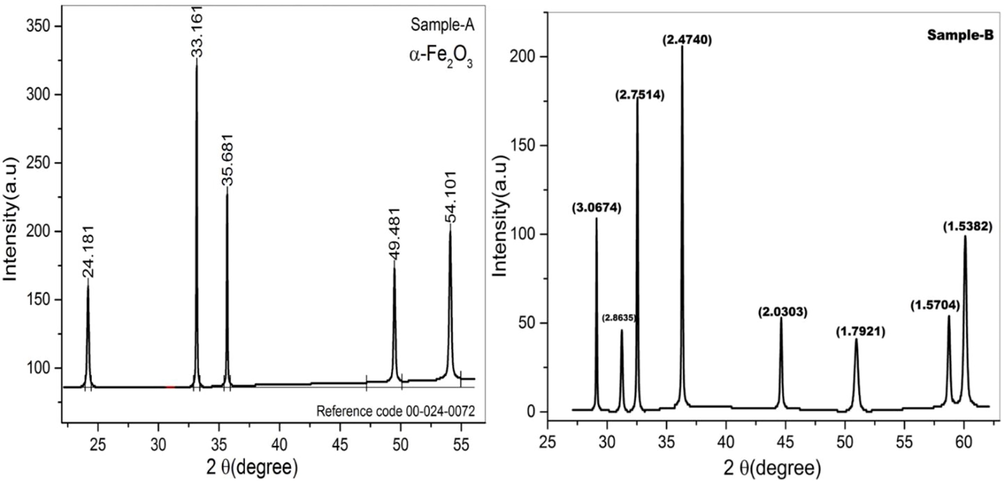
XRD scans of hematite prepared from (a) co-precipetation (b) Sol-gel method.
The XRD patterns of Sample-B represent in Fig. 2(b) composed of completely crystalline γ- Fe2O3 (minor phase, cubic, and spinel structure) and α- Fe2O3 (major phase) with an increase in the height of the peak which are linked to all the phases which formed the crystallization degree enhancement of α-Fe2O3 and γ-Fe2O3 reported by (Chaudhari et al., 2009).
The unit cell of α-Fe2O3 is hexagonal and consists only octahedral coordinated Fe3+ ions similar arguments reported by these researchers (Deraz et al., 2012). Eqs. (1)–(6) was used to derive the lattice parameters and other physical measurement. The lattice parameters of the ‘a’ and ‘c’ was calculated at 5.0369 and 13.7637 Å on Sample-A and Sample-B shows 5.0378 and 13.7694 A˚ respectively (Table 1). The values are calculated and listed in Table 1. The synthesized sample has mashed phase, the calculated parameters a = b = 5.4780 Å, c = 13.4216 Å not relates with the given basic values. This might be due to the position of the shifted peak of the Fe2O3 lattice. The prepared samples have FeO and FeO2 phases, minor change in the peak position results in the more changing in its lattice parameters. The structure of α- Fe2O3 NPs is shown in Fig. 2. Each Fe atom is surrounded by six oxygens forming FeO6 octahedral. In α-Fe2O3, the location of oxygen atom can be considered as approximating hexagonal close packing reported by (Sharma et al., 2020).
Sample Details
Lattice Parameter
Volume of unit cell x106 pm3
Density g/cm3
Crystallite Size nm
Dislocation density x1015 lines/m2
Micro strain
Sample -A
a = 5.0336 Å c = 13.7550 Å
301.8
5.27
33
0.918
0.0062
Sample- B
a = 5.0272 Å, c = 13.7540 Å
300.7
5.26
29
0.119
0.0084
In contrast, crystallite size was measured by Debye-Scherer’s Eq.3 and found in nanometer range. The Sample-A have 33 nm as compared to Sample-B = 29 nm. The crystallite size was found 12% smaller of the Sample-B which is prepared by Sol-gel method. Similar results of crystallite size were reported by (Lassoued et al., 2017). The unit cell volume of the Sample-A is observed 301.8 Å while the Sample-B has 3007 Å which is least as compared to other Sample-B. Moreover, the dislocation density and X-ray density measured and obtained values listed in the Table1. From XRD data to calculate and compared the ratios of peaks intensities (1 0 4)/(1 1 3) (Fe-occupancy/(oxygen layers) (Zhao et al., 2007). The obtained results shows that both Sample-A and Sample-B have no appreciable changes in ratios of peaks (1 0 4)/ (1 1 3) = 1.53. These results describe that the Sample-A and Sample-B may consist of the amorphous γ-Fe2O3 phase and nanocrystalline α-Fe2O3 phase. Another important observation of XRD scans all characteristic hematite peaks shift toward higher Bragg angles. This shift confirms the change in the crystallite size and the crystallinity of the prepared Sample-A and Sample-B. As a result, we can conclude that the α-Fe2O3 and γ-Fe2O3 phases in Sample-A are moderately crystalline. α-Fe2O3, γ-Fe2O3, and Fe3O4 phases are present in Sample-B. (Sharma et al., 2020).
3.2 Morphology analysis
Fig. 3 represents the SEM images of Iron oxides nanoparticles synthesized by different two ways. Transformation of ferrihydrite using alkaline conditions results in hematite and goethite as a product, and hematite shows a wide variety of different shapes. In this study we observed that the SEM images of Sample-A as well as Sample-B indicate that the formation of particles with clusters or aggregates. Fig. 3(c-d) SEM images of hematite crystals are found grain size in the order of nanometers. The images of the synthesis material showed aggregated nature, and hematite particles dominate over other crystal morphologies.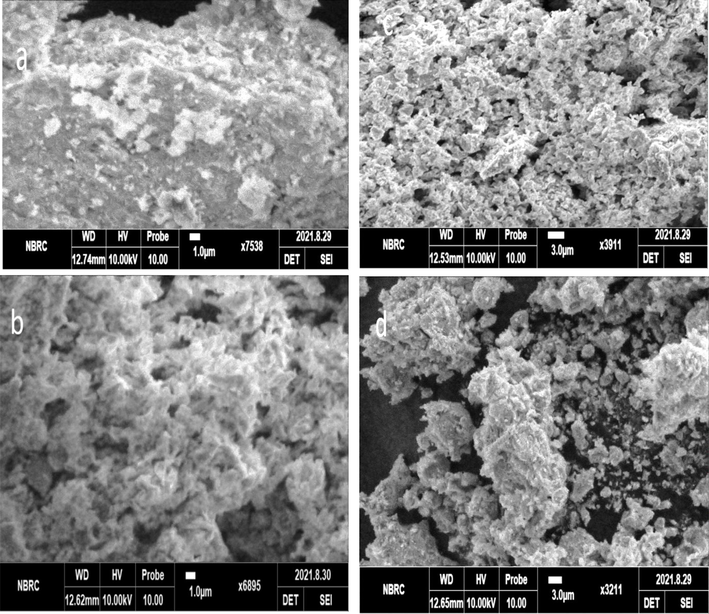
SEM images of hematite nanoparticles α-Fe2O3 (a) co-precipitation (b) Sol-gel.
3.3 Raman spectroscopy
Raman spectroscopy is a tool for the confirmation of phase purity and determines the crystalline and amorphous material qualities. The Raman spectra of the precursor and the end product are shown in Fig. 4(a to c), respectively. The hematite crystallizes in rhombohedra associated with the space group No.148 R-3. Five out of seven prominent bands of hematite verified by group theory having different intensities (A1g + Eg + 3T2g) surrounded by all sides and four active infrared modes.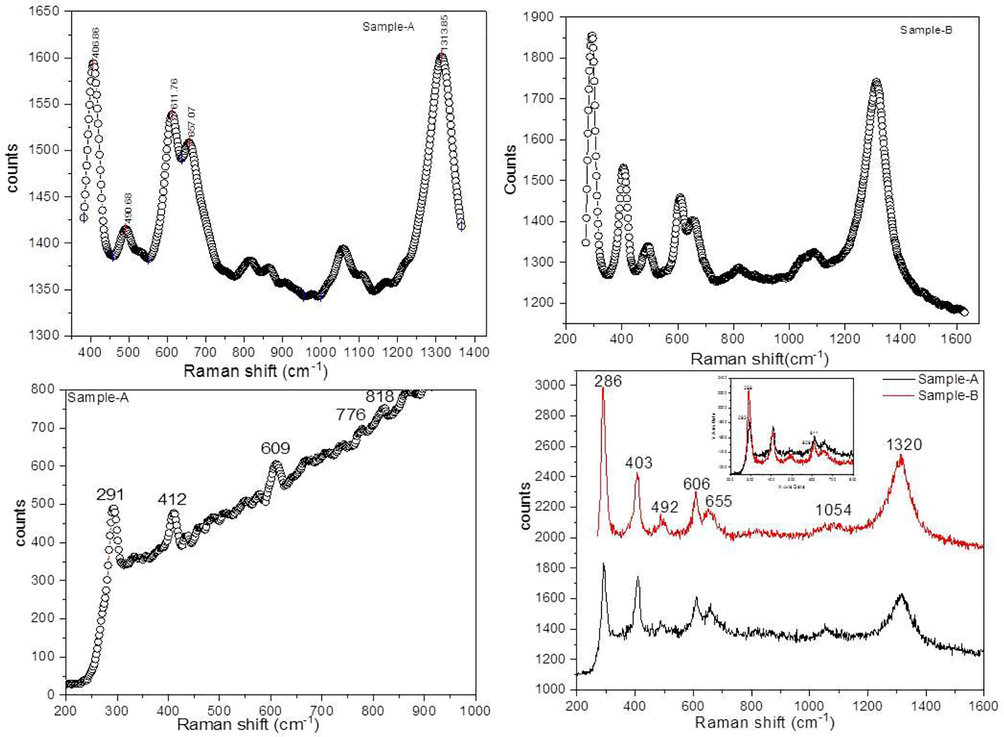
Raman spectra of the precursor (a) co-precipitation (b) Sol-gel.
The A1g mode (490.68 cm−1) and three Eg modes (286, 403 and 606 cm−1). The bands which represent the hematite are around 228.6 cm-1and 295.02 cm−1 and it was located in our spectrum at (286 cm−1 and 291 cm−1). The band near to 1313.85 cm−1 is a vibration which is due to unclear origin according to literature reported that the band 1313.85 cm-1 results from the scattering of two magnons exist in the structure, and (Chernyshova et al., 2007) reported that this process was due to second harmonic vibration of phonon. The bands in the Raman spectrum that are present 600 to 700 cm−1 in both the experimental and theoretical spectrums differ because the relative intensities are inverted. This variation shows the existence of γ → α-Fe2O3 and Fe3O4 in the sample having different phases. Additionally, in the spectrum related to experimental value does not appear which is according to the previous variation. There are two important and useful crystalline types of Fe2O3 first one is maghemite having cubic structure and hematite with the rhombohedral structure.
The variation in phase in γ → α-Fe2O3 occur in calcination process at about 500 °C. The variation in phase which took place during calcination gives α-Fe2O3 powder with significant grain growth and aggregation. (Bersani et al., 1999) reported disorder in the structure of hematite at the very initial stage of nanocrystalline material (ferrihydrite). For instance, if the origin of hematite is amorphous material from which it was changed into crystallized than it is possible to some extent that disorder in structure may be observed in crystalline hematite. Disorder may be lack of long range order and large number of atoms in layer surface.
3.4 UV–Vis studies
UV–Vis absorption spectrum was done for chemically synthesized Iron oxides α-Fe2O3 at room temperature are shown in Fig. 5. It can be observed that synthesized Iron oxides exhibit absorption bands observed for different Sample-A and Sample-B. The peak at 562, 674 and 902 nm were assigned to the pair excitation processes, these are ligand field transitions and the charge transfer band tails (Gao et al., 2012). In the present work, optical indirect and direct band gap energy (Eg) can be measured with using the Tauc equation.
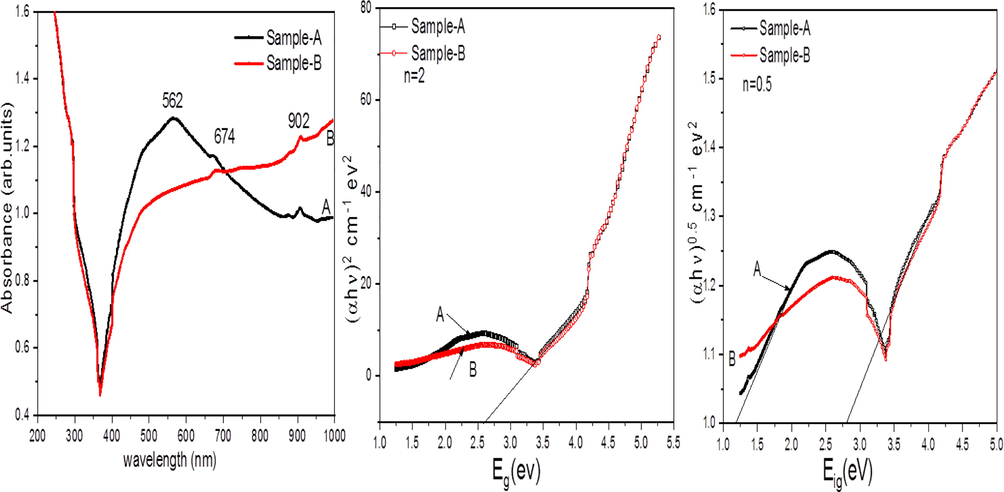
(a) UV–vis absorption spectra of the synthesized α-Fe2O3 NPs (b&c) Variation of (αhν)n (n = 0.5 and 2) Vs photon energy Eg(eV).
where, ‘hν’ denotes the incident photon energy in electron volt, ‘α’ represents absorption coefficient of the material, B is the constant which depends on material and Eg is optical band gap, and n may have different values according to direct allowed, indirect, forbidden and indirect forbidden transitions.
Tauc plots are shown in Fig. 5(b and c) the band gap energy can be calculated by the intercept of the plot of versus ‘hν’. The average band gap is determined by extrapolating the curve's linearly component. The mean band gap energy is found of the Sample-A and Sample-B is 2.4 eV for similar spherical and for quasi-cubic samples (Shebanova et al., 2003).
It has been observed that the band gap of an any material based on crystal structure as well as particle size of the material. It has been reported that α-Fe2O3 may exhibits direct and indirect band gaps (Jubb et al., 2010). The direct and indirect band gaps of -Fe2O3 in the literature are obtained to be closely related to 2.15 eV and 1.87 eV, respectively (Akl et al., 2004). The final results represent the blue shifts when it was made a comparison with the bulk α-Fe2O3, that may be the effect of quantum size. (Akl et al., 2012). Shape dependent effect due to possible orientation in single axis is an important key factor of optical properties. α-Fe2O3 nanoparticles mostly show unusual magnetic properties.
3.5 I-V characterization
Two probe method was used with the help of Keithley Electrometer Model 2401 for I-V characterization of Iron oxide α-Fe2O3. Pallets of Iron oxide were fabricated with particular dimensions. Fig. 6(a) shows a family of I-V curves in slope Sample-A was measured between 323 and 873 K temperatures. The electric resistivity of the given samples measured by using relation:
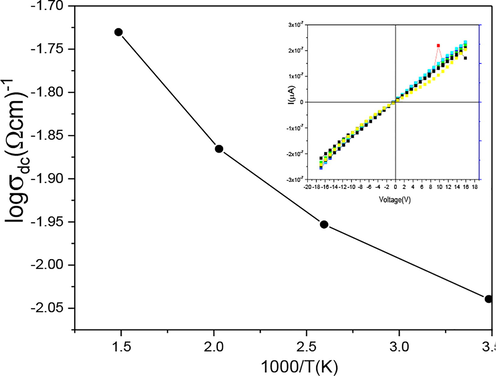
(insight) I-V characteristics (a) log Resistivity Vs 1000/T(k).
3.6 Dielectric properties
3.6.1 Frequency dependence of dielectric constant and dielectric loss tangent (tan δ)
In the present study, the dielectic parametrs namely dielctric constant, loss tangent and AC conductivity were measured at room temperatutre syntheized sample by sol gel and coprecipetation method. Both the dielectric constant and dielectric loss tangent (tan δ) have high value at higher frequency is caused by space charge polarisation. From the Fig. 7,it is observed that the dielectric constant and dielectric loss tangent values of the Sample-A and Sample-B remains constant behaviour in the high frequency region and applied electric field lagbehand the frequency.Therefore, Maxwell-Wagner interfacial type polarisation helps explain the dielectric trend (Liu et al., 2004).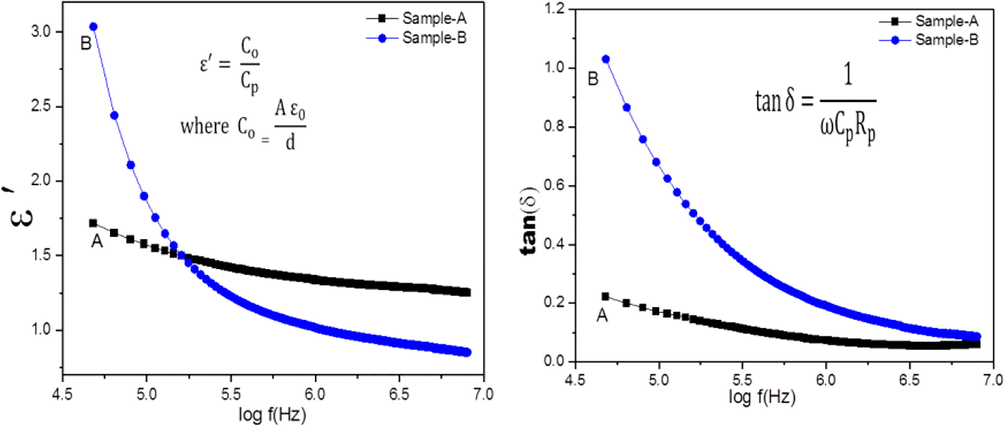
Variation on the (a) Dielectric constant and (b) Dielectric loss tangent Vs frequency.
3.6.2 AC-conductivity
Fig. 8 indicates the electrical conductivity of Iron oxides is only because of the Electron hopping between ions of the same element can occur in many valence states. Conductivity of Sample-A increased by increasing the frequency expressed a normal behavior. Therefore, It adheres/relates to a Power Law, which can be written as σac = Aωn. Here A is the constant which depends on the Temperature with conductivity units ohm.cm−1. The ω is the angular frequency and n is the constant its value varies from 0 to 1 which give the all information associated to material properties and more variation in properties occurs with increasing ion-ion interaction (Xu et al., 2005). It is concluded that the behavior of ac conductivity at low frequencies is influenced by the grain surface, whereas dispersion at high frequencies may be related to grain conductivity (Yuan et al., 2006).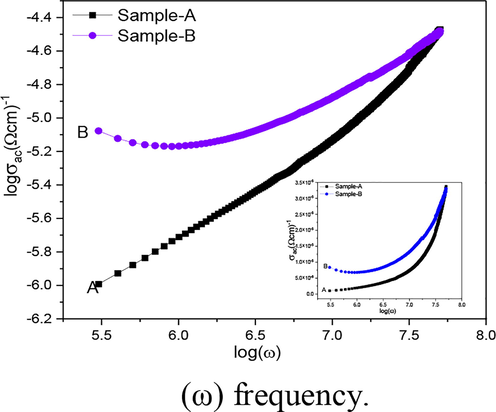
Variation of ac conductivity (σac) with log (ω) frequency.
3.7 MH-loop analysis
Fig. 9 represents the magnetic hysteresis loops of the synthesized samples at room temperature. The results showed the saturation magnetization (Ms) Sample-A have 9.89 emu while Sample-B 1.72 emu. The values of remanent magnetization (Mr) Sample-A have 4.63 emu as compared to Sample-B 0.65 emu and coercivity (Hc) observed of the Sample-A 1404(G) as well as Sample-B have the coercivity (Hc) 1040(G). Moreover, the sample displayed the highest magnetic properties and based on the microstructure variations. It may be due to the effect of possible orientation in single axis. Therefore, magnetization also depend on the shape of Fe2O3 samples. The variation of the magnetic parameters also depends upon the method of preparation of prepared samples. The arrangement pattern of Fe3+ ions produce the pair of FeO6 octahedral attached with Fe3+ ions coupled by antiferromagnetic behavior by the shared octahedral faces also with c-axis of unit cell.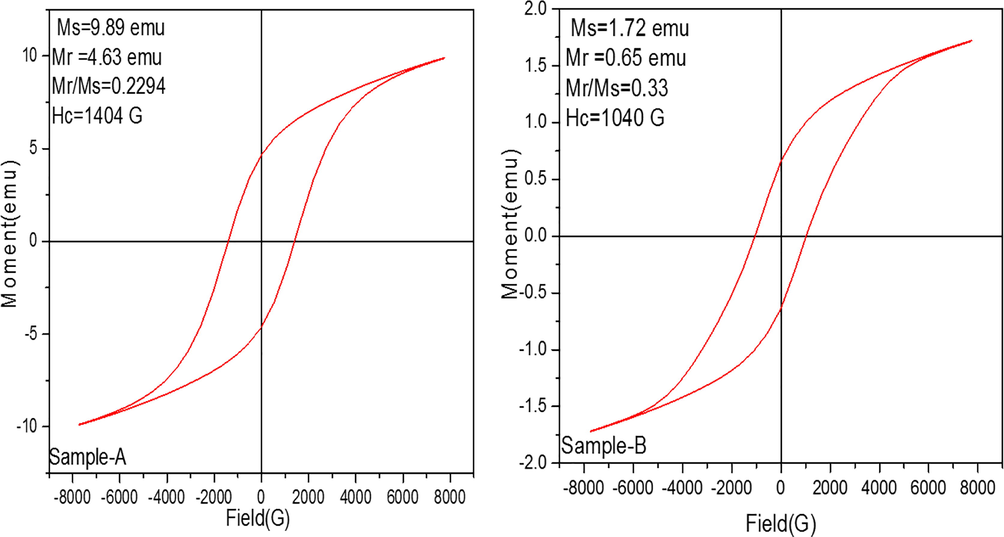
M−H loops of prepared α-Fe2O3 nanoparticles observed at room temperature.
Two inter-penetrating antiferromagnetic sub lattices can be found in the basal plane which results in ferromagnetic interaction (Zhang et al., 2009).
4 Conclusions
In summary, the hematite a particle including α-Fe2O3 NP with distinct size and shape has been successfully prepared via the Sol-gel and co-precipitation method. The microstructural study was done by the most using technique XRD. Scherrer's formula was used to calculate the crystallite size, Sample-A, have 33 nm while the Sample-B = 29 nm which is 12% smaller as compared to Sample-B which is prepared by Sol-gel method. The SEM analysis was shows the morphology of the material. Tauc plot is employed to estimate the optical band gap energy. In particular, the Sample-A is showing the transition in phase from goethite to hematite consequently change in the bandgap and structure. Thermal effect on, Iron oxides nanoparticles is showing bandgap decreased and transferred the phase from goethite to hematite. The Maxwell-Wagner polarisation model is used to predict changes in the dielectric constant and loss tangent with frequency. Materials with low dielectric loss can be used to make high frequency devices. The magnetic behavior of the sample-A observed dominate Ms = 9.29 emu and coercivity Hc = 1404(G) as compared to Sample-B. The synthesized materials can be used in many applications such as catalysis, sensors and water purification.
Acknowledgement
Researchers Supporting Project number (RSP2023R397), King Saud University, Riyadh, Saudi Arabia
Declaration of Competing Interest
The authors declare that they have no known competing financial interests or personal relationships that could have appeared to influence the work reported in this paper.
References
- Nanoparticles of thiolated chitosan for controlled delivery of moxifloxacin: in-vitro and in-vivo evaluation. J. King Saud. Univ. Sci.. 2022;34(7):102218.
- [Google Scholar]
- Assessment of green and chemically synthesized copper oxide nanoparticles against hepatocellular carcinoma. J. King Saud Univ. Sci.. 2021;33:101669
- [Google Scholar]
- Experimental investigation and parametric optimization of the tungsten inert gas welding process parameters of dissimilar metals. Materials. 2022;15(13):4426.
- [Google Scholar]
- Study of the efficacy of 5-ALA mediated photodynamic therapy on human rhabdomyosarcoma cell line (RD) Laser Phys. Lett.. 2010;7(10):757-764.
- [Google Scholar]
- Analysis of the combined effect of lasers of different wavelengths for PDT outcome using 600, 630, and 660 nm. Laser Phys. Lett.. 2011;8(5):386-392.
- [Google Scholar]
- Manganese-doped cerium oxide nanocomposite induced photodynamic therapy in MCF-7 cancer cells and antibacterial activity. BioMed. Res. Int. 2019
- [Google Scholar]
- Manganese-doped cerium oxide nanocomposite as a therapeutic agent for MCF-7 adenocarcinoma cell line. Saudi J. Biol. Sci.. 2021;28(2):1233-1238.
- [Google Scholar]
- Micro-Raman investigation of iron oxide films and powders produced by Sol–gel syntheses. J. Raman Spectrosc.. 1999;30(5):355-360.
- [Google Scholar]
- Easy synthesis and characterization of single-crystalline hexagonal prism-shaped hematite α-Fe2O3 in aqueous media. Cryst Eng Comm. 2009;11(11):2264-2267.
- [Google Scholar]
- Size-dependent structural transformations of hematite nanoparticles. 1. Phase transition. Phys. Chem. Chem. Phys.. 2007;9(14):1736-1750.
- [Google Scholar]
- Novel processing and magnetic properties of hematite/maghemite nano-particles. Ceram. Int.. 2012;38:4049-4055.
- [Google Scholar]
- Spectroscopic features of PHOTOGEM® in human Rhabdomyosarcoma (RD) cellular model. J. King Saud Univ.-Sci.. 2020;32(7):3131-3137.
- [Google Scholar]
- Synergistic effect of TEMPO-coated TiO2 nanorods for PDT applications in MCF-7 cell line model. Saudi J. Biol. Sci.. 2020;27(12):3199-3207.
- [Google Scholar]
- Synthesis, characterization, and application of BaTiO3 nanoparticles for anti-cancer activity. J. Cluster Sci. 2022:1-11.
- [Google Scholar]
- A novel anticancer and antifungus phenazine derivative from a marine actinomycete BM-17. Microbiol. Res.. 2012;167(10):616-622.
- [Google Scholar]
- Goldman, A., 2006. A Green approach: synthesis, characterization and opto-magnetic properties of MgxMn1-xFe2O4 spinel nanoparticles. Ferrite Technology, 2nd ed.,Springer Publication,83-135.
- Electric and dielectric properties of a SiO2–Na2O–Nb2O5 glass subject to a controlled heat-treatment process. Physica B. 2007;396:62-69.
- [Google Scholar]
- Improvement in thermal storage effectiveness of paraffin with addition of aluminum oxide nanoparticles. Materials. 2022;15(13):4427.
- [Google Scholar]
- Physical properties of PEG coated Y doped ZnO nanoparticles and their potential as high gamma dose thermoluminescence material. J. King Saud Univ. Sci.. 2022;34:101958
- [Google Scholar]
- Hydrothermally synthesized lanthanide-incorporated multifunctional zirconia nanoparticles: Potential candidate for multimodal imaging. J. King Saud Univ. Sci.. 2022;34:10208.
- [Google Scholar]
- Vibrational Spectroscopic characterization of hematite, maghemite, and magnetite thin films produced by vapor deposition. ACS Appl. Mater. Interfaces. 2010;2(10):2804-2815.
- [Google Scholar]
- Synthesis and characterization of hematite nanopowders. Mater. Res. Express. 2016;3(10):105037
- [Google Scholar]
- Thermal dehydration and decomposition of FeCl3·xH2O. J. Thermal Anal.. 1996;46:1487-1500.
- [Google Scholar]
- Microwave hydrothermal preparation of submicron-sized spherical magnetite (Fe3O4) powders. Mater. Lett.. 2002;56(4):571-577.
- [Google Scholar]
- Size-induced effect on nano-crystalline CoFe2O4. J. Magn. Magn. Mater.. 2008;320(11):1729-1734.
- [Google Scholar]
- Synthesis, structural, optical and morphological characterization of hematite through the precipitation method: effect of varying the nature of the base. J. Mol. Struct.. 2017;1141:99-106.
- [Google Scholar]
- Large dielectric constant and Maxwell-Wagner relaxation in Bi2/3Cu3Ti4O12. Phys. Rev. B. 2004;70(14):144106
- [Google Scholar]
- Analyses of structural and electrical properties of aluminium doped ZnONPs by experimental and mathematical approaches. J. KinG Saud Univ. Sci.. 2022;34:101796
- [Google Scholar]
- Temperature dependent structural and magnetic properties of Cerium substituted Co–Cr ferrite prepared by auto-combustion method. J. Magn. Magn. Mater.. 2015;378:409-416.
- [Google Scholar]
- Influence of the divalent and trivalent ions substitution on the structural and magnetic properties of Mg0.5−xCdxCo0.5Cr0.04TbyFe1.96−yO4 ferrites prepared by sol–gel method. J. Magn. Magn. Mater.. 2015;387:147-154.
- [Google Scholar]
- Synthesis and characterizations of novel spinel ferrites nanocomposites Al0. 5Cr0. 5Zn0Fe2O4 and Zn0. 5Cr0. 5Al0Fe2O4. J. Cluster Sci. 2022:1-6.
- [Google Scholar]
- Recent advances in graphene-based biosensor technology with applications in life sciences. J. Nanobiotechnol.. 2018;16(1):1-17.
- [Google Scholar]
- Biosynthesis of hematite nanoparticles using Rheum emodi and their antimicrobial and anticancerous effects in vitro. J. Photochem. Photobiol. B: Biol.. 2020;206:111841
- [Google Scholar]
- Raman spectroscopic study of magnetite (FeFe2O4): a new assignment for the vibrational spectrum. J. Solid State Chem.. 2003;174(2):424-430.
- [Google Scholar]
- Synthesis, ferroelectric and piezoelectric properties of some (Na0.5Bi0.5)TiO3 system compositions. Mater. Lett.. 2005;59(19–20):2437-2441.
- [Google Scholar]
- Multiferroic properties of single-phase Bi0.85La0.15FeO3 lead-free ceramics. J. Am. Ceram. Soc.. 2006;89(10):3136-3319.
- [Google Scholar]
- High-Strain lead free antiferroelectric electrostrictor S. Adv. Mater.. 2009;21(46):4716-4720.
- [Google Scholar]
- Iron oxide (III) nanoparticles fabricated by electron beam irradiation method. J. Wang Sci. Poland. 2007;25(4)
- [Google Scholar]
Appendix A
Supplementary material
Supplementary data to this article can be found online at https://doi.org/10.1016/j.jksus.2023.102695.
Appendix A
Supplementary material
The following are the Supplementary data to this article:


