

Translate this page into:
A study of the morphological and geographical diversity of Korean indigenous buckwheat landraces for breeding
⁎Corresponding author. yschung@jejunu.ac.kr (Yong Suk Chung)
-
Received: ,
Accepted: ,
This article was originally published by Elsevier and was migrated to Scientific Scholar after the change of Publisher.
Abstract
This study was carried out to explore the significance of morphology-based selection for breeding, using a case study of indigenous buckwheat landrace from Korea. Although many studies have utilized molecular methods to investigate germplasm diversity, this research underscores the often-overlooked importance of morphology-based selection in breeding strategies. Furthermore, it highlights the necessity of considering geographical information only when it accurately reflects the actual environment. The study collected and analyzed five traits from 96 samples across 27 varieties. The hypothesis was that these 27 samples might have been grouped by region due to similar environmental conditions. This hypothesis was tested using a dendrogram, clustering, correlation analysis of each trait, and PCA analysis. The results showed that morphological traits are a crucial factor in germplasm or landrace selection and that they should be considered the basic information for breeding purposes. Morphological traits were found to be random regardless of the locations where they were collected, indicating that they should be used to determine breeding targets rather than geographic locations. The study suggested that understanding the physiological traits of specific germplasm groups can accelerate breeding efforts. Overall, this study provided important insights into the selection of germplasm or landrace for breeding purposes, highlighting the importance of morphology-based selection and the need to consider environmental factors.
Keywords
Buckwheat breeding
Landrace
Traits
Phenotypic variation
Environmental factors

1 Introduction
Numerous studies have examined germplasm diversity using molecular approaches, especially next-generation sequencing technologies (Dar et al., 2018; Yasui, 2020). Indeed, they revealed important differences and even the evolutionary lineages to facilitate better breeding strategies (Dar et al., 2018; Yabe & Iwata, 2020). However, the breeding is based on the traits, not the DNA itself (Varshney & Dubey, 2009; Singh et al., 2020). Although genotype by the environment is essential for breeding targeting a wide area, it could be studied better using molecular information but the phenotype in the given local is crucial for local breeding (Karunathilake et al., 2023; Sheikh et al., 2024; Mansoor and Chung, 2024a; Mansoor et al., 2024b). The importance of geographical information is repeatedly emphasized for collecting germplasm or landraces (Engels et al., 1995). It is because geographical information is believed to provide the environmental information responsible for the genetic diversity associated with morphological diversity. However, it is not always true since the earth's surface is dynamically different, generating numerous kinds of environments. Thus, the selection for germplasm or landrace should be based on morphological information rather than geographical one.
Buckwheat is pseudocereal which is cultivated and consumed in limited regions of the world, such as Eastern Europe and eastern Asia (Ikeda, 2002; Suzuki et al., 2020). However, buckwheat has many health-beneficial ingredients, for instance, flavonoids, dietary fiber, resistant starch, various minerals, and vitamins (Cui et al., 2019; Luthar et al., 2021b; Ruan et al., 2022). In addition, because of the recent rapid climate change and instability of the international situation, discovering new grain cultivars which are growing fast and stable is becoming essential. Because buckwheat is resistant to environmental changes and can be harvested quickly, there are historical examples of it being used as a substitute crop when crop failures occur (Park & Chang, 2002). Because of these reasons, buckwheat has many reasons to breed new cultivars for the future. However, the effort for breeding buckwheat is lacking, and collecting various genetic resources is insufficient. To add the effort for buckwheat breeding, the current study collects and analyzes five traits from a total of 96 samples of 27 varieties. Our hypothesis is 27 varieties might be grouped by region because the close region might have similar environments. We are going to test the hypothesis by a dendrogram, clustering, correlation of each trait, and PCA analysis. This research is a case study that demonstrates the importance of morphology-based selection using buckwheat (Fagopyrum esculentum) landrace indigenous to Korea. Also, the perspectives from the current study might be possibly applied to other crop genetic resource collections.
2 Materials and methods
2.1 Plant materials
Twenty-seven landraces of buckwheat (F. esculentum) from various provinces in Korea were randomly selected (Table 1). The collection of the germplasms was used in this experiment reflected the passport information released by the germplasm management system (GMS) held by the National Agrobiodiversity Center (NAC). Each landrace consisted of 4 plants in each pot (inner diameter 16 cm, height 12 cm), in which 80 % of the pot space was filled with 430 g of artificial soil (Dduksim-e, Nongwoo Bio Co., Ltd) at the glasshouse of Jeju National University from 5 May 2019, to 9 July 2019. Those pots were completely randomized. The average temperature of the glasshouse was kept from 28 ℃ to 32 ℃, and all plants were evenly watered in the amount of 200 ml at 09:00 AM and 4:00 PM twice. The height was measured using a tape measure from the ground to the terminal bud, and the number of stem nodes was obtained immediately after the flowering date. The flowering date of each buckwheat (F. esculentum) variety was determined by the date that half of the flower buds bloomed on individual plants. However, 12 landraces (IT101120, IT105699, IT108752, IT111123, IT113084, IT113582, IT185685, IT185687, IT191108, IT208826, IT210198, and IT250616) survived three replicates during the growth period.
IT Number
Origin
IT Number
Origin
IT250614
Samcheok, Gangwon
IT102854
Wolseong, Gyungbuk
IT185685
Wonju, Gangwon
IT113582
Uiseong, Gyungbuk
IT210198
Jeongseon, Gangwon
IT102780
Cheongdo, Gyungbuk
IT101282
Pyeongchang, Gangwon
IT250616
Ganghwa, Gyeonggi
IT104551
Pyeongchang, Gangwon
IT250618
Ganghwa, Gyeonggi
IT108885
Pyeongchang, Gangwon
IT208826
Haenam, Jeonnam
IT185687
Yongin, Gyeonggi
IT112982
Gimje, Jeonbuk
IT103633
Geochang, Gyungnam
IT105254
Okgu, Jeonbuk
IT191108
Masan, Gyungnam
IT101120
Wanju, Jeonbuk
IT105649
Miryang, Gyungnam
IT105699
Jangsu, Jeonbuk
IT104769
Hadong, Gyungnam
IT111123
Geumsan, Chungnam
IT104139
Geumneung, Gyungbuk
IT113458
Yeongi, Chungnam
IT113084
Dalseong, Gyungbuk
IT162837
Okcheon, Chungbuk
IT108752
Yeongdeok, Gyungbuk
2.2 Statistical analysis
Plant height, the number of totals, main, side node, and flowering date data of the buckwheat (F. esculentum) were used in statistical analysis. The statistical analysis was analyzed by R software (Ver. 4.1.2, the R foundation for statistical computing, Vienna, Austria). The data were standardized before the cluster analysis using the “caret” package in R software, with Euclidean distance used for clustering. The analysis was performed step by step, beginning with the determination of the best number of clusters and the application of k-means clustering by “NbClust” packages. A dendrogram was then created, and the results were merged for easier understanding. Before the comparison, each buckwheat (F. esculentum) variety’s traits among and within the clusters were confirmed normality by the Shapiro-Wilk normality test (Shapiro & Wilk, 1965). Some of the data sets failed to satisfy normality. Therefore, The Kruskal-Wallis test was used for data analysis (Kruskal et al., 2014). Spearman’s rank correlation coefficient test (Spearman, 2010) was conducted between measured variables (Plant height, the number of totals, main, side node, and flowering date) by using the “Hmisc” package. Additionally, principal component analysis (PCA) was performed with the same package to summarize the relationships among plant height, side node, total node, main node, and flowering date.
3 Results
The total number of nodes was comprised of the number of main and side nodes. More nodes meant that more flowering could occur, which was associated with the yield. The main nodes were attached to the main stem, which was related to plant height, although the length between nodes was also associated with plant height. They characterized vertical traits. On the other hand, the side nodes came from diverged branches of the main nodes. Thus, they determined the horizontal shapes. Nbclust revealed that twenty-seven landraces with five agronomic traits such as height, number of total, main, side nodes, and flowering date were grouped into three clusters. (Fig. 1). The cluster dendrogram based on Nbclust presented clusters 1, 2, and 3 in green, red, and blue color, respectively (Fig. 2). It was confirmed by the Kruskal-Wallis rank sum test, which showed that every trait observed in the current study did not have a difference within each cluster except for a minor difference in flowering date in cluster 3, unlike the results without clustering (Table 2). The results of Principal Component Analysis (PCA) indicated that the variance sources and the factors responsible for this clustering could be grouped into two: one was the number of side nodes and total nodes, and the other was the number of main nodes, flowering date, and plant height (Fig. 3). The direction of vectors of all traits was toward the right side, indicating they were indeed the factors that differentiated those landraces, although the number of total nodes and side nodes was almost overlapped. The magnitude of PC1 responsible for the variances of all traits was 80.56 %, while they were split into two directions, upward and downward. However, this split explained a relatively small magnitude of 13.30 %. Overall, the results of PCA elucidated that plant height, number of nodes, and flowering date could explain the variances of those landraces used in the current study.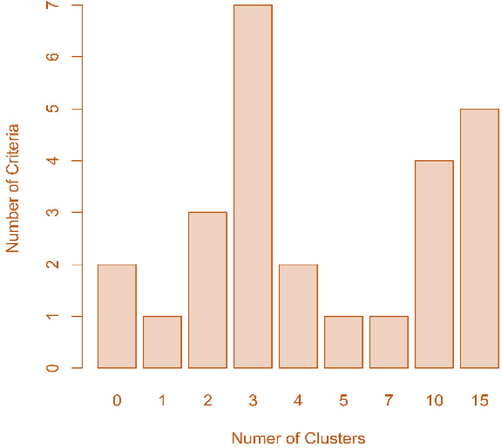
Nbclust result. Determining the best number of clusters in a buckwheat data set with 27 varieties with five traits (height, number of total, main, side nodes, and flowering date).
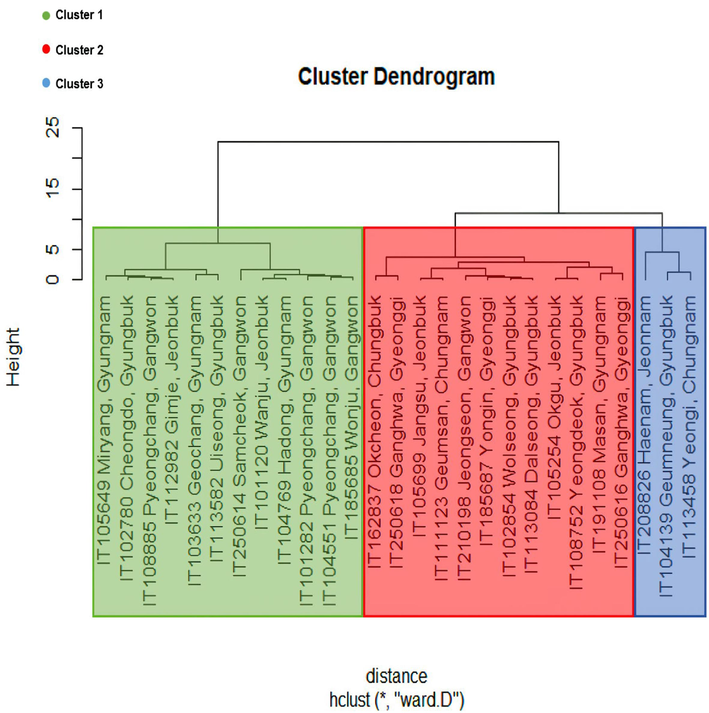
The result of Cluster Dendrogram and K-means clustering results. Cluster dendrogram of 27 varieties of buckwheat’s five traits (plant height, number of totals, main, side node, and flowering date) by ward.D method. The green, red, and blue background represents clusters 1, 2, 3 by K-means clustering, respectively.
Source
Df
Height
Total node number
Side node number
Main node number
Flowering date
All 1
26
0.00 ***, 3
0.00 ***
0.00 ***
0.00 ***
0.00 ***
Cluster 12
11
0.09 NS
0.47 NS
0.12 NS
0.47 NS
0.16 NS
Cluster 2
11
0.81 NS
0.91 NS
0.55 NS
0.85 NS
0.21 NS
Cluster 3
2
0.07 NS
0.34 NS
0.31 NS
0.31 NS
0.04 *
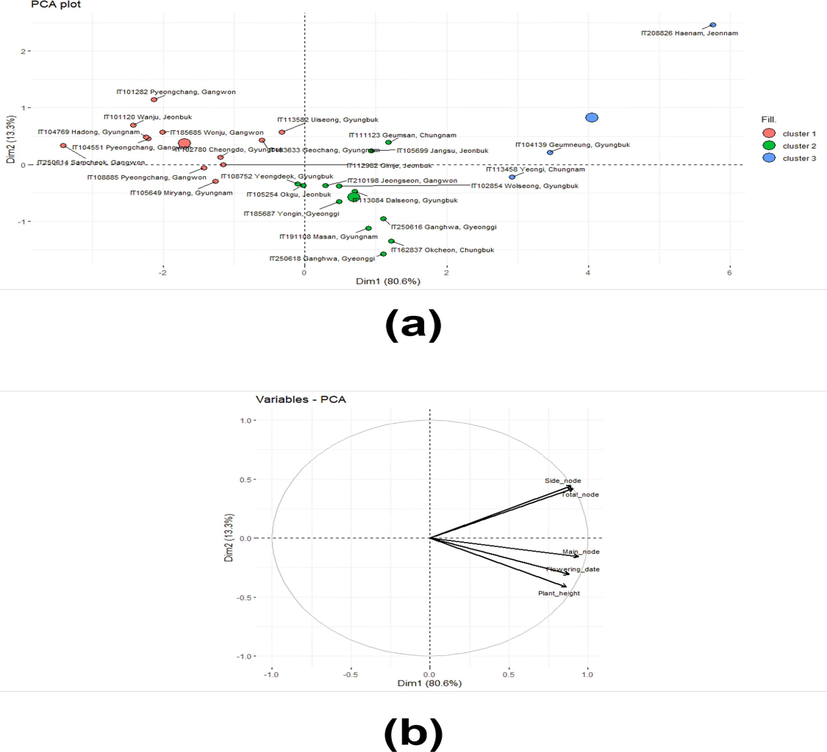
Result of PCA analysis with data set with 27 varieties with five traits (height, number of total, main, side nodes, and flowering date). (a) PCA plot with each sample and cluster. The big dot in the figure means the cluster region. (b) PCA plat with variable ar-rows.
The correlations among five traits across all clusters, specifically clusters 1, 2, and 3, exhibited distinctive characteristics, which were crucial because these differences determined plant architecture and harvest time (Table 3). In all clusters, the correlations among all traits were significant, ranging from 0.47 to 1.00, and were statistically significant. All observed correlations were positive.
Total node
number
Main node
number
Side node
number
Flowering date
Plant height
All
0.60***, 1
0.86***
0.58***
0.73***
Cluster 1
0.31*
0.80***
0.27*
0.42**
Cluster 2
0.61***
0.76***
0.60***
0.56***
Cluster 3
−0.24NS
−0.05NS
−0.25NS
−0.50NS
Total node number
All
0.65***
1.00***
0.50***
Cluster 1
0.27*
1.00***
0.08NS
Cluster 2
0.69***
1.00***
0.25NS
Cluster 3
0.40NS
0.99***
0.68*
Main node number
All
0.61***
0.75***
Cluster 1
0.22NS
0.40*
Cluster 2
0.66***
0.57***
Cluster 3
0.31NS
0.61*
Side node number
All
0.47***
Cluster 1
0.06NS
Cluster 2
0.23NS
Cluster 3
0.64*
In cluster 1, the positive correlations between plant height and the number of main nodes, and between the number of total nodes and side nodes, were 0.80 and 1.00, respectively; both were statistically significant. In cluster 2, the positive correlations between plant height and the number of total nodes, main nodes, and side nodes were 0.61, 0.76, and 0.60, respectively; between the number of total nodes and side nodes were 0.69 and 1.00, respectively; and between the number of main nodes and side nodes was 0.66, all of which were statistically significant. In cluster 3, the positive correlations between the number of total nodes and side nodes, and flowering date were 0.99 and 0.66, respectively; between the number of main nodes and flowering date was 0.61; and between the number of side nodes and flowering date was 0.64; all were statistically significant.
Based on the results of the correlations in clusters, the morphological characters could be described as follows. For all clusters, taller landraces highly tended to have more main nodes and delayed flowering. Interestingly, those landraces that had a greater number of main nodes were highly inclined to delay flowering. For cluster 1, the taller plants tended to have more main nodes as with all clusters, while the number of side nodes and flowering date were not related.
Moreover, the relationship between the number of main nodes and side nodes suggested that the architectural structure of the landraces could not be easily determined. It was possible that some landraces had a narrow architecture with fewer side nodes, while others exhibited a bush-like architecture with a higher number of side nodes. In Cluster 2, the landraces exhibited similar patterns to Cluster 1 in terms of plant height and four other traits. However, they tended to have more total nodes and side nodes when they had a higher number of main nodes, indicating a greater number of branches both vertically and horizontally. This suggested that these landraces were more likely to have a bush-like architecture.
Cluster 3, on the other hand, showed a tendency for landraces to have more side nodes when they had more main nodes. Consequently, an increase in side nodes led to a higher total number of nodes. Interestingly, there was no correlation between plant height and the number of main nodes in this cluster, suggesting that the length of internodes in the main stem might have varied among these landraces. Additionally, the fact that the number of main nodes was not correlated with the total number of nodes but with the number of side nodes indicated a bush-like architecture for these landraces.
Across all clusters (Cluster 1, 2, and 3), landraces with a higher total number of nodes tended to have more side nodes. This highlighted the importance of side nodes for yield, considering that flowering occurred at the nodes. Therefore, the number of side nodes became a crucial factor to consider for maximizing yield (Fig. 4).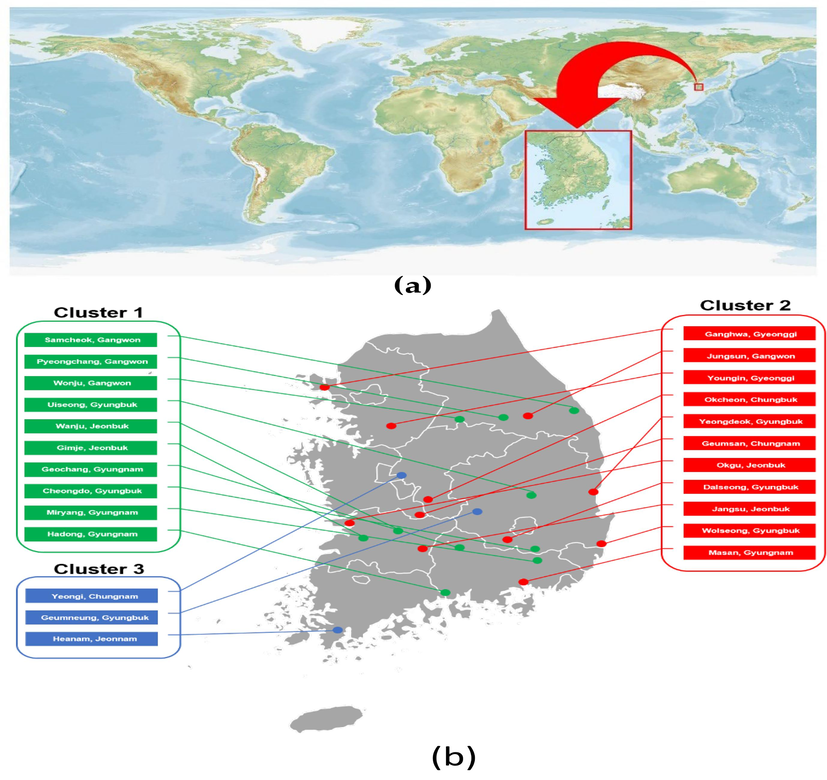
Buckwheat sample location map. (a) The geographic location of Korea on the world map; (b) buckwheat sampling location in Korea.
4 Discussion
Buckwheat is a crop with significant genetic diversity, and studying this diversity allows for the identification and conservation of unique and valuable genetic traits. Preserving genetic diversity is crucial for future crop improvement, as it provides a pool of genetic resources that can be tapped into to develop new varieties with improved traits, such as disease resistance, tolerance to environmental stress, and higher yields (Park & Chang, 2002). Understanding buckwheat diversity enables breeders to make informed decisions in their efforts to develop improved varieties. By studying the various landraces and their morphological characteristics, breeders can identify traits that are desirable for specific purposes, such as higher yield, better nutritional composition, or adaptability to different environmental conditions. This knowledge can then be used in breeding programs to develop new varieties that meet the needs of farmers, consumers, and the industry (Park & Chang, 2002; Chauhan et al., 2010; Zhang et al., 2017; Zhou et al., 2018).
There are lots of phenotypes to consider for buckwheat breeding (Alekseyeva, 2002; Chauhan et al., 2010; Zhang et al., 2017; Zhou et al., 2018; Sun et al., 2020). However, the current study used five of them. The flowering date is not responsible for the architectural traits; however, it is a crucial phenotype for determining early or late harvest (Luthar et al., 2021a). Those groups are admixture in the Korean peninsular. This means that morphological diversity did not come from geographical differences. Buckwheat cultivation in Korea is speculated to be started before BC 5 (Chen et al., 2018). More landraces could be introduced from abroad even after that. Thus, the current landrace could not be from one species. However, the current landraces are the results of the selection by natural environments and human beings to result in the maximum results yield, which can be affected by the morphological traits in the given environment. Numerous factors, such as light, temperature, soil shear resistance, wind, etc., affect the morphologies of plants (S. Lee & Ham, 1992; Clark & Bullock, 2007; Treadwell & Huang, 2008; Kalaitzoglou et al., 2019). Plant architecture is one of those various morphological traits. Many factors could also affect it (Luthar et al., 2021a). One of the most important factors could be sunlight (Gardiner et al., 2016; Kumar et al., 2020). If plants need a certain number of nodes that is directly related to the number of leaves and yield to have successful photosynthesis, they have to develop a strategy to place their nodes vertically or horizontally. The side node is a horizontal trait in the plant architecture. No matter how the nodes are developed, the number of total nodes is highly associated with the number of side nodes regardless of the number of main nodes and plant height. It might be because of the adaptation to receive the light in the given environments. The Korean peninsula is about 1,100 km in length and 300 km in width. This length is long enough to affect the day length of some crops, such as soybean (Ballaré et al., 1996; Patil et al., 2001). If the day length affects the flowering date, there should be a clear pattern on the map. However, the flowering date difference was random. The reason for this could be found in the buckwheat cultivation practice. Buckwheat is not cultivated on the fertile soil in the field. Rather, it is grown in the barren area on the slopes of the mountains or in the poor soil near the field. Even within the same area, the mountain's daylight length is much shorter than the plane field. This could create a random day long regardless of the latitude in the 1,100 km long area. Indeed, the Korean peninsular has lots of mountains and rivers that create various environments, although it is not large (Lee et al., 2019; Nawaz et al., 2020). These randomly created differences could affect the evolution/adaptation of the buckwheat landraces to form the current morphology in each location. The flowering date, one of the other morphological traits in the current study, could be grouped into three clusters. However, there was no pattern geologically. studying buckwheat diversity we can identify landraces or genetic traits that are more resilient and adaptable to changing conditions. This information can be used to develop climate-smart varieties that can thrive in different regions, have increased resistance to pests and diseases, and tolerate extreme weather events, ultimately ensuring food security in the face of environmental challenges. Thus studying buckwheat diversity, we can gain a deeper understanding of its cultural significance and contribute to its sustainable production and utilization, benefiting local communities and economies.
5 Conclusion
The results in the current study imply the following. First, the landrace or germplasm should be chosen based on the given crop's important morphological traits, not geographical information. Instead, environmental diversity should be considered since there could be diverse environments with no pattern in the given area, even though small, like the Korean peninsular. Second, the utilization of certain germplasm or landrace needs to examine the groups based on morphological or other physiological traits because there could be a required combination of traits within that group to accelerate breeding speed to stack those traits into the new breeding cultivar.
Consent to participate
All authors consent to participate in the manuscript publication.
Consent for publication
All authors approved the manuscript to be published.
Ethics approval
Not applicable.
Data availability statement
The raw data is available when requested from the author.
Declaration of funding
This research was supported by a grant from the Standardization and Integration of Resources information for seed-cluster in Hub-Spoke material bank program (Project No. PJ01587004), Rural Development Administration, Republic Korea. We also thank Jeju Buckwheat Farmers Association Corporation, Jeju, Republic of Korea.
CRediT authorship contribution statement
Gyung Deok Han: Writing – original draft, Software, Methodology, Investigation, Data curation. Sheikh Mansoor: Writing – review & editing, Writing – original draft, Validation, Methodology, Formal analysis, Data curation. Jaeyoung Kim: Visualization, Methodology, Data curation. Jieun Park: Writing – review & editing, Validation, Methodology, Data curation. Seong Heo: Visualization, Formal analysis, Data curation. Ju-Kyung Yu: Visualization, Validation, Investigation, Formal analysis, Data curation. Seong Hoon Kim: Visualization, Formal analysis, Data curation. Yong Suk Chung: Writing – review & editing, Visualization, Supervision, Resources, Project administration, Funding acquisition, Formal analysis, Conceptualization.
Acknowledgments
N/a.
Author Contribution
GDH and JK conducted experiments and preliminary data analyses; SM, JK, JP, SH, JY, SHK and YSC analyzed the data and wrote the draft of the manuscript. SHK and YSC. conceived and supervised the project. All authors were involved in editing the manuscript
Declaration of Competing Interest
The authors declare that they have no known competing financial interests or personal relationships that could have appeared to influence the work reported in this paper.
References
- Progress and prospects of buckwheat improvement in Ukraine-current status and future research. Fagopyrum.. 2002;19:111-113.
- [Google Scholar]
- Solar ultraviolet-B radiation affects seedling emergence, DNA integrity, plant morphology, growth rate, and attractiveness to herbivore insects in Datura ferox. Plant Physiol.. 1996;112(1):161-170.
- [Google Scholar]
- Genetic and genome resources in buckwheat–present status and future perspectives. Buckwheat.. 2010;2:33-44.
- [Google Scholar]
- Recent progress in perennial buckwheat development. Sustainability.. 2018;10(2):536.
- [Google Scholar]
- Shedding light on plant competition: modelling the influence of plant morphology on light capture (and vice versa) J. Theor. Biol.. 2007;244(2):208-217.
- [Google Scholar]
- The facilitating effect of tartary buckwheat flavonoids and Lactobacillus plantarum on the growth performance, nutrient digestibility, antioxidant capacity, and fecal microbiota of weaned piglets. Animals. 2019;9(11):986.
- [Google Scholar]
- Dar FA, Pirzadah TB, Malik B, Tahir I, Rehman RU. Molecular genetics of buckwheat and its role in crop improvement. InBuckwheat germplasm in the world 2018 (pp. 271-286). Academic Press.
- Engels JM, Arora RK, Guarino L. An introduction to plant germplasm exploration and collecting: planning, methods and procedures, follow-up. Collecting plant genetic diversity. Technical guidelines. CAB International, Wallingford, United Kingdom. 1995 31 63.
- Wind impacts on plant growth, mechanics and damage. Plant Sci.. 2016;1(245):94-118.
- [Google Scholar]
- Ikeda, K., 2002. Buckwheat composition, chemistry, and processing.
- Effects of continuous or end-of-day far-red light on tomato plant growth, morphology, light absorption, and fruit production. Front. Plant Sci.. 2019;28(10):322.
- [Google Scholar]
- The path to smart farming: innovations and opportunities in precision agriculture. Agriculture. 2023;13(8):1593.
- [Google Scholar]
- Journal of the American statistical analysis. Chemom. Intel. Lab. Syst.. 2014;47(1):259-272.
- [Google Scholar]
- Plant behaviour: an evolutionary response to the environment? Plant Biol.. 2020;22(6):961-970.
- [Google Scholar]
- A comparative study on dietary culture between Korean Mak-kuksoo and Japanese Soba-myon-Significance of dietary culture of buckwheat and buckwheat noodle. Journal of Agricultural Science-Kangweon National University (Korea Republic) 1992:4.
- [Google Scholar]
- Highly geographical specificity of metabolomic traits among Korean domestic soybeans (Glycine max) Food Res. Int.. 2019;1(120):12-18.
- [Google Scholar]
- Functional phenotyping: understanding the dynamic response of plants to drought stress. Curr. Plant Biol.. 2024;21:100331
- [Google Scholar]
- Genomics, phenomics, and machine learning in transforming plant research: advancements and challenges. Hortic. Plant J. 2024
- [Google Scholar]
- Korean wild soybeans (Glycine soja Sieb & Zucc.): geographic distribution and germplasm conservation. Agronomy. 2020;10(2):214.
- [Google Scholar]
- Park CH, Chang KJ. Cultivation and Breeding of Buckwheat as a New Kind of Functional Food in Korea. InProceedings of the Plant Resources Society of Korea Conference 2002 (pp. 10-10). The Plant Resources Society of Korea.
- Plant morphology is affected by light quality selective plastic films and alternating day and night temperature. Gartenbauwissenschaft. 2001;66(2):53-60.
- [Google Scholar]
- Tartary buckwheat: an under-utilized edible and medicinal herb for food and nutritional security. Food Rev. Intl.. 2022;38(4):440-454.
- [Google Scholar]
- An analysis of variance test for normality (complete samples) Biometrika. 1965;52(3–4):591-611.
- [Google Scholar]
- Integrating artificial intelligence and high-throughput phenotyping for crop improvement. J. Integr. Agric.. 2024;23(6):1787-1802.
- [Google Scholar]
- Breeding and biotechnological interventions for trait improvement: status and prospects. Planta. 2020;252:1-8.
- [Google Scholar]
- The proof and measurement of association between two things. Int. J. Epidemiol.. 2010;39(5):1137-1150.
- [Google Scholar]
- Spearman C. The proof and measurement of association between two things. International journal of epidemiology. 2010 Oct 1;39(5):1137-50.Suzuki T, Noda T, Morishita T, Ishiguro K, Otsuka S, Brunori A. Present status and future perspectives of breeding for buckwheat quality. Breeding Science. 2020;70(1):48-66.
- Buckwheat: a cool-season cover crop for florida vegetable systems: HS1135/HS386, 2/2008. EDIS.. 2008;2008(2)
- [Google Scholar]
- Novel genomic tools and modern genetic and breeding approaches for crop improvement. J. Plant Biochem. Biotechnol.. 2009;18:127-138.
- [Google Scholar]
- Genomics-assisted breeding in minor and pseudo-cereals. Breed. Sci.. 2020;70(1):19-31.
- [Google Scholar]
- History of the progressive development of genetic marker systems for common buckwheat. Breed. Sci.. 2020;70(1):13-18.
- [Google Scholar]
- The tartary buckwheat genome provides insights into rutin biosynthesis and abiotic stress tolerance. Mol. Plant. 2017;10(9):1224-1237.
- [Google Scholar]
- Zhou M., Kreft I., Suvorova G., Tang Y., Woo S.H., eds. Buckwheat Germplasm in the World. Academic Press; 2018.
Appendix A
Supplementary material
Supplementary data to this article can be found online at https://doi.org/10.1016/j.jksus.2024.103387.
Appendix A
Supplementary material
The following are the Supplementary data to this article:


