

Translate this page into:
Characterization and applicability of the natural Iraqi bentonite clay for toxic cationic dye removal: Adsorption kinetic and isotherm study
⁎Corresponding author. ahjm72@gmail.com (Ali H. Jawad)
-
Received: ,
Accepted: ,
This article was originally published by Elsevier and was migrated to Scientific Scholar after the change of Publisher.
Abstract
This research targets to adsorb the organic dye (methylene blue, MB) from aqueous media using natural Iraqi bentonite clay (NIBC). Several analytical methods (e.g., XRD, FTIR, SEM-EDX, XRF, pHpzc, and BET) analysis were conducted to inspect the physicochemical characteristics of the NIBC. Adsorption key variables, including dosage of adsorbent (0.02–0.1 g), pH (2–10), and initial concentrations (10–150 mg/L) were inspected for determining their impacts on MB dye removal. The Redlich-Peterson isotherm demonstrated the best account for the equilibrium adsorption of MB. The NIBC's highest adsorption capacity (qmax) for MB was 256 mg/g. The kinetics of the adsorption of MB by NIBC matched the pseudo-second-order model. This study demonstrates that the NIBC could be utilized to successfully remove MB from aqueous environments.
Keywords
Bentonite clay
Adsorption
Methylene blue dye
Isotherm
Kinetics

1 Introduction
The cationic dye methylene blue (MB) is one of several dyes that is frequently utilized as temporary hair colourant, dyeing agent for wools, cottons and colouring paper and coating for paper stock (Rangabhashiyam and Balasubramanian, 2018). However, it can cause severe adverse effects to human health despite its low toxicity (Rafaie et al., 2021). Direct exposure to MB causes an increase in heart rate, nausea, shock, the creation of Heinz bodies, hypoxemia, jaundice, quadriplegia, and tissue damage (Kulkarni et al., 2021).
There are various methods available for removing these hazardous pollutants like adsorption, chemical precipitation, solvent extraction, electrochemical treatment, ion exchange, and evaporation (Shah, 2019; Usman et al., 2021; Rafaie et al., 2021). Approximately 2% of dyes employed by the textile sector are released as effluent at varying concentrations between 10 and 220 mg/L (Raghunath et al., 2016), which poses a challenge for effective wastewater treatment. Adsorption is a viable strategy for reducing harmful water contaminants in industrial wastewater (Nuzul and Karim, 2019). Adsorption-based processes have many desirable properties such as convenience in operation, selectivity, less sludge production, facile handling when compared to other available methods, and negligible formation of toxic by-products (Habeeb et al., 2020). However, the performance of adsorption is substantially impacted by the adsorbent functionality, availability of active sites, surface properties, according to the materials chemistry of the adsorbent.
Recently, greater attention has been directed at finding renewable, readily available, cost-effective, and functional adsorbents that employ various types of natural clays (Subhan et al., 2021). Clay is a kind of mineral known as hydrous aluminosilicate; it is a colloidal mineral found in water, sediments, and soil that could also contain tiny clay particles as well as crystals of other minerals including quartz, clay carbonates, and metal oxides (Ngulube et al., 2017). The majority of clay minerals are negatively charged, and clay includes exchangeable cations and anions that are connected to its surface. These surface charges help attract ions that are positively charged (Abdulhameed et al., 2019). These characteristics make clay, especially bentonite, an ideal adsorbent material because it can bind positively and negatively charged ions to its surface sites. Clays are generally low cost materials that are abundant with high specific surface area and possess low toxicity (Şahin et al., 2015). The major component of bentonite is montmorillonite, which possesses interfacial cations to counterbalance the surface's negative net charge (Şahin et al., 2015). Mg2+ for Al3+ and Al3+ for Si4+ in clay layers were isomorphously substituted and this phenomenon is related to bentonite's permanent negative charge. The existence of exchangeable cations, such as Ca2+, Na+, and others, balances the negative charge. These cations may be exchanged with certain organic and/or inorganic polycations to generate pillared materials, thus, enhancing the adsorption of pollutants (Chinoune et al., 2016). Therefore, these interesting properties of clay inspired us to investigate the adsorption properties of the natural Iraqi bentonite clay (NIBC) for the decontamination of MB from water systems. Moreover, the impact of vital adsorption factors for MB removal (e.g., initial MB concentration, NIBC dosage, pH, and time) were investigated under kinetic and equilibrium conditions.
2 Materials and methods
2.1 Materials
NIBC was supplied from a mining and geological survey company in Iraq. NIBC was received in the form of rock-like solid, before being crushed and sieved to get a fine powder (≤500 μm). The sieved NIBC was extensively washed with boiled distilled water to dissolve unwanted minerals. The wet NIBC was dried for 24 h at 100 °C in an oven. The dried NIBC was to crushed and sieved to produce a fine powder (particle sizes ≤ 250 μm). The final adsorbent of NIBC was then stored in an air-tight bottle. Methylene blue (99%; MW = 319.86 g/mol) was procur from ACROS Organics. NaOH and HCl from R&M Chemicals were appointed for adjusting the solution pH.
2.2 Characterization of NIBC
The surface charge of the bentonite clay was estimated by point of zero charge (pHpzc) analysis (Kong et al., 2015). The INBC’s surface functional groups was characterized through Fourier Transform Infrared (FTIR) spectrophotometer using Perkin Elmer (Spectrum One). X-ray diffraction (XRD) pattern of INBC was recorded by a Panalytical X’Pert PRO. The X-ray fluorescence (XRF) was utilized to specify the elemental composition of NIBC using an Energy Dispersive X-ray Fluorescent (EDXRF) spectrophotometer, model Epsilon 3-XL Panalytical. The morphological properties of the NIBC were inspected using a scanning electron microscope (SEM, Hitachi TM3030Plus). This was applied in conjunction with Energy Dispersive X-Ray analysis to get data on the elemental composition.
2.3 Adsorption experiments
A batch adsorption process was employed for a study of the MB adsorption infestations. The 250 mL conical flasks were used for the adsorption isotherm studies, where each flask contains MB solution (100 mL). The flasks were sealed before being put into a thermostatic water bath to be stirred at a set agitating speed of 125 rpm at 303 K until equilibrium is attained. To determine the ideal operational conditions for the adsorption of MB dye, the batch adsorption experiments were performed by evaluating a number of factors, such as NIBC dose (0.02–0.10 g), pH (2–10), and initial MB dye concentration (10–150 mg/L). To adjust the pH of the MB dye solution, 0.1 M HCl or 0.1 M NaOH was presented. A 0.20 μm nylon syringe filter was used to phase separate the supernatant. The MB’s concentration in solution was monitored at the maximum absorbance wavelength of MB (661 nm) with a HACH DR 3900 Direct reading spectrophotometer. Eqs. (1) and (2) were used to compute the adsorbed quantity at equilibrium, qe (mg/g), and the MB dye removal (CR; %), respectively. Adsorption tests were performed in triplicate, and the findings are presented as an average.
3 Results and discussion
3.1 Characterization of NIBC
3.1.1 FTIR analysis
Identifying the functional groups present on both NIBC and NINC-MB is the objective of the FTIR analysis. Fig. 1a depicts the resultant FTIR spectrum of NIBC prior to MB adsorption, where a broad band (3600–3500 cm−1) is attributed to the hydroxyl (—OH) stretching vibrations of the Si-OH (silanol) group on the surface of NIBC (Ezzuldin et al., 2019; Anirudhan and Ramachandran, 2015). The observed bands at 1100–800 cm−1 can be assigned to the Si—O—Si stretching vibrations of the clay mineral or quartz, while the band at 600 cm−1 can be assigned to the —OH deformation linked to Al (Jawad and Abdulhameed, 2020). The vibrations of SiO42−'s tetrahedral stretching and bending are represented by the bands at 500 cm−1 and 450 cm−1 (Zaitan et al., 2008). On the other hand, the FTIR spectrum of NIBC after loading MB dye species onto the adsorbent surface (Fig. 1b) shows the appearance of new bands at 3500–3400 cm−1 which relate to the —OH and —Si-OH groups. The aromatic ring of MB is also assigned to the band at 1550 cm−1 (Jawad and Abdulhameed, 2020).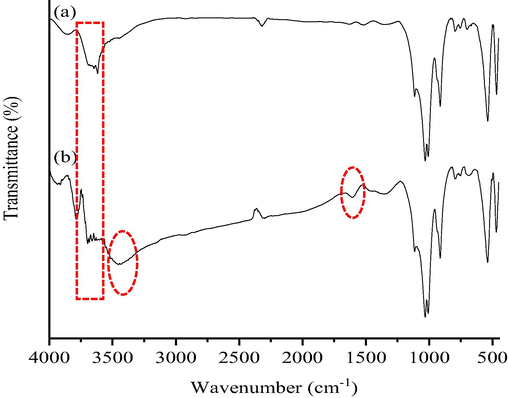
FTIR spectra of (a) NIBC, and (b) NIBC after MB adsorption.
3.1.2 SEM-EDX analysis
The differences in the topology and elemental composition of NIBC prior to and following MB adsorption are presented in Fig. 2a and b. It was important to point out that the surface appearance of the NIBC before adsorption is variable in size and shape. After the adsorption of MB, the surface of NIBC became denser in appearance due to the MB adsorption on to the surface of NIBC. The EDX examination of NIBC shows the existence of O (60.62%), C (15.18%), Si (14.17%), Al (8.50%), and Mg (1.53%). However, after MB adsorption, the composition changed to O (49.38%), C (29.08%), Si (13.69%), Al (4.95%), Fe (1.80%) and Mg (1.10%). The EDX spectra, which demonstrate a notable rise in carbon (%) and reduction in oxygen (%), provide support for the presence of MB dye. In addition, the NIBC used herein recorded a low Mg content, where clays with a high level of Mg exhibited low adsorption affinity towards MB dye, as reported by Ngulube et al. (2017).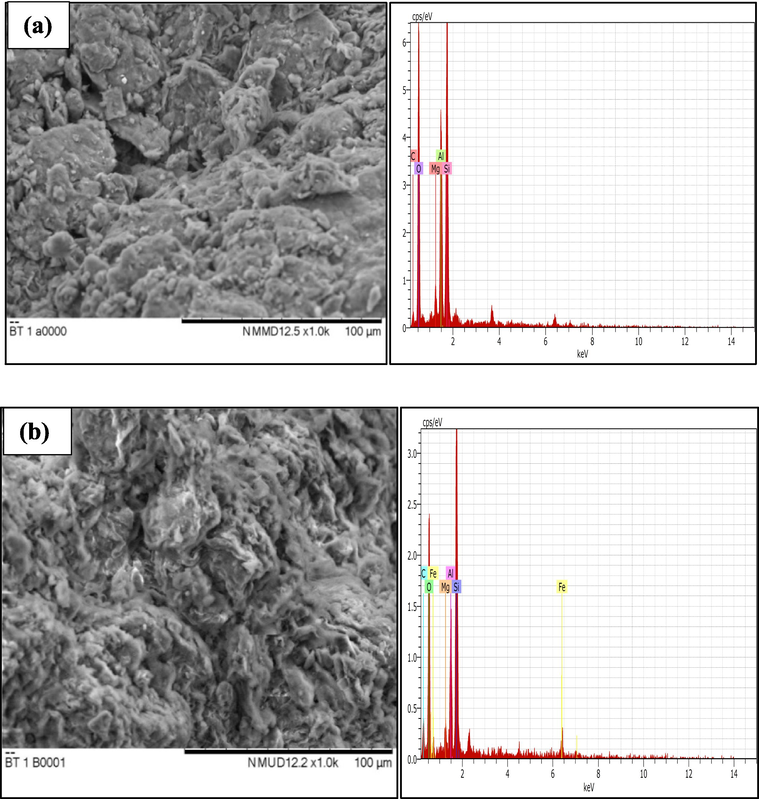
SEM-EDX images of (a) NIBC, and (b) NIBC after adsorption (SEM images were taken at 1000x magnification).
3.1.3 XRD-XRF analysis
Fig. 3a depicts the NIBC's XRD pattern, which was employed in a study to determine the NIBC's crystalline structure. Using the Scherrer formula, which is described in Eq. (3), the crystallite size (L) for intercalation was calculated.
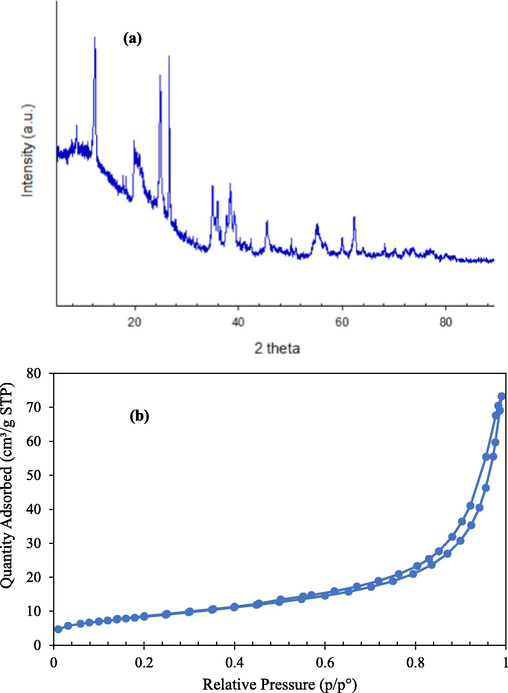
(a) XRD pattern of the NIBC adsorbent material and (b) N2 adsorption–desorption isotherm of NIBC.
Element
Concentration
Unit
Al
7.979
%
Si
12.57
%
P
0.125
%
K
1.967
%
Ca
0.248
%
Ti
0.821
%
V
185.8
ppm
Cr
73.5
ppm
Mn
159.4
ppm
Fe
1.57
%
Ni
48.5
ppm
Cu
35.1
ppm
Zn
114.6
ppm
Ga
86.7
ppm
Ge
5.2
ppm
As
17.2
ppm
Rb
349.1
ppm
Sr
114.1
ppm
Y
107.9
ppm
Zr
226.6
ppm
Nb
46.2
ppm
Mo
1.3
ppm
Ag
559.1
ppm
Sn
54.5
ppm
Nd
226.9
ppm
W
38.3
ppm
Ir
0.4
ppm
Pb
239.3
ppm
Th
140.3
ppm
3.1.4 BET and surface area analysis
Gas sorption measurements were used to analyze the NIBC's pore parameters. More specifically, nitrogen sorption adsorption at the surface of solid powders' is the most widespread method for determining the surface area of NIBC. Fig. 3b illustrates the corresponding isotherm and the BET surface area (SA) results reveal the structure of the mean pore diameter (14.2 nm) and the mean SA (30.6 m2/g) of NIBC. Based on the IUPAC classification system, the typical type IV isotherm provided evidence of mesopores of (2–50) nm in NIBC (Inglezakis et al., 2018).
3.1.5 pHpzc analysis
The pHpzc of the NIBC determines the pH point at which the surface of the NIBC is neutral with respect to electrostatic charges (Rehman et al., 2019b). NIBC's pHpzc was 7.0, as can be seen in Fig. 4a. The NIBC’s surface is negatively charged below the pHpzc value, which favors the adsorption of cationic species. The surface of NIBC exhibits a positive surface charge at pH levels above pHpzc, which facilitates the adsorption of anions.![(a) Point of zero charge (pHpzc) of NIBC; (b) Effect of NIBC dosage on the removal of MB ([MB]o = 100 mg/L, V = 100 mL, solution pH = 5.60, shaking speed = 125 rpm, T = 303 K, and contact time = 60 min); (c) Effect of solution pH on the removal of MB by NIBC (NIBC dose = 0.06 g, [MB]o = 100 mg/L, V = 100 mL, pH = 5.60, shaking speed = 125 rpm, T = 303 K and contact time = 60 min).](/content/185/2023/35/4/img/10.1016_j.jksus.2023.102630-fig4.png)
(a) Point of zero charge (pHpzc) of NIBC; (b) Effect of NIBC dosage on the removal of MB ([MB]o = 100 mg/L, V = 100 mL, solution pH = 5.60, shaking speed = 125 rpm, T = 303 K, and contact time = 60 min); (c) Effect of solution pH on the removal of MB by NIBC (NIBC dose = 0.06 g, [MB]o = 100 mg/L, V = 100 mL, pH = 5.60, shaking speed = 125 rpm, T = 303 K and contact time = 60 min).
3.2 MB dye adsorption
3.2.1 Impact of NIBC dose
The impact of the NIBC dose on the MB decolourization is presented in Fig. 4b, where the MB decolourization increased from 5.6% to 99.5% as the NIBC dose raised from 0.02 to 0.06 g. This trend relates to the increase of NIBC’s active sites as the dosage increases, which results in greater adsorption (Saber et al., 2021b; Hayati and Mahmoodi, 2012). As observed, as the NIBC dosage increases, the MB removal increases correspondingly. Above a dose of 0.06 g, there is no remarkable change in MB removal even when there are additional active sites available. Thus, the NIBC dose of 0.06 g/100 mL solution was appointed as the ideal NIBC dose in this study.
3.2.2 Impact of solution pH
The adsorption ability of dyes is typically influenced by the pH, owing to its impact on both the ionization of the adsorbate species and the adsorbent’s binding sites. As illustrated in Fig. 4c, the quantity of MB adsorbed onto NIBC was not influenced by pH within the range from pH 2–10. NIBC has a multilayer structure, which allows it to absorb both cations and anions despite clay's typically negatively charged surface (Ngulube et al., 2017). Due to the buffering action of the NIBC, these exchangeable surface sites indicate that NIBC's adsorption capacity is not substantially affected by the pH of the solution. Moreover, it can be concluded that the NIBC can be used over a wider pH range in solution. A similar phenomenon was observed with the removal of MB using attapulgite/bentonite (Liu et al., 2014). Therefore, to save the consumption of chemicals, time, and labour, the unadjusted solution pH (5.6) was applied for further investigations.
3.2.3 Impact of initial MB concentration vs contact time
The adsorption capability of NIBC was assessed in relation to the initial MB concentration (10–150 mg/L) at various contact times, as shown in Fig. 5a. With an elevation in initial MB dye concentration from 10 to 150 mg/L, the adsorbed quantity of MB dye onto NIBC rose from 18.19 to 253.2 mg/g (see Fig. 5a). The level of adsorption rose along with the initial MB dye concentration, which may be related to the greater concentration gradient as it acts as the driving force for MB dye species to adsorb onto the active NIBC surface sites (Rehman et al., 2019a; Jawad et al., 2020).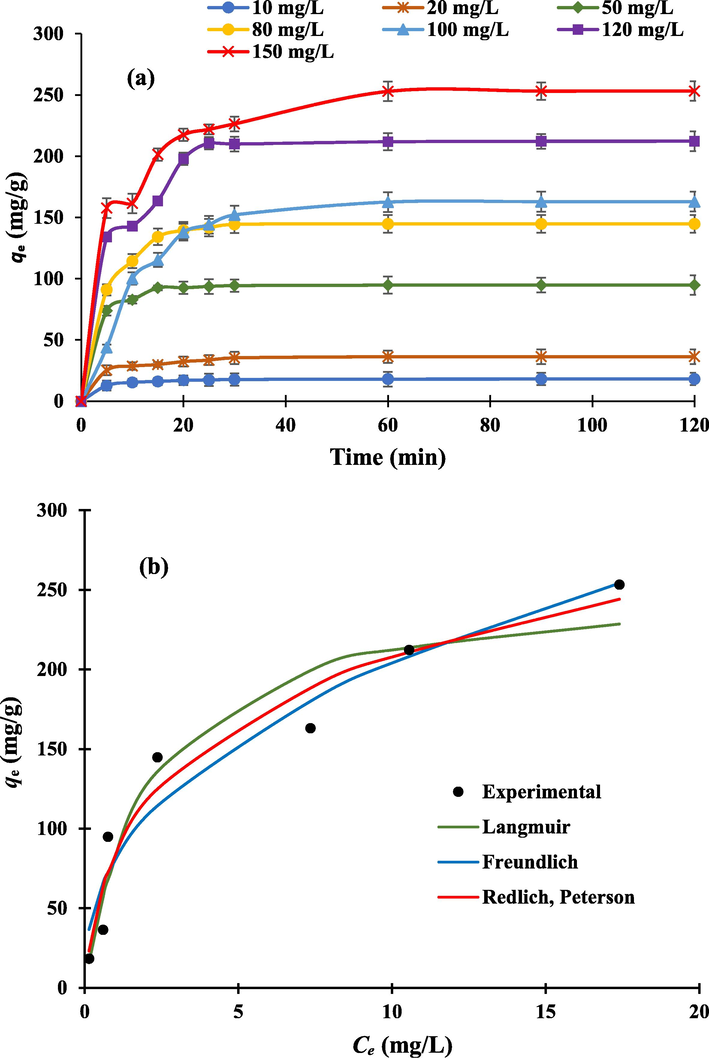
(a) Effect of initial MB concentration vs contact time on the adsorption capacity (qt) of the NIBC. (NIBC dose = 0.06 g, pH = 5.60, V = 100 mL, shaking speed = 125 rpm, T = 303 K); (b) nonlinear isotherm models for the MB dye adsorption by NIBC.
3.3 Isotherm study
Analysis of the adsorption isotherms is important to describe how the adsorbate species bind with the NIBC adsorbent surface. Three types of isotherms: Redlich-Peterson (Redlich and Peterson, 1959), Freundlich (Freundlich, 1906), and Langmuir (Langmuir, 1918) models were considered for the isotherm investigations. The nonlinear equation of the Langmuir is presented in Eq. (4).
To accurately model the experimental isotherm results when the Freundlich and Langmuir models demonstrated favourable goodness-of-fit for the adsorption of MB dye onto NIBC, a more appropriate isotherm model was considered. The R-P isotherm model is a hybrid model that combines the features of the Freundlich and Langmuir isotherms (Eq. (6) that serve to address the limitations of the two models (Kumara et al., 2014). Table 2 summarizes the adsorption isotherm models' best-fitting parameters. The R-P isotherm model was shown to have the greatest match, demonstrating that the adsorption mode incorporates characteristics of the Freundlich and Langmuir isotherms (Saber et al., 2021a). The exponent value of R-P isotherm model (β) is associated to Langmuir isotherm model which was estimated to be β ≈ 1. Furthermore, it was calculated that the
value was 256 mg/g, where the correlation coefficient was favourable (R2 = 0.93). In contrast, Freundlich isotherm accounts for multilayer surface coverage of the dye species (Jawad and Abdulhameed, 2020). Additionally, the value of 1/n was estimated to be 0.40, which is favorable because it is less than 1 and has a correlation coefficient of R2 of 0.93.
Isotherm
Parameter
Value
Langmuir
qmax (mg/g)
256
b (L/mg)
0.48
R2
0.93
Freundlich
KF (mg/g(L/mg)1/n)
81.0
n
2.49
R2
0.93
Redlich Peterson
KP (L/g)
235.0
α (1/mg)
1.79
β
0.76
R2
0.95
In Table 3, the qmax of MB is compared among several materials mentioned in the literature. The qmax of NIBC (256 mg/g) was significantly higher than other materials. Furthermore, when compared to other materials nature, NIBC utilized herein is a natural material that is considered an environmentally friendly adsorbent material.
Adsorbent(s)
Adsorption capacity (mg/g)
References
Natural Iraqi Bentonite clay (NIBC)
256
This study
Organo-bentonite
321
(Bergaoui et al., 2018)
Modified bentonite
303
(Şahin et al., 2015)
Iraqi red kaolin clay
240.4
(Jawad and Abdulhameed, 2020)
EDTA-modified bentonite
160
(De Castro et al., 2018)
APTES-Fe3O4/bentonite
91.83
(Lou et al., 2017)
3.4 Adsorption kinetics
For the purpose of analyzing the MB adsorption behavior using NIBC, three kinetic models were adopted. These models include the the intraparticle diffusion (IPD) (Weber and Morris, 1963), pseudo-first order (PFO) (Langergren, 1898), and pseudo second order (PSO) (Ho and McKay, 1999) models. These models were employed to estimate the rate of MB adsorption at the adsorbent surface of NIBC (Pitchay et al., 2022). The nonlinear kinetics expressions of the PFO, PSO, and IPD are presented in Eqs. (7)–(9) respectively.
Fig. 6a-c show the PFO, PSO and IPD plots at various initial concentrations of MB dye that range from 10 to 150 mg/L. Table 4 lists the parameters for the three kinetic models, as well as the R2 values, since favourable R2 values (R2 ≥ 0.99) are noted for the PSO (Auta & Hameed, 2012; Tran et al., 2017). Furthermore, the values of
of PSO agree well with
. Thus, the kinetic adsorption characteristics of MB onto the NIBC adsorbent can be described using the PSO model.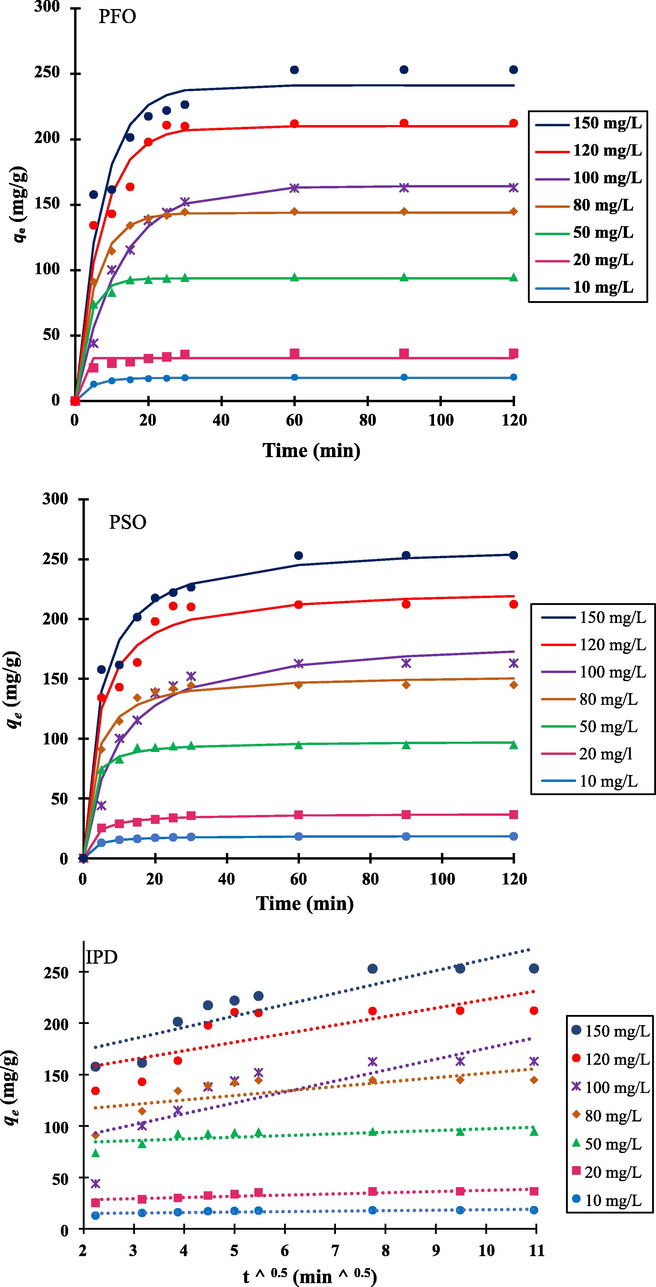
Pseudo-first order (PFO), Pseudo-second order (PSO), and intraparticle diffusion (IPD) kinetics for adsorption of MB dye by NIBC at 303 K.
(mg/L)
(mg/g)
PFO
PSO
IPD
(mg/g)
R2
SSE
(mg/g)
R2
SSE
(mg/g)
(mg/g.min0.5)
R2
10
18.2
17.6
0.23
0.99
2.61
18.7
0.0237
0.99
0.274
14.0
0.46
0.61
20
36.4
32.7
3.11
0.88
127.9
37.4
0.0097
0.99
6.372
25.9
1.16
0.73
50
94.7
93.7
0.28
0.99
42.2
97.9
0.0067
0.99
32.27
80.8
1.64
0.44
80
144.7
143.9
0.18
0.99
66.6
144.1
0.0021
0.99
198.1
107.9
4.35
0.48
100
162.9
164.1
0.08
0.99
227.7
165.8
0.0006
0.98
875.9
69.6
10.5
0.63
120
212.2
210.0
0.14
0.96
1543.6
216.5
0.0011
0.98
1148.1
140.0
8.30
0.58
150
253.1
241.2
0.13
0.95
2603.2
256.1
0.0009
0.98
852.1
151.9
11.1
0.78
According to data from Table 4 of the PFO model, the experimental qe value did not correlate well with the estimated qe values of PFO, whereas the R2 showed a significant correlation coefficient. This demonstrates that the MB adsorption kinetics onto NIBC is not a first-order process. Meanwhile, the IPD model has a lower correlation (smaller R2 value). As a result, it was straightforward to apply the PSO model to the MB adsorption on to NIBC. According to this model, chemisorption is attributed to MB adsorption on NIBC (Saber et al., 2021a).
4 Conclusion
The feasibility of the natural Iraqi bentonite clay (NIBC) for the decontamination of MB from aquatic media was investigated in this current work. The characterization tools indicated that NIBC has adequate properties for MB adsorption and favouring the adsorption of cations. FTIR analysis was confirmed by the appearance of a broad-band at 3600–3500 cm−1 to the hydroxyl (—OH) stretching vibrations of the Si-OH (silanol) group on the surface of NIBC. The optimum key uptake factors for MB adsorption by NIBC were identified to be the optimal NIBC dosage (0.06 g/100 mL) and pH 5.6. The kinetics data indicated the PSO kinetic model is favourable to account for the MB adsorption by NIBC. The qmax of NIBC was estimated to be 256 mg/g at 303 K. The adsorption findings demonstrated that NIBC is an inexpensive and effective adsorbent for the decontamination of MB from aquatic media.
Acknowledgments
The author (Zeid A. ALOthman) is thankful to the Researchers Supporting Project No. (RSP2023R1), King Saud University, Riyadh, Saudi Arabia.
Declaration of Competing Interest
The authors declare that they have no known competing financial interests or personal relationships that could have appeared to influence the work reported in this paper.
References
- Modeling and mechanism of reactive orange 16 dye adsorption by chitosan-glyoxal/TiO2 nanocomposite: Application of response surface methodology. Desalin. Water Treat.. 2019;164:346-360.
- [CrossRef] [Google Scholar]
- Adsorptive removal of basic dyes from aqueous solutions by surfactant modified bentonite clay (organoclay): Kinetic and competitive adsorption isotherm. Process Saf. Environ. Prot.. 2015;95:215-225.
- [CrossRef] [Google Scholar]
- Modified mesoporous clay adsorbent for adsorption isotherm and kinetics of methylene blue. Chem. Eng. J.. 2012;198:219-227.
- [CrossRef] [Google Scholar]
- Novel insights into the adsorption mechanism of methylene blue onto organo-bentonite: Adsorption isotherms modeling and molecular simulation. J. Mol. Liq.. 2018;272:697-707.
- [Google Scholar]
- Adsorption of reactive dyes from aqueous solution by dirty bentonite. Appl. Clay Sci.. 2016;123:64-75.
- [CrossRef] [Google Scholar]
- Adsorption of methylene blue dye and Cu (II) ions on EDTA-modified bentonite: isotherm, kinetic and thermodynamic studies. Sustain. Environ. Res.. 2018;28(5):197-205.
- [Google Scholar]
- Morphological, thermal stability and textural elucidation of raw and activated palm kernel shell and their potential use as environmental-friendly adsorbent. Chem. Data Collect.. 2019;21:100235
- [CrossRef] [Google Scholar]
- Characterization of agriculture wastes based activated carbon for removal of hydrogen sulfide from petroleum refinery waste water. Mater. Today Proc.. 2020;20:588-594.
- [CrossRef] [Google Scholar]
- Modification of activated carbon by the alkaline treatment to remove the dyes from wastewater: Mechanism, isotherm and kinetic. Desalin. Water Treat.. 2012;47:322-333.
- [CrossRef] [Google Scholar]
- Pseudo-second order model for sorption processes. Process Biochem.. 1999;34:451-465.
- [CrossRef] [Google Scholar]
- Insights into the S-shaped sorption isotherms and their dimensionless forms. Microporous Mesoporous Mater.. 2018;272:166-176.
- [CrossRef] [Google Scholar]
- Mesoporous Iraqi red kaolin clay as an efficient adsorbent for methylene blue dye: Adsorption kinetic, isotherm and mechanism study. Surf. Interfaces. 2020;18:100422
- [CrossRef] [Google Scholar]
- Hybrid Crosslinked Chitosan-Epichlorohydrin/TiO2 Nanocomposite for Reactive Red 120 Dye Adsorption: Kinetic, Isotherm, Thermodynamic, and Mechanism Study. J. Polym. Environ.. 2020;28:624-637.
- [CrossRef] [Google Scholar]
- Removal of methylene blue from wastewater using fallen leaves as an adsorbent. Desalin. Water Treat.. 2015;53:2489-2500.
- [CrossRef] [Google Scholar]
- Fractal kinetics for sorption of Methylene blue dye at the interface of Alginate Fullers earth composite beads. J. Mol. Liq.. 2021;336:116225
- [CrossRef] [Google Scholar]
- Equilibrium isotherm studies of adsorption of pigments extracted from Kuduk-kuduk (Melastoma malabathricum L.) pulp onto TiO2 nanoparticles. J. Chem.. 2014;2014
- [CrossRef] [Google Scholar]
- Zurtheorie der sogenannten adsorption geloesterstoffe. Veternskapsakad Handl.. 1898;24:1-39.
- [Google Scholar]
- The adsorption of gases on plane surfaces of glass, mica and platinum. J. Am. Chem. Soc.. 1918;40:1361-1403.
- [Google Scholar]
- Attapulgite/bentonite interactions for methylene blue adsorption characteristics from aqueous solution. Chem. Eng. J.. 2014;237:403-410.
- [CrossRef] [Google Scholar]
- Synthesis of a novel functional group-bridged magnetized bentonite adsorbent: Characterization, kinetics, isotherm, thermodynamics and regeneration. Chinese J. Chem. Eng.. 2017;25(5):587-594.
- [Google Scholar]
- An update on synthetic dyes adsorption onto clay based minerals: A state-of-art review. J. Environ. Manage.. 2017;191:35-57.
- [CrossRef] [Google Scholar]
- Kinetics Studies of Metallic Ions Adsorption by Immobilised Chitosan. Sci. Lett.. 2022;16:137-148.
- [Google Scholar]
- Photocatalytic degradation of methylene blue dye solution using different amount of ZnO as a photocatalyst. Sci. Lett.. 2021;15:1-12.
- [Google Scholar]
- Sorption isotherms, kinetic and optimization process of amino acid proline based polymer nanocomposite for the removal of selected textile dyes from industrial wastewater. J. Photochem. Photobiol. B Biol.. 2016;165:189-201.
- [CrossRef] [Google Scholar]
- Adsorption behaviors of hazardous methylene blue and hexavalent chromium on novel materials derived from Pterospermum acerifolium shells. J. Mol. Liq.. 2018;254:433-445.
- [CrossRef] [Google Scholar]
- Zwitterionic superabsorbent polymer hydrogels for efficient and selective removal of organic dyes. RSC Adv.. 2019;9:18565-18577.
- [Google Scholar]
- Fabrication of stable superabsorbent hydrogels for successful removal of crystal violet from waste water. RSC Adv.. 2019;9:40051-40061.
- [Google Scholar]
- Insights into thep-nitrophenol adsorption by amidoxime-modified poly(acrylonitrile-co-acrylic acid): characterization, kinetics, isotherm, thermodynamic, regeneration and mechanism study. RSC Adv.. 2021;11:8150-8162.
- [CrossRef] [Google Scholar]
- Trimethylamine functionalized radiation-induced grafted polyamide 6 fibers for p-nitrophenol adsorption. Sci. Rep.. 2021;11:1-17.
- [Google Scholar]
- Plasma-surface modification on bentonite clay to improve the performance of adsorption of methylene blue. Appl. Clay Sci.. 2015;116–117:46-53.
- [CrossRef] [Google Scholar]
- Developing Ag-tercopolymer microgels for the catalytic reduction of p-nitrophenol and EosinY throughout the entire pH range. J. Mol. Liq.. 2019;288:111045
- [Google Scholar]
- Sodium alginate grafted poly (N-vinyl formamide-co-acrylic acid)-bentonite clay hybrid hydrogel for sorptive removal of methylene green from wastewater. Colloids Surf. A Physicochem. Eng. Asp.. 2021;611:125853
- [Google Scholar]
- Mistakes and inconsistencies regarding adsorption of contaminants from aqueous solutions: a critical review. Water Res.. 2017;120:88-116.
- [CrossRef] [Google Scholar]
- Simultaneous adsorption of heavy metals and organic dyes by β-Cyclodextrin-Chitosan based cross-linked adsorbent. Carbohydr. Polym.. 2021;255:117486
- [CrossRef] [Google Scholar]
- Closure to “Kinetics of Adsorption on Carbon from Solution”. J. Sanit. Eng. Div.. 1963;89:53-55.
- [CrossRef] [Google Scholar]


