

Translate this page into:
Biological reaction mediated engineered AuNPs facilitated delivery encore the anticancer, antiglycation, and antidiabetic potential of garcinol
⁎Corresponding authors at: Nanomedicine & Nanobiotechnology Lab, Department of Biosciences, Integral University, Lucknow, 226026 India (Mohd Sajid Khan) and Department of Family Medicine, Yonsei University College of Medicine, Gangnam Severance Hospital, 211 Eonju-Ro, Gangnam-Gu, Seoul 06273, Korea. (Jae-June Dong). s82tonight@yuhs.ac (Jae-June Dong), research.sajid@gmail.com (Mohd Sajid Khan)
-
Received: ,
Accepted: ,
This article was originally published by Elsevier and was migrated to Scientific Scholar after the change of Publisher.
Peer review under responsibility of King Saud University.
Abstract
Objectives
Diabetes mellitus (DM), cancer and cardiovascular diseases (CVD) are major contributors to human miseries and death. Additionally, previous findings stated that cancer is also known to be associated with diabetes. Therefore, in the given study, facile synthesis of gold nanoparticles (AuNPs) using glycation reaction was achieved and further, their bioconjugation with herbal drug garcinol (G) was performed (G-AuNPs) in order to enhance the antiglycative, antidiabetic and anticancer efficacy of the garcinol.
Methods
The antiglycation and antidiabetic potential of garcinol bioconjugated AuNPs (G-AuNPs) were assessed through different experiments. Further, anticancer potential against adenocarcinoma cells were also assessed.
Results
The study confirmed 78.6 % bioconjugation of G over the surface of AuNPs. Furthermore, the antiglycation study depicted that G-AuNPs are found to be more effective inhibitor of the glycation reaction in contrast to pure G. The findings represented that G-AuNPs significantly blocks the formation of early glycation adducts and AGEs, also they mask the glycation prone free arginine and lysine residues from participating in the glycation process. Additionally, our α-amylase inhibition assay results demonstrated that pure G (IC50 − 8.9 µM) has significantly higher α-amylase inhibition activity compared to standard inhibitor, acarbose (IC50 − 0.118 mM). Also, the anticancer study described that G and G-AuNPs treatment resulted in death of the cells via apoptosis, which resulted in elevated permeability, condensed chromatin, deep blue fluorescent, and condensed nucleus of A549 cells. Our findings also revealed that the potential of mitochondrial membrane (ΔΨm) of A549 cells were also disrupted at much lower concentration of G-AuNPs (13.3 µM) as compared to pure G (28.7 µM).
Conclusion
The key findings of the investigation suggested that G-AuNPs acted as a potent antiglycation, antidiabetic, and anticancer agent.
Keywords
Gold nanoparticles
Lung cancer
Glycation
Garcinol
α-amylase

1 Introduction
When it comes to human suffering, diabetes mellitus (DM) is a major contributor due to the fact that people who suffer from this disorder are more likely to have vision issues (retinopathy), kidney problems (nephropathy), and nerve problems (neuropathy). In addition, cardiovascular disease is also known to be linked to DM (Rafi et al., 2020). Diabetes symptoms and treatment are unique to each individual and cannot be addressed in a generic manner. Type II diabetes mellitus (T2DM) is known to be linked to the development of advanced glycation end products (AGEs), a product of non-enzymatic glycation reaction. Non-enzymatic glycation occurs when amino groups of proteins combine with free carboxyl groups of sugars leading to the formation of AGEs. An intermediate step of glycation, Schiff's base formation leads in the generation of free radicals, which in turn generate AGEs, that plays a vital role in the development of Age-related diseases (Rehman et al., 2020).
In addition, oxidative, carbonyl, and glycative stress have recently received considerable attention for their purported influence on the advancement of cancer. Variable transcription factors can be triggered by oxidative stress such as nuclear factor erythroid-2-related factor (Nrf2), nuclear factor kappa B (NF-κB), protein-53 (p-53), activating protein-1 (AP-1), β- catenin/Wnt, hypoxia-inducible factor-1α (HIF-1α), and peroxisome proliferator-activated receptor-γ (PPAR-γ)(Ahmad et al., 2018)(Ahmad, Yasir, et al., 2017). Activated transcription factors can result in roughly 500 distinct changes in gene expression, altering expression patterns of growth factors, inflammatory cytokines, anti-inflammatory, and regulatory cell cycle molecules, and anti-inflammatory molecules. These gene expression variations can transform a normal cell into a cancer cell. AGEs bind to and activate the receptor for AGEs (RAGE) via AGE-RAGE interaction, which is a significant modulator of inflammation-associated tumours. Dicarbonyls like, glyoxal (GO), methylglyoxal (MG) and 3-deoxyglucosone (3-DG) fashioned throughout lipid peroxidation, glycolysis, and protein degradation are viewed as key precursors of AGEs (Ahmad, Khan, et al., 2017). In living organisms, these dicarbonyls lead to carbonyl stress, possibly resulting in carbonyl impairment of proteins, DNA, carbohydrates, and lipoproteins. The damage caused by carbonyls results in numerous lesions, some of which are involved in cancer pathogenesis. In normal physiological conditions, AGE formations occurs at a low pace, but in hyperglycaemic situations, it is accelerated 5–6 times(Akhter et al., 2013)(Rafi et al., 2020)(Ahmad et al., 2013). The development of AGEs during the normal ageing process in animals and human tissues has been strongly advocated by previous studies (Alenazi et al., n.d.)(Wani et al., 2013).
In recent years, researchers have been focusing on the potential use of medicinal plant extracts in cancer treatment. In preclinical studies, a few medicines that suppress components of the accelerated glycation process have shown promising results. Numerous antidiabetic and anticancer drugs have been acquiring a lot of attention in recent years based on their viability, functionality and safety. Since phytochemicals from dietary plants possess antidiabetic, antiglycation as well as anticarcinogenic potentials, focusing on these compounds would be far more feasible and safer than other pharmaceutical agents.
Furthermore, researchers have increasingly turned to inorganic nanoparticles in recent years because of their superior optical, chemical, photochemical, and electrical capabilities as compared to their bulk material (Azmi et al., 2021)(Dawadi et al., 2021) (Królikowska et al., 2003)(Al Hagbani et al., 2022). Based on miscellaneous applications of metallic nanoparticles in emerging medical fields, the biosynthetic approach of nanoparticle synthesis has been well-thought-out as an alternative of conventional procedures, including physical and chemical synthesis methods (Alshahrani et al., 2021) (Shankar et al., 2003)(Mukherjee et al., 2001)(Armendariz et al., 2004)(Shankar et al., 2004)(Durán et al., 2005)(Khan et al., 2021). Among the inorganic nanomaterials, gold nanoparticles have considerable importance due to their unusual chemical and physical properties. A range of applications is raised by surface conjugation, which deliberates specific functions to nanoparticles, including targeted drug delivery via bio vectors, and high solubility in desired solvents. Therefore, a high loading efficiency nanocarrier would be of great importance in delivering the anticancer and antiglycation drug for a longer time, and it remains stable in the bloodstream resulting in improved permeability and retention effect.
Previous studies have demonstrated a high demand for green synthesis of inorganic nanoparticles as a clean, environment friendly, and non-toxic approach by utilizing antitumor, antioxidant and antibacterial natural products (Rahim et al., 2013). The use of antiglycation and anticancer herbal drugs bioconjugated with nanoparticles is an exciting possibility that is a largely unfamiliar field (Kolishetti et al., 2010). Various nanoparticle-based drug delivery strategies including anionic gold nanoparticles mediated delivery of cisplatin (Iram et al., 2019), enzalutamide (Baker et al., 2020), and cisplatin/doxorubicin (Iram, Zahera, Khan, Khan, Syed, et al., 2017) against cancer and delivery of secnidazole against bacteria (Khan et al., 2015); PEGylated PLGA NP-encapsulated paclitaxel and etoposide against osteosarcoma cells (B. Wang et al., 2015), bisphosphonate nanoparticles carrying doxorubicin against osteosarcoma cells (Rudnick-Glick et al., 2014), methoxy-poly aldehyde taking curcumin and doxorubicin against Hep G-2 cancer cells (Zhang et al., 2016) and polymeric nanoparticles carrying doxorubicin-carbonate (Xiong et al., 2015). Comparatively, with the conventional drugs, the nanoparticles of size<200 nm have the potential of escaping the reticuloendothelial system (RES) and have prolonged circulation in the blood, including increased retention effect and permeation followed by accumulation to the tumour site (Al Hagbani et al., 2022)(Green et al., 1995). Apart from the numerous varieties of nanoparticles, gold nanoparticles have been designated because of their harmless nature, bio - compatibility, and the ability to easily conjugate diverse functional groups on their surface (Nicol et al., 2015) (Al Hagbani et al., 2022). Gold nanoparticles exhibit a large surface to volume ratio that provides a plentiful drug molecule loading that can be delivered to the target sites.
Access of nanoparticles carrying drugs to the target cells is an active process, and nearly all the endocytic pathways are energy-dependent (Khan et al., 2021)(Hong et al., 2009). The nanoparticle access to the cells depends on various interfacial and physical characteristics of nanoparticles, such as hydrophobicity, shape, size, and surface charge. The access is also dependent on the nature of the target cells and their plasma membrane properties (Verma & Stellacci, 2010) including the density, type, and recycling rate of receptors, as well as the fluidity of the membrane, and receptors (Mailander & Landfester, 2009). Various pathways may be used by the nanoparticles concurrently with varying efficiencies. In due course, the cargo gets fused with the lysosome and gets demolished by enzymolysis and acidification in lysosomes. (Xiang et al., 2012), therefore for a remarkable effect, nanomedicine must have to bypass this route, avoiding degradation. The studies also exposed that surface charge has a significant role in the uptake of nanoparticles.
However targeted drug-delivery based on nanoparticles is a highly proper and significant application of nanotechnology due to their variety of advantages compared with conventional drugs, such as improved cancer-bearing survival rate, enhanced tumour targeting, enhanced drug uptake, and reduced side effects (Khan et al., 2021)(Tomuleasa et al., 2012). A noteworthy clinical performance in comparison to traditional drugs is observed in several FDA-approved nanomedicines (Iram et al., 2016), however, it has also been observed that stable gold nanoparticles work more efficiently exerting fewer side effects than the pure drugs at a much lower concentration compared to that of the pure drug (Tsang et al., 2009)(Khan et al., 2021)(Fratoddi et al., 2015)(Verissimo et al., 2016).
Being non-toxic, the plant kingdoms are known to maintain the liveliness of human beings, and due to this, the ayurvedic and Unani medicines are recognized to have great potential; these systems depend on a variety of medicinal plants and are used for dealing with various diseases including cancer (M. Sharma & Govind, 2009). Currently, many anticancer modern drugs are resulting from natural products (Rosangkima & Prasad, 2004). Plants possessing medicinal properties contain phytochemicals that exhibit immune-modulatory antioxidant potential leading to a significant anti-cancer potential. Garcinol (G), a benzophenone isolated from Garcinia Indica, has been tremendously used as a traditional medicine with an extremely noteworthy antioxidant and anticancer potential due to the existence of phenolic hydroxyl groups and β-diketone moiety (Liu et al., 2015)(Saadat & Gupta, 2012)(Sang et al., 2002), Since G is a highly potent drug against glycation and cancer, a noble delivery system might be developed using G bioconjugated gold nanoparticles with enhanced antiglycation and anticancer potential along with patient compliance and diminished side effects.
The present study focuses on the assessment of antiglycation and anticancer potential of G-AuNPs comparatively with its pure form. In this regard, we hypothesize that G-AuNPs would significantly increase the therapeutic effectiveness of the drug against glycation by interfering with early glycation end products and might also act as a potent anticancer effect. We also characterized G-AuNPs using UV–vis spectroscopy, zeta potential, inductively coupled plasma mass spectroscopy, transmission electron microscopy, fourier transform infrared spectroscopy, and circular dichroism analysis. The drug loading efficiency was also calculated by UV–Visible spectroscopy. The antiglycation potential of pure G and G-AuNPs were examined by UV–vis spectroscopy, nitroblue tetrazolium reduction assay, hydroxymethyl furfural tests, carbonyl content analysis, free arginine and lysine analysis method and fluorescence spectroscopy. Additionally, the antidiabetic potential was tested by α-amylase inhibition assay. Furthermore, the cytotoxic effect of G and G-AuNPs were examined on human normal keratinocyte HaCat cells, followed by the examination of the anticancer properties tested on human lung adenocarcinoma A549 cells (Fig. 1).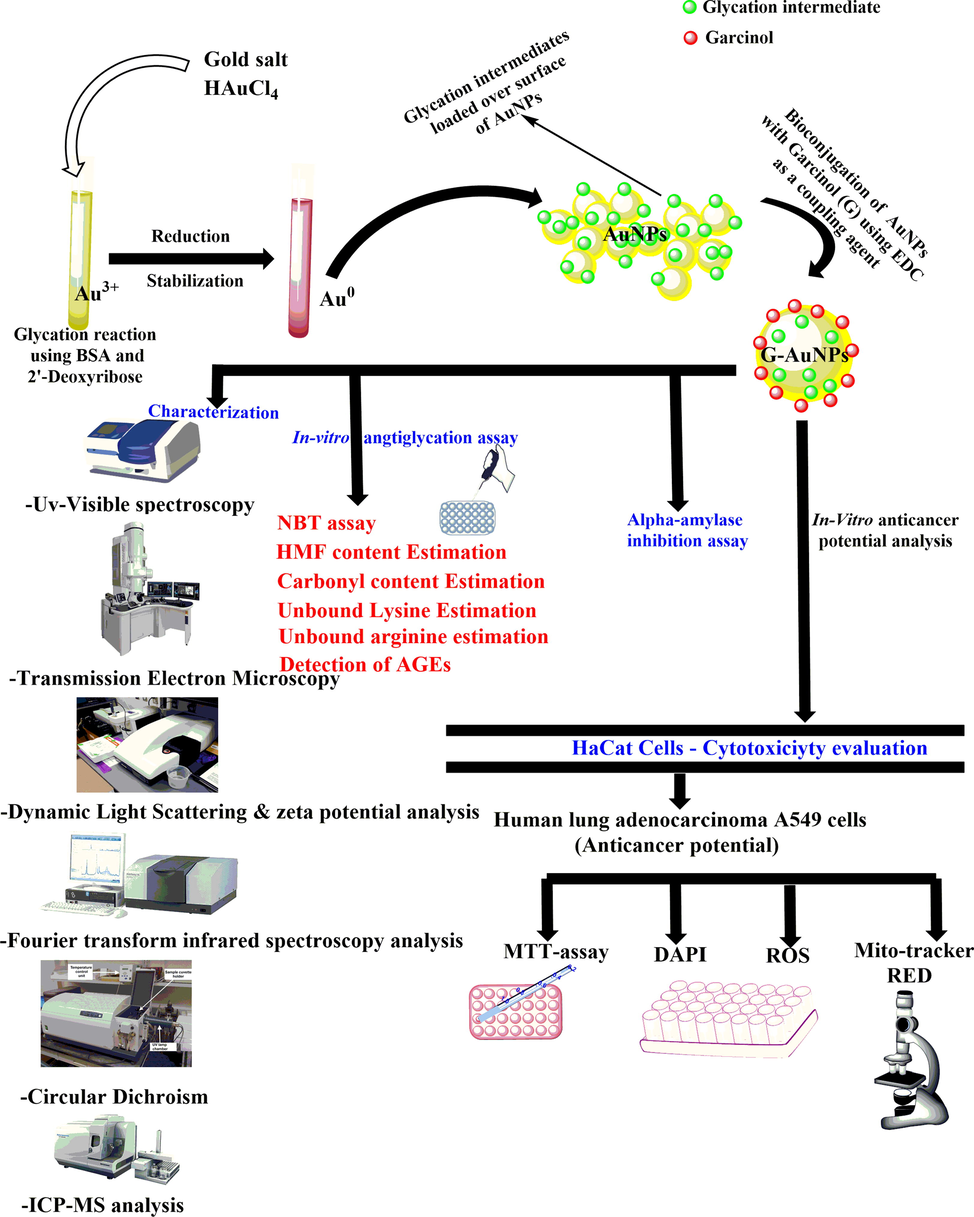
Schematic representation of synthesis of AuNPs, bioconjugation with G (G-AuNPs), characterization, cytotoxicity analysis, antiglycation activity & α- amylase inhibitory activity of pure Garcinol (G), AuNPs and G-AuNPs.
2 Material and methods
2.1 Materials
Garcinol (G) was obtained from Cayman Chemical, Michigan, U.S.A., Chloroauric acid H[AuCl4] was purchased from Sigma-Aldrich Chemicals Private Limited, Bangalore-India. Bovine serum albumin (BSA) along with 2′-Deoxyribose sugar, nitro blue tetrazolium (NBT), trichloroacetic acid (TCA), oxalic acid, sodium bicarbonate, sodium carbonate, disodium hydrogen phosphate, sodium chloride, sodium hydroxide was obtained from HiMedia Laboratories Pvt ltd, Mumbai, Maharashtra (India). Ethanol and sodium azide were obtained from Merck, and 2, 4, 6 trinitrobenzene 1 sulphonic acid (TNBS) was obtained from G-Biosciences (St. Louis, U.S.A). Phenanthrenequinone and triphenylphosphine were purchased from Sigma Aldrich. Dinitrophenylhydrazine (DNPH) and ethyl acetate were obtained from Rankem (VWR Lab Products Pvt. ltd. Bengaluru-India). Guanidine hydrochloride was obtained from S.D. Fine-chem limited, hydrochloric acid (HCL) from Thermo Fisher Scientific India Pvt. ltd, Maharashtra-India. NBT solution was prepared.
2.2 Glycation reaction mediated synthesis of AuNPs
The process was carried out in two steps, firstly glycation assay has been prepared, afterwards H[AuCl4] was supplied to the reaction mixture for the synthesis of AuNPs.
For glycation assay, a reaction having BSA (6 µM) and 2′-Deoxyribose (100 mM) in 0.1 M phosphate buffer saline (PBS), pH 7.2 with 0.05 % sodium azide was set for 19 days at 37 °C and this reaction mixture was utilized as control, additionally in another similar reaction mixture,1 mM (H[AuCl4]) was supplied at the third day to the reaction mixture. The colour change in in the reaction mixture containing (H[AuCl4]) indicated the synthesis of gold nanoparticles (AuNPs) which was further confirmed by UV–Visible spectroscopy (Rafi et al., 2020). Further, a similar reaction except the addition of H[AuCl4] was used as a control (Rafi et al., 2020). The extraction of AuNPs from the reaction mixture was extracted/recovered through centrifugation (10,000 g) for 30 min. All unbound components of AuNPs were removed by flushing them with 50 % ethanol and twice with Milli Q water.
2.3 Bioconjugation of synthesized AuNPs with G
In-vitro glycation reaction mediated synthesized AuNPs were coupled with the herbal drug G utilising a coupling agent or activator, 1-ethyl-3-(3-dimethyl) carbodiimide (EDC). A reaction volume of 5 ml had been made including 250 μg G, 250 μg AuNPs, and 50 mM HEPES (4-(2-hydroxyethyl)-1-piperazineethanesulfonic acid) buffer and incubated at 40 °C for 3–4 h. The trace amounts of EDC were added dropwise at regular intervals during the aforesaid incubation time period.
2.4 Loading efficiency (LE) of G on G-AuNPs
By analysing the difference in wavelength at 276 nm, before and after the bioconjugation, the total loading percentage of G on G-AuNPs was determined (Pan et al., 2002). Finally, the overall loading percentage on G-AuNPs is calculated by adding these absorbance intensities together. By entering the values of A and B into the following equation, the loading efficiency of G was calculated.
Where A is the total quantity of drug G added for bioconjugation with AuNPs, and
B is the absorbance intensity of G in the supernatant post bioconjugation process.
Both A and B were measured at 276 nm, which resembles the pure G's characteristic peak. (Pan et al., 2002). The sum of the unbound drug during bioconjugation with AuNPs was measured using the standard curve of the native drug G, established at the wavelength of 276 nm. The amount of bioconjugated drug was determined by subtracting the cumulative amount of drug added in the reaction mixture from the amount of unbound drug. The following equation was used to quantify the precise quantity of the bioconjugated drug.
2.5 Characterization of synthesized AuNPs and G-AuNPs by various physical techniques
For spectroscopy analysis, a Shimadzu dual-beam spectrophotometer (model UV-1601 PC) with a resolution of 1 nm was used. TEM (Transmission Electron Microscopy) was performed on a Tecnai G2 Spirit TEM instrument assembled with BioTwin lens configuration (Hillsboro, OR, USA) with an accelerating voltage of 80 kV. The sample was made by drying a drop of AuNP and G-AuNP solution on carbon-coated TEM copper grids and then measuring it under the microscope. A dynamic light scattering (DLS) particle size analyzer was used to determine the mean particle size of G-AuNPs (Zeta Sizer Nano-ZS, Model ZEN3600, Malvern Instrument ltd, Malvern, UK). A disposable sizing cuvette of 1.5 ml (DTS0112 small volume) was used to collect the sample. In deionized water, the sample powder was dissolved to a concentration of 0.5 percent (w/v). Sonic & Material Inc., New Town, CT, USA, was used to sonicate the particles for 1 min at 30 W (20 sec on and 5 sec off). The sum of triplicate measurements for a single sample was used to calculate the mean particle size. A Zeta Sizer Nano-ZS, Model ZEN3600, was used to calculate the surface charge of G-AuNPs (Malvern Instrument ltd, Malvern, UK). Fourier transform infrared spectroscopy (FTIR) was used to analyze the conformational shifts and binding in G-AuNPs which is performed on a Shimadzu FTIR-8201 PC instrument in the diffuse reflectance mode with a resolution of 4 cm-1. Two hundred fifty-six scans of the bioconjugate film were taken in the range 400–4000 cm-1 to achieve good signal-to-noise ratios. By coupling the inductively coupled plasma mass spectroscopy (ICP-MS) analysis reading with drug loading efficiency values, we also resolved the total number of drug molecules attached to each AuNP. After the successful bioconjugation of AuNPs with drug G, the secondary structural changes were determined by (Far-UV CD) through spectropolarimeter (Jasco J1500). Different secondary forms are represented by the spectrum between 200 and 260 nm using a 1 mm path length cuvette(Rafi et al., 2020)(Ashraf et al., 2015).
2.6 Antiglycation potential of G and G-AuNPs
For antiglycation experiments, six different reactions (total volume − 3 ml) were formulated in separate test tubes containing BSA (0.4 mg/ml), 2′-Deoxyribose sugar (100 mM) in phosphate buffer saline (PBS) at pH 7.4 comprising 0.05 % sodium azide with Pure G (concentrations − 1,2 and 4 mM) and G-AuNPs (Concentrations − 16.25, 32.55, and 65.1 µM) at different concentrations to analyse the potential of inhibitors. Additionally, the above reaction mixture without any inhibitor(s) was treated as a control. The reaction mixtures were incubated for sixteen days at 37 °C and dialysis was performed to remove unbound constituents.
2.7 Determination of keto-amine content
Protein glycation generates Amadori products/ketoamines, which further transform into AGEs, even more stable compounds. Therefore, the inhibition of keto-amine formation via pure G, AuNPs and G-AuNPs was examined by nitroblue tetrazolium assay (NBT) (Ravindran et al., 2010). For NBT assay, 20 µl modified BSA (control) was mixed with NBT (0.25 mM) and different concentrations of pure G and G-AuNPs in separate reactions in 180 µl sodium carbonate-bicarbonate buffer (100 mM; pH 10.8) at 31 °C for 40 min. Subsequently, the absorption intensity was measured on daily basis at 525 nm until a decline in the absorbance intensity was observed and finally the keto-amine content was calculated using the formula below (Ahmad et al., 2012) using the extension coefficient of 12,640 M−1cm−1.
2.8 Quantification of hydroxymethylfurfural (HMF) content
Thiobarbituric assay (TBA) was used to quantify the HMF content in unmodified BSA (native), glycated BSA (control), glycated BSA treated with G and G-AuNPs (test reactions) (Ansari et al., 2009). HMF is a glycation intermediate generated during the development of early glycation end products. The HMF concentration was determined by combining the aforementioned samples with 400 µl of 1 M oxalic acid, keeping the reaction mixture at 100 °C for 1 h and then cooling to room temperature. The samples were then precipitated with 500 µl of 40 % trichloroacetic acid at 24 °C for 10 min followed by centrifugation at 8,000 rpm at 24 °C. The supernatant was removed and 500 µl thiobarbituric acid (0.05 M) was added, followed by 30 min of incubation at 40 °C. At 443 nm, the absorption was measured against thiobarbituric acid, which served as a blank, and the concentration of HMF (nmol/ml) was determined utilizing molar extinction coefficient of 4x10⁴ M−1cm−1.
2.9 Determination of carbonyl content
Carbonyls attached to proteins are intermediates in the formation of AGEs, and their concentration increases with the degree of glycation. Therefore, the amount of carbonyl content in native samples containing unmodified BSA (native), glycated BSA (control), glycated BSA treated with G and G-AuNPs (test reactions) was determined. 400 µl of DNPH solution was mixed with 100 µl of each of the above-mentioned samples, and the mixture was incubated in the dark for 60 min in order to precipitate the specimens. The reaction was completed by adding 500 µl of trichloroacetic acid to the mixture. Following that, a 5-min incubation on ice was performed, followed by centrifugation at 4 °C and 10,000 rpm. Subsequently, the precipitates were washed three times with ethanol-ethyl acetate in a ratio of 1:1(v/v), and the precipitate was dissolved using 6 M guanidine hydrochloride. At 360 nm, the absorbance was measured against guanidine hydrochloride, which was used as a blank. Carbonyl content was calculated using an extinction coefficient of 22000 M−1cm−1, as previously published (Ansari et al., 2009).
2.10 Determination of unbound lysine content
Lysine residues are glycation-prone; therefore, the level of unbound lysine residues tends to decrease during glycation. Thus, the proportion of free lysine was measured using the 2, 4, 6 trinitrobenzenes-1-sulphonic acid (TNBS) method in unmodified BSA (native), glycated BSA (control), glycated BSA treated with G and G-AuNPs (test reactions). During the experiment, 500 µl of each of the above-mentioned samples was thoroughly mixed with 500 µl of 4 % (w/v) sodium bicarbonate buffer and 500 µl of 0.1 % aqueous TNBS solution. After 2 h of incubation at 40 °C, 25 ml of concentrated HCL was added, afterwards, the samples were incubated for another 90 min at 110 °C. Subsequently, after cooling the reaction mixture to room temperature, the samples were centrifuged for 10 min at 3000 rpm and the supernatant was added with ether (5 ml) to eliminate the TNP α amino complex. The resultant solution was maintained in boiling water to allow the leftover ether to evaporate. Finally, the absorbance of the reaction mixture was measured at 346 nm against a blank using a quartz cuvette with a path length of 1 cm on a bio spectrum - kinetics spectrophotometer (Eppendorf). (S. D. Sharma et al., 2002). the percentage of unmodified lysine residues was calculated using the following equation: Percent of unmodified lysine residues = [(Absorbance of glycated BSA- Absorbance of unmodified or inhibitor treated BSA)/ (Absorbance of glycated BSA)] × 100
2.11 Quantification of unbound arginine residues
Along with occurrence at lysine residues, the glycation reaction also tends to occur at the arginine residues making it a prone site for glycation. These arginine residues produce fluorescence when interact with phenanthrenequinone, therefore we assessed the percentage of unreacted arginine in unmodified BSA (native), glycated BSA (control), glycated BSA treated with G and G-AuNPs (test reactions) using standard method (Smith & MacQuarrie, 1978). For the quantification procedure, 500 µl of 200 µM phenanthrenequinone was added to each sample and properly mixed, followed by the addition of 0.5 ml of 2 N NaOH and incubation at 30 °C for 60 min. Following incubation, the samples were treated with 0.5 ml HCl (1.2 M), and the fluorescence spectra of all the above-mentioned samples were recorded in the wavelength range of 350–450 nm using a 312 nm excitation wavelength (Smith & MacQuarrie, 1978).
2.12 Fluorescence studies for determination of AGEs in G and G-AuNPs treated samples
As mentioned in a prior study, fluorescence spectra were recorded (Rafi et al., 2020)(Jairajpuri et al., 2015) on carrying eclipse fluorescence spectrophotometer G9550-64000 by Agilent technologies has a temperature controller with a steady temperature keeper with a precision of 0.1 °C and a quartz cell with a 1 cm path length. The unmodified BSA (native), glycated-BSA (control) and G plus G-AuNPs treated samples were excited at wavelength of 340 nm, and emission intensities were measured between 330 and 550 nm. (Sattarahmady et al., 2007). The following equation calculated percent change in the fluorescence Intensities (% FI): Increase in fluorescence intensity = [(FI of modified BSA - FI of unmodified or inhibitor treated BSA)/ (FI of modified BSA)] × 100
2.13 α-amylase inhibition assay of G and G-AuNPs
The slightly modified standard procedure was adopted (Bernfeld, 1955) to investigate the in vitro inhibitory potential of G, AuNPs and G-AuNPs against porcine pancreatic α-amylase. The enzyme was dissolved in the ice-cold phosphate buffer (20 mM, pH 6.7) in order to achieve the final concentration of 0.15 unit/mL. Except the blank, 25 μl of α-amylase was mixed with 10 μl of samples (glycated BSA as a control, G, AuNPs and G-AuNPs) in separate test tubes. The mixtures were pre-incubated for 20 min at 37 °C. After incubation, 25 μl substrate (0.5 % w/v starch in 20 mM phosphate buffer; pH 6.7) was added to each test tube in order to start the reaction. Further, the vortexed mixture was incubated for 15 min at 37 °C. 200 µl of DNS color reagent (40 mM DNS, 1 M K-Na tartarate and 0.4 M NaOH) was added, vortexed and boiled in a water bath at 100 °C for 10 min. Subsequently, the mixture was cooled down, and the absorbance was read at 540 nm. Each experiment was performed in triplicates including the blank. Inhibition was calculated using the formula:
Percent inhibition = 100 − (mean product in sample/mean product in control) × 100.
2.14 In-vitro cytotoxicity analysis & anticancer potential of G & G-AuNPs
2.14.1 Cell viability (MTT) assay
Normal human keratinocyte HaCat cells and human lung adenocarcinoma A549 cells were seeded in a 96 well plate at a density of 1x10⁴ cells per well and incubated at 37 °C for 24 h in a humidified 5 % CO2 incubator. After 24 h incubation period, normal human keratinocyte HaCat cells were treated in triplicates with pure G (1, 2, 3, 4, 5, 6, and 7 mM), AuNPs (80, 160, 240, 320, 400 and 480 µM) and G-AuNPs (50, 75,100, 125,150,175 and 200 µM) and incubated for another 48 h before being removed from the media and stained with 50 µl of 3-(4,5-dimethylthiazol-2-yl)-2,5- diphenyltetrazolium bromide (MTT). The plates are then incubated for another 4 h in a 5 % CO2 incubator. The resulting formazan crystals were then dissolved in 150 µl of Dimethyl sulfoxide. Subsequently, the reduced MTT was quantified using an ELISA reader (Microplate Reader (BIORAD-680) that calculated optical densities at a wavelength of 570 nm with a reference filter set at 655 nm. Finally, the percentage of inhibition exerted by G and G-AuNPs was determined using the formula:
Percent Inhibition = [100-{(Atest-Ablank)/(Acontrol-Ablank)}] × 100.
Atest resembles the absorbance of the test sample, Ablank resembles the absorbance of the blank sample, and Acontrol resembles the absorbance of the control sample. Additionally, the IC50 of the test samples were determined by fitting the observed data using ORIGIN 6.1.
2.14.2 Comparative cytomorphological analysis of HaCat and A549 cells
Normal human keratinocyte HaCat cells and human lung adenocarcinoma A549 cells were treated with the G and G-AuNPs at the IC25, IC50, and IC75 concentrations followed by incubation at 37 °C for 48 h in a 5 % CO2 incubator. The inverted phase-contrast microscope was used to detect morphological alterations in the cells after the 48-h incubation period. (Nikon ECLIPSE Ti-S, Nikon Corporation, Tokyo Japan).
Investigation on nuclear condensationUsing the fluorescent nuclear stain DAPI, the apoptotic ability of G & G-AuNPs in human lung adenocarcinoma A549 cells was investigated. The A549 cells were first plated in a 96-well plate, then treated with G & G-AuNPs at the IC50 concentration determined by a cell viability assay. The cells were then rinsed in phosphate buffer saline (PBS) and fixed for 10 min in 3.7 % paraformaldehyde. The fixed cells were permeabilized with a solution containing 3 % paraformaldehyde and 0.5 % Triton X-100, and DAPI was then used to stain the treated cells and their photographs were captured via a fluorescence microscope (Nikon ECLIPSE Ti-S, Japan). The resulting apoptotic cells have shown fragmented and condensed nuclei.
2.14.3 Measurement of intracellular reactive oxygen species (ROS) level
Utilizing the DCFH-DA technique, the intracellular ROS production was analysed. This analysis was based on the ROS-derived production of highly fluorescent product 2′,7′-dichlorofluorescein (DCF) from the non-fluorescent dye 2′,7′-dichlorofluorescein diacetate (DCFH-DA). The human lung adenocarcinoma A549 cells were plated in a 12 well plate with 2 x10⁵ cells per well, and 24 h incubation was done at 37 °C in a 5 % CO2 incubator. The cells were then treated with G & G-AuNPs at the IC50 concentrations calculated by the viability assay and incubated for another 12 h before being incubated for a time period of 30 min with 10 µM DCFH-DA at 37 °C and eventually washed to eliminate any excess DCFH-DA. Finally, the resulting images were captured using a fluorescence microscope (Nikon ECLIPSE Ti-S, Japan),
2.14.4 Detection of the mitochondrial membrane potential (ΔΨm)
A selective mitochondrial fluorescent dye (Mito Tracker Red CMX Ros) was utilised to detect alterations in mitochondrial membrane potential. In a 12-well plate, A549 cells (2x10⁵ cells/well) were plated and allowed to adhere overnight. The cells were then treated with G & G-AuNPs at IC50 concentrations determined by a cell viability assay. Subsequently, the treated cells were then washed, followed by fixing with 3.5 % paraformaldehyde for 15 min at 37 °C before being permeabilized with 0.05 % v/v Triton X-100. Finally, the cells were stained for 30 min in the dark with Mito Tracker Red (25 ng/ml) and images were captured using an inverted fluorescence microscope (Nikon ECLIPSE Ti-S, Japan).
3 Results
3.1 Characterization of synthesized AuNPs and G-AuNPs
A variety of bionanotechnological applications have been made possible by the unique properties and surface activities of gold nanoparticles (AuNPs) (Al Hagbani et al., 2022)(Alshahrani et al., 2021)(Khan et al., 2021). It is possible to synthesize AuNPs by using a wide range of techniques. All of these methods make use of reducing and encapsulating drugs or biomolecules. It is also possible to add ligands, pharmaceutical chemicals and other moieties to the GNP framework. By minimizing the necessity for a reducing/capping agent, this approach also reduces the danger of residual contamination caused by an external chemical or biomolecule(Khan et al., 2021). The synthesis of AuNPs was validated in this study by a steady colour shift of the reaction solution to ruby red after incubation. Therefore, surface plasmon resonance (SPR) in AuNPs explains the colour change. The formation of early glycation end products (EGEPs) during the glycation of BSA aided in the synthesis of AuNPs in this investigation. According to NBT data as represented in our previous study (Rafi et al., 2020), AuNPs of a significant size were generated on the day when EGEP creation was at its peak (Day 8 of the reaction), suggesting that EGEPs are responsible for reducing the gold salt into AuNPs and that, after reduction, they may act as a cap on AuNPs.
3.2 UV–Visible spectroscopy
The UV–Visible absorption spectra of G-AuNPs displayed a surface plasmon resonance (SPR) band centred at 536 nm including the characteristic peak of the drug centred at 276 nm. Compared to the SPR band of synthesized AuNPs, an 8 nm redshift is observed resulting from bioconjugation of the AuNPs with G, as shown in Fig. 2 A. The aforesaid redshift is observed due to the capping of G over the surface of the AuNPs resulting by bioconjugation procedure.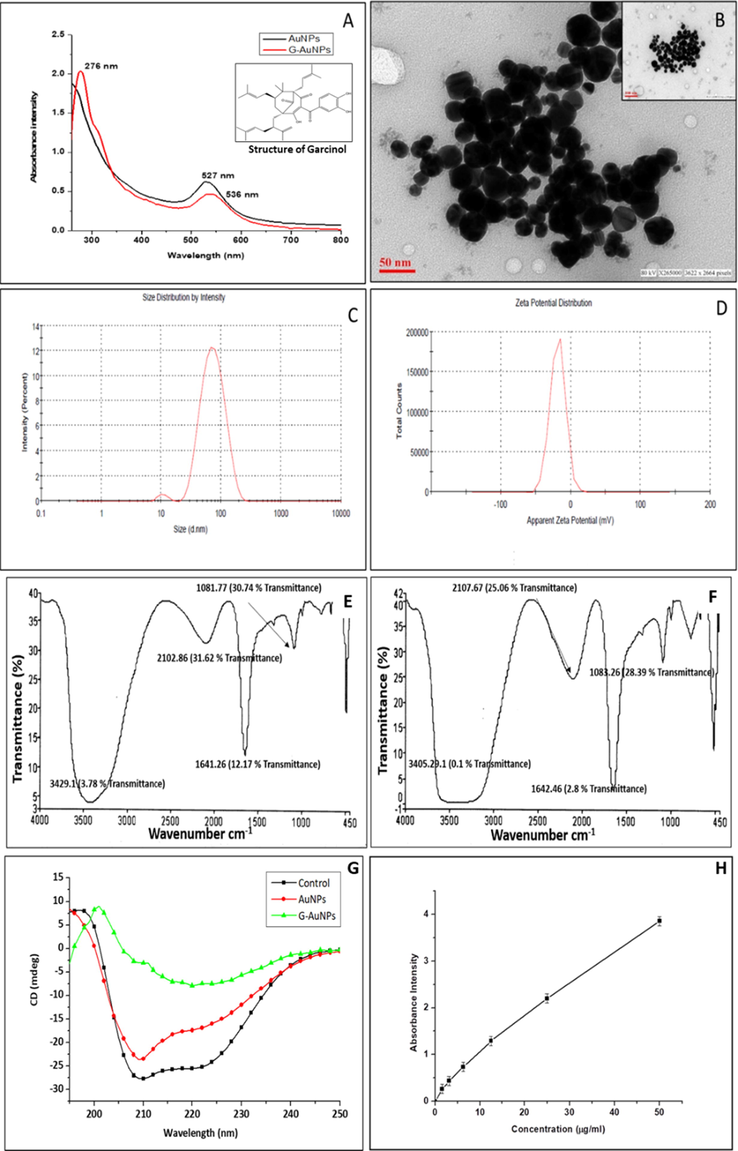
(A) SPR band of AuNPs (527 nm) & G-AuNPs (536 nm) (B) TEM micrograph of G-AuNPs (26.5 d. nm) at 50 nm and 100 nm resolution(inset), (C) Size distribution profile of G-AuNPs, DLS (∼79.5 d. nm) (D) Zeta potential (-18.6 mV) of G-AuNPs (E) FTIR measurements of AuNPs (F) FTIR measurements of G-AuNPs performed in the range 4000–450 cm−1 (G) Far UV CD spectra of modified BSA sample (control), AuNPs and G-AuNPs (H) Standard curve of pure drug garcinol plotted at varying concentrations at its characteristic peak (276 nm). The investigations are the average of three independent experiments/scans performed under identical experimental conditions.
3.3 TEM, DLS and zeta potential
The core size of G-AuNPs has been validated by TEM micrographs and found to be ∼ 29 d. nm (Fig. 2 B). The findings of the TEM micrograph indicated an increase in the size of the AuNPs post bioconjugation with G. Also, the blurr image of TEM indicated the bioconjugation. Further, the UV visible spectroscopy showed the characteristic peak (276 nm) of the drug G demonstrated that G is successfully bioconjugated over the surface of the AuNPs (Fig. 2 A). TEM computes the size of nanoparticles by direct transmitting electrons that have only inorganic core details and that do not contain a hydration layer.
To examine the elevation in hydrodynamic radius of G-AuNPs in contrast to AuNPs, DLS was also performed. In an aqueous solution, the surface of the nanoparticles is bound by a thin electrical dipole film in the liquid. Therefore, when the DLS of the AuNPs is done, the hydrodynamic particle layer and the coating materials (solvent layer that is covered by the nanoparticle) is analyzed (Berne & Pecora, 2000). DLS of the synthesized AuNPs was found to be 71 d. nm, whereas, after the bioconjugation with G, G-AuNPs showed the size of 79.5 d. nm including the hydrodynamic layer (Fig. 2 C). Besides, zeta potential is responsible for propagating, aggregation, ionization, exposure, or shielding of charged moieties and nanoparticle adsorption. (Rabinovich-Guilatt et al., 2004). The synthesized nanoparticles zeta potential was found to be −15.9 mV, and of G-AuNPs were observed to be −18.4 mV (Fig. 2 D). The functional group of lysine-rich early glycation end products that capped the AuNPs is responsible for the nanoparticle’s negative charge and attributed to the high stability of the AuNPs and G-AuNPs(Ansari & Dash, 2013). The differences in AuNPs and G-AuNPs zeta potential is attributed to the bioconjugation of G to AuNPs.
3.4 Circular dichroism analysis
CD was performed to assess if lysine-rich(Ansari & Dash, 2013) early glycation end products have undergone conformational changes after successful bioconjugation with AuNPs. Two negative bands at 208 and 222 nm distinguish the far-UV CD signal. These bands resulted by amide group π- π* and n- π* transitions, are typical in proteins with a high helical content(Greenfield, 1999). CD of the modified BSA sample (control), AuNPs and G-AuNPs were performed. The observed results portrayed a loss of 88.19 % in negative ellipticity at 208 nm in G-AuNPs against negative ellipticity of AuNPs at 208 nm. However, 56.13 % loss in negative ellipticity at 222 nm has been observed in G-AuNPs comparative to the negative ellipticity of AuNPs (222 nm) (Fig. 2 G). Conformational modifications that occurred after the bioconjugation of G with AuNPs culminated in a decreased percentage of negative ellipticity. Our findings are well justified based on the previous studies which addressed that ellipticity transition after bioconjugation with gold nanoparticles are resulted by structural adjustment (Matei et al., 2019).
3.5 Fourier transform infra-red spectroscopy
FTIR spectra of AuNPs and G-AuNPs are shown in Fig. 2 E & F. The AuNPs spectrum revealed distinct frequencies at 3429.1, 2102.86, 1,641.26, 1081.77 cm−1 with a transmittance of 3.78, 31.62, 12.17, and 30.74 % respectively while the G-AuNP spectrum obtained after the bioconjugation of drug G with AuNPs represented distinct frequencies at 3405.29, 2107.67, 16.42.46 and 1083.26 with a transmittance of 0.1, 25.06, 2.8 and 28.39 % respectively. These altered frequencies and transmittance are attributed to the structural modifications that occurred after the possible capping of G over AuNPs (Yamaguchi et al., 2000)(Fernando et al., 2019a). The existence of asymmetric C—H stretching vibrations in the range 3100–3000 cm−1, which is the characteristic region for detection of C—H stretching vibrations, can be seen in aromatic organic compounds; derivatives of benzene(Vinod et al., 2015)(Bellamy, 2013)(Puviarasan et al., 2002). A broad peak at 3405.29 cm−1 (Krishnaprabha & Pattabi, 2016) allocated to C—H stretching vibrations observed in our result confirms the presence of G over the surface of AuNPs after efficient bioconjugation with AuNPs comparative to the FTIR of the sample containing only synthesized AuNPs(Fernando et al., 2019b).
3.6 Analysis of drug loading efficiency
The loading percentage of G over AuNPs was calculated and found to be 78.6 % attributed to efficient capping of G over AuNPs. The recorded values of A and B were 2.035 and 0.554 respectively. The standard curve of pure drug G curve was plotted at 276 nm (Fig. 2 H), and the unbound drug was calculated from the standard curve. The amount of the bioconjugated drug was computed by excluding unbound drugs from the total amount of drug used in the reaction mixture. The exact quantity of G bioconjugated with AuNPs was found to be 39.3 µg/ml of the reaction mixture.
3.7 Inductively coupled plasma mass spectrometry (ICP-MS) analysis
The elemental analysis of AuNPs and G- AuNPs revealed that an ample amount of drug G is loaded over the surface of AuNPs. The number of AuNPs under ICP-MS was found to be 3.485 X 10¹⁶ against 38746 ppb of gold in AuNPs. Similarly, 18149 ppb correspond to 7.08 G molecules/AuNPs was established with ICP-MS analysis (Table 1).
Sample
ICP-MS reading of samples(ppb)
No. of molecules
AuNPs
38746 ppb
3.485 X 10¹⁶ AuNPs.
G-AuNPs
18149 ppb
7.08 molecules attached to single AuNP
3.8 Antiglycation studies of G and G-AuNPs
3.8.1 Early glycation adducts, keto-amine inhibition exerted by G and G-AuNPs
Glycation reaction is initiated by the establishment of Schiff's base, followed by the formation of keto-amines or amadori products which are known to be early markers of the glycation process. To further suppress the establishment of AGEs, the inhibitory effect of G and G-AuNPs at different concentrations was evaluated by measurement of the keto-amines produced through NBT reduction assay. As shown in the Fig. 3, the keto-amine content examined in glycated BSA was found to be 44.02 ± 0.22 nmol/mg in comparison to unmodified BSA (native), which was found 1.92 ± 0.04. Furthermore, it has been observed that test inhibitors G and G-AuNPs and standard inhibitor AG inhibited amadori products formation to different degrees. Under experimental conditions, it has been observed that the number of keto-amines produced in the presence of 4 mM AG is 32.79 ± 0.03, while in the presence of 1 mM, 2 mM & 4 mM G, the keto-amines produced were 34.95 ± 0.05, 28.87 ± 0.09 and 17.97 ± 0.10 nmol/mg respectively (Fig. 3 A & B). However, in the presence of different concentrations (16.25, 35.55 and 65.1 µM) of G-AuNPs the keto-amines produced were found to be 39.45 ± 0.05, 35.79 ± 0.12 and 32.50 ± 0.14 nmol/mg, respectively. Nevertheless, in the comparison to G-AuNPs, the AuNPs at a concentration of 0.5 mM were observed to produce 41.77 ± 0.19 nmol/mg of keto-amine (Fig. 3 C & D). The results of the NBT assay indicated that G is a significant inhibitor of amadori product development but the results also justified that G-AuNPs have also inhibited the keto-amine formation at much lower concentration than pure G. Several inhibitors of AGEs are known to function at the late stage of glycation, while others play their inhibitory role in the early stages of glycation. (Mesías et al., 2013). The NBT reduction assay test confirmed the inhibitory role of G and G-AuNPs in the early stages of glycation by inhibiting the formation of keto-amines.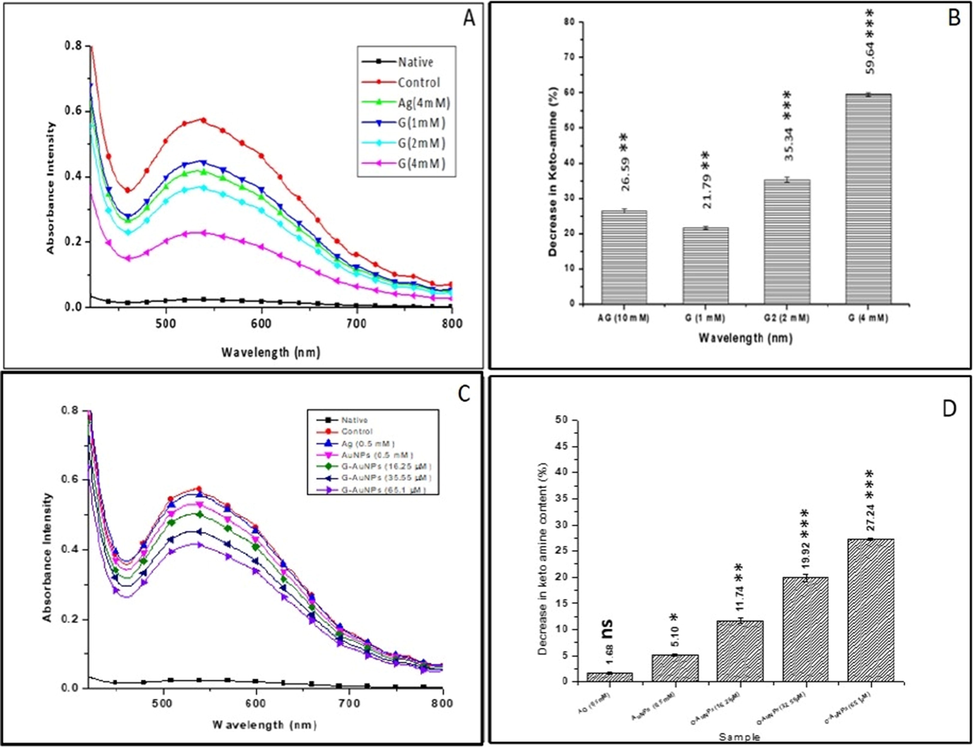
(A) NBT reduction assay for unmodified BSA (native), glycated BSA (control) and glycated samples treated with varying concentrations of G and AG (standard inhibitor) (B) The bar diagram represents keto-amine contents of unmodified BSA (native), glycated BSA (control) and glycated samples treated with varying concentrations with G and AG (C) NBT reduction assay for unmodified BSA (native), glycated BSA (control) and glycated samples treated with varying concentrations of AuNPs, G-AuNPs and AG (standard inhibitor) (D) The bar diagram represents keto-amine contents of unmodified BSA (native), glycated BSA (control) and glycated BSA samples treated with AG, AuNPs and G-AuNPs. The data represented are the mean ± SD of three determinations under identical experimental conditions. Significantly different from control at *** p < 0.001, significantly different from control at ** p < 0.01, non-significantly different from control at ns p > 0.05.
3.8.2 Inhibition of hydroxymethyl furfural content by G and G-AuNPs
Similar to keto-amine moieties, HMF is an intermediate product of the glycation process. HMF is a thiobarbituric reactive substance resulting from hydrolysis in the earliest stages of glycation. The HMF content in the glycated BSA sample (control) was found to be increased by 89.65 % (9.09 ± 0.01 nmol/ml) compared with the unmodified native BSA (0.94 ± 0.04 nmol). However, in the presence of different concentrations of test inhibitor G (1 mM, 2 mM & 4 mM), the HMF content was reduced to 6.92 ± 0.02, 5.71 ± 0.03 and 3.63 ± 0.02 nmol/ml, respectively, representing 23.91 ± 0.23, 37.18 ± 0.29 and 60.10 ± 0.23 % reduction in HMF content. Whereas AG (4 mM) was used as a standard inhibitor, showed 6.45 ± 0.03 nmol/ml of HMF justifying a 29.08 ± 0.28 % decrease in the HMF comparatively with the control reaction (Fig. 4 A).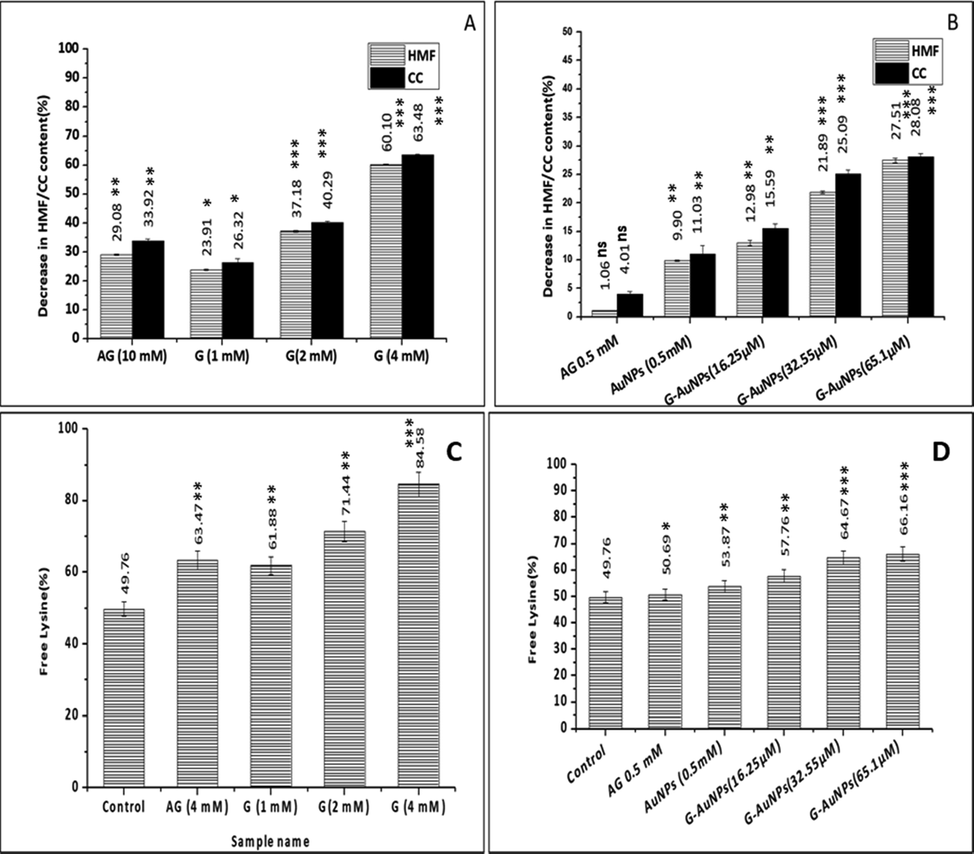
(A) Bar diagram showing percent decrease in HMF/CC content in glycated BSA samples treated with varying concentrations of G (B) Percent decrease in HMF/CC content in glycated BSA samples treated with varying concentrations of G-AuNPs. AG is used as a standard inhibitor (C) Bar diagram represents a percent of unreacted lysine residues in glycated BSA (control) and samples treated with varying concentrations of G (D) Percent of unreacted lysine residues in glycated BSA (control) and samples treated with varying concentrations of G-AuNPs. The data represented are the mean ± SD of three determinations under identical experimental conditions. Significantly different from control at *** p < 0.001, significantly different from control at ** p < 0.01, non-significantly different from control at ns p > 0.05.
However, in the presence of test inhibitor G-AuNPs at concentrations of 16.25, 35.55, and 65.1 µM, the amount of HMF recorded to 7.91 ± 0.04, 7.10 ± 0.02 and 6.59 ± 0.03 nmol/ml, respectively justifying a 12.98 ± 0.48, 21.89 ± 0.19 and 27.51 ± 0.38 % decrease in the HMF comparative to the HMF content observed in the control sample. However, AuNPs (0.5 mM) have shown a slight reduction of 9.90 ± 0.11 % in HMF compared with the control sample (Fig. 4 B). These decline in HMF content levels in the samples, which contain inhibitors in various concentrations, align with the NBT findings. The decrease in HMF levels suggests that the inhibitors prevent the structural changes in BSA caused by 2′-Deoxyribose (Siddiqui et al., 2018). In contrast to the pure G and aminoguanidine, G-AuNPs were found to be substantially strong inhibitor at much lower concentrations.
3.8.3 Estimation of carbonyl content in the G and G-AuNPs treated samples
Glycation of BSA with 2′-Deoxyribose sugar results in an increase in carbonyl content, which can be used as an oxidative stress biomarker. When BSA gets modified with 2′-Deoxyribose, the CC content levels elevates to 4.1 ± 0.03 nmol/mg of protein, a > 5-fold increase compared to the unmodified native BSA (0.74 ± 0.001). According to the findings of our experiment the test inhibitors, G and G-AuNPs have shown a concentration-dependent diminution in CC. The CC in samples containing test inhibitor G at concentrations 1, 2, and 4 mM are found to be 3.06 ± 0.037, 2.48 ± 0.003, and 1.52 ± 0.005 nmol/mg, respectively of protein, justifying a decrease of 26.32 ± 1.37, 40.29 ± 0.42 and 63.48 ± 0.37 %, respectively compared to the CC in glycated BSA (control). However, the sample containing AG (4 mM) as standard inhibitor has shown CC 2.74 ± 0.01 nmol/mg of protein justifying a decrease of 33.92 ± 0.72 % (Fig. 4 A).
However, test inhibitor G-AuNPs at much lower concentrations 16.25, 35.55, and 65.1 µM have shown the CC content of 3.50 ± 0.006, 3.11 ± 0.009 and 2.98 ± 0.004 nmol/mg, respectively of protein justifying a significant decrease of 15.59 ± 0.75, 25.09 ± 0.71 and 28.08 ± 0.57 % in CC comparatively with the glycated BSA (control). However, AuNPs (0.5 mM) have shown a slight decrease of 11.04 ± 1.51 % in CC (Fig. 4 B). This strong inhibition of the CC content might be attributed to the strong antioxidant activity of the G (Hirata et al., 2005)(X. Wang et al., 2011). The lower levels of carbonyls in the inhibitor-treated samples corresponded to lower levels of amadori products, justifying that G is a superior inhibitor of both early and late-stage glycation, eventually blocking the formation of more stable AGEs.
3.8.4 Determination of the inhibitory effect of G and G-AuNPs via free lysine estimation
The glycated BSA samples showed a substantial reduction in free lysine residues. Only 49.76 ± 2.02 % of the total lysine residues are left unreacted in the glycated BSA (control), implying the involvement of remaining arginine residues in the glycation process. However, relative to the glycated BSA samples (control), the test inhibitor-treated samples (G and G-AuNPs) had a slightly higher percentage of unreacted lysine residues. The samples treated with 1,2- and 4-mM G showed 61.88 ± 2.51, 71.44 ± 2.91 and 84.58 ± 3.44 %, respectively of unreacted lysine residues (Fig. 4 C). At the same time, samples treated with standard inhibitor AG (4 mM) showed 63.46 ± 2.57 % of free lysine residues.
However, the samples treated with 16.25, 35.55, and 65.1 µM G-AuNP have shown 57.76 ± 2.35, 64.67 ± 2.63 and 66.16 ± 2.68 %, respectively unreacted lysine residues, while the 0.5 mM AuNPs treated samples showed 53.87 ± 2.18 % of unreacted lysine residues (Fig. 4 D). According to recent research, the percent reduction in the unreacted lysine residues in glycated BSA samples is attributed to the level of glycation at lysine residues in the protein (Siddiqui et al., 2018). The inhibition level exerted by G and G-AuNPs is demonstrated by the reduction in the percent lysine residues compared to the free lysine in the glycated BSA (control).
3.8.5 Inhibitory effect of G & G-AuNPs via unreacted arginine estimation
Glycation and the development of AGEs both are resulted from the binding of arginine residue to reducing sugar molecules. The percentage of unreacted arginine residues was calculated using phenanthrenequinone, which, when reacts with the arginine residues in the sample mixture, produces fluorescence in the range of 300–500 nm at the emission wavelength of 395 nm. During the estimation process, a substantial reduction of 61.1 % in the fluorescence intensity of glycated BSA (control) was observed in comparison to unmodified native BSA, implying that only 39.64 ± 0.85 % of (unreacted) arginine was not involved in the glycation process in the glycated BSA (control). In contrast, others are involved in the glycation reaction. Our findings showed that the samples treated with 1,2 and 4 mM of test inhibitor G showed 53.63 ± 0.68, 60.97 ± 0.60, and 77.92 ± 0.20 %, respectively of unreacted arginine residues, whereas the standard inhibitor AG (4 mM) treated samples showed 57.46 ± 0.66 % of unreacted arginine residues (Fig. 5 A & B).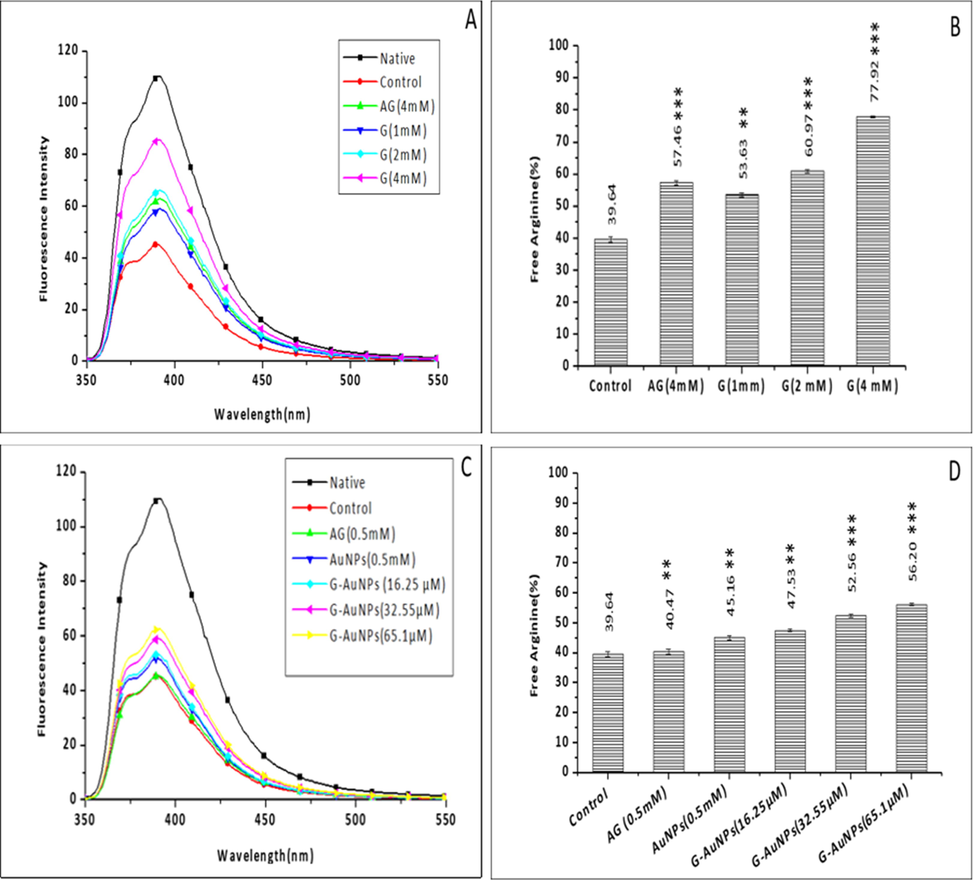
Fluorescence spectroscopy of (A) unmodified BSA (native), glycated BSA (control) and samples treated with varying concentrations of G (B)The bar diagram represents the percent of free arginine residues in unmodified BSA (native), glycated BSA (control) and samples treated with varying concentrations of G. (C) Fluorescence spectroscopy of unmodified BSA (native), glycated BSA (control) and samples treated with varying concentrations of G-AuNPs, AG is used as a standard inhibitor. The spectra are the average of three determinations under identical experimental conditions (D). The bar diagram illustrates the percent of free arginine residues in unmodified BSA (native), glycated BSA (control) and samples treated with varying concentrations of G-AuNPs; the data represented are the mean ± SD of three determinations under identical experimental conditions. Significantly different from control at *** p < 0.001, significantly different from control at ** p < 0.01, non-significantly different from control at ns p > 0.05.
Similarly, samples treated with 16.25, 35.55, and 65.1 µM of test inhibitor G-AuNP have shown 47.53 ± 0.46, 52.56 ± 0.50, 56.20 ± 0.38 % of unreacted arginine residues, respectively. Moreover, AuNPs treated samples showed 45.16 ± 0.73 % of unreacted arginine residues (Fig. 5 C & D) compared to unmodified BSA samples (native), the percentage of reacted arginine residues was determined by a decrease in fluorescence intensity (at the emission wavelength of 395 nm) after the glycation reaction. Because BSA contains a total of 23 arginine residues, it is more prone to glycation; thus, the percent reduction in unbound arginine residues is attributable to the BSA being modified by 2′-Deoxyribose. This is consistent with the fact that arginine residues had a significant role in the generation of AGEs during the reaction. Whereas the inhibitor-containing reactions contained significantly more unreacted arginine residues than the control reaction. It was deduced that inhibitors hindered the development of AGEs, hence minimising the role of lysine residues in the process.
3.8.6 Inhibition of AGEs via G and G-AuNPs
Glycation reaction leads to the development of fluorogenic AGEs. (Kessel et al., 2002), these fluorescent AGEs have heterocyclic structures that allow glycation adducts to exhibit fluorescence (Akhter et al., 2013). By using fluorescence spectroscopy, inhibition of fluorogenic AGEs in the samples was determined. The unmodified BSA (native), glycated BSA (control) and samples containing test inhibitors G and G-AuNPs and standard inhibitor AG at varying concentrations were all excited at 340 nm, with an emission wavelength of 433 nm (Fig. 6). It has been observed that the fluorescence intensity (FI) of glycated BSA (control) containing no inhibitor increased by 87.54 ± 0.20, which is a significant predictor of AGE formation after glycation. However, comparative to the glycated BSA (control) the samples treated with 1-, 2- and 4-mM G samples portrayed 24.77 ± 0.85, 43.00 ± 0.69 and 64.07 ± 0.06 %, respectively decrease in the FI, while the standard inhibitor AG(4 mM) showed 43.89 ± 0.47 % decrease in FI indicating the reduced formation of AGEs (Fig. 6 A & B).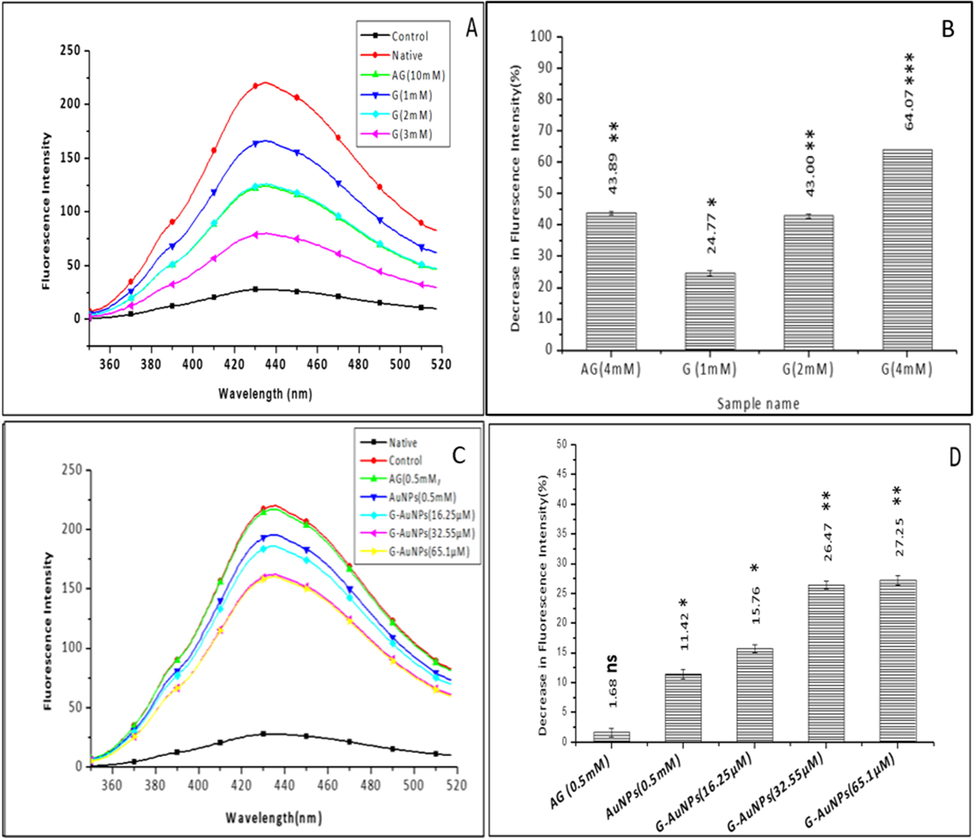
Fluorescence spectra of (A) unmodified BSA (native), glycated BSA (control) and samples treated with varying concentrations of G (B)The bar diagram represents the keto-amine contents of unmodified BSA (native), glycated BSA (control) and samples treated with varying concentrations of G (C) Fluorescence spectra of unmodified BSA (native), glycated BSA (control) and samples treated with varying concentrations of G-AuNPs, AG is used as a standard inhibitor. The spectra are the average of three determinations under identical experimental conditions (D) The bar diagram represents a percent decrease in fluorescence intensity of unmodified BSA (native), glycated BSA (control) and samples treated with varying concentrations of G-AuNPs the data represented are the mean ± SD of three determinations under identical experimental conditions. Significantly different from control at *** p < 0.001, significantly different from control at ** p < 0.01, non-significantly different from control at ns p > 0.05.
Additionally, the samples treated with 16.25, 35.55, and 65.1 µM of G-AuNP have shown 15.76 ± 0.72, 26.47 ± 0.71 and 27.25 ± 0.79 %, respectively decreases in FI. However, the sample containing AuNPs showed an 11.41 ± 0.80 % reduction in FI (Fig. 6 C & D). The antiglycation effects of G and G-AuNPs were found to be positively associated with free radical scavenging activity and significant antioxidant activity as observed previously (Hirata et al., 2005)(X. Wang et al., 2011).
3.9 α-amylase inhibition potential of G and G-AuNPs
The G and G-AuNPs were examined for the α-amylase inhibitory property to investigate the anti-diabetic potential. The hydrolysis of complex starches to maltose is derived by pancreas α-amylase. The inhibition of α-amylase results in delayed carbohydrate digestion and absorption, reducing the amount of postprandial glucose (Apostolidis et al., 2007; Shim et al., 2003). In the current analysis, G showed concentration dependent inhibition of α-amylase production with an IC50 value of 8.9 µM (Fig. 7), which is significantly higher compared to the IC50 value of standard inhibitor acarbose (0.118 mM). However, owing to confirmative shifts in α-amylase caused by the association of the AuNPs in AuNPs and G-AuNPs, there was no inhibition in the α-amylase activity upto the concentration of 65.1 µM (Deka et al., 2012). Furthermore, our findings showed that G is an effective α-amylase inhibitor and may be used for therapeutic use in humans due to significant inhibitory activity compared to acarbose. G intake from processed foods and beverages may help prevent diabetes and obesity in patients as well as treat diabetes.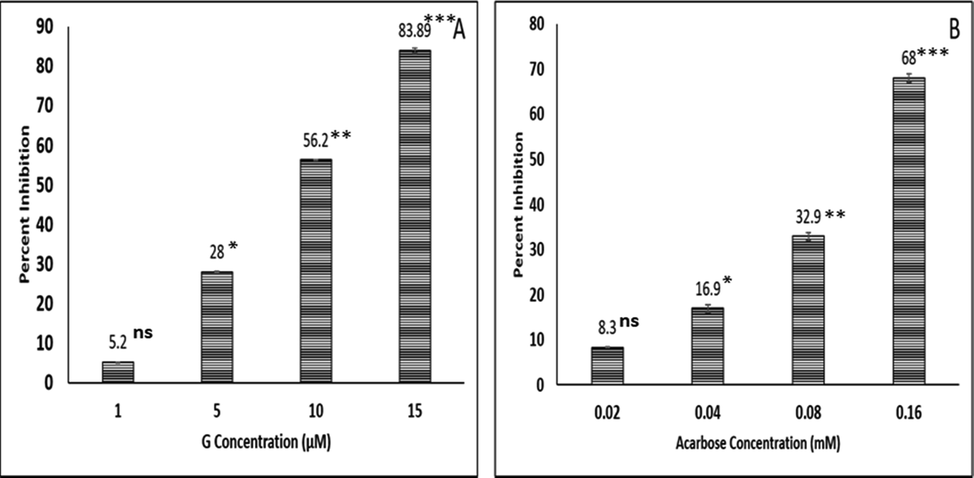
Bar diagram representing percent inhibition of α-amylase exerted by varying concentrations of (A) G and (B) Standard inhibitor acarbose. The data represented are the mean ± SD of three determinations under identical experimental conditions. Significantly different from control at *** p < 0.001, significantly different from control at ** p < 0.01, non-significantly different from control at ns p > 0.05.
3.10 In-vitro cytotoxic effect of G & G-AuNPs on HaCat and A549 cells
Using the MTT assay, the in-vitro cytotoxic effects of G and G-AuNPs on HaCat and A549cells were assessed at different concentrations (10, 20, 40,60, 80, 100, 120, 140 160 and 180 µM) of pure G and G-AuNPs with untreated corresponding cells serving as control. Similarly, the cytotoxicity analyses studies against same cell lines were calculated at various concentrations (5, 10, 15, 20, 25 and 30 µM) of G and G-AuNPs. It was found that cytotoxicity was dose-dependent. Pure G was found to inhibit cell fifty percent propagations of HaCat cells at 43.63 µM (Fig. 9B) whereas it halted half of the growth of A549cells at 28.7 µM (Fig. 9 C). However, no cytotoxicity was observed in case of AuNPs when tested against HaCat cells upto the concentration of 480 µM, but the IC 50 of AuNPs against A549cells were depicted to be 200.16 µM. Interestingly, G-AuNPs were found to produce IC 50 s against HaCat and A549cells at 86.05 µM (Fig. 9 B) and 13.3 µM (Fig. 9 C) concentrations, respectively. Our findings indicated that G-AuNPs had much lower IC50 values than pure G, implying that the anti-cancer potential of pure G has increased enormously whereas cytotoxic effect minimised after bioconjugation with AuNPs.
Cytomorphological images of normal human keratinocyte HaCat cells after treatment with G and G AuNPs at a concentration of IC25 (21.81 µM), IC50 (43.63 µM) and IC75(65.44 µM) of pure G and IC25 (43.02 µM), IC50 (86.05 µM) and IC75(129.07 µM) of G-AuNPs.
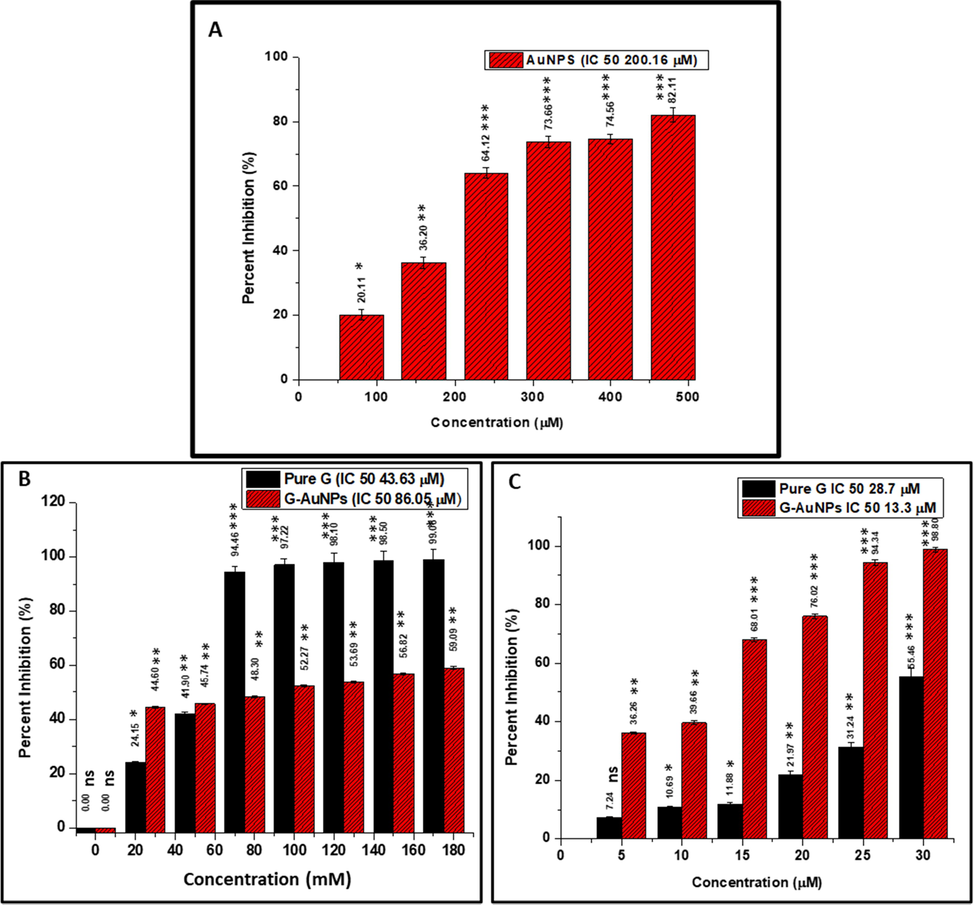
(A) The cytotoxicity (dose-dependent) study of AuNPs on A549 cells (no cytotoxicity observed against Human keratinocyte HaCat cells up to the concentration of 480 µM) (B) The cytotoxicity (dose-dependent) study of pure G & G-AuNPs on Human keratinocyte HaCat cells (C) The cytotoxicity (dose-dependent) study of pure G & G-AuNPs on human lung adenocarcinoma A549 cells. The data represented are the mean ± SD of three determinations under identical experimental conditions. Significantly different from control at *** p < 0.001, significantly different from control at ** p < 0.01, non-significantly different from control at ns p > 0.05.
4 Study of cytomorphological changes in HaCat cells
Image tools software was used to analyze the morphological changes occurred in the HaCat cells after the treatment with IC25, IC50 and IC75 concentrations of G and G-AuNPs. The degree of roundness of the cells was an excellent measure of stress level in the cell (Fig. 8). HaCat cells were treated with G & G-AuNPs at the aforesaid concentrations for 48 h, and the results revealed that after 48 h of treatment with pure G & G-AuNPs, the majority of cells transformed, detached from the substratum, and entered suspended culture conditions, while others exhibited irregular bulges (blebs) in their plasma membrane. After the experiment, it has been observed that the number of live control cells was significantly higher than the number of live cells that resulted after the treatment with G and G-AuNPs. However, the form and morphology of the untreated cells were unaffected.
4.1 Assessment of nuclear condensation and internalization of G and G-AuNPs
Using the fluorescent stain 4′, 6-diamidino-2-phenylindole (DAPI), potential mechanistic insights into G and G-AuNP internalization and their cellular uptake were explored. G-AuNPs could be taken up by cancerous cells via an endocytosis process, followed by drug release of G-AuNPs from the endosome/lysosome into the cancerous cells, where the interaction between herbal drug G and DNA occur (Hande, 1998). A549 cells were incubated with IC50 concentrations of G and G-AuNPs (determined previously by MTT assay) for 24 h at 37 °C until being stained with DAPI. In contrast to the untreated cells serving as control, G and G-AuNPs exposure caused an apoptotic impact in cells (Fig. 10), including improved permeability, which reflected in condensed chromatin and a bright blue fluorescent condensed nucleus in A549 cells (Fig. 10). Our results showed that A549 cells treated with G and G-AuNPs have shown 69.23 % (Fig. 10 B) and 87.36 % (Fig. 10 C) in increase in fluorescence intensity respectively. This nuclear condensation observed in the G and G-AuNPs treated cells might be the result of the cytotoxic reaction caused by stress in the cells (Cutts et al., 2005).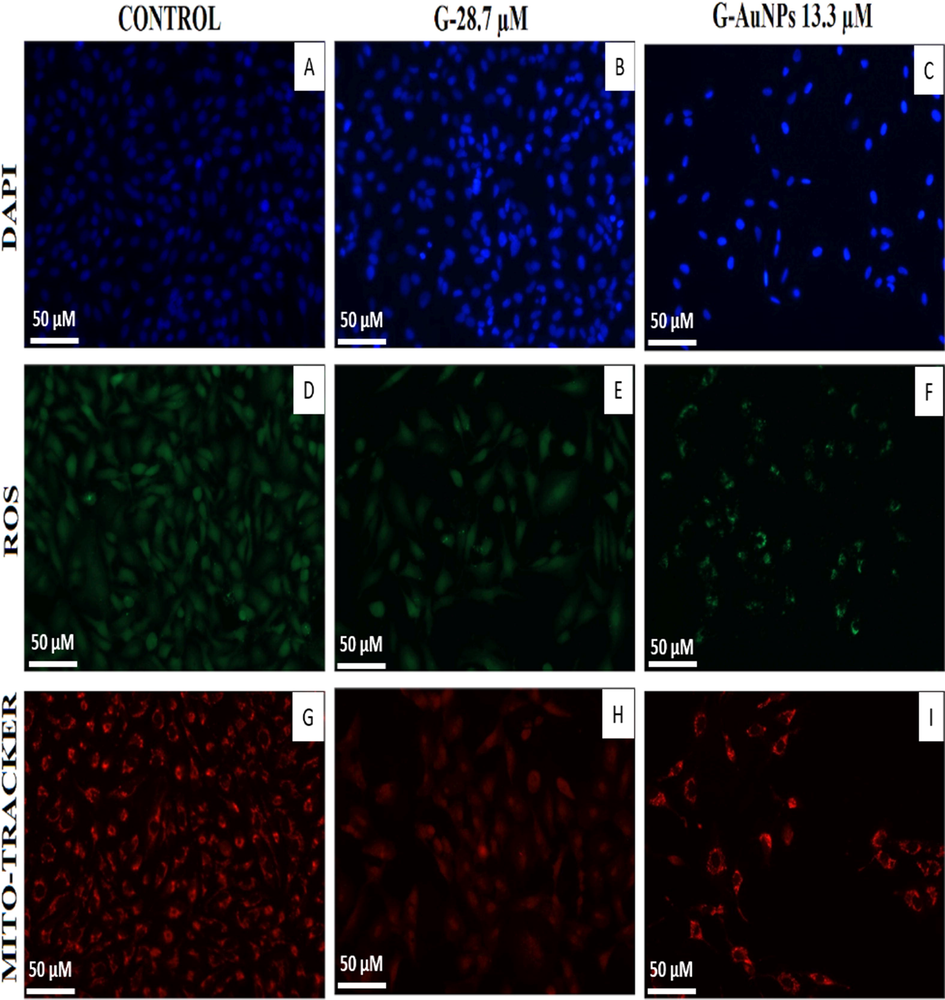
Images of DAPI, DCFDA, and mitrotracker red-stained A549 cells treated with G and G-AuNPs.
4.2 Detection of reactive oxygen species
Since DCFH-DA is an oxidation-sensitive fluorogenic marker for ROS in viable cells, it is used to calculate the extent of intracellular ROS produced in A549 cells due to interactions with G and G-AuNPs. The amount of fluorescent light detected was proportional to the number of reactive oxygen species generated by the cells (Fig. 10). The G treated cells showed a 65.2 % increase in fluorescence intensity (Fig. 10 E); however, G-AuNPs treated cells showed an increase of 86.1 % in fluorescence intensity (Fig. 10 F). The fluorescent intensity observed was directly proportional to the ROS production in the cells. A549 cells treated with G & G-AuNPs emitted bright fluorescence with distorted morphology due to plasma integrity changes resulting from ROS generation, but no noticeable fluorescence was observed in untreated cells.
4.3 Mitochondrial membrane potential estimation
Mitotracker Red CMX Ros is used to prove that G and G-AuNPs caused depolarization of the mitochondrial membrane in A549 lung cancer cells. Using mitochondrial potential, the dye was able to bind to the cells. The diminished strength of Mitotracker Red CMX Ros in G and G-AuNPs treated A549 cells was observed, suggesting that the mitochondrial membrane potential (ΔΨm) had been disturbed (Fig. 10). Observed results indicated a significant reduction of 48.63 % and 72.11 % in the intensity of Mitotracker Red CMX Ros in the G (Fig. 10 H) and G-AuNPs (Fig. 10 I) treated A549 cells respectively, justifying the disruption of the mitochondrial membrane potential (ΔΨm) (Fig. 10) of the A549 cells after the treatment. Our study portrayed that at G-AuNPs (13.3 µM) at much lower concentrations than pure G (28.7 µM) exerted more disruption in mitochondrial membrane potential.
5 Discussion
Garcinol, a polyisoprenylated benzophenone from the fruit rind of the Garcinia Indica plant, is being studied based on previous evidence of free radical scavenging, chelating, and antiglycation action (Padhye et al., 2009)(Fernando et al., 2019b)(Chang et al., 2021)(Hemshekhar et al., 2011). In the performed study, glycation reaction mediated synthesized AuNPs were bioconjugated with G to obtain G-AuNPs. Eventually, the confirmation of bioconjugation was furnished under TEM justifying a spherical shaped and monodispersed G-AuNPs (Fig. 2B). The UV–vis spectral profile of the G-AuNPs showed the SPR band of AuNPs centred at 536 nm (Fig. 2 A) representing a redshift of 8 nm resulting from the possible capping of the G over AuNPs, the findings are well justified and in accordance with previous published articles (Abu Lila et al., 2022)(Abu Lila et al., 2022)(Alshahrani et al., 2021). Additionally, the UV–Visible spectroscopy results of G-AuNPs represented the characteristic peak of the drug G centred at 276 nm which confirms the presence of G over the surface of AuNPs after the bioconjugation procedure.(Abu Lila et al., 2022) The observed size of the G-AuNPs (29 d. nm) including the hydrodynamic layer around them was portrayed by the DLS results (Fig. 2 C)(Al Hagbani et al., 2022). The G-AuNPs were found to be highly stable in nature representing a zeta potential value of −18.6 mV (Fig. 2 D)(Kus‐liśkiewicz et al., 2021)(Iram, Zahera, Khan, Khan, & Syed, 2017). The encapsulated amadori products over the AuNPs underwent conformational changes after the bioconjugation with AuNPs that can be revealed via CD (Fig. 2 G)(Rafi et al., 2020). However, it has been also revealed from the FTIR results that G is attached to the surface of the AuNPs in G-AuNPs (Fig. 2 E & F). The ample amount of G (78.6 %) was found to be loaded over the surface of the AuNPs after bioconjugation with G-AuNPs justifying approximately 7 molecules of G attached to a single AuNP (Table 1)(Al Hagbani et al., 2022).
Moreover, the comparative analysis of antiglycation potential between pure G and G-AuNPs observed that both were found to be potent glycation inhibitor preventing the glycation reaction in the early stages of glycation confirmed by the NBT reduction assay (Fig. 3) and HMF results (Fig. 4 A & B)(Wani et al., 2012). Our findings also revealed that G and G-AuNPs exerted potent inhibition of the CC content (Fig. 4 A & B) resulting in the strong antioxidant effect of the aforementioned inhibitors. The test inhibitors G and G-AuNPs also prevented free arginine (Fig. 5) and lysine residues (Fig. 4 C & D) from participating in glycation reaction resulting in lowering the extent of glycation(Rafi et al., 2020). As a result, they were observed to lower AGE development during glycation reaction which was confirmed by the fluorescence spectroscopy analysis of G and G-AuNPs treated samples (Fig. 6). The G-AuNPs has shown significantly high antiglycation potential comparable to that of the pure G due to the presence of AuNPs, as AuNPs are known to competitively bind to the free arginine and lysine groups which are acting as potent sites for glycation. As a result, the prone site of the glycation might be blocked by the AuNPs, additionally, the sufficient amount of G carried by the AuNPs might also exerted their antiglycation effect which resulted in the more efficient antiglycation potential of G-AuNPs. However, there was no discernible inhibition of α-amylase activity exerted by G-AuNPs; on the other hand, pure G showed significant inhibition of the α-amylase activity compared to the standard inhibitor acarbose (Fig. 7).
Additionally in the performed study for cytotoxicity analysis and anticancer potential, G and G-AuNPs portrayed a significant anticancer potential when tested on human lung cancer A549 cell line, as G-AuNPs are negatively charged nano systems and microdomains in caveolar vesicles that can interact and mediate anionic endocytosis of anionic nanoparticles. The caveolar vesicles are typically made of cationic lipids like sphingomyelin (an amine group present in their polar domain), therefore the G-AuNPs (anionic) might have entered the cells via micropinocytosis and caveolae-dependent endocytosis (Iram, Zahera, Khan, Khan, Syed, et al., 2017), but clatherin pathway participation was ruled out due to the anionic charge G-AuNPs.
The mechanistic insights of the anticancer potential of G and G-AuNPs relies on the fact that the nanoparticles do not fuse with lysosomes in the caveolae-mediated endocytosis pathway after entering cells, which protects the drugs from degradation and allows them to reach other organelles. During the uptake procedure, the G-AuNPs-containing vesicles might have fused with the caveosomes of the multivesicular body (MTV) after being ingested by cells. Subsequently, the caveosomes containing G-AuNPs travelled to the ER with microtubules, infiltrated the cytosol via the ER and eventually entered the nucleus through the nuclear pore complex. Internalization of G-AuNPs might also be achieved by clathrin-caveolae independent endocytosis. It is a Rhoa-dependent, Arf6-dependent, Cdc42-dependent pathway that requires specific lipid compositions and relies on cholesterol.
However, in the performed study, after treatment with G and G-AuNPs, an increased apoptosis level was observed in A549 cells in the study. The activation of caspase-3 was facilitated by cytochrome c from the mitochondria into the cell's cytoplasm. As apoptosis is associated with decreased level of antiapoptotic protein Bcl-2 and a significantly increased levels of pro-apoptotic proteins Bad and Bax. Our findings depicted that the release of cytochrome c due to generation of high-level ROS might have triggered the apoptosis in G-treated cells. As a result, the use of G-AuNPs is an excellent strategy for delivering drugs directly into the nucleus without causing damage to DNA or enzymes required for DNA replication, which is critical for improving therapeutic delivery. Furthermore, the size and shape of G-AuNPs was also a responsible cause for smooth internalization into cells, making this cargo highly effective against lung cancer cells.
6 Conclusion
The performed study revealed a tremendous enhancement in antiglycation and anticancer potential of the herbal compound G post bioconjugation with AuNPs. Our findings depicted that G and G-AuNPs inhibited the formation of early glycation adducts, keto-amines, CC and HMF. The key findings of the performed study also depicted that G and G-AuNPs acted as potent blockers of arginine and lysine residues by blocking them from taking part in the glycation reaction. Additionally, G-AuNPs are proved to be a more potent inhibitor of the glycation process at much lower concentrations than pure G. Our findings validated that pure G significantly inhibited the α amylase enzyme activity, however, post bioconjugation with AuNPs (via G-AuNPs) almost negligible inhibition of α amylase enzyme activity was observed. Additionally in the performed study for cytotoxicity analysis and anticancer potential, G and G-AuNPs portrayed a significant anticancer potential when tested on human lung cancer A549 cell line, as G-AuNPs are negatively charged nano systems that can interact and mediate anionic endocytosis of nanoparticles. Our key findings of the anticancer study depicted that G-AuNPs (anionic) might have entered cells via micropinocytosis and caveolae-dependent endocytosis mechanisms during cellular uptake, however during their uptake clatherin pathway participation was ruled out due to the anionic charge of G-AuNPs. Our findings of the study also depicted that the size and shape of G-AuNPs was also a responsible cause for smooth internalization into cells, making this cargo highly effective against lung cancer cells.
Acknowledgement
The authors would like to thank the Researchers Supporting Project Number (RSP2023R35), King Saud University, Riyadh, Saudi Arabia.
Declaration of Competing Interest
The authors declare that they have no known competing financial interests or personal relationships that could have appeared to influence the work reported in this paper.
References
- Delafloxacin-Capped Gold Nanoparticles (DFX-AuNPs): An Effective Antibacterial Nano-Formulation of Fluoroquinolone Antibiotic. Materials. 2022;15(16):5709.
- [CrossRef] [Google Scholar]
- Ahmad, S., Khan, H., Shahab, U., Rehman, S., Rafi, Z., Khan, M. Y., Ansari, A., Siddiqui, Z., Ashraf, J. M., & Abdullah, S. M. 2017. Protein oxidation: an overview of metabolism of sulphur containing amino acid, cysteine. Front Biosci (Schol Ed), 9, 71–87.r.
- Ahmad, S., Yasir, M., Ra, Z., Khan, H., & Siddiqui, Z. 2017. Seminars in Cancer Biology Oxidation , glycation and glycoxidation — The vicious cycle and lung cancer. October. https://doi.org/10.1016/j.semcancer.2017.10.005.
- Physicochemical studies on glycation-induced structural changes in human IgG. IUBMB Life. 2012;64(2):151-156.
- [Google Scholar]
- Inhibitory effect of metformin and pyridoxamine in the formation of early, intermediate and advanced glycation end-products. PLoS One. 2013;8(9):e72128.
- [Google Scholar]
- Oxidation, glycation and glycoxidation—The vicious cycle and lung cancer. Semin. Cancer Biol.. 2018;49(July):29-36.
- [CrossRef] [Google Scholar]
- Bio-physical characterization of ribose induced glycation: a mechanistic study on DNA perturbations. Int. J. Biol. Macromol.. 2013;58:206-210.
- [Google Scholar]
- Cefotaxime Mediated Synthesis of Gold Nanoparticles: Characterization and Antibacterial Activity. Polymers. 2022;14(4):771.
- [Google Scholar]
- Alenazi, F., Saleem, M., Khaja, A. S. S., Zafar, M., Alharbi, M. S., Hagbani, T. Al, Ashraf, J. M., Qamar, M., Rafi, Z., & Ahmad, S. (n.d.). Metformin encapsulated gold nanoparticles (MTF-GNPs): A promising antiglycation agent. Cell Biochemistry and Function, n/a(n/a). https://doi.org/https://doi.org/10.1002/cbf.3738.
- A comparative antibacterial, antioxidant, and antineoplastic potential of rauwolfia serpentina (L.) leaf extract with its biologically synthesized gold nanoparticles (r-aunps) Plants. 2021;10(11):2278.
- [Google Scholar]
- Preferential recognition of Amadori-rich lysine residues by serum antibodies in diabetes mellitus: role of protein glycation in the disease process. Hum. Immunol.. 2009;70(6):417-424.
- [Google Scholar]
- Amadori glycated proteins: role in production of autoantibodies in diabetes mellitus and effect of inhibitors on non-enzymatic glycation. Aging Dis.. 2013;4(1):50.
- [Google Scholar]
- Inhibitory potential of herb, fruit, and fungal-enriched cheese against key enzymes linked to type 2 diabetes and hypertension. Innov. Food Sci. Emerg. Technol.. 2007;8(1):46-54.
- [Google Scholar]
- Size controlled gold nanoparticle formation by Avena sativa biomass: use of plants in nanobiotechnology. J. Nanopart. Res.. 2004;6(4):377-382.
- [Google Scholar]
- Recent advances in detection of AGEs: Immunochemical, bioanalytical and biochemical approaches. IUBMB Life. 2015;67(12):897-913.
- [Google Scholar]
- Optimization for synthesis of silver nanoparticles through response surface methodology using leaf extract of Boswellia sacra and its application in antimicrobial activity. Environ. Monit. Assess.. 2021;193(8):1-16.
- [Google Scholar]
- Sericin-functionalized GNPs potentiate the synergistic effect of levofloxacin and balofloxacin against MDR bacteria. Microb. Pathog.. 2020;104467
- [Google Scholar]
- The infra-red spectra of complex molecules. Springer Science & Business Media; 2013.
- Dynamic light scattering: with applications to chemistry. In: Biology, and Physics. Courier Corporation; 2000.
- [Google Scholar]
- Garcinol attenuates lipoprotein (A)-induced oxidative stress and inflammatory cytokine production in ventricular cardiomyocyte through α7-nicotinic acetylcholine receptor-mediated inhibition of the p38 mapk and nf-κb signaling pathways. Antioxidants. 2021;10(3):461.
- [Google Scholar]
- Dawadi, S., Katuwal, S., Gupta, A., Lamichhane, U., Thapa, R., Jaisi, S., Lamichhane, G., Bhattarai, D. P., & Parajuli, N. 2021. Current research on silver nanoparticles: Synthesis, characterization, and applications. Journal of Nanomaterials, 2021.
- Modulating enzymatic activity in the presence of gold nanoparticles. RSC Adv.. 2012;2(11):4736-4745.
- [Google Scholar]
- Mechanistic aspects of biosynthesis of silver nanoparticles by several Fusarium oxysporum strains. J. Nanobiotechnol.. 2005;3(1):8.
- [Google Scholar]
- Synthesis, characterization and antimicrobial activity of garcinol capped silver nanoparticles. J. Microbiol. Biotechnol.. 2019;29(11):1841-1851.
- [CrossRef] [Google Scholar]
- How toxic are gold nanoparticles? The state-of-the-art. Nano Research. 2015;8(6):1771-1799.
- [Google Scholar]
- Nuclease-resistant nucleic acid ligands to vascular permeability factor/vascular endothelial growth factor. Chem. Biol.. 1995;2(10):683-695.
- [Google Scholar]
- Applications of circular dichroism in protein and peptide analysis. TrAC Trends Anal. Chem.. 1999;18(4):236-244.
- [Google Scholar]
- Clinical applications of anticancer drugs targeted to topoisomerase II. Biochimica et Biophysica Acta (BBA)-Gene Structure and Expression. 1998;1400(1–3):173-184.
- [Google Scholar]
- An overview on genus garcinia: Phytochemical and therapeutical aspects. Phytochem. Rev.. 2011;10(3):325-351.
- [CrossRef] [Google Scholar]
- Ferulic acid dimer inhibits lipopolysaccharide-stimulated cyclooxygenase-2 expression in macrophages. In Vivo. 2005;19(5):849-853.
- [Google Scholar]
- The role of ganglioside GM1 in cellular internalization mechanisms of poly (amidoamine) dendrimers. Bioconjug. Chem.. 2009;20(8):1503-1513.
- [Google Scholar]
- Biogenic terbium oxide nanoparticles as the vanguard against osteosarcoma. Spectrochim. Acta A Mol. Biomol. Spectrosc.. 2016;168:123-131.
- [Google Scholar]
- Gold nanoconjugates reinforce the potency of conjugated cisplatin and doxorubicin. Colloids Surf. B Biointerfaces. 2017;160:254-264.
- [Google Scholar]
- Cisplatin bioconjugated enzymatic GNPs amplify the effect of cisplatin with acquiescence. Sci. Rep.. 2019;9(1):1-16.
- [Google Scholar]
- Glycation induced physicochemical changes in low-density lipoprotein and its role in promoting cholesterol accumulation in macrophages along with antiglycation effect of aminoguanidine. Advances in Biological Chemistry. 2015;5(05):203.
- [Google Scholar]
- Time-resolved and Steady-state Fluorescence Spectroscopic Studies of the Human Lens with Comparison to Argpyrimidine, Pentosidine and 3-OH-kynurenine¶. Photochem. Photobiol.. 2002;76(5):549-554.
- [Google Scholar]
- Improved efficiency and stability of secnidazole–An ideal delivery system. Saudi Journal of Biological Sciences. 2015;22(1):42-49.
- [Google Scholar]
- A review on nanotechnology: Properties, applications, and mechanistic insights of cellular uptake mechanisms. J. Mol. Liq.. 2021;118008
- [Google Scholar]
- Engineering of self-assembled nanoparticle platform for precisely controlled combination drug therapy. Proc. Natl. Acad. Sci.. 2010;107(42):17939-17944.
- [Google Scholar]
- Synthesis of gold nanoparticles using Garcinia indica fruit rind extract. Int. J. Nanosci.. 2016;15(05n06):1660015.
- [Google Scholar]
- SERS studies on the structure of thioglycolic acid monolayers on silver and gold. Surf. Sci.. 2003;532:227-232.
- [Google Scholar]
- Biocompatibility and cytotoxicity of gold nanoparticles: Recent advances in methodologies and regulations. Int. J. Mol. Sci.. 2021;22(20)
- [CrossRef] [Google Scholar]
- Garcinol: current status of its anti-oxidative, anti-inflammatory and anti-cancer effects. Cancer Lett.. 2015;362(1):8-14.
- [Google Scholar]
- Formation and stabilization of gold nanoparticles in bovine serum albumin solution. Molecules. 2019;24(18)
- [CrossRef] [Google Scholar]
- Antiglycative effect of fruit and vegetable seed extracts: inhibition of AGE formation and carbonyl-trapping abilities. J. Sci. Food Agric.. 2013;93(8):2037-2044.
- [Google Scholar]
- Fungus-mediated synthesis of silver nanoparticles and their immobilization in the mycelial matrix: a novel biological approach to nanoparticle synthesis. Nano Lett.. 2001;1(10):515-519.
- [Google Scholar]
- Gold nanoparticle surface functionalization: a necessary requirement in the development of novel nanotherapeutics. Nanomedicine. 2015;10(8):1315-1326.
- [Google Scholar]
- Padhye, S., Ahmad, A., Oswal, N., & Sarkar, F. H. 2009. Emerging role of Garcinol , the antioxidant chalcone from Garcinia indica Choisy and its synthetic analogs. 13, 1–13. https://doi.org/10.1186/1756-8722-2-38.
- UV–vis. spectroscopic characteristics of ferulic acid and related compounds. J. Wood Chem. Technol.. 2002;22(2–3):137-146.
- [Google Scholar]
- FT-IR and FT-Raman studies on 3-aminophthalhydrazide and N-aminophthalimide. Turk. J. Chem.. 2002;26(3):323-334.
- [Google Scholar]
- Extensive surface studies help to analyse zeta potential data: the case of cationic emulsions. Chem. Phys. Lipids. 2004;131(1):1-13.
- [Google Scholar]
- 2’-Deoxyribose mediated glycation leads to alterations in BSA structure via generation of carbonyl species. Current Protein & Peptide Science; 2020.
- Glycation-assisted synthesized gold nanoparticles inhibit growth of bone cancer cells. Colloids Surf B Biointerfaces.. 2013;1(117):473-479.
- [Google Scholar]
- Studies on interaction of colloidal Ag nanoparticles with bovine serum albumin (BSA) Colloids Surf. B Biointerfaces. 2010;76(1):32-37.
- [Google Scholar]
- Effect of non-enzymatic glycosylation in the epigenetics of cancer. Semin. Cancer Biol. 2020
- [Google Scholar]
- Rosangkima, G., & Prasad, S. B. 2004. Antitumour activity of some plants from Meghalaya and Mizoram against murine ascites Dalton’s lymphoma.
- Doxorubicin-conjugated bisphosphonate nanoparticles for the therapy of osteosarcoma. JSM Nanotechnol Nanomed. 2014;1022:2.
- [Google Scholar]
- Saadat, N., & Gupta, S. V. 2012. Potential Role of Garcinol as an Anticancer Agent. 2012. https://doi.org/10.1155/2012/647206.
- Chemical studies on antioxidant mechanism of garcinol: analysis of radical reaction products of garcinol with peroxyl radicals and their antitumor activities. Tetrahedron. 2002;58(51):10095-10102.
- [Google Scholar]
- Alginate as an antiglycating agent for human serum albumin. Int. J. Biol. Macromol.. 2007;41(2):180-184.
- [Google Scholar]
- Geranium leaf assisted biosynthesis of silver nanoparticles. Biotechnol. Prog.. 2003;19(6):1627-1631.
- [Google Scholar]
- Rapid synthesis of Au, Ag, and bimetallic Au core–Ag shell nanoparticles using Neem (Azadirachta indica) leaf broth. J. Colloid Interface Sci.. 2004;275(2):496-502.
- [Google Scholar]
- Ethnomedicinal plants for prevention and treatment of tumours. International Journal of Green Pharmacy. 2009;3(1):2.
- [Google Scholar]
- Amadori product and age formation during nonenzymatic glycosylation of bovine serum albumin in vitro. J Biochem Mol Biol Biophys. 2002;6(4):233-242.
- [Google Scholar]
- Inhibitory effect of aqueous extract from the gall of Rhus chinensis on alpha-glucosidase activity and postprandial blood glucose. J. Ethnopharmacol.. 2003;85(2–3):283-287.
- [Google Scholar]
- d-Ribose induced glycoxidative insult to hemoglobin protein: an approach to spot its structural perturbations. Int. J. Biol. Macromol.. 2018;112:134-147.
- [Google Scholar]
- A sensitive fluorometric method for the determination of arginine using 9, 10-phenanthrenequinone. Anal. Biochem.. 1978;90(1):246-255.
- [Google Scholar]
- Gold nanoparticles conjugated with cisplatin/doxorubicin/capecitabine lower the chemoresistance of hepatocellular carcinoma-derived cancer cells. J. Gastrointestin. Liver Dis.. 2012;21(2)
- [Google Scholar]
- In vitro cytotoxicity and phototoxicity of surface-modified gold nanoparticles associated with neutral red as a potential drug delivery system in phototherapy. Mater. Sci. Eng. C. 2016;65:199-204.
- [Google Scholar]
- Effect of surface properties on nanoparticle–cell interactions. Small. 2010;6(1):12-21.
- [Google Scholar]
- Spectroscopic analysis of cinnamic acid using quantum chemical calculations. Spectrochimica Acta - Part A: Molecular and Biomolecular Spectroscopy. 2015;136(PB):808-817.
- [CrossRef] [Google Scholar]
- Wang, X., Li, X., & Chen, D. 2011. Evaluation of antioxidant activity of isoferulic acid in vitro. Natural Product Communications, 6(9), 1934578X1100600919.
- Paclitaxel and etoposide co-loaded polymeric nanoparticles for the effective combination therapy against human osteosarcoma. J. Nanobiotechnol.. 2015;13(1):22.
- [Google Scholar]
- Biochemical studies of in vitro glycation of human DNA. Asian J Biomed Pharma Sci. 2012;2:23-27.
- [Google Scholar]
- Characterization of human glycated DNA modified with peroxynitrite. Helix-The Scientific Explorer. 2013;2(6):221-225.
- [Google Scholar]
- Uptake mechanisms of non-viral gene delivery. J. Control. Release. 2012;158(3):371-378.
- [Google Scholar]
- Doxorubicin-loaded carborane-conjugated polymeric nanoparticles as delivery system for combination cancer therapy. Biomacromolecules. 2015;16(12):3980-3988.
- [Google Scholar]
- Yamaguchi, F., Ariga, T., Yoshimura, Y., & Nakazawa, H. 2000. Antioxidative and Anti-Glycation Activity of Garcinol from Garcinia indica Fruit Rind. 180–185.
- Co-delivery of doxorubicin and curcumin by pH-sensitive prodrug nanoparticle for combination therapy of cancer. Sci. Rep.. 2016;6(1):1-12.
- [Google Scholar]


