

Genetic variability for salinity tolerance of tomato (Solanum lycopersicon MILL.) genotypes determined by stress tolerance indices
⁎Corresponding authors at: Department of Plant Breeding and Genetics, Ghazi University, Dera Ghazi Khan 32200, Pakistan (A. Hussain). College of Biological and Pharmaceutical Engineering, West Anhui University, Lu’an 237012, China (C. Song). ahussain@gudgk.edu.pk (Ansar Hussain), lanniao812329218@163.com (Cheng Song)
-
Received: ,
Accepted: ,
This article was originally published by Elsevier and was migrated to Scientific Scholar after the change of Publisher.
Abstract
Background
Tomato is an important vegetable crop; however, salinity hampers its growth and yield-related traits. Different tomato genotypes significantly differ in their salinity tolerance; thus, selecting the tolerant genotypes could improve yield and productivity under saline environments.
Methods
This study investigated salinity tolerance of five tomato genotypes, i.e., ‘Pakit’, ‘Riogrande’, ‘Roma’, ‘Continental’, and ‘Nagina’ under 0-, 100-, 150- and 200-mM salinity levels. Data relating yield-related traits (plant height, shoot fresh and dry weights, number of fruits per plant, single fruit weight and fruit yield per plant) and nine different stress tolerance indices were employed to infer salinity-tolerance of the genotypes.
Results
Increasing salinity levels negatively affected the yield-related traits of genotypes; however, genotypes exhibited varied tolerance to salinity. The better and the poor yield-related traits were noted under 0- and 200-mM salinity levels, respectively. Similarly, genotypes ‘Pakit’ and ‘Nagina’ recorded the highest and the lowest values of yield-related traits. The genotype ‘Pakit’ proved the most tolerant to tested salinity levels compared to the rest of the genotypes. The ‘Pakit’ genotypes had the highest stress tolerance index (0.19, 1.06 and 1.79) and the lowest relative change in yield (6.00, 32.59, and 55.75%) under all salinity levels. Principal component analysis biplot revealed that ‘Pakit’ genotypes had superior yield traits and tolerance indices.
Conclusion
The genotype ‘Pakit’ exhibited a higher level of salinity tolerance (6 % yield reduction under 100 mM salinity compared to 27.67 % reduction in ‘Nagina’ genotype. Therefore, genotype ‘Pakit’ can be recommended for cultivation on low to moderate saline soils without significant yield losses. On the other hand, ‘Nagina’ genotype proved the most sensitive to salinity (27.67 %, 56.79 %, and 68.90 % yield reduction under 100-, 150-, and 200-mM salinity, respectively). Therefore, this genotype should not be cultivated on saline soils.
Keywords
Genotypes
Genetic variability
Salinity
Tomato
Stress tolerance indices

1 Introduction
Salinity is a global issue in crop production as 20 % and 33 % of cultivated and irrigated areas are negatively affected by adverse impacts of salt stress. Nevertheless, it is predicted that >50 % of the global soils would become saline by 2050 because of rock weathering, irrigation with brackish water, climate change, and intensive agricultural practices. Soil salinization renders 1.5 million hectares of agricultural land unproductive annually. Global annual costs of soil salinization amount to US $ 31 million because of decrease in agricultural productivity (FAO, 2022; Zhao et al., 2020). Increasing soil salinity caused by inadequate soil moisture, irrigation with brackish water, and intensive agricultural practices is a significant challenge in global crop production and food security (Guo et al., 2022; Kiferle et al., 2022). It is inevitable to sustain crop yields under increasing salinity to feed the rapidly growing global population (Butcher et al., 2016).
Tomato (Solanum lycopersicum L.) is an important vegetable crop with global cultivation and uses (Guo et al., 2022; Roșca et al., 2023). The fruits are consumed fresh and in cooked forms (Reimers and Keast, 2016). Moreover, it serves as a model organism for the investigation of tolerance to abiotic stresses (Roșca et al., 2023; Rothan et al., 2019). Tomato has a modest degree of salt sensitivity throughout its growth and developmental (Rothan et al., 2019). While wild progenitors of tomatoes have effectively acclimated to very salty coastal regions, cultivated varieties have lost their ability to tolerate salt stress (Guo et al., 2022). This renders them vulnerable to the deleterious consequences of salt stress. Tomato plants are highly sensitive to salinity during germination and seedling stages, and roots are the most vulnerable to elevated salt levels (Foolad, 2004). Salinity decreases tomato seed germination and prolong the germination process (Tanveer et al., 2020). Tomato plants exhibit an increased uptake of sodium (Na+) and chloride ions (Cl–), while experiencing a drop in the levels of potassium ions (K+) and calcium ions (Ca2+). This disruption in ion homeostasis adversely affects the plants (Parvin et al., 2019). However, it is possible to restore the equilibrium of ions by rescuing the seedlings from the effects of salinity stress.
Promising cultivars/traits have been identified for the development of salt-tolerant cultivars (Abdeldym et al., 2020; Diouf et al., 2018; Eynizadeh et al., 2023; Ladewig et al., 2021; Parvin et al., 2019; Singh et al., 2012; Tandra et al., 2022). It is imperative to screen and assess multiple genotypes for their salt tolerance to mitigate the adverse impacts of salinity stress (Ladewig et al., 2021; Tandra et al., 2022). Tomato genotypes that exhibit resistance to soil salinity share many morpho-physiological and molecular traits, including antioxidant response, ion concentrations, tissue tolerance, and nutrient absorption (Diouf et al., 2018; Ladewig et al., 2021; Tandra et al., 2022). It is important to acquire knowledge on these traits and effectively use them to develop tomato genotypes with enhanced salt tolerance.
The selection of superior cultivars and their characteristics relies on genetic variability (Rasheed et al., 2023). Öztürk (2022) investigated variability among 24 tomato cultivars over a wide range of physical characteristics. The tested genotypes exhibited significant variations for physical characteristics such fruit length and width, genotype. Similarly, 589 distinct tomato accessions were tested for their genetic diversity in fruit morphology (Marefatzadeh-Khameneh et al., 2021). Significant genetic variation in fruit breadth was noted among the tomato varieties. The rich genetic variation seen in tomatoes might be valuable to breeders. These examples suggest that genetic diversity may form the basis of a breeding program targeted at developing high-yield genotypes.
Stress tolerance indices (STIs) are crucial for evaluating genotypic response to salinity stress (Pour-Aboughadareh et al., 2019). The STIs help to assess the performance of various genotypes under saline environments (Choudhury et al., 2023). Genotype assessment under abiotic stresses is essential for breeding initiatives aimed at improving salinity tolerance (Abdeldym et al., 2020; Eynizadeh et al., 2023). The STIs, particularly salinity tolerance index (STI) and other important physiological traits are crucial for evaluating and enhancing the ability of crops to tolerate salinity.
A significant proportion of agricultural land in Pakistan is adversely affected by soil salinity. The issue of surface salinity is a significant challenge for an extensive area of over 2.5 million hectares of irrigated land in the country (Syed et al., 2021). The impact of salinity on the uptake of plant nutrients, crop development, and productivity has significant implications for the agricultural economy and food security in the country (Malik et al., 2021). Pakistan produces 4.2 million tons tomato annually. However, the average yield is low compared to the other countries in the world. The use of tolerant cultivars to abiotic stresses can help in improving the yield and overall productivity. This study investigated the salinity tolerance of different tomato genotypes. It was hypothesized that the genotypes will exhibit significant variation for salinity tolerance. The results would help to select the tolerant genotype for cultivation under saline soils.
2 Materials and Methods
2.1 Treatments
The current study was conducted in a wire house under natural conditions. Free draining (8.8-liter capacity pots) filled with 5 kg soil were used to grow the plants in natural conditions. Soil was collected from nearby fields with no salinity. The soil had a loam texture, slightly basic pH, low organic matter, non-saline and 35 % saturation. Four different salinity levels, i.e., 0-, 100-, 150- and 200-mM (representative of the salinity range in Pakistani soils) were included in the study. Similarly, five frequently grown tomato genotypes in the country, i.e., ‘Pakit’, ‘Riogrande’, ‘Roma’, ‘Continental’, and ‘Nagina’ were included in the study. The seeds of the tested genotypes were procured from the local market and incubated in a growth chamber at 30 °C for a duration of one week. The seeds were transferred to plastic trays One week after germination. Ten-day old seedlings were transplanted in pots (3 initially, which were reduced to 1 after seedling establishment). The seedlings were irrigated and fertilized according to the regional recommendations. Salinity (NaCl) was imposed 10 days after seedling establishment by slowly applying the saline solution to the pots. Salinity levels were slowly raised to avoid any sudden shock to plants and afterwards pots were irrigated with normal water. Each treatment had 4 replications and each replication consisted of 5 pots. The experiment was laid out according to factorial design where salinity levels were regarded as main factor, whereas the genotypes were taken as sub-factor.
2.2 Data collection
Data relating to plant height, shoot fresh and dry weights, number of fruits per plant, single fruit weight and fruit yield per plant was collected at maturity. The heights were measured from all plants in all replications and averaged for different replications separately. For dry matter production, plants in each replication were harvested after collecting and counting the fruits. The harvested plant shoots were weighed for fresh biomass production and dried in an oven at 70 ± 5 °C for 72 h. The dried shoots were weighed to record dry biomass production. The number of fruits present on each plant were counted separately and weighed to record the number of fruits per plant, single fruit weight and fruit yield per plant.
Nine different tolerance indices, i.e., tolerance index (TOL), mean productivity (MP), geometric mean productivity (GMP), harmonic mean (HM), stress susceptibility index (SSI), stress tolerance index (STI), yield index (YI), yield stability index (YSI), and relative stress index (RSI) were computed for each salinity level by using the yield data. The formulas to compute these indices are given in equations (1)–(9). (Rosielle and Hamblin, 1981); (Rosielle and Hamblin, 1981); (Fernandez, 1992); (Bidinger et al., 1987); (Fischer and Maurer, 1978); (Fernandez, 1992); (Gavuzzi et al., 1997); (Bouslama and Schapaugh, 1984); (Fischer and Wood, 1979).
In the equations, Yp = fruit yield under non-stressed conditions, Ys = fruit yield under stressed conditions. Similarly, Ýp and Ýs re the mean yield of all varieties under normal and heat stress conditions, respectively. The indices were computed on iPASTIC (Pour-Aboughadareh et al., 2019).
2.3 Data analysis
Two-way analysis of variance (ANOVA) (Steel et al., 1997) was used to record the significant individual and interactive effects of salinity levels and genotypes. Similarly, one-way ANOVA was used to analyze the stress tolerance indices for each salinity level, respectively. Least significant difference test at 95 % probability was used to separate the means where ANOVA indicated significance. Principal component analysis was conducted to make the interpretation easier. All computations were done on XLSTAT statistical software (Vidal et al., 2020).
3 Results
Salinity levels and genotypes exerted significant effects on all yield-related traits recorded in the current study (Table 1). The genotype ‘Pakit’ produced the tallest plants (122.40 cm), heaviest shoots (178.31 g), and greatest fruits per plant (17.50). Furthermore, genotypes ‘Riogrande’ and ‘Roma’ followed the genotype ‘Pakit’ in this regard. Nevertheless, ‘Continental’ and ‘Nagina’ performed poorly for these attributes (Table 2). Salinity reduced plant height, shoot fresh and dry weights, fruit yield, single fruit weight, and number of fruits per plant and the lowest values of these traits were recorded under 200 mM salinity level. The plants exhibited healthy growth and high fruit production under 0 mM salinity (Table 2).
| Source of variation | DF | Sum of squares | Mean squares | F value | P value |
|---|---|---|---|---|---|
| Plant height | |||||
| Genotype (G) | 4 | 4261.19 | 1065.29 | 588.30 | 0.0001 |
| Salinity levels (S) | 3 | 7520.46 | 2506.82 | 1384.37 | 0.0001 |
| G×S | 12 | 222.46 | 18.53 | 10.23 | 0.0001 |
| Shoot fresh weight | |||||
| Genotype (G) | 4 | 13424.90 | 3356.22 | 664.07 | < 0.0001 |
| Salinity levels (S) | 3 | 65654.87 | 21884.96 | 4330.20 | < 0.0001 |
| G×S | 12 | 200.40 | 16.70 | 3.30 | 0.002 |
| Shoot dry weight | |||||
| Genotype (G) | 4 | 606.14 | 151.53 | 411.73 | < 0.0001 |
| Salinity levels (S) | 3 | 3737.46 | 1245.82 | 3384.96 | < 0.0001 |
| G×S | 12 | 30.15 | 2.51 | 6.83 | < 0.0001 |
| Fruit yield per plant | |||||
| Genotype (G) | 4 | 4.28 | 1.07 | 1263.53 | < 0.0001 |
| Salinity levels (S) | 3 | 32.16 | 10.72 | 12662.83 | < 0.0001 |
| G×S | 12 | 0.63 | 0.05 | 62.01 | < 0.0001 |
| Single fruit weight | |||||
| Genotype (G) | 4 | 0.011 | 0.003 | 43.142 | < 0.0001 |
| Salinity levels (S) | 3 | 0.014 | 0.005 | 72.545 | < 0.0001 |
| G×S | 12 | 0.002 | 0.000 | 3.210 | 0.003 |
| Number of fruits per plant | |||||
| Genotype (G) | 4 | 465.90 | 116.48 | 268.79 | < 0.0001 |
| Salinity levels (S) | 3 | 891.65 | 297.22 | 685.88 | < 0.0001 |
| G×S | 12 | 20.10 | 1.67 | 3.87 | 0.001 |
Here, DF=degree of freedom, the bold values in the P value column denote that the individual and interactive effects of genotypes and salinity levels significantly affected the respective trait.
| Genotypes | Plant height (cm) |
Shoot fresh weight (g) |
Shoot dry weight (g) |
Fruit yield (kg plant−1) |
Single fruit weight (g) |
Number of fruits per plant |
|---|---|---|---|---|---|---|
| Genotypes | ||||||
| Pakit | 122.40 a | 178.31 a | 29.15 a | 2.45 a | 130c | 17.50 a |
| Riogrande | 117.93b | 155.61b | 25.00b | 2.12b | 140c | 14.75b |
| Roma | 106.30c | 148.11c | 22.82c | 1.90c | 140c | 13.08c |
| Continental | 99.49 d | 141.65 d | 21.01 d | 1.80 d | 160b | 11.00 d |
| Nagina | 106.10c | 134.92 e | 20.36 e | 1.70 e | 170 a | 9.58 e |
| Salinity levels | ||||||
| 0 mM | 124.75 a | 190.08 a | 33.48 a | 2.97 a | 163b | 18.60 a |
| 100 mM | 115.59b | 167.73b | 28.08b | 2.37b | 169 a | 14.33b |
| 150 mM | 107.08c | 148.72c | 20.57c | 1.60c | 138c | 11.80c |
| 200 mM | 94.35 d | 100.34 d | 12.54 d | 1.05 d | 134c | 8.00 d |
Means followed by different letters within a column are statistically different from each other.
The interactive effect of genotypes × salinity indicated that the highest plant height was recorded for genotype ‘Pakit’ under 0 mM salinity, whereas ‘Continental’ genotype under 200 mM salinity recorded the lowest plant height. The plant height in genotype ‘Pakit’ was reduced by 6.45 %, 10.96 %, and 18.36 % with each increased salinity level (Fig. 1). Similarly, plant height of ‘Continental’ genotypes was reduced by 7.18 %, 13.48 %, and 27.74 % under each increasing salinity level. Likewise, genotype ‘Nagina’ observed 10.24 %, 19.24 %, and 28.75 % decrease in plant height under increasing salinity levels. In the same way, plant height of ‘Riogrande’ genotype was declined by 4.84 %, 10.47 %, and 19.87 % with stepwise increase in salinity levels. Similarly, the plant height of the ‘Roma’ genotype exhibited a reduction of 8.19 %, 17.05 %, and 28.14 % when subjected to increasing salt levels (Fig. 1).
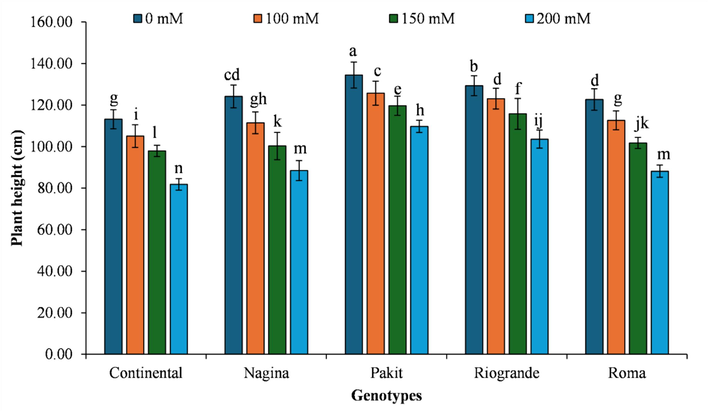
- The impact of genotypes by salinity levels interaction on plant height of different tomato genotypes included in the study. The column indicates the means, whereas the error bars present standard errors of the means (n = 4). The means with different letters are statistically different from each other (LSD=2.22).
The genotype ‘Nagina’ exhibited the lowest fresh biomass production when subjected to a salt concentration of 200 mM. Conversely, the genotype ‘Pakit’ produced the highest fresh biomass under salinity-free conditions. The increase in salinity level decreased fresh biomass production of genotype ‘Pakit’ by 10.85 %, 18.89 %, and 39.55 %, respectively. Likewise, genotype ‘Continental’ exhibited reductions in fresh biomass production by 11.05 %, 22.45 %, and 50.10 %, under each increase in the salinity level. In the same manner, the exposure of increasing salt concentrations to ‘Nagina’ genotype exhibited reductions in fresh biomass production to 11.41 %, 23.71 %, and 51.23 %, respectively. In the same manner, increasing salinity levels reduced fresh biomass production of ‘Riogrande’ genotype by 14.95 %, 22.5 %, and 48.76 %, respectively. Likewise, ‘Roma’ genotype exhibited a reduction in fresh biomass production by 10.39 %, 21.79 % and 47.95 %, respectively (Fig. 2).
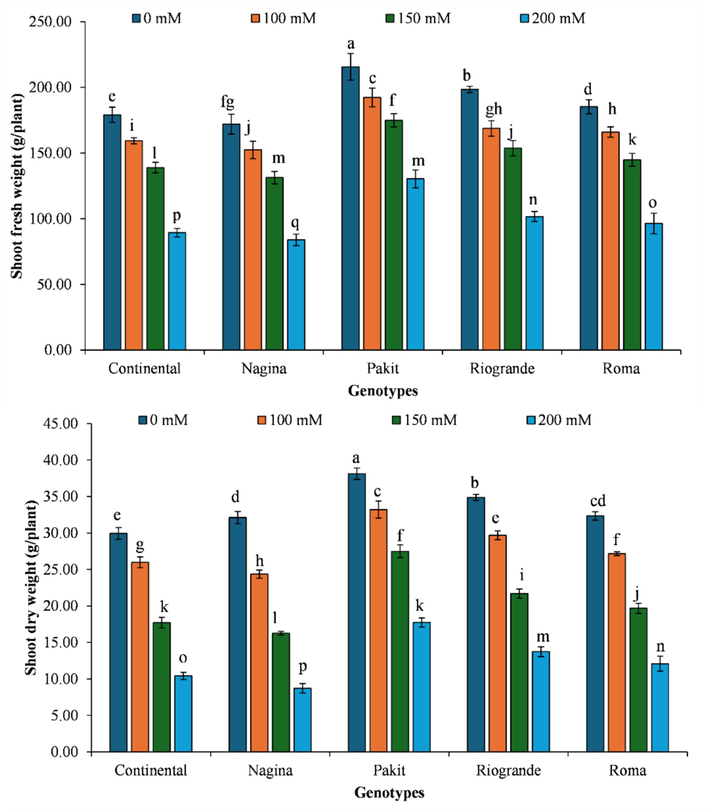
- The impact of genotypes by salinity levels interaction on dry matter production of different tomato genotypes included in the study. The column indicates the means, whereas the error bars present standard errors of the means (n = 4). The means with different letters are statistically different from each other (LSD for shoot fresh weight = 3.71, LSD for shoot dry weight = 1.01).
The ‘Nagina’ genotype exhibited the lowest dry biomass production under salt concentration of 200 mM. In contrast, the genotype ‘Pakit’ exhibited the highest dry biomass production under salinity-free conditions. The dry biomass production of the ‘Pakit’ genotype exhibited a decrease of 12.85 %, 27.86 %, and 53.44 % with each rise in salinity level. The genotype ‘Continental’ exhibited a decrease in dry biomass production of 13.21 %, 40.85 %, and 65.19 % under increasing salinity levels. The ‘Nagina’ genotype exhibited a reduction in dry biomass production of 24.17 %, 49.39 %, and 72.86 % with each increased salinity level. In the same manner, the ‘Riogrande’ genotype had a decrease in dry biomass production of 14.90 %, 37.76 %, and 60.59 % when exposed to increasing salinities. Meanwhile, ‘Roma’ genotype observed reduction in dry biomass by 16.01 %, 39.12 %, and 62.64 % with each increased salinity level (Fig. 2).
The genotype ‘Nagina’ produced the lowest number of fruits per plant when exposed to a salt concentration of 200 mM. Conversely, genotype ‘Pakit’ produced the highest number of fruits under no salinity. The genotype ‘Pakit’ exhibited a decrease in number of fruits per plant by 15.94 %, 27.54 %, and 52.17 % under increasing salinity levels. The genotype ‘Continental’ exhibited a sequential decline in number of fruits per plant by 30.00 %, 44.00 %, and 62.00 % when subjected increasing salinity. In the case of the ‘Nagina’ genotype, exposure to stepwise increase in salinity reduced number of fruits per plant by 29.55 %, 47.73 %, and 61.36 %, respectively. Similarly, ‘Riogrande’ genotype exhibited a reduction in number of fruits per plant of 19.67 %, 32.79 %, and 57.38 % when exposed to increasing salinities. In a similar way, the ‘Roma’ genotype exhibited a decline in number of fruits per plant by 23.64 %, 36.36 %, and 54.55 % under elevated salt levels (Fig. 3).
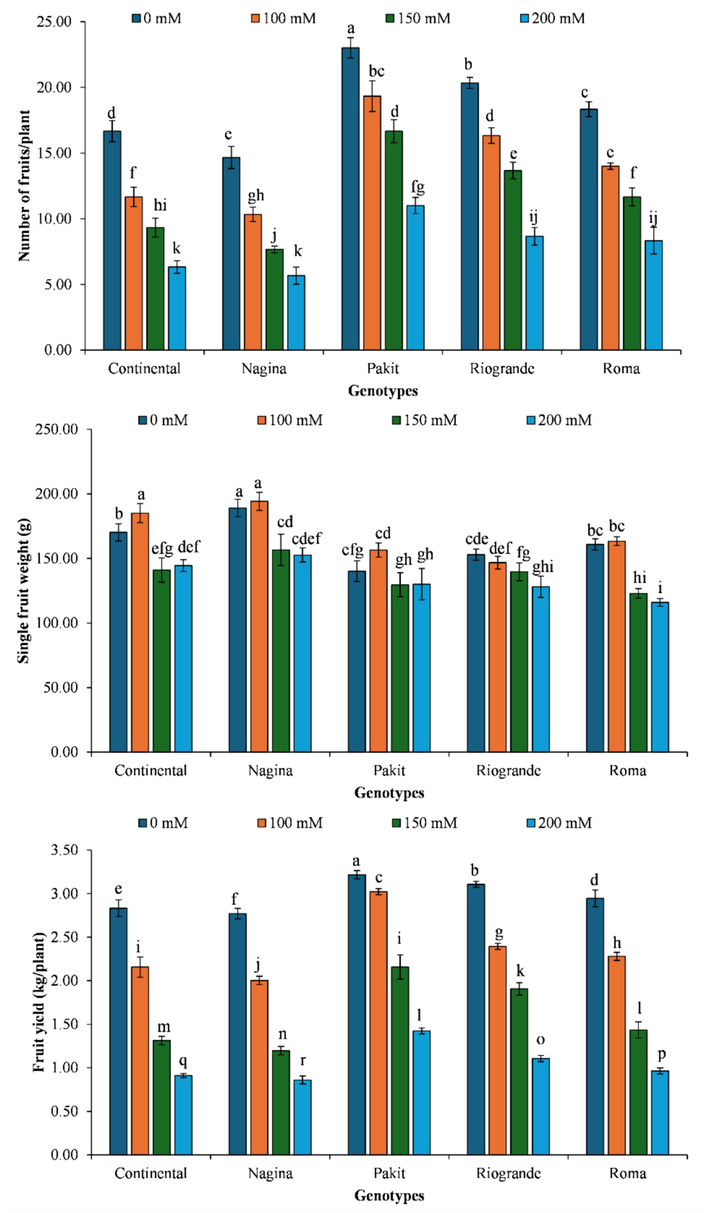
- The impact of genotypes by salinity levels interaction on number of fruits per plant, single fruit weight and fruit yield per plant of different tomato genotypes included in the study. The column indicates the means, whereas the error bars present standard errors of the means (n = 4). The means with different letters are statistically different from each other (LSD for number of fruits per plant = 1.08, LSD for single fruit weight = 0.013, LSD for fruit yield = 0.048).
The cultivar ‘Nagina’ produced the lowest fruit yield per plant under 200 mM. However, ‘Pakit’ genotype exhibited the highest fruit yield under salinity-free environment. The ‘Pakit’ genotype observed a decrease in fruit yield per plant by 6.01 %, 32.95 %, and 55.75 % with each increasing salinity level. The genotype ‘Continental’ exhibited 23.88 %, 53.65 %, and 67.88 % decline in fruit production with increasing salinity treatments. The ‘Nagina’ genotype exhibited a reduction in fruit production per plant by 27.68 %, 56.80 %, and 68.95 % under increasing salt levels. In a similar manner, ‘Riogrande’ genotype plants exhibited a reduction in fruit yield per plant by 22.96 %, 38.63 %, and 64.38 %, respectively. Likewise, ‘Roma’ genotype observed a decrease in fruit production per plant by 22.62 %, 51.36 %, and 67.31 % when exposed to increasing salt concentrations o (Fig. 3).
The tolerance indices indicated that genotype ‘Pakit’ had the lowest relative change in yield, whereas genotype ‘Nagina’ recorded the highest relative change in yield under all salinity levels. Similarly, genotype ‘Pakit’ had the highest TOL (lower values denote better tolerance), whereas the lowest TOL was noted for ‘Nagina’ genotype under all salinity levels. The genotype ‘Pakit’ observed the highest values for MP, GMP, HM, STI, YSI and RSI, whereas had the lowest value for SSI. These indices denote that the ‘Pakit’ genotype has higher tolerance and less susceptibility to applied stress levels (Table 3).
| Genotypes | Stress tolerance indices | |||||||||||
|---|---|---|---|---|---|---|---|---|---|---|---|---|
| Yp | Ys | RC | TOL | MP | GMP | HM | SSI | STI | YI | YSI | RSI | |
| 100 mM Salinity | ||||||||||||
| Pakit | 3.21 a | 3.02 a | 6.00c | 0.19c | 3.12 a | 3.11 a | 3.11 a | 0.29c | 1.09 a | 1.27 a | 0.94 a | 1.17 a |
| Riogrande | 3.10b | 2.39b | 22.96b | 0.71b | 2.75b | 2.72b | 2.70b | 1.13b | 0.84b | 1.00b | 0.77b | 0.96b |
| Roma | 2.94c | 2.28c | 22.62b | 0.66b | 2.61c | 2.59c | 2.57c | 1.11b | 0.75c | 0.96c | 0.77b | 0.97b |
| Continental | 2.83 d | 2.15 d | 23.88b | 0.67b | 2.49 d | 2.47 d | 2.44 d | 1.17b | 0.69 d | 0.90 d | 0.76b | 0.95b |
| Nagina | 2.77 e | 2.00 e | 27.67 a | 0.76 a | 2.38 e | 2.35 e | 2.32 e | 1.36 a | 0.62 e | 0.84 e | 0.73c | 0.90c |
| LSD 0.05 | 0.057 | 0.050 | 1.54 | 0.049 | 0.047 | 0.048 | 0.048 | 0.076 | 0.027 | 0.021 | 0.015 | 0.019 |
| 150 mM Salinity | ||||||||||||
| Pakit | 3.21 a | 2.15 a | 32.95 e | 1.06 d | 2.68 a | 2.63 a | 2.58 a | 0.71 e | 0.78 a | 1.34 a | 0.67 a | 1.24 a |
| Riogrande | 3.10b | 1.90b | 38.62 d | 1.20c | 2.50b | 2.43b | 2.36b | 0.83 d | 0.66b | 1.19b | 0.61b | 1.14b |
| Roma | 2.94c | 1.43c | 51.36c | 1.51b | 2.19c | 2.05c | 1.92c | 1.11c | 0.47c | 0.89c | 0.48c | 0.90c |
| Continental | 2.83 d | 1.31 d | 53.64b | 1.52b | 2.07 d | 1.92 d | 1.79 d | 1.16b | 0.42 d | 0.82 d | 0.46 d | 0.86 d |
| Nagina | 2.77 e | 1.19 e | 56.79 a | 1.57 a | 1.98 e | 1.82 e | 1.67 e | 1.23 a | 0.37 e | 0.74 e | 0.43 e | 0.80 e |
| LSD 0.05 | 0.057 | 0.068 | 1.611 | 0.049 | 0.058 | 0.061 | 0.065 | 0.035 | 0.032 | 0.043 | 0.016 | 0.029 |
| 200 mM Salinity | ||||||||||||
| Pakit | 3.21 a | 1.42 a | 55.75 d | 1.79 d | 2.32 a | 2.14 a | 1.97 a | 0.86 d | 0.51 a | 1.35 a | 0.44 a | 1.25 a |
| Riogrande | 3.10b | 1.10b | 64.37c | 2.00 a | 2.10b | 1.85b | 1.63b | 0.99c | 0.38b | 1.05b | 0.35b | 1.00b |
| Roma | 2.94c | 0.96c | 67.29b | 1.98 ab | 1.95c | 1.68c | 1.45c | 1.04b | 0.32c | 0.91c | 0.32c | 0.92c |
| Continental | 2.83 d | 0.91 d | 67.87 ab | 1.92 bc | 1.87 d | 1.60 d | 1.37 d | 1.05 ab | 0.29 d | 0.86 d | 0.32 cd | 0.90 cd |
| Nagina | 2.77 e | 0.86 e | 68.90 a | 1.91c | 1.81 e | 1.54 e | 1.31 e | 1.06 a | 0.26 e | 0.81 e | 0.31 d | 0.87 d |
| LSD 0.05 | 0.057 | 0.028 | 1.312 | 0.071 | 0.027 | 0.024 | 0.030 | 0.020 | 0.010 | 0.027 | 0.013 | 0.037 |
Yp = fruit yield under non-stressed conditions, Ys = fruit yield under stressed conditions, RC=relative change in the fruit yield due to stress, TOL=tolerance index, MP=mean productivity, GMP=geometric mean productivity, HM=harmonic mean, SSI=stress susceptibility index, STI=stress tolerance index, YI=yield index, YSI=yield stability index, and RSI=relative stress index. The means followed by different lowercase letters are statistically different from each other.
Principal component analysis (PCA) indicated that first two principal components explained > 96 % variability in the data under all salinity levels. The PCA divided the genotypes into two groups under all salinity levels. The first group contained all the stress tolerance indices whereas the second group contained stress susceptibility indices. Hence, the first group contained salinity-tolerant, whereas the second group contained the susceptible genotypes. Thus, ‘Pakit’ and ‘Riogrande’ are tolerant to salinity with better stress tolerance indices, whereas ‘Nagina’, ‘Continental’, and ‘Roma’ are susceptible to salinity (Fig. 4a, 4b, and 4c).
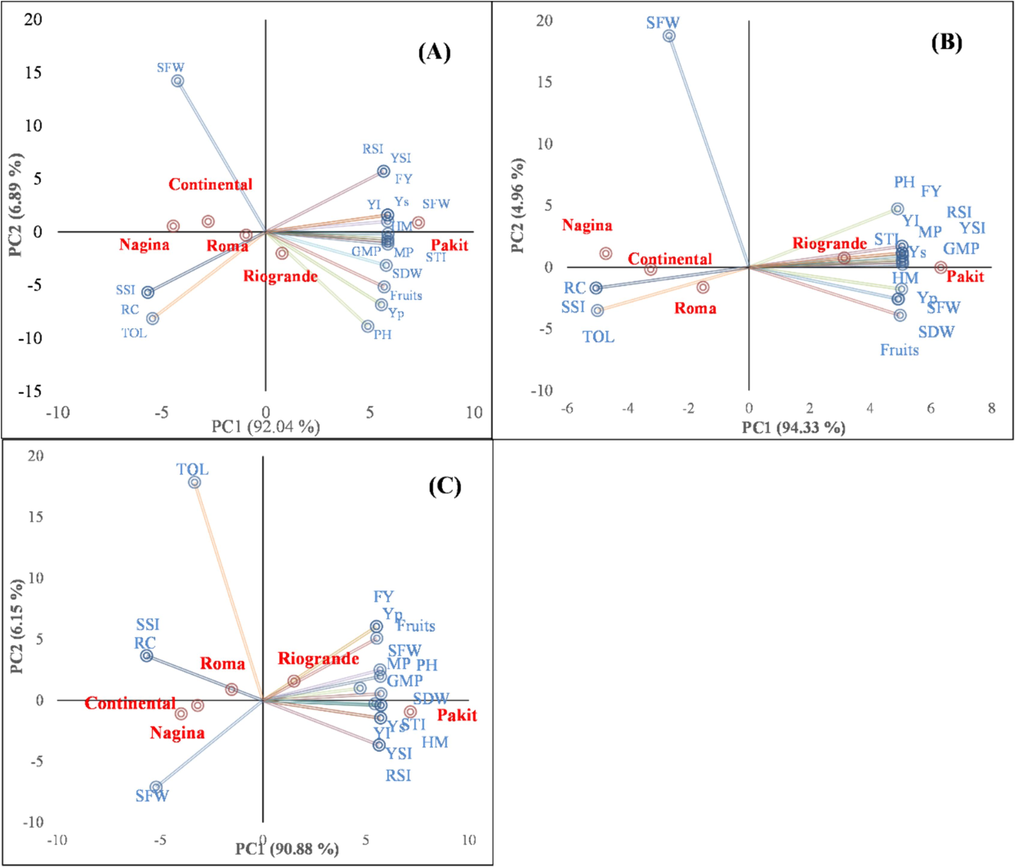
- Biplot of first two components of the principal component analysis executed on the yield-related traits and stress tolerance indices of different tomato genotypes under 100 mM (A), 150 mM (B) and 200 mM salinity levels. PH=plant height, SFW=shoot fresh weight, SDW=shoot dry weight, Fruits = number of fruits per plant, Yp = fruit yield under non-stressed conditions, Ys = fruit yield under stressed conditions, RC=relative change in the fruit yield due to stress, TOL=tolerance index, MP=mean productivity, GMP=geometric mean productivity, HM=harmonic mean, SSI=stress susceptibility index, STI=stress tolerance index, YI=yield index, YSI=yield stability index, and RSI=relative stress index.
4 Discussion
The findings revealed considerable variations in yield-related traits and stress tolerance indices of the tested tomato genotypes. The ‘Pakit’ genotype demonstrated superior performance for all the recorded traits with better tolerance indices. The greatest height, the highest shoot fresh weight, and the highest yield of fruits per plant were recorded for ‘Pakit’ genotype. Similarly, the highest values for TOL, MP, GMP, HM, STI, YSI and RSI, were noted for ‘Pakit’ genotype under all salinity levels. The ‘Continental’ and ‘Nagina’ genotypes resulted in the lowest values of the studied traits and tolerance indices. The genotype-dependent variability emphasizes the need of intentional genotype selection to maximize crop output in a variety of environmental settings (Abdeldym et al., 2020; Choudhury et al., 2023; Eynizadeh et al., 2023). Enhancing tomato yields through the development of high-yielding cultivars is primarily dependent on harnessing genetic diversity (Ramzan et al., 2014). Stress tolerance indices are essential for assessing the genotypic response to salt stress. These indices are used to evaluate the performance of different genotypes in saline conditions. Evaluating the genotype under abiotic stresses is crucial for breeding programs focused on enhancing salt tolerances. Several earlier investigations on the genetic diversity of tomatoes have consistently reported a substantial level of genetic variation in yield-related traits (Abdeldym et al., 2020; Choudhury et al., 2023; Eynizadeh et al., 2023; Tanveer et al., 2020). The earlier studies examining genetic variability, heritability, and genetic progress in tomato germplasm have stressed the significance of genetic variety in the development of high-yield genotypes (Bhandari et al., 2023; Ladewig et al., 2021; Marefatzadeh-Khameneh et al., 2021; Öztürk, 2022; Rasheed et al., 2023; Zannat et al., 2023). The results of the current study agree with these findings. The observed variations are owed to inherent genetic makeup of the genotypes included in the current study.
The salinity exerted significant detrimental impacts on all yield-related traits observed in the current study (Munns, 2005; Munns and Tester, 2008). Increasing levels of salinity had a detrimental impact on plant height, fresh and dry weights of shoots, fruit yield, weight of individual fruits, and the number of fruits per plant (Guo et al., 2022; Roșca et al., 2023; Singh et al., 2012). The most drastic impacts were seen at the highest salinity level of 200 mM. This aligns with the prevailing studies that elevated levels of salt have a substantial negative impact on plant growth and productivity (Roșca et al., 2023; Singh et al., 2012). The observed substantial decrease in many growth and yield-related traits underscores the need for the development of cultivars that possess salt tolerance. Tomato plants exposed to excessive salinity increase the accumulation of Na+ and Cl- ions while decreasing their levels of K+ and Ca2+ ions. This upsets the balance of ions in the plant, which may be corrected by removing salinity from seedlings (Parvin et al., 2019). The decrease in yield-related traits under elevated salt concentration can be owed to ion imbalance (Munns, 2005; Munns and Tester, 2008).
The interactive effect of genotypes and salinity indicated that different genotypes had distinct responses to varying salinity levels. The ‘Pakit’ genotype demonstrated significantly increased plant height under salt stress, while ‘Continental’ genotype had the lowest plant height when exposed to 200 mM salinity. All observed genotypes exhibited a noticeable decrease in plant height due to elevated salt concentrations, although to varying extents. The observed response to fluctuations in salinity levels is suggestive of the inherent diversity in salt tolerance shown by distinct genetic populations. Several earlier studies have indicated that genotypes differ in their response to salinity levels which is dependent on their inherent makeup (Kiferle et al., 2022; Roșca et al., 2023; Singh et al., 2012).
Correlation and multivariate analyses such as PCA are the first stage in understanding the relationship between the examined characteristics and obtaining a more comprehensive understanding of how each attribute influences the enhancement of the genetic makeup of the crop (Zannat et al., 2023). The PCA is the most advantageous trait to prioritize the traits in the breeding efforts. The PCA revealed that the better performing genotype had superior yield-related traits. Therefore, these traits may play a pivotal role in breeding efforts that seek to enhance fruit yield (Paw et al., 2020). Furthermore, PCA may be used to categorize suitable attributes into distinct components (Bhattarai and Subudhi, 2019). The PCA indicated that ‘Pakit’ and ‘Riogrande’ tomato genotypes exhibited the highest performance; therefore, these can be recommended for cultivation and used in future breeding programs to improve salinity tolerance of tomato.
5 Conclusion
The ‘Pakit’ and ‘Riogrande’ genotypes are viable for cultivation in slightly saline soils. Positive correlations among yield-related characteristics suggest that it is possible to enhance yield depending on synchrony among multiple traits. Further investigation could be directed towards comprehending the genetic mechanisms that underlie salinity tolerance in high-performing genotypes. This would facilitate the development of more accurate breeding programs aimed at enhancing salinity tolerance of tomatoes. Furthermore, conducting more extensive research on the physiological reactions of these genotypes to salt stress should be conducted to reveal adaptation mechanisms.
CRediT authorship contribution statement
Yingyu Zhang: Writing – original draft, Validation, Resources, Project administration, Methodology, Funding acquisition, Conceptualization. Ansar Hussain: Writing – original draft, Methodology, Investigation, Formal analysis, Data curation, Conceptualization. Muhammad Arif: Writing – review & editing, Visualization, Validation, Software, Methodology, Conceptualization. Jawaher Alkahtani: Writing – review & editing, Project administration, Methodology, Funding acquisition, Conceptualization. Bandar M. AlMunqedhi: Writing – review & editing, Project administration, Methodology. Cheng Song: Writing – review & editing, Project administration, Methodology, Funding acquisition, Conceptualization.
Acknowledgments
This work was supported by Demonstration Experiment Training Center of Anhui Provincial Department of Education (2022sysx033), and National Health Commission Scientific Research Fund (SBGJ202301010). The authors extend their appreciation to the Researchers supporting project number (RSP2024R193), King Saud University, Riyadh, Saudi Arabia.
Declaration of competing interest
The authors declare that they have no known competing financial interests or personal relationships that could have appeared to influence the work reported in this paper.
References
- Genetic Characterization, Agro-Morphological and Physiological Evaluation of Grafted Tomato under Salinity Stress Conditions. Agronomy. 2020;10:1948.
- [CrossRef] [Google Scholar]
- Genetic architecture of fresh-market tomato yield. BMC Plant Biol. 2023;23
- [CrossRef] [Google Scholar]
- Genetic diversity, population structure, and marker-trait association for drought tolerance in US rice germplasm. Plants. 2019;8
- [CrossRef] [Google Scholar]
- Assessment of drought resistance in pearl millet (Pennisetum americanum (L.) Leeke). II.* Estimation of genotype response to stress. Aust J Agric Res. 1987;38
- [CrossRef] [Google Scholar]
- Bouslama, M., Schapaugh, W.T., 1984. Stress Tolerance in Soybeans. I. Evaluation of Three Screening Techniques for Heat and Drought Tolerance 1. Crop Sci 24. Doi: 10.2135/cropsci1984.0011183x002400050026x.
- Soil Salinity: A Threat to Global Food Security. Agron J. 2016;108:2189-2200.
- [CrossRef] [Google Scholar]
- Salinity tolerance in tomato genotypes at an early plant growth stage: Morphological and physiological responses. Trends in Horticulture. 2023;6
- [CrossRef] [Google Scholar]
- Water deficit and salinity stress reveal many specific QTL for plant growth and fruit quality traits in tomato. Front Plant Sci. 2018;9
- [CrossRef] [Google Scholar]
- Determining tolerant tomato genotypes to salt stress according to physiological and morphological manner. AoB Plants. 2023;15
- [CrossRef] [Google Scholar]
- FAO, 2022. Global soil partnership. soil salinity [WWW Document]. https://www.fao.org/global-soil-partnership/areas-of-work/soil-salinity/en/ .
- Effective selection criteria for assessing plant stress tolerance. Adaptation of Food Crops to Temperature and Water Stress. 1992:257-270.
- [Google Scholar]
- Drought resistance in spring wheat cultivars. I. Grain yield responses. Aust J Agric Res. 1978;29
- [CrossRef] [Google Scholar]
- Drought resistance in spring wheat cultivars. III. Yield associations with morpho-physiological traits. Aust J Agric Res. 1979;30
- [CrossRef] [Google Scholar]
- Recent advances in genetics of salt tolerance in tomato. Plant Cell Tissue Organ Cult 2004
- [CrossRef] [Google Scholar]
- Evaluation of field and laboratory predictors of drought and heat tolerance in winter cereals. Can. J. Plant Sci.. 1997;77
- [CrossRef] [Google Scholar]
- Tomato salt tolerance mechanisms and their potential applications for fighting salinity: A review. Front Plant Sci 2022
- [CrossRef] [Google Scholar]
- Improvement in fruit yield and tolerance to salinity of tomato plants fertigated with micronutrient amounts of iodine. Sci Rep. 2022;12
- [CrossRef] [Google Scholar]
- Growth, yield and fruit quality of Mexican tomato landraces in response to salt stress. Not Bot Horti Agrobot Cluj Napoca. 2021;49
- [CrossRef] [Google Scholar]
- Dynamics of Salinity and Land Use in Punjab Province of Pakistan. Pak. J. Agric. Res.. 2021;34
- [CrossRef] [Google Scholar]
- Marefatzadeh-Khameneh, M., Fabriki-Ourang, S., Sorkhilalehloo, B., Abbasi-Kohpalekani, J., Ahmadi, J., 2021. Genetic diversity in tomato (Solanum lycopersicum L.) germplasm using fruit variation implemented by tomato analyzer software based on high throughput phenotyping. Genet Resour Crop Evol 68. Doi: 10.1007/s10722-021-01153-0.
- Öztürk, H.İ., 2022. Morphological and molecular characterization of some Tomato (Solanum lycopersicum L.) genotypes collected from Erzincan Province of Turkey. Mol Biol Rep 49. Doi: 10.1007/s11033-022-07310-7.
- Comparative physiological and biochemical changes in tomato (Solanum lycopersicum L.) under salt stress and recovery: Role of antioxidant defense and glyoxalase systems. Antioxidants. 2019;8
- [CrossRef] [Google Scholar]
- Estimation of variability, genetic divergence, correlation studies of Curcuma caesia Roxb. J Appl Res Med Aromat Plants. 2020;17
- [CrossRef] [Google Scholar]
- iPASTIC: An online toolkit to estimate plant abiotic stress indices. Appl Plant Sci. 2019;7
- [CrossRef] [Google Scholar]
- Estimation of genetic components in f 1 hybrids and their parents in determinate tomato (Solanum lycopersicum L.) J. Agric. Res.. 2014;03681157:52.
- [Google Scholar]
- Rasheed, A., Ilyas, M., Khan, T.N., Mahmood, A., Riaz, U., Chattha, M.B., Al Kashgry, N.A.T., Binothman, N., Hassan, M.U., Wu, Z., Qari, S.H., 2023. Study of genetic variability, heritability, and genetic advance for yield-related traits in tomato (Solanum lycopersicon MILL.). Front Genet 13. Doi: 10.3389/fgene.2022.1030309.
- Tomato consumption in the United States and its relationship to the US Department of Agriculture Food Pattern: Results from What We Eat in America 2005–2010. Nutr Today. 2016;51
- [CrossRef] [Google Scholar]
- Tomato responses to salinity stress: From morphological traits to genetic changes. Front Plant Sci 2023
- [CrossRef] [Google Scholar]
- Theoretical Aspects of Selection for Yield in Stress and Non-Stress Environment 1. Crop Sci. 1981;21
- [CrossRef] [Google Scholar]
- Singh, J., Sastry, E.V.D., Singh, V., 2012. Effect of salinity on tomato (Lycopersicon esculentum Mill.) during seed germination stage. Physiology and Molecular Biology of Plants 18. Doi: 10.1007/s12298-011-0097-z.
- Principles and procedure of statistics. A biometrical approach (3rd Ed.). New York: McGraw HillBookCo. Inc.; 1997. p. :352-358.
- Soil Salinity Research in 21st Century in Pakistan: Its Impact on Availability of Plant Nutrients, Growth and Yield of Crops. Commun Soil Sci Plant Anal. 2021
- [CrossRef] [Google Scholar]
- Tandra, S.Z., Hassan, L., Hannan, A., Jahan, J., Sagor, G.H.M., 2022. Screening and biochemical responses of tomato (Lycopersicum esculentum L.) genotypes for salt tolerance. Acta Physiol Plant 44. Doi: 10.1007/s11738-022-03376-9.
- Effect of salt stress on tomato plant and the role of calcium. J Plant Nutr. 2020;43
- [CrossRef] [Google Scholar]
- The use of XLSTAT in conducting principal component analysis (PCA) when evaluating the relationships between sensory and quality attributes in grilled foods. MethodsX. 2020;7
- [CrossRef] [Google Scholar]
- Exploring genotypic variability and interrelationships among growth, yield, and quality characteristics in diverse tomato genotypes. Heliyon. 2023;9
- [CrossRef] [Google Scholar]
- Mechanisms of Plant Responses and Adaptation to Soil Salinity. Innovation 2020
- [CrossRef] [Google Scholar]


