

Comparison of growth performance and morphological variation among three carp species (Cyprinus carpio, Hypophthalmichthys molitrix, and Labeo rohita)
⁎Corresponding author. zubia.masood@sbkwu.edu.pk (Zubia Masood)
-
Received: ,
Accepted: ,
This article was originally published by Elsevier and was migrated to Scientific Scholar after the change of Publisher.
Peer review under responsibility of King Saud University.
Abstract
This study was designed to analyse the water quality parameters and external morphological characters of three selected carp fish species i.e., Cyprinus carpio, Labeo rohita, and Hypothalamus molitrix from the Hub Dam of District Lasbela, Baluchistan. About Sixty specimens were collected for each carp fish species from April 2019 to March 2020, and their morphological characters were measured. The overall study of water quality parameters of Hub dam was found in the optimal range. The results of the Cube law revealed that the regression coefficient b-value was<3.0, which means that these species show positive allometric growth patterns that are, b = 2.07 for C. carpio, b = 2.04 for H. molitrix, and b = 0.12 for L. rohita. Moreover, the Correlation value ‘r’ between length and weight data for C. carpio and H. molitrix was found moderate and significant (r > 0.60; p < 0.05), while weak (r < 0.50; p < 0.05) and insignificant in L. rohita, respectively. The mean values of condition (K) and relative condition factors (Kn) were 1.0 which shows a good condition in Hub dam for fish growth. The overall results of linear relationships between 18 morphometric characters vs whole body growth (TL) revealed that a strong correlation (r > 0.70) was observed among TL vs FL and TL vs LD and moderate (r > 0.60; p < 0.05) and negative correlation also seen in between TL vs BDL and in most meristic characters of C. carpio. Likewise, mostly moderate (r > 0.60) and weak (r < 0.50) types of correlation were seen in most morphometric and meristic characters of H. molitrix and L. rohita, except few meristic characters of L. rohita show negative type relation with body growth (TL). This study was the first approach to examine the growth patterns of different carp species of Hub dam and observe their morphological variations among these carp species that have great potential value in systematics and fisheries management.
Keywords
Carp fishes
Growth patterns
Hub dam
Morphological variation
Water quality parameters

1 Introduction
Carps are distributed all over the world due to their great tolerance for various environmental conditions and habitat types. Various carp species are widely distributed among the different regions of the U.S, Canada, Central Mexico, and North America (Hishamunda et al., 2009). Common carp were firstly introduced in Pakistan with the aim of fish culturing from Thailand in 1964. Because of its high tolerance power of turbidity, beet, and breeding habits, it was successfully living in most natural islands, and various other water bodies, such as streams, rivers, canals, lakes, and every village pond in Pakistan. At the fry stage, its growth rate was too much slower, but with time, it grew faster and faster. Nowadays, it becomes a source of employment for about 400,000 people in Pakistan, and highly abundant edible fish among the other native species (Khan et al., 2016). In the Punjab and Sindh provinces of Pakistan, carp farming is very common now a day (Khan et al., 2016).Fig. 1.Fig. 2..
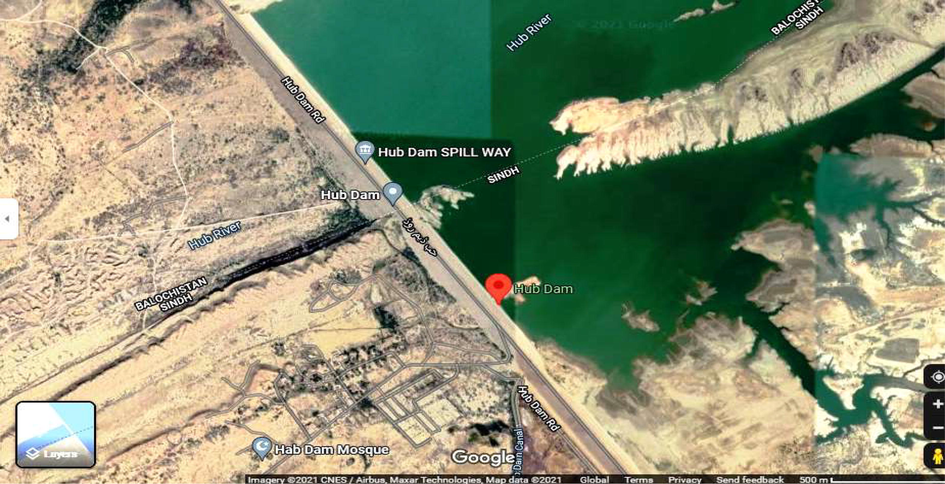
- Map of Hub dam of Balochistan.
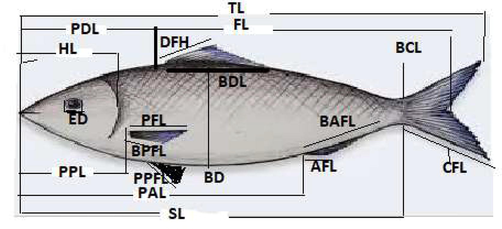
- Showing Morphometric characters measurements.
Common carp, Cyprinus carpio is recorded as a domesticated and cultured carp species all over the world. The body of carp fish has variations in color and size, e.g., wild carp fish is a brownish-green color on the back and ventrally golden yellow shade on the body. The mouth is short containing an upper lip and two pairs of burbles, while teeth are smoothed crown, and about 32 to 38 scales are found in the lateral line region of the body. Anal fins present with 17–22 branched- rays and 6–7 soft-rays, respectively (Komen, 1990). Fish farming of common carp is very valuable according to its great ability to utilize cereals by the fish farmers (Khan et al., 2016) There are >186 species of carp that are culturing in Pakistan for their economic and commercial importance containing Labeo rohita, Cirrhinus mrigala, Seprata sarwari, Wallago attu, Tenualosa ilisha, Notoptreus notoptreus, and Tor putitora. Pakistan also introduced many exotic species of carp consisting i.e., Ctenopharyngodoni idella, Hypophthalmichthys molitrix, Cyprinus carpio, Carassius auratus, Oreochromis mossambicus, O. niloticus) in warm-waters and two trout species i.e., rainbow trout, Oncorhynchus mykiss, and brown trout, Salmo trutta fario in cold-waters as well (Khan et al., 2011).
Labeo rohita (Hamilton 1822) or “Raho” is a cyprinid species, native to rivers, streams, lakes, and canals, of Bangladesh, India, Pakistan, Nepal, and Myanmar. L. rohita is a bottom feeder and prefers to feed on plant matter as well as decaying vegetation. Its food comprises crustaceous and insect larvae in the early stages. It takes small percentages of mud which contains organic matter and various salts. Sometimes come to the surface and bottom layer for finding food (Bhuiyan, 1964).
Hypophthalmichthys molitrix is commonly called ‘Silver carp’, which is one of the economically important species of cultural carp fishes. Commonly found in lakes, streams, and contain high market values in Asia. These fish can live in water temperatures 6 to 28 °C. The body is flattened with a huge head with wipe-like gill rakers used for filter-feeding on large phytoplankton. Silver carp is abundant in China and also in Siberian eastern regions and is mostly used as a game fish, pond culture, and in control of algal blooms. Chinese fish market is one of the biggest for Silver carp as compared to Bangladesh and India (Buchtová and Ježek, 2011).
Water quality parameters are an integral part of the aquaculture system that plays a major role in fish health conditions and flesh quality. Therefore, any changes in water quality parameters from the normal or permissible range can cause stress in fish growth and bring about certain diseases (Arulampalam et al., 1998). A good water condition is necessary for the survival and growth of fish, as the whole life process of fish is entirely dependent on the quality of its external aquatic environment (Bolorunduro and Abdullah, 1996a; Bolorunduro and Abdullah, 1996b). Thus, water quality parameters are used for the measurement of the condition of water relative to the requirements of one or more biotic species found in it. Adhikari et al. (2006), determined water parameters to explore the significant impact of water pH and alkalinity on lead, cadmium, and chromium accumulation in Indian major carp, L. rohita.
The current study was designed to observe the water quality parameters of Hub Dam and to compare growth performance, and morphological variation among the three different carp species (C. carpio, L. rohita, and H. molitrix) found in Hub Dam of District Lasbela, Balochistan.
2 Materials and methods
2.1 Study area and fish sampling
A total of 180 specimens of three carp species including Cyprinus carpio (N = 60), Hypophthalmichthys molitrix (N = 60), and Labeo rohita (N = 60) were examined during the study period from April 2019 to March 2020 from the Hub dam of district Lasbela. Hub dam is located at 25° 15́N, 67° 07́E on Hub River at Sindh and Baluchistan border (Figure A). The Hub River invents in the Kirthar Range of Baluchistan which separates Baluchistan from Sindh, and both receive water by a canal from the Hub Dam reservoir (Qaimkhani et al., 2005; Galib et al., 2013).
2.2 Analysis of water quality parameters
In this study, water parameters like pH, temperature, dissolved oxygen, hardness, and alkalinity of the hub dam were observed during the study period by following the methodology of Khalek et al. (2016), and Rehman et al. (2016). Temperature, pH, and dissolved oxygen concentration of water samples were estimated by using the Jenway Model 9500 DO2 Meter (950001).
2.3 Length-Weight relationship data
For each fish specimen, total body length was measured in centimeters and body weight in grams immediately after its capture. The growth pattern of fish was measured by using cube law as given by LeCren (1951) for obtaining information on the growth conditions of fish and to find out whether growth is isometric or allometric as follows:
Where, Wt = Body Weight of fish (g), TL was total-body-length (cm), ‘a’ is the intercept, while ‘b’ is the regression slope. Both ‘a’ and ‘b’ are expected by linear regression relationships among total length and weight to find out whether the growth pattern was the same for male and female fishes. The logarithmic transformation of the above mentioned equation was as follows.
Log Wt = log a ± log b* TL.
If the b-value is 3.0, then it indicates an isometric pattern of growth, while the b-value was<3.0, then it shows a positive allometric pattern of growth, and if<0.0 or negative and then shows a negative allometric pattern of growth, respectively by following the methods of Wootton (1989), Moutopoulos and Stergiou (2002), and Royal et al. (2006).
2.4 Coefficient of correlation (r)
In the present study, the Coefficient of correlation ‘r’ was also considered at 5 % significant (p < 0.05) for measuring the degree of relationship between total body length and body weight of fish during linear regression analysis followed by the methods of Olopade et al. (2018). If r ≤ 0.50 then it illustrates a weak correlation between length and weight of fish; when r ≥ 0.60 then the moderate type of correlation occurs, but if r ≥ 0.70 then a strong correlation occurs between length and weight, hence representing that if the length is enlarged then weight of fish body also rises accordingly.
2.5 Condition factor (K), and relative condition factor (Kn)
The value of the condition factor (K) was used to compare the condition, suitability, or health of the fish, food abundance, and duration of the breeding season. Condition factor (K) was determined by using length and weight data. The values of the condition factor of fish were determined by using the following Fulton’s equation as given by Fulton (1902);
Condition Factor (K) = Wt*100/TL3.
Where K = condition factor, Wt = weight of the fish in grams, and TL = total body length of fish in centimeters.
While the values of the relative condition factor (Kn) were deliberate as to the formula proposed by Le Cren, 1951; Zubia et al., 2014 as follows;
Relative condition factor Kn = Wt / We.
“Wt” represents experimental body weight, while “We” represents hypothetically estimated weight as expressed in grams, respectively.
2.6 Morphological characters
In the present investigation, the rate of whole body growth (TL) was also calculated in relation to different morphological body parts of fish were studied by using Vernier caliper with 0.1 cm with following the standard procedures as defined by Dwivedi and Menezes (1974), and Zubia et al (2015a & b). A total of 16 morphometric and five meristic traits were analyzed in this study. Morphometric characters include, e.g., total body length (TL), forked length (FL), body width (BD), head length (HL), eye diameter (ED), length of dorsal-fin (DFL), dorsal fin base length (BDFL), pectoral fin length (PFL), pectoral fin base length (BPFL), pelvic-fin length (PPFL), the base of pelvic-fin length (BPPFL), anal-fin length (LA), anal-fin base (BAFL), dorsal fin length (DFL) and base of dorsal length (BDFL), Caudal fin length (CFL), pre-dorsal length (PDL), pre-pectoral length (PPL), and pre-anal length (PAL) were under consideration as shown in Figure B. Meristic counts including, e.g., dorsal fin ray (DFR), pectoral fin ray (PFR), caudal fin ray (CFR), anal fin ray (AFR), and lateral line scales (LLS) were also calculated in this study, respectively.
The linear regression equation was applied to observe the strength of relationships between total length and each morphological parameter as follows;
Y = bX ± a.
Whereas “Y” represents the morphological parameter and “X” represents the total body length of fish in millimeters, 'a was a constant value and 'b' was the regression coefficient compared for three species of carp species. The range, mean, standard deviations, correlation coefficient 'r', and t-test at 5 % significant (p < 0.05) for all selected morphological characteristics to the total length were also computed as followed by Ambily et al. (2017). If the correlation coefficient values, that is r > 0.70, then it represents strong correlations, but if r > 0.60 shows moderate type correlation, and if r < 0.50 then shows weak correlations between whole-body growth and morphological body part.
To confirm whether the means of each morphometric and meristic character of three carp species were either the same or different were calculated by ANOVA (F-statistics at p > 0.05) by using Minitab Statistical software (version 17.1) by using the method of Zubia et al. (2015).
3 Results
3.1 Water quality parameters
Table 1.1 shows the water quality parameters of the Hub dam and a comparison of the results of the study with standard values given by WHO (1993). According to this study, the pH value of the Hub dam measured during different seasons varied from 6.86 to 6.94 with mean values of 6.88 ± 0.7, which are found in the standard range (5.0–9.0) as described by Anzecc (2000), respectively. The temperature range was 25.4 to 26.7 ˚C, which almost shows standard values, that is also 22 to 32 ˚C as observed by Md Hosen et al. (2019). The values of dissolved oxygen (DO) reported in this study was ranged from 5.16 to 5.22 and found in suitable DO values, which is > 5.0 mg/L for fish according to LIoyd (1992). The change in DO values might be due to the prolonged summer season and an extremely high evaporation rate of surface water, which reduced the low DO concentration in surface water to the standard values. The value of the water hardness observed in the Hub dam ranged from 133.0 to 134.0 mg/L, and total alkalinity was found to be 6.86 to 6.96 mg/L, and also found in a suitable range, respectively. Thus, the overall water quality parameters were found in optimal conditions and therefore considered suitable for fish growth and culture in Hub dam od Lasbela district.
3.2 Length and weight data (LWRs) analysis
Table 1a revealed that the Pearson correlation value ‘r’ between total length and weight relationships was moderate (r > 0.60) and significant (p < 0.05) for Cyprinus carpio, and weak and significant (r < 0.50; p < 0.05) for Hypophthalmichthys molitrix and negative and insignificant (p > 0.05) for Labeo rohita respectively. Table 1b shows the Cube law for observing the growth patterns in these species and found that there were only positive allometric patterns of growth were present when the regression coefficient that is b < 3.0 for these three selected species.Table 2a.Table 2b.Table 3..
| Species | N |
TL in cm |
Wt in grams |
TL Range |
Wt Range |
Regression Coefficients | t-test | p-value | ||||||
|---|---|---|---|---|---|---|---|---|---|---|---|---|---|---|
| Mean ± S.D | S.E | Mean ± S.D | S.E | Min. | Max. | Min. | Max. | a | b | r | ||||
| Cyprinus carpio | 60 | 32.3 ± 2.0 | 0.381 | 153.3 ± 33.6 | 6.14 | 29.0 | 360 | 96.4 | 201.0 | −147.19 | 13.119 | 0.663** | 7.41 | 0.000† |
| Hypophthalmichthys molitrix | 60 | 3.99 ± 2.8 | 0.503 | 414.2 ± 91.2 | 16.6 | 25.5 | 37.5 | 208.5 | 603.7 | −365.36 | 23.02 | 0.4843* | 5.13 | 0.000† |
| Labeo rohita | 60 | 32.3 ± 2.0 | 0.366 | 524.9 ± 48.1 | 8.77 | 29.0 | 36.0 | 362.0 | 600.0 | +583.83 | −1.8248 | −0.006 | 0.40 | 0.689♣ |
| Note: N = number of samples; S. D = standard deviation; S.E = standard Error; a = intercept; b = regression slope; r = correlation coefficient. TL is taken in cm while weight is in gram; † represents t-test significant at p < 0.05, while ♣ shows insignificant (p > 0.05) | ||||||||||||||
| Species | Log TL | Log Wt | Regression coefficients | ||||||
|---|---|---|---|---|---|---|---|---|---|
| Mean ± S.D | S.E Mean | Mean ± S.D | S.E Mean | Log a | Log b | r | t-test | p-value | |
| Cyprinus carpio | 1.4 ± 0.0 | 0.00733 | 2.2 ± 0.1 | 0.0186 | −0.6396 | 2.072 | 0.6628** | 7.42 | 0.000† |
| Hypophthalmichthys molitrix | 1.5 ± 0.0 | 0.00698 | 2.6 ± 0.1 | 0.0187 | −0.5222 | 2.0472 | 0.5856** | 6.29 | 0.000 † |
| Labeo rohita | 1.5 ± 0.0 | 0.00492 | 2.7 ± 0.0 | 0.00779 | +2.9003 | 0.1208 | 0.0058* | −0.40 | 0.689 ♣ |
| Note: * shows t-test is significant when p < 0.05; *** shows strong correlation when r > 0.70; shows positive allometric growth when b < 3.0, r = correlation coefficient. † represents t-test significant at p < 0.05, while ♣ shows insignificant (p > 0.05) | |||||||||
| Parameters | Range | Mean ± S.D | Median | Standard values | Reference | |
|---|---|---|---|---|---|---|
| pH | 6.86 | 6.94 | 6.88 ± 0.7 | 6.858 | 6.4–8.4 / 5.0–9.0 | Lawson, 1995; Anzecc, 2000 |
| Temperature (˚C) | 25.4 | 26.7 | 25.9 ± 0.7 | 25.6 | 22–32 ˚C | MdHosen et al., 2019; Rehman et al., 2020 |
| Dissolved Oxygen(DO) mg/L | 5.16 | 5.22 | 5.18 ± 0.03 | 5.17 | > 5.0 | LIoyd,1992 |
| Hardness of water in mg/L | 133.0 | 134.0 | 134.0 ± 1.0 | 134 | 150 mg/l | Jena JK, 2015 |
| Alkalinity in mg/L | 6.86 | 6.96 | 6.76 ± 0.21 | 6.68 | > 20 | Anzecc, 2000 |
| Range (K-values) | |||
|---|---|---|---|
| Species | Mean ± S.D | Max. | Min. |
| Cyprinus carpio | 1.3 ± 0.2 | 1.7 | 0.9 |
| Hypophthalmichthys molitrix | 1.1 ± 0.2 | 1.5 | 0.7 |
| Labeo rohita | 1.6 ± 0.3 | 2.2 | 0.9 |
| Note: S.D = Standard deviation. | |||
| Species | Range (Kn-values) | ||
|---|---|---|---|
| Mean ± S.D | Max. | Min. | |
| Cyprinus carpio | *0.99 ± 0.12 | 1.18 | 1.03 |
| Hypophthalmichthys molitrix | *0.99 ± 0.15 | 1.34 | 0.72 |
| Labeo rohita | 1.00 ± 0.09 | 1.14 | 0.69 |
| Note: * shows the mean Kn values = 1.0. S.D = Standard deviation. | |||
3.3 Condition (K) and relative condition factors (Kn)
Tables 2 and 3 were showing the mean condition factor (K) and relative condition factors (Kn) values for observing their growth conditions which were found to be almost 1.0, hence showing good conditions of Hub dam for these carp fishes.
3.4 Analysis of morphometric and meristic characters
About eighteen morphometric and five meristic characteristics were also observed during this study for Cyprinus carpio, Hypophthalmichthys molitrix, and Labeo rohita, and also observed the different types of Pearson correlation ‘r’ was found between total length and other following parameters which are showed by Table 4a, respectively. While Table 4b shows the mean values, standard deviation, standard error of the mean, and minimum and maximum value of each morphometric and meristic trait calculated for three carp species including Cyprinus carpio, Hypophthalmichthys molitrix, and Labeo rohita collected from Hub dam during the whole study period.
| Morphometric Characters | Abbreviation’s |
|---|---|
|
TL |
|
FL |
|
BD |
|
HL |
|
DFL |
|
BDFL |
|
BPFL |
|
PFL |
|
PPFL |
|
BPPFL |
|
AFL |
|
BAFL |
|
PDL |
|
DFL |
|
BDFL |
|
ED |
| Meristic characters | Carp species |
|
DFR |
|
AFR |
|
CFR |
|
PFR |
|
LLS |
|
Cyprinus carpio (N = 60) |
Hypophthalmichthys molitrix (N = 60) |
Labeo rohita (N = 60) |
||||||||||
|---|---|---|---|---|---|---|---|---|---|---|---|---|
| Range | Range | Range | ||||||||||
| Variables Morphometric | Mean ± S.D | S.E of Mean | Min. | Max. | Mean ± S.D | S.E of Mean | Min | Max. | Mean ± S.D | S.E of Mean | Min | Max. |
| TL | 229.07 ± 20.85 | 3.81 | 190.00 | 260.00 | 338.63 ± 27.56 | 5.03 | 255.00 | 375.00 | 323.13 ± 20.06 | 3.66 | 290.00 | 360.00 |
| FL | 199.60 ± 18.11 | 3.31 | 170.00 | 236.00 | 292.90 ± 35.67 | 6.51 | 195.00 | 347.00 | 285.43 ± 21.45 | 3.92 | 250.00 | 320.00 |
| Width (BD) | 73.97 ± 9.10 | 1.66 | 60.00 | 90.00 | 146.2 ± 55.9 | 10.2 | 77.0 | 240.0 | 102.30 ± 6.46 | 1.18 | 90.00 | 120.00 |
| HL | 55.53 ± 7.66 | 1.40 | 40.00 | 70.00 | 86.03 ± 9.37 | 1.71 | 62.00 | 105.00 | 71.37 ± 5.72 | 1.04 | 59.00 | 85.00 |
| ED | 11.700 ± 2.336 | 0.427 | 9.000 | 17.000 | 11.333 ± 1.583 | 0.289 | 10.00 | 15.000 | 11.767 ± 1.924 | 0.351 | 8.000 | 17.000 |
| PPL | 51.17 ± 6.63 | 1.21 | 40.00 | 68.00 | 79.23 ± 6.28 | 1.15 | 70.00 | 97.00 | 72.87 ± 8.59 | 1.57 | 53.00 | 84.00 |
| PAL | 129.53 ± 12.68 | 2.31 | 110.00 | 160.00 | 177.03 ± 22.74 | 4.15 | 139.00 | 235.00 | 183.43 ± 15.50 | 2.83 | 150.00 | 210.00 |
| PDL | 91.400 ± 4.20 | 0.768 | 85.000 | 100.000 | 112.40 ± 26.82 | 4.90 | 70.00 | 155.00 | 135.33 ± 12.59 | 2.30 | 110.00 | 153.00 |
| PFL | 37.73 ± 6.27 | 1.14 | 25.00 | 50.00 | 54.733 ± 5.172 | 0.944 | 40.000 | 65.000 | 13.467 ± 2.315 | 0.423 | 30.00 | 60.00 |
| BPFL | 14.733 ± 3.903 | 0.713 | 5.000 | 20.000 | 15.30 ± 6.58 | 1.20 | 5.00 | 45.00 | 51.20 ± 7.39 | 1.35 | 9.000 | 18.000 |
| LA | 29.87 ± 5.85 | 1.07 | 12.00 | 40.00 | 38.40 ± 5.89 | 1.07 | 23.00 | 50.00 | 19.867 ± 5.450 | 0.995 | 39.000 | 65.000 |
| BAFL | 17.800 ± 3.156 | 0.576 | 14.000 | 30.000 | 42.53 ± 13.45 | 2.46 | 15.00 | 64.00 | 19.867 ± 5.450 | 0.995 | 10.000 | 32.000 |
| DFL | 36.47 ± 6.81 | 1.24 | 25.00 | 54.00 | 45.60 ± 12.26 | 2.24 | 29.00 | 65.00 | 56.73 ± 7.02 | 1.28 | 40.00 | 70.00 |
| BDFL | 64.43 ± 7.92 | 1.45 | 30.00 | 72.00 | 53.43 ± 18.41 | 3.36 | 28.00 | 80.00 | 62.60 ± 8.40 | 1.53 | 42.00 | 74.00 |
| PPFL | 32.767 ± 3.683 | 0.672 | 25.000 | 39.000 | 49.30 ± 10.53 | 32.00 | 48.50 | 71.00 | 12.733 ± 2.22 | 0.407 | 8.000 | 16.000 |
| BPPFL | 12.900 ± 3.800 | 0.694 | 5.000 | 19.000 | 9.633 ± 2.414 | 10.000 | 6.00 | 15.000 | 15.167 ± 3.41 | 0.623 | 10.000 | 25.000 |
| CFL | 48.700 ± 4.542 | 0.829 | 41.000 | 60.000 | 65.87 ± 12.19 | 31.00 | 48.50 | 85.00 | 77.47 ± 5.95 | 1.09 | 62.00 | 86.00 |
| Meristics | ||||||||||||
| PFR | 11.36 ± 2.341 | 0.427 | 7.000 | 16.000 | 13.900 ± 1.062 | 0.194 | 12.000 | 16.000 | 11.36 ± 2.34 | 0.427 | 13.000 | 21.000 |
| DFR | 17.800 ± 1.448 | 0.264 | 13.000 | 21.0 | 7.733 ± 27.56 | 5.03 | 255.00 | 375.00 | 17.800 ± 1.448 | 0.264 | 13.000 | 21.000 |
| AFR | 12.733 ± 4.59 | 4.593 | 8.000 | 19.000 | 17.667 ± 1.688 | 0.308 | 12.000 | 21.000 | 12.733 ± 4.593 | 0.839 | 8.000 | 19.000 |
| CFR | 21.000 ± 1.145 | 0.209 | 18.000 | 23.000 | 18.967 ± 1.497 | 0.273 | 17.00 | 22.00 | 21.000 ± 1.14 | 0.209 | 18.00 | 23.00 |
| LLS | 34.33 ± 2.35 | 0.430 | 31.000 | 44.000 | 82.33 ± 17.46 | 17.46 | 52.00 | 110.00 | 34.333 ± 2.35 | 0.430 | 31.000 | 44.000 |
3.4.1 Linear relationship of morphometric and meristic characters with whole-body growth (TL) of Cyprinus carpio
Tables 5a & 5b show the linear regression relationship of total body length (TL) and different morphometric characters and meristic counts of Cyprinus carpio, which shows the relationship of total body growth (TL) with different morphological characters. A strong correlation (r > 0.70; p < 0.05) was observed between TL vs FL and TL vs DFL, while other characters show moderate (r > 0.60) and weak correlation (r < 0.50), while TL vs BDFL shows a negative and insignificant correlation (p > 0.05), respectively. Whereas, meristic characters mostly show weak and significant correlation (r < 0.50; p < 0.05).
|
Total length and all other variables are taken in mm. (N = 60) |
||||||||
|---|---|---|---|---|---|---|---|---|
| Total length | Morphometric characters | Regression coefficients | Correlation type | |||||
| X | Y | a | b | r | S.E | p-value | t-test | CT |
| TL | TL | 42.2 | 0.687 | 0.791 | 0.100 | 0.001† | 3.56 | *** |
| TL | FL | 16.0 | 0.2531 | 0.580 | 0.0672 | 0.001† | 3.77 | ** |
| TL | Width (BD) | 8.6 | 0.2050 | 0.558 | 0.0576 | 0.147♣ | 1.49 | ** |
| TL | HL | 4.73 | 0.0304 | 0.271 | 0.0204 | 0.147† | 1.49 | * |
| TL | ED | 15.8 | 0.1545 | 0.486 | 0.0525 | 0.006† | 2.94 | * |
| TL | PPL | 56.3 | 0.3196 | 0.526 | 0.0977 | 0.003† | 3.27 | ** |
| TL | PAL | 79.06 | 0.0539 | 0.267 | 0.0367 | 0.154♣ | 1.47 | * |
| TL | PDL | −8.68 | 0.2026 | 0.674 | 0.0420 | 0.000† | 4.83 | ** |
| TL | PFL | −11.34 | 0.1138 | 0.608 | 0.0281 | 0.000† | 4.05 | ** |
| TL | BPFL | −1.6 | 0.1375 | 0.490 | 0.0462 | 0.006† | 2.98 | * |
| TL | LA | 5.37 | 0.0543 | 0.359 | 0.0267 | 0.052† | 2.03 | * |
| TL | BAFL | −18.39 | 0.2395 | 0.733 | 0.0420 | 0.000† | 5.70 | *** |
| TL | DFL | 73.1 | −0.0378 | −0.100 | 0.0714 | 0.601♣ | −0.53 | – |
| TL | BDFL | 11.98 | 0.0907 | 0.514 | 0.0286 | 0.004† | 3.17 | ** |
| TL | PPFL | 1.74 | 0.0487 | 0.267 | 0.0332 | 0.153♣ | 1.47 | * |
| TL | BPPFL | 18.38 | 0.1324 | 0.608 | 0.0327 | 0.000† | 4.05 | ** |
| TL | CFL | 15.4 | 0.0662 | 0.267 | 0.0451 | 0.153♣ | 1.47 | * |
| Note: N = number of fish samples; S.E = standard Error, CT = correlation type, *** shows the strong correlation (r > 70), ** shows moderate correlation (r = 0.51–0.69), * represent weak correlation (r > 50), – shows negative correlation. ♣ shows insignificant correlation when p > 0.05, † shows significant correlation when p < 0.05. | ||||||||
| Total length in mm | Meristic characters | Regression coefficients | Correlation type | |||||
|---|---|---|---|---|---|---|---|---|
| X | Y | a | b | r | S.E | p-value | t-test | CT |
| TL | DFR | 25.28 | 0.0326 | −0.470 | 0.0116 | 0.009† | −2.82 | * |
| TL | PFR | 19.35 | 0.0349 | −0.311 | 0.0202 | 0.095† | −1.73 | * |
| TL | CFR | 20.44 | 0.0025 | 0.045 | 0.0104 | 0.814 ♣ | 0.24 | * |
| TL | AFR | 20.62 | 0.0344 | −0.156 | 0.0411 | 0.409† | −0.84 | * |
| TL | LLS | 31.46 | 0.0126 | 0.111 | 0.0212 | 0.558† | 0.59 | * |
| *Note: N = number of fish samples; S.E = standard Error, CT = correlation type, *** shows the strong correlation (r > 70), ** shows moderate correlation (r = 0.51–0.69), * represent weak correlation (r > 50), – shows negative correlation. ♣ shows insignificant correlation when p > 0.05, † shows significant correlation when p < 0.05. | ||||||||
3.4.2 Linear relationship of morphometric and meristic characters with whole-body growth (TL) of Hypophthalmichthys molitrix
Tables 6a & 6b show the linear regression relationship among body length (TL) and different morphometric and meristic characteristics of Hypophthalmichthys molitrix, which shows the relationship of total body growth (TL) with different morphological characters. Moderate correlation (r > 0.60; p < 0.05) was found between TL vs FL, TL vs HL, and TL vs CFL, while other characters show weak correlation (r < 0.50) and are most significant (p > 0.05), respectively. Whereas meristic characters mostly show weak and insignificant correlation (r < 0.50; p > 0.05), except TL vs DFR which showed a moderate and significant correlation (r > 0.60; p < 0.05).
|
Total length and all other variables are taken in mm. (N = 60) |
||||||||
|---|---|---|---|---|---|---|---|---|
| Total length | Morphometric characters | Regression coefficients | Correlation type | |||||
| X | Y | a | b | r | S.E | p-value | t-test | CT |
| TL | TL | −8.2 | 0.889 | 0.687 | 0.178 | 0.000 † | 5.00 | ** |
| TL | FL | 233 | − 0.257 | −0.127 | 0.380 | 0.505 ♣ | −0.68 | * |
| TL | Width (BD) | 15.1 | 0.2095 | 0.616 | 0.0506 | 0.000 † | 4.14 | ** |
| TL | HL | 6.45 | 0.0144 | 0.251 | 0.0105 | 0.181♣ | 1.37 | * |
| TL | ED | 32.5 | 0.1380 | 0.606 | −18.6 | 0.000 † | 4.03 | * |
| TL | PPL | 32.5 | 0.1380 | 0.438 | 0.140 | 0.016† | 2.58 | * |
| TL | PAL | −6.4 | 0.351 | 0.361 | 0.172 | 0.050 † | 2.05 | * |
| TL | PDL | 30.9 | 0.0703 | 0.375 | 0.0329 | 0.041† | 2.14 | * |
| TL | PFL | −18.6 | 0.100 | 0.419 | 0.0410 | 0.021† | 2.44 | * |
| TL | BPFL | 0.8 | 0.1432 | 0.375 | 0.0670 | 0.041† | 2.14 | * |
| TL | LA | 4.56 | 0.0150 | 0.171 | 0.0163 | 0.366 | 0.92 | * |
| TL | BAFL | 13.3 | 0.074 | 0.346 | 0.0379 | 0.061♣ | 1.95 | * |
| TL | DFL | −39.7 | 0.2429 | 0.498 | 0.080 | 0.005† | 3.04 | * |
| TL | BDFL | −2.6 | 0.1423 | 0.320 | 0.0797 | 0.085 ♣ | 1.79 | * |
| TL | PPFL | 127.4 | − 0.218 | −0.327 | 0.119 | 0.078 ♣ | −1.83 | * |
| TL | BPPFL | −35.6 | 0.299 | 0.678 | 0.061 | 0.000 † | 4.88 | ** |
| TL | CFL | −7.9 | 0.138 | 0.447 | 0.052 | 0.013† | 2.64 | ** |
| Note: N = number of fish samples; S.E = standard Error, CT = correlation type, *** shows the strong correlation (r > 70), ** shows moderate correlation (r = 0.51–0.69), * represent weak correlation (r > 50), – shows negative correlation. ♣ shows insignificant correlation when p > 0.05, †shows significant correlation when p < 0.05. | ||||||||
|
Total length and all other variables are taken in mm. (N = 60) |
||||||||
|---|---|---|---|---|---|---|---|---|
| Total length in mm | Meristic characters | Regression coefficients | Correlation type | |||||
| X | Y | a | b | r | S.E | p-value | t-test | CT |
| TL | DFR | −1.34 | 0.0267 | 0.646 | 0.00598 | 0.000 † | 4.48 | ** |
| TL | PFR | 1.78 | 0.0062 | 0.162 | 0.00719 | 0.391 ♣ | 0.87 | * |
| TL | CFR | 3.07 | 0.0174 | 0.321 | 0.00972 | 0.084 ♣ | 1.79 | * |
| TL | AFR | 2.22 | 0.0161 | 0.263 | 0.0112 | 0.161 ♣ | 1.44 | * |
| TL | LLS | 24.1 | 0.314 | 0.496 | 0.104 | 0.005 † | 3.02 | * |
|
*Note: N = number of fish samples; S.E = standard Error, CT = correlation type, *** shows the strong correlation (r > 70), ** shows moderate correlation (r = 0.51–0.69), * represent weak correlation (r > 50), – shows negative correlation. ♣ shows insignificant correlation when p > 0.05, † shows significant correlation when p < 0.05. |
||||||||
3.4.3 Linear relationship of morphometric and meristic characters with whole body growth (TL) of Labeo rohita
Tables 7a & 7b show the linear regression relationship between total body length (TL) and different morphometric characters and meristic counts of Labeo rohita, which shows the relationship of total body growth (TL) with different morphological characters. A mostly weak correlation (r > 0.50; p > 0.05) was found between TL versus most morphometric characters except TL vs FL which shows a strong and significant relationship (r > 0.70; p < 0.05), respectively. Whereas the meristic characters mostly showed negative and insignificant correlations (p > 0.05), except the TL vs CFR, TL vs LLS showed weak but insignificant correlation (r > 0.50; p > 0.05).
|
Total length and all other variables are taken in mm. (N = 60) |
||||||||
|---|---|---|---|---|---|---|---|---|
| Total length | Morphometric characters | Regression coefficients | Correlation type | |||||
| X | Y | a | b | r | S.E | p-value | t-test | CT |
| TL | TL | −26.7 | 0.9660 | 0.903 | 0.0866 | 0.000 † | 11.15 | *** |
| TL | FL | 74.0.5 | 0.0859 | 0.267 | 0.0587 | 0.154 ♣ | 1.47 | * |
| TL | Width (BD) | 61.7 | 0.0300 | 0.105 | 0.0536 | 0.580♣ | 0.56 | * |
| TL | HL | 9.05 | 0.0084 | 0.087 | 0.0181 | 0.646 ♣ | 0.46 | * |
| TL | ED | 54.9 | 0.0556 | 0.130 | 0.0803 | 0.494 ♣ | 0.69 | * |
| TL | PPL | 92.0 | 0.283 | 0.366 | 0.136 | 0.047 † | 2.08 | * |
| TL | PAL | −6.4 | 0.351 | 0.361 | 0.172 | 0.05 † | 2.05 | * |
| TL | PDL | 41.9 | 0.0107 | 0.030 | 0.0684 | 0.876♣ | 0.16 | * |
| TL | PFL | 37.6 | 0.0420 | 0.325 | 0.0691 | 0.080† | 0.61 | * |
| TL | BPFL | 37.6 | 0.0420 | 0.114 | 0.0691 | 0.548♣ | 0.61 | * |
| TL | LA | 2.5 | 0.0536 | 0.197 | 0.0503 | 0.296♣ | 1.06 | * |
| TL | BAFL | 34.5 | 0.0689 | 0.197 | 0.0649 | 0.297♣ | 1.06 | * |
| TL | DFL | 44.6 | 0.0558 | 0.133 | 0.0785 | 0.483♣ | 0.71 | * |
| TL | BDFL | 17.1 | 0.006 | 0.153 |
0.0207 |
0.420♣ | 0.82 | * |
| TL |
PPFL | 17.1 | 0.0061 | −0.036 |
0.0322 |
0.852♣ |
0.19 |
* |
| TL |
BPPFL | 71.3 | 0.0190 |
0.064 |
0.0560 |
0.736♣ |
0.34 |
* |
| TL |
CFL | 17.0 | 0.0615 |
0.254 | 0.0443 | 0.176♣ | 1.39 | * |
|
Note: N = number of fish samples; S.E = standard Error, CT = correlation type, *** shows the strong correlation (r > 70), ** shows moderate correlation (r = 0.51–0.69), * represent weak correlation (r > 50), – shows negative correlation. ♣ shows insignificant correlation when p > 0.05, † shows significant correlation when p < 0.05. |
||||||||
|
Total length and all other variables are taken in mm. (N = 90) |
||||||||
|---|---|---|---|---|---|---|---|---|
| Total length in mm | Meristic characters | Regression coefficients | Correlation type | |||||
| X | Y | a | b | r | S.E | p-value | t-test | CT |
| TL | PFR | 19.35 | −0.0349 | −0.311 | 0.0202 | 0.095
|
−1.73 | – |
| TL | AFR | 20.62 | −0.0344 | −0.156 | 0.0411 | 0.409a
|
−0.84 | – |
| TL | DFR | 25.28 | 0.0326 | −0.470 | 0.0116 | 0.009
|
−2.82 | – |
| TL | CFR | 20.44 | 0.0025 | 0.045 | 0.0104 | 0.814
|
0.24 | * |
| TL | LLS | 31.46 | 0.0126 | 0.111 | 0.0212 | 0.558
|
0.59 | * |
| *Note: N = number of fish samples; S.E = standard Error, CT = correlation type, *** shows the strong correlation (r > 70), ** shows moderate correlation (r = 0.51–0.69), * represent weak correlation (r > 50), – shows negative correlation. ♣ shows insignificant correlation when p > 0.05, † shows significant correlation when p < 0.05. | ||||||||
4 Discussion
From the analysis of the physiochemical parameters of the Hub dam, it had been observed that water temperature, pH, Alkalinity, dissolved oxygen, and hardness were found in the permissible range as characterized by many researchers including, Bhatnagar and Devi (2013), Iqbal et al. (2013), Md Hosen et al. (2019), and Rehman et al. (2020), who also found all these parameters in reasonable ranges necessary for the growth and development of L. rohita, C. carpio, and H. molitrix, as shown in Table 1, respectively.
Current studies on carp species found in Hub dam i.e., L. rohita, C. carpio, and H. molitrix have revealed a wide range of length-weight relationships (LWRs) over the species range (Yamagawa, 1994; Isa et al., 2012; Lavergne et al., 2013; Manoharan et al., 2013). During this study, only a positive allometric growth pattern (b = 2.0) was observed in C. carpio, H. molitrix, as well as in L. rohita which was in accordance with Hussain et al. (2010), and Ahmed and Benzer (2015) from Pakistan. The irregularity in the development of fishes may be because of great diversities or location or habitat as well as environmental contrasts (Isa et al., 2012; Franco et al., 2014). The change of b-value among different species can be because of fish body weight. In this investigation, it was discovered that the weight was dependent on the fish's well-being, which in turn affected the length-weight relationship data also (Yousuf and Khurshid, 2008).
The condition factor illustrates an idea of the well-being or wellness of fish, as it is a critical component for fish culture on the board (Gopalakrishnan et al., 2014). K-values give knowledge to know about the growth performance of fish. In the current study, K-values were arranged as follows: >1.6 showed a fish in reasonable well-being; while k = 1.00 demonstrated that a fish was in chronic weakness (long and flimsy body); and 0.80 demonstrated that a fish in a very helpless condition as in accordance with Gerami et al. (2013). Thus, this study revealed that carp species i.e., C. carpio and H. molitrix would be considered healthy. While L. rohita would be considered in reasonable well-being. The higher K-values demonstrated that they were heavier than their length, while the lower K-values indicated that they were lighter than their length as observed by Shakir et al. (2008). Analyzing the K-values, Lavergne et al. (2013) announced the great strength of fish during the post-storm season from the more extensive Gulf of Aden. Ahmed and Benzer (2015) likewise revealed a great strength of fish in the pre-storm season in Pakistan. The higher K-values toward the start of the stormy season show a most reasonable period for fish development (Abowei et al., 2009). During the stormy season, the phytoplankton was grown well, which supports the great dependability of fish (Utete and Chikova, 2013). The higher K-values mean that the fish was utilizing its taking care source (Abowei et al., 2009; Parida et al. 2013) and how well the fish was in this water body (Lawson and Oloko, 2013).
The relative condition factor (Kn) is a useful tool to observe the spawning and feeding behavior of fish. The higher Kn-values specify the increase in body- weight, either due to tissue growth or gonad maturation, while lower Kn-values indicate spawning activity (Zakaria et al., 2000). During this study, it was observed that mean Kn-values also differed between three species of carp in the same months. These fluctuations in Kn-values between them might be attributed to the feeding intensity or gravid condition (Pervin and Mortuza, 2008).
Morphometric parameters showed a proportional positive increase with an increase in the length of fish. Ujjania et al. (2012) also observed a positive correlation in morphometric parameters with an increase in fish body length. The meristic counts were almost constant in all the length groups of fish with different body lengths, so it concludes that the meristic counts were independent of body length (Talwar and Jhingran, 1992; Zafar et al. 2002). In comparing of growth rate relationship of selected fish species of this study, morphometric parameters in relation to total length were strong in the case of standard length (b = 1.115) and weak in the case of pelvic fin length (b = 0.146) for C. carpio, maximum in case of standard length (b = 1.132) and lowest in pectoral fin length (b = 0.126) for H. molitrix, whereas also maximum in case of fork length and standard lengths (b = 0.995) and lowest in the length of caudal peduncle (b = 0.135) for L. rohita. The higher correlation coefficient 'r' indicated a positive correlation in the case of various morphometric characters with the total length. For C. carpio, correlation coefficient ‘r’ was strong between total length and fork length (r = 0.79), while weak between total length and caudal fin length (r = 0.05) but was showing a positive correlation with total length. For H. molitrix, correlation coefficient ‘r’ was strong between total length vs fork length (r = 0.68), while weak between total length vs width (r = -0.127) that was showing a negative correlation with total length. For L. rohita, correlation coefficient ‘r’ was strong between total length vs fork length (r = 0.903), while weak between total length and lateral line scales (r = 0.111) but showing a positive correlation with total length. Badkur and Parashar (2015) also found a positive correlation for various morphometric characters regarding an increase in the total length of Mahseer (Tor peak) in River Narmada. The comparative perception was also made by Nautiyal and Lal (1988), Bhatt (1997), and Johal et al. (2003) while considering the morphometric and meristic characters of Tor putitora from the Ganga River among Rishikesh and Haridwar. Different natural variables also impact on morphometric character of fish species, for example, the breeding period as observed by Gould (1966) and Barlow (1961). Tanning (1944) may likewise observe that unpaired fin and the number of fin-rays in different fish species were also changed with respect to polaroid of water at different thicknesses. Thus, the current study of both morphometric and meristic traits of fresh water carp fishes of Hub dam of Lasbela demonstrated that the corresponding development speed of fish species increased with an increase in fish length and noticed a positive relationship between whole-body length and various morphometric parameters. Meristic counts were also a slight increase in relation to body growth in the current investigation. Moreover, little measured examples, which have not been reached to grown-up body size additionally cause contrasts in b-values (Nyanti et al., 2012).
5 Conclusion
From the previous results, it was articulated that the investigations of the current examination expressed the relationship of absolute length with other morphological characters C. carpio, H. molitrix, and L. rohita populace of the Hub dam has fundamentally corresponded. The positive connection coefficient demonstrated that there was relative expansion in the morphometric boundaries in examination with the all-out length. The water quality boundaries were likewise broken down and can be said to advance the development of fishes staying within the framework. It can likewise be inferred that the common states of the Hub dam are positive for the better development of the refined fish. Consequently, present data can likewise be utilized by fish ranchers for refining the carp species and fisheries scientists for fish recognizable proof by utilizing these morphological characters.
Declaration of Competing Interest
The authors declare that they have no known competing financial interests or personal relationships that could have appeared to influence the work reported in this paper.
References
- Study of the length-weight relationship and condition factor of five fish species from Nkoro River, Niger Delta, Nigeria. Curr. Res. J. Biol. Sci.. 2009;1(3):94-98.
- [Google Scholar]
- Thermal property of regioregular poly (3-hexylthiophene)/nanotube composites using modified single-walled carbon nanotubes via ion irradiation. Nanotechnology. 2006;17(24):5947-5953.
- [Google Scholar]
- Length-Weight Relationship in Terapon puta (Cuvier, 1829) Collected from Karachi Fish Harbour. J. Appl. Environ. Biol. Sci.. 2015;5(10):1-5.
- [Google Scholar]
- A novel three-stage bioreactor for the effective detoxification of sodium dodecyl sulphate from wastewater. Water Sci. Technol.. 2017;76(8):2167-2176.
- [Google Scholar]
- Australian and New Zealand guidelines for fresh and marine water quality. In: Australian and New Zealand Environment and Conservation Council and Agriculture and Resource Management Council of Australia and New Zealand. 2000. p. :1-103.
- [Google Scholar]
- Water quality and bacterial populations in a tropical marine cage culture farm. Aquac. Res.. 1998;29(9):617-624.
- [Google Scholar]
- Morphometric Approach towards Growth Performance of Mahseer (Tor tor) in River Narmada Near Hoshangabad (MP) Indian J. Pharmaceut. Biol. Res.. 2015;3(02):66-72.
- [Google Scholar]
- Causes and significance of morphological variation in fishes. Syst. Zool.. 1961;10:105-117.
- [Google Scholar]
- Water quality guidelines for the management of pond fish culture. International journal of environmental sciences. 2013;3(6):1980-2009.
- [Google Scholar]
- Studies on some aspects of habitat ecology of the Mahseer Tor putitora (Ham.) from foothill-stretch of Ganga in relation to altered ecological conditions. Srinagar (Garhwal): HNB Garhwal University; 1997. DPhil Thesis
- Fishes of dacca. Vol No. 13. Asiatic Society of Pakistan; 1964.
- Bolorunduro, P. I., & Abdullah, A. Y. (1996). Water quality management in fish culture, National Agricultural Extension and Research Liaison Services, Zaria. Extension Bulletin, (98).
- A new look at the assessment of the silver carp (Hypophthalmichthys molitrix Val.) as a food fish. Czech J. Food Sci.. 2011;29(No. 5):487-497.
- [Google Scholar]
- Length–weight relationships for 25 fish species from three coastal lagoons in S outheastern B razil. J. Appl. Ichthyol.. 2014;30(1):248-250.
- [Google Scholar]
- Fulton, T. W. (1902). Rate of growth of sea fishes. Neill & Company.
- Fish diversity of the River Choto Jamuna, Bangladesh: present status and conservation needs. Int. J. Biodivers. Conservat.. 2013;5(6):389-395.
- [Google Scholar]
- Length-weight, length-length relationship and condition factor of Garra rufa in Cholvar River of Iran. World J. Fish Marine Sci.. 2013;5(4):358-361.
- [Google Scholar]
- Length–weight relationship and condition factor of wild, grow-out and ‘loose-shell affected’giant tiger shrimp, P enaeus monodon (F abricius, 1798) (D ecapoda: P enaeidae) J. Appl. Ichthyol.. 2014;30(1):251-253.
- [Google Scholar]
- Allometry and size in ontogeny and phylogeny. Biol. Rev. Camb. Philos. Soc.. 1966;41(4):587-638.
- [Google Scholar]
- Commercial aquaculture in Southeast Asia: Some policy lessons. Food Policy. 2009;34(1):102-107.
- [Google Scholar]
- Length–weight relationships of fishes collected from the Korangi-Phitti Creek area (Indus delta, northern Arabian Sea) J. Appl. Ichthyol.. 2010;26(3):477-480.
- [Google Scholar]
- Length-weight relationships of some important estuarine fish species from Merbok Estuary, Kedah. J. Natl. Sci. Res.. 2012;2(2):8-19.
- [Google Scholar]
- Age and growth of golden mahseer Tor putitora from Pong reservoir, Himachal Pradesh, India. Himalayan J. Environ. Zool.. 2003;17(1):17-29.
- [Google Scholar]
- Assessment of Metal Pollution around Sabal Drainage in River Nile and its Impacts on Bioaccumulation Level, Metals Correlation and Human Risk Hazard using Oreochromis niloticus as a Bioindicator. Turkish Journal of Fisheries and Aquatic Sciences. 2016;16:227-239.
- [Google Scholar]
- Aliens; a catastrophe for native fresh water fish diversity in Pakistan. J. Animal Plant Sci.. 2011;21(2):435-440.
- [Google Scholar]
- A review of introduction of common carp Cyprinus carpio in Pakistan: origin, purpose, impact and management. Croat. J. Fisheries. 2016;74(2):71-80.
- [Google Scholar]
- Komen, J. (1990). Clones of common carp, Cyprinus carpio= New perspectives in fish research (Doctoral dissertation).
- Length-weight relationship and seasonal effects of the Summer Monsoon on condition factor of Terapon jarbua (Forsskål, 1775) from the wider Gulf of Aden including Socotra Island. J. Appl. Ichthyol.. 2013;29(1):274-277.
- [Google Scholar]
- Growth patterns, sex ratios and fecundity estimates in blue crab (Callinectes amnicola) from Yewa River, Southwest Nigeria. Growth. 2013;7(56):60.
- [Google Scholar]
- The length-weight relationship and seasonal cycle in gonad weight and condition in the perch (Perca fluviatilis) J. Anim. Ecol.. 1951;20(2):201.
- [Google Scholar]
- Length-Weight Relationship of Crescent Perch Terapon Jarbua (Forsskal) from Parangipettai Coast, South East Coast of India. J. Aquacult. Res. Devel.. 2013;4(4):1.
- [Google Scholar]
- Effects of water depth on growth performance of Indian major carps at a poly culture system in Bangladesh. Int. J. Aquac. Fish Sci.. 2019;5(3):014-021.
- [Google Scholar]
- Length–weight and length–length relationships of fish species from the Aegean Sea (Greece) J. Appl. Ichthyol.. 2002;18(3):200-203.
- [Google Scholar]
- Natural history of Garhwal Himalayan Mahseer: Racial composition. Indian J. Anim. Sci.. 1988;58(2):283-294.
- [Google Scholar]
- − Fish and crustacean communities and fish lengthweight relationship of Lutong River, Miri, Sarawak, Malaysia. World J. Fish Mar. Sci.. 2012;4:102-110.
- [Google Scholar]
- Length frequency distribution, length-weight relationship and condition factor of cichlid fishes (Teleostei: Cichlidae) from the New Calabar River, Nigeria. Iran. J. Ichthyol.. 2018;5(1):74-80.
- [Google Scholar]
- Length weight relationship and condition factor of Liza macrolepis (Smith, 1946) in Chilika Lagoon, Odisha, India. J. Global Biosci.. 2013;2(5):116-120.
- [Google Scholar]
- Notes on length-weight relationship and condition factor of fresh water fish, Labeo boga (Hamilton)(Cypriniformes: Cyprinidae) Univers. J. Zool., Rajshahi University. 2008;27:97-98.
- [Google Scholar]
- Water irrigation chemistry of underground water in Hub valley, Karachi (Pakistan) J. Chem. Soc. Pak.. 2005;27(6):585-589.
- [Google Scholar]
- Immunomodulatory effectiveness of fish oil and omega-3 fatty acids in human non-melanoma skin carcinoma cells. J. Oleo Sci.. 2016;65(3):217-224.
- [Google Scholar]
- Morphometric measurement, relative abundance and effect of physico-chemical parameters of water on ichthyofaunistic diversity of River Tochi District North Waziristan (Newly Merged District), Khyber Pakhtunkhwa. Pure Appl. Biol.. 2020;9(1):501-506.
- [Google Scholar]
- Fasciectomy and conservative full thickness skin grafting in Dupuytren's contracture. The fish technique. Acta orthopaedica belgica. 2006;72(6):678.
- [Google Scholar]
- Weight length and condition factor relationship of Sperata sarwari (Singhari) from Mangla Lake, Pakistan. J. Animal Plant Sci.. 2008;18(4):158-161.
- [Google Scholar]
- Experiments on meristic and other characters in fishes. 1. On the influence of temperature on some meristic characters in sea trout and the fixation period of these characters. Medd. Dan. Fisk. Havenders.. 1944;11(3):1-66.
- [Google Scholar]
- Ujjania N C, Kumar G, Langar R K and Krishna G. 2012. Biometric studies of Mahseer (Tor tor Ham. 1822) from Bari Talab (Udaipur), India. Int. Res. J. Biol. Sci. 2(3): 138–41.
- Gonadal state and condition factor of Oreochromis niloticus (Linnaeus 1758) in a hypereutrophic lake. J. Water Resour. Ocean Sci.. 2013;2(6):165-169.
- [Google Scholar]
- Ecology of Teleost Fishes. Dordrecht: Springer Netherlands; 1989. p. :32-72.
- World Health Organization. (1993). Guidelines for drinking-water quality. World Health Organization.
- Length-weight relationship of Gulf of Thailand fishes. Naga, ICLARM Quarterly. 1994;17(4):48-52.
- [Google Scholar]
- Length-weight relationshisp and relative conditions factor for the halfbeak Hemiramphus far Forsskå l, 1775 from the Karachi coast. Univers. J. Zool., Rajshahi University. 2008;27:103-104.
- [Google Scholar]
- Zafar, M., Nazir, A., Akhtar, N., Naqvi, S. M., & Zia-ur-Rehman, M. (2002). Studies on meristic counts and morphometric measurements of mahseer (Tor putitora) from a spawning ground of Himalayan foot-hill river Korang Islamabad, Pakistan.
- Length weight relationship and relative condition factor of Sebarau, Hampala macrolepidota (Van Hasselt) in Kenyir Lake, Malaysia. Pakist. J. Biol. Sci.. 2000;3(5):721-724.
- [Google Scholar]
- Length-weight relationship, condition and relative condition factor of four mugilid species (Familymugildae) from the Karachi Coast of Pakistan. J. Coast. Dev.. 2014;17(385):1-6.
- [Google Scholar]


