

Translate this page into:
Foliar application of humic acid at heading improves physiological and agronomic characteristics of durum wheat (Triticum durum L.)
⁎Corresponding author. arzu.usm@gmail.com (Arzu Mutlu)
-
Received: ,
Accepted: ,
This article was originally published by Elsevier and was migrated to Scientific Scholar after the change of Publisher.
Peer review under responsibility of King Saud University.
Abstract
Background
Crop production with lesser use of chemicals have attracted significant attention due to better quality. Organic manures are commonly used to fulfill the nutrient requirements of crop plants in organic farming. Humic acid could help to further improve the growth and productivity of crop plants in organic farming. Therefore, this study assessed the role of humic acid in improving physiological and agronomic attributes of durum wheat (Triticum durum L.).
Methods
Five different doses of humic acid, i.e., 0 (H0), 1.5 (H1), 2.5 (H2), 3.5 (H3) and 4.5 (H4) L/ha were applied at two different phenological stages, i.e., stem elongation (SE) and heading (H) of wheat in organic field. Durum wheat variety ‘Burgos’ widely cultivated in Turkey was used as plant material. Data relating to chlorophyll index (CC), flag sheet area (FSA), proline content (PC), plant height (PH), protein ratio (PR), and grain yield (GY) were recorded.
Results
Different physiological and agronomic traits were significantly affected by humic acid doses and growth stages. Overall, the lowest values of CC, FSA, PC, PH and GY were noted for H0, whereas H4 resulted in the highest values of these traits. Grain yield was 3882.82 kg ha−1 in H0 and increased to 4988.14 kg ha−1 (28 %) in H4 dose of humic acid. The GY was decreased, whereas PC and PR increased in the second year of the experiment due to warmer and drier weather conditions. The highest PC values were noted in H0, and the PC values decreased with the increase in humic acid doses.
Conclusion
Humic acid application created favorable growing environments for plant growth. Overall, the application of H4 dose at heading stage resulted in the highest yield and related traits. Therefore, it is recommended that application of 4.5 L/ha humic acid at heading stage could be used to improve durum wheat yield under organic farming.
Keywords
Humic acid
Grain yield
Proline content
Chlorophyll index
Regression analysis

1 Introduction
Wheat is extensively cultivated cereal in the world and Turkey. Approximately 25 % of global wheat production is durum wheat (Anonymous 2021). Nearly half of the global durum wheat production comes from Mediterranean basin countries, including Turkey (Sukumaran et al., 2018). Approximately 25 % of the 17.6 million tons of wheat produced in Turkey is durum wheat (Anonymous, 2022). Cool climate cereals, especially wild forms of durum and bread wheat, are naturally found in the mountains, plains, and pastures of southeastern Anatolia, Turkey. Production high quality durum wheat in the Mediterranean basin is related to suitable climatic conditions in the region. Sudden increase in temperature suppresses milk production period near to crop harvest ceases starch accumulation and improves protein accumulation, which results in better quality (Xynias et al. 2020).
The use of organic fertilizers such as humic acid, manure and organic liquid fertilizers is gaining importance to conserve ecological balance. Humic acid is an important component of soil organic matter resistant to decomposition. It is effective in loosening heavy-textured clay soil, facilitate water infiltration, increase ion exchange capacity and uptake of macro and micronutrients, and improve soil fertility by stimulating soil microorganisms (Turgay et al., 2011; Asık et al., 2012; Gunal et al., 2018). The improvement in physical, chemical and biological conditions of the soil improve plant root system and increase grain yield and quality (Khan and Mir 2002; Anwar et al., 2016) In addition, humic substances increase water holding capacity in the plant root zone (Khaled and Fawy, 2011). In addition to aforementioned benefits, humic acid applied to leaves has significant effects on photosynthesis activity, gas exchange in the leaves, increasing the tolerance of the plant to abiotic environmental conditions and most of the vital interactions in the plant (Radwan et al., 2015). Elshabrawi et al. (2015) reported that the grain protein ratio of wheat increased from 10.1 to 11.41 %, and the grain yield increased from 2990.0 to 3414.1 kg ha−1 with the increase in foliar humic acid application dose.
Kandil et al. (2016) emphasized that foliar application of humic acid increased the protein and starch ratios in wheat grains by 7–8 % and 2–3 %, respectively, compared to the control. Bakry et al. (2013) stated that foliar application of 17 mg L-1 humic acid increased the wheat grain protein ratio by ∼ 63.5 %. Humic substances are important soil and plant regulators, promote plant growth and exert positive effects on plant nutrient uptake. The amount of organic matter, nitrogen (N), phosphorus (P) and potassium (K) in the soil increased by 9, 30, 166 and 52 %, respectively with the application of humic acid (Arjumend et al., 2015). Merwad (2019) showed that humic acid applied to durum wheat significantly increased plant height, grain yield and grain weight. Similarly, Tenikecier and Oner (2018) stated that humic acid applied to the leaves improved grain quality parameters such as wet gluten, gluten index, protein ratio, hectoliter weight and sedimentation of durum wheat. Muhammad et al. (2013) obtained the highest grain yield from manure + humic acid mixture, they stated that manure increased the efficiency of humic acid. Dincsoy and Sonmez (2019) also pointed out that humic acid improves vegetative and generative development of durum wheat and has significant effects on grain yield. Khan et al. (2018) reported that humic acid applied to durum wheat increased the grain yield by 21 % compared to control.
Humic acid application increases the effectiveness of chemical fertilizers (Arjumend et al., 2015) Arjumend et al. (2015) pointed out that humic acid applied to wheat increased stem length by 18 %, root length by 29 %, leaf chlorophyll content by 96 %, and soil organic matter content by 9 %. The researchers also reported significant correlations between grain yield and chlorophyll content. Anwar et al. (2016) reported that 1.5 ton/ha humic acid application to soil increased wheat plant height to 109 cm, number of ears to 267 m−2, 1000-grain weight to 46.3 g, number of grains per ear to 49 and grain yield to 3316 kg ha−1 compared to control. Habashy and Laila (2005) stated that humic acid significantly increased uptake of macro nutrients such as N, P and K. In addition, the researchers showed that, the improvement of the organic matter composition of soil increased population density of beneficial soil microorganisms such as bacteria, actinomycetes, protozoa and algae (Tufail et al., 2014).
Humic acid treatments improve nitrogen uptake, photosynthetic activity and chlorophyll content nts depending on nitrogen uptake, and increase protein synthesis and protein content at cellular level (Cimrin and Yilmaz, 2005; Yasin and El-Sobky, 2017). Alfatlawi and Alrubaiee (2020) reported that foliar application of humic acid increases photosynthesis activity and carbohydrate production; therefore, carbohydrates are transferred to the shoots and leaves more quickly. They also stated that humic acid treatments increase plant height, chlorophyll content, number of spikes per m−2, number of grains per spike and grain yield. Foliar application of humic acid increases grain protein and gluten value, plant height, grain yield and 1000 grain weight (Kara, 2015; Warda et al., 2019). Vasenko and Haiyan (2018) expressed that humic acid applied during the heading stage of wheat increased chlorophyll pigments and improved physiological function.
Piccolo et al. (1992) indicated that humic acid regulates stress hormone level produced by the plants under abiotic and biotic stress conditions. Proline exhibits an antioxidant activity by reducing the effectiveness of reactive oxygen species under stress conditions and plays an important role in healthy photosynthetic activity (Ashraf et al., 2008; Ismail and Helmy, 2018). Humic molecules increase leaf water retention of wheat and activate photosynthetic and antioxidant metabolism under stress conditions (Hegab et al., 2020). Foliar application of humic acid increases metabolic activities such as photosynthetic pigment, total soluble sugar, total carbohydrates, total amino acids and proline in leaves, and mineral content such as N, P, K, Ca and Mg (Fahramand et al., 2014).
There is no report stating that the durum wheat grown under organic farming practices could produce comparable yield with conventional modern agricultural practices. This study determined whether humic acid and manures collectively could help to achieve comparebale durum wheat yield under organic farming. The effects of different humic acid treatments on morphological, physiological and biochemical characteristics of durum wheat were inferred. The results would be helpful to improve durum wheat production under organic farming.
2 Materials and methods
2.1 Plant material and experimental site
Durum wheat variety ‘Burgos’ produced in different parts of the world, especially in Mediterranean countries, was used as plant material in the study.
The experiment was conducted at the organic research field, Akcakale Vocational School, Harran University, Sanliurfa Turkey during 2019–20 and 2020–21. The location of experimental field lies between 36◦ 43′ 10′’ N and 38◦ 56′ 48′’ E longitudes and average altitude is 362 m. The study area is affected by dry and hot tropical air masses during the summer season, which occurs due to the low-pressure of Basra region.
The average temperature in the second year of the experiment was higher, and the relative humidity and total precipitation were lower. Semi-arid climatic conditions are dominant in the experimental region. The climate characteristics of the study area during the durum wheat growing seasons are shown in Fig. 1.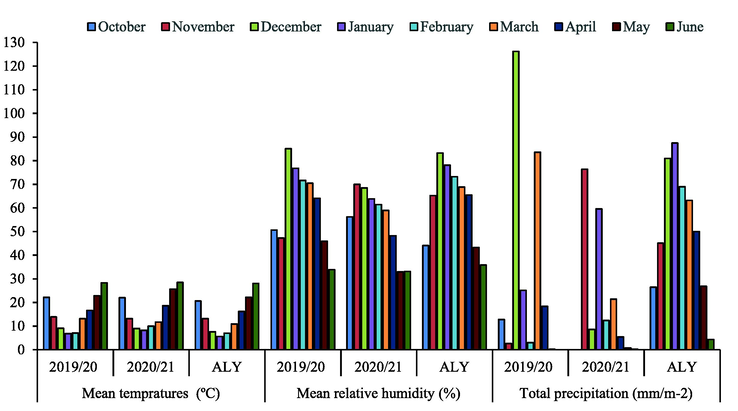
Weather data of the experimental site area. The values presented are monthly averages, whereas ALY represents long-term average (1929–2021) of the relevant parameter in the study region.
2.2 Characteristics of soil, humic acid, and manure
The electrical conductivity (EC) of soils in the experimental field indicates no salinity problem. The soil of the experimental site was clay-textured with average pH value of 8.11, and organic matter content was >1 %. In addition, soil was rich in available potassium, poor in zinc content. Soil characteristics of the experimental site are given in Table 1.
Soil properties
2019/20
2020/21
Mean
EC (dS m−1)
0.98
1.23
1.11
pH
8.34
7.87
8.11
Organic matter (%)
1.34
1.54
1.44
Lime (CaCO3) (%)
34.84
33.02
33.93
Sand (%)
13.43
12.91
13.17
Clay (%)
68.22
70.22
69.22
Silt (%)
18.35
16.87
17.61
P2O5 (kg ha−1)
62.34
56.45
59.40
K2O (kg ha−1)
2235
2605
2420.00
Cu (mg kg−1)
1.41
1.29
1.35
Mn (mg kg−1)
4.65
5.02
4.84
Fe (mg kg−1)
4.87
5.10
4.99
Zn (mg kg−1)
0.97
1.11
1.04
Fermented manure was rich in organic matter, and pH value was within acceptable limits for plant growth. The macro and micronutrient contents of manure were enough to support plant growth. Humic acid was composed of carbon (60.10 %), oxygen (31.93 %), hydrogen (2.30 %) and nitrogen (4.30 %). The ratios of hydroxyl (OH) and carboxylic acid (COOH), which are functional groups of humic acid, were 0.15 % and 1.22 %, respectively. The chemical content of manure and humic acid are given in Table 2. Humic acid used in the study was in the consistency of grape molasses, fluid and black in color.
ingredients of barnyard manure
Value
Humic acid
(%)
Total organic matter (%)
40.12
C
60.10
organic nitrogen (%)
1.00
N
4.30
pH
7.23
COOH
1.22
K (%)
2.04
OH
0.15
P (%)
2.43
O
31.93
Mg (%)
1.13
H
2.30
Fe (%)
0.24
Zn (ppm)
129.08
Mn (ppm)
90.67
Free amino acids (%)
8.09
2.3 Experimental design and crop establishment
The experiment was laid out according to randomized complete block design with split-plot arrangement and 4 replications. The phenological stages (PP) were kept in the main plots, whereas humic acid doses (T) were randomized in subplots. A total of 20 t ha−1 manure was applied uniformly to whole experimental field before sowing. Humic acid was sprayed with knapsack sprayer during stem elongation (vegetative) and heading (reproductive) stages according to the treatments.
Seeds were sown on November 20 and November 26 in the first and second year of the experiment, respectively. Sowing was manually done on opened incisors keeping row spacing of 20 cm. Each plot was 5 m length and 1.2 m width, and the size of each plot was 6 m2 (5 m × 1.2 m). Sowing depth was done at a depth of 4 to 6 cm with seed of 475 seeds m−2. An isolation distance of 1 m was maintained between plots and 3 m between blocks. Sowing was done according to the method of Akkaya (1994). Chemical fertilizers, weeds and pesticides were not used. Fermented manure distributed homogeneously with a rake and mixed into the soil (Tan and Serin, 1995).
The experimental field was irrigated using sprinklers to ensure a homogeneous seed germination. Plants were irrigated during both growing seasons at tillering, stem elongation, heading and ripening growth stages. The amount of water applied in the first and second year of the study was 188 and 244 mm, respectively.
Harvest time was carefully followed to prevent grain losses. Harvesting was done with combine harvester when the stems, leaves and heads of the plants turned yellow moisture in the spike and grain decreased <12 %.
2.4 Data collection
2.4.1 Chlorophyll index
The SPAD readings were taken to determine the chlorophyll index of plants with the help of SPAD meter (Minolta SPAD-502). The SPAD readings were taken from flag leaves of 10 randomly selected plants in each plot after the application of humic acid during the stem elongation and heading periods and at the end of the heading period. Chlorophyll index representing humic acid application period and dose were obtained by calculating the averages of the recorded values (Reynolds et al., 1998).
2.4.2 Plant height
Plant heights were measured at the end of the heading period. The heights of 10 randomly selected plants from each plot were recorded by using a ruler, from the soil level to the tip of the top spikelet, excluding the awns (Mwadzingeni et al., 2016).
2.4.3 Flag sheet area
Flag sheet area (FSA) was calculated by measuring the longest width at center (WC) of the flag leaf on the side attached to the main stem and the flag sheet length (FSL) from the attachment point to the tip of the leaf of 10 randomly selected plants in each plot, following humic acid applications at the end of the heading period (Eq.1) (Hasan et al., 2019).
2.4.4 Protein ratio
Two hundred grams of wheat samples taken from the harvested plots were cleaned from foreign materials such as stem, straw, and stones. The protein ratios of samples were determined using a FOSS NIRS 6500 spectroscopy device calibrated using Celdhl NIT (near infrared transmittance) technique according to the ICC standard method (AACC Method 46–30) (Kamboj et al., 2020).
2.4.5 Grain yield
One row from the right and left side, and 50 cm from the beginning and end of each plot were considered as edge effect. The remaining 0.8 × 5 m = 4 m2 area was harvested with a combine harvester. After cleaning the stem, straw, soil and other materials, the grains were weighed (g) and the yield was converted to kg ha−1 (Mwadzingeni et al., 2016).
2.4.6 Proline content
Three randomly selected flag leaves from each plot were harvested with a sharp scalpel after humic acid applications during stem elongation and heading phases. A total of 100 mg flag leaves harvested from the experimental plots were weighed on a precision scale and wrapped in aluminum foil. Flag leaf samples wrapped in aluminum foil were quickly transported to the laboratory in liquid nitrogen tank at −198 °C and placed in a refrigerator at −20 °C. Proline content of leaves was analyzed according to method of Bates et al. (1973). Proline analysis processes are shown in Fig. 2.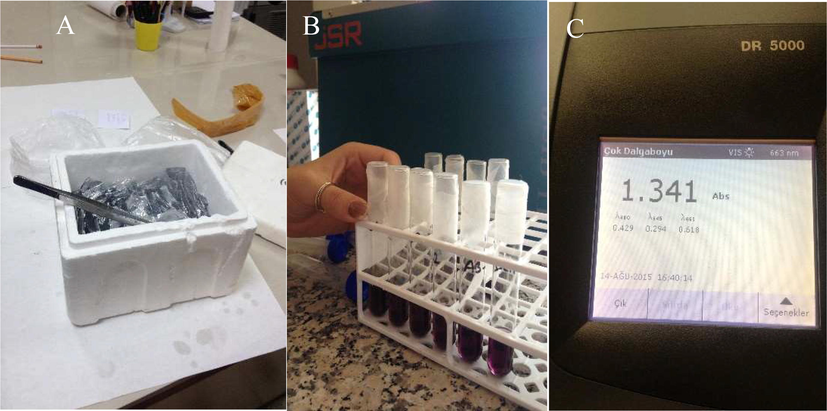
Determination of proline content in liquid nitrogen after flag leaves are harvested (A), preparation of proline standards (B) and Proline readings in the spectrophotometer (C).
Toluene, sulfosalicylic acid (SSA) (3 %), ninhydrin, phosphoric acid (FA) and glacial acetic acid (GAA) were used in laboratory analysis. The ninhydrin reagent was prepared by mixing 1.25 g of ninhydrin, 30 mL of GAA and 20 mL of 6 M H3PO4 (FA) in a magnetic stirrer heater and the solution was kept at 4 °C in the refrigerator. For the preparation of proline standards, 0.01 g of proline was weighed and dissolved in 100 mL of SSA (3 %). Sub-stocks were prepared by using 0, 1, 2, 4, 8 and 16 ppm from the main stock.
Hundred mg of leaf samples were homogenized in 2.5 mL of 3 % SSA, placed in 50 mL glass beakers and filtered through filter paper. The 2 mL of the filtrate was taken and transferred to the glass tubes. The 2 mL of GAA and 2 mL of acid ninhydrin reagent (cold) was added to each glass tube. For standards, 2 mL of standard stock + 2 mL of GAA + 2 mL of ninhydrin was used. For the blanks, 2 mL of SSA + 2 mL of GAA + 2 mL of ninhydrin was used.
All tubes with a total volume of 6 mL were incubated in a water bath at 100 °C for 1 h and were cooled in an ice bath. The 4 mL of toluene (cold) was added to all tubes and vortexed for 5 min. The toluene phase in the solution risen to the top and this phase was taken out with a pipette. In the last step, the toluene phase was pipetted into 3 mL quartz cuvettes and the absorbances of the samples at 520 nm were read using a spectrophotometer. The proline concentration was calculated using the eq (2):
In the equation, 115.5 is the molecular weight of proline (Bates et al., 1973).
2.5 Data analysis
Statistical analysis for the data collected on different growing seasons was performed separately due to significant differences among years. Furthermore, data of both years were pooled and analyzed to assess the overall effects. The data were tested for normality prior to analysis which indicated a normal distribution. Therefore, statistical analyses were performed on original non-transformed data. Two-way analysis of variance (ANOVA) including degrees of freedom and F ratio of all parameters in combined years were carried out using JMP13.2.0 statistical software. Least significance difference (LSD) multiple comparison post hoc test was used to compare the means where ANOVA indicated significant differences. In addition, regression analysis was performed between humic acid doses and GY and PC. The values of parameters such as PH, FSA and CC recorded in the stem elongation and heading periods were compared by bar graphs.
3 Results
All studied parameters were significantly affected by years (P ≤ 0.01). The difference in GY, PH, PR, CC and PC was significant (P ≤ 0.05) between phenological periods (PP), while it was significant (P ≤ 0.01) for FSA only in combined years. Humic acid treatments (T) were significant (P ≤ 0.01) for all parameters in combined years analysis. The interaction of PP × T was non-significant for all parameters except CC in the combined years. The F ratio and degrees of freedom values of variance analysis for all parameters in combined years are given in Table 3. Here, * = significant at 0.05 level of probability, ** = significant at 0.01 level of probability, ns = non-significant, DF = degrees of freedom, CV = coefficient of variation, R = replication, Y = year, PP = phenological stage, T = treatment.
Source
DF
F ratio
Grain yield
Plant height
Protein ratio
Flag sheet area
Chlorophyll index
Protein contents
Y
1
35.239**
23.564**
15.928**
24.024**
45.392**
12.924**
R (Y)
6
4.683
1.311
1.741
3.651
5.936
6.345
PP
1
66.131**
29.421**
14.587**
4.744*
77.214**
17.083**
Y*PP
1
2.607 ns
0.044 ns
1.621 ns
0.002 ns
1.131 ns
4.646*
R*PP*Y
6
2.716
0.872
3.351
2.403
2.316
1.341
T
4
122.658**
73.166**
29.289**
73.065**
158.813**
34.820**
Y*T
4
1.172 ns
0.098 ns
1.763 ns
2.084 ns
0.919 ns
3.276**
PP*T
4
2.285 ns
0.186 ns
0.639 ns
1.727 ns
3.008*
0.583 ns
Y*PP*T
4
0.658 ns
0.308 ns
0.240 ns
0.575 ns
1.032 ns
1.143 ns
Error
48
CV (%)
3.63
4.93
8.17
4.58
4.81
15.77
Mean
4515.20
77.26
12.43
31.01
47.95
46.73
The GY, PH and PR were significantly affected by Y, PP and T (Table 4). The GY in the first year of the experiment was 4623.97 kg ha−1, while it was 4406.43 kg ha−1 in the second year. The mean GY recorded in the first year was 4.70 % higher than second year. The highest GY (4988.14 kg ha−1) in both growing seasons was obtained in H4 treatment, whereas the yield in H3, H2, H1 and H0 treatments was 1.80, 9.35, 14.10 and 22.16 %, lower than H4, respectively. Generally, humic applied at heading had positive effect on GY. The highest (4664.20 kg ha−1) GY was obtained for humic acid application at heading, while the lowest (4366.19 kg ha−1) GY was obtained in the stem elongation period (Fig. 3). Here, * and ** significant at 0.05 and 0.01 levels of probability, respectively, NS = non-significant, T = treatments, PP = phenological stages, SE = stem elongation, H = heading, H0 = control, H1 = 1.5 L/ha−1, H2 = 2.5 L/ha−1, H3 = 3.5 L/ha−1, H4 = 4.5 L/ha−1, Y = year. Means followed by different letters within a column are significantly different from each other at 99 or 95 % probability level.
Grain yield (kg ha−1)
Years
2019–20
2020–21
Years average
PP/T
SE
H
Mean
SE
H
Mean
SE
H
Mean
H0
3949.43 g
4174.98f
4062.20e
3596.63
3810.25
3703.44d
3773.03
3992.61
3882.82d
H1
4296.10ef
4475.55de
4385.83d
3946.95
4420.58
4183.76c
4121.53
4448.06
4284.79c
H2
4610.00 cd
4624.80 cd
4617.40c
4306.95
4545.28
4426.11b
4458.48
4585.04
4521.76b
H3
4773.33bc
5138.30a
4955.81b
4630.85
5051.43
4841.14a
4702.09
5094.86
4898.48a
H4
4893.88b
5303.33a
5098.60a
4657.83
5097.55
4877.69a
4775.85
5200.44
4988.14a
Mean
4504.55b
4743.39a
4623.97a
4227.84b
4585.02a
4406.43b
4366.19b
4664.20a
CV (%)
2.91
4.28
3.63
LSDPP = 87.77**
T = 138.78**
PP × T = 196.26*PP = 123.20**
T = 194.80**
PP × T = nsY = 73.68**
PP = 73.68**
T = 116.50**
PP × T = ns
Plant height (cm)
H0
71.78
65.41
68.60d
66.03
61.89
63.96d
68.91
63.65
66.28d
H1
75.45
73.03
74.24c
72.51
66.98
69.75c
73.98
70.01
71.99c
H2
82.33
78.97
80.65b
78.52
73.64
76.08b
80.43
76.31
78.37b
H3
88.23
83.63
85.93a
84.06
80.62
82.34a
86.14
82.12
84.13a
H4
89.98
84.50
87.24a
86.86
80.85
83.86a
88.42
82.68
85.55a
Mean
81.55a
77.11b
79.33a
77.60a
72.80b
75.20b
79.57a
74.95b
CV (%)
4.71
5.16
4.93
LSD
PP = 2.44**
T = 3.86**
PP × T = nsPP = 2.53**
T = 4.01**
PP × T = nsY = 1.71**
PP = 1.71**
T = 2.71**
PP × T = ns
Protein ratio (%)
H0
9.31
9.44
9.37c
11.16
11.71
11.44c
10.24
10.58
10.41d
H1
11.42
11.79
11.60b
11.02
12.81
11.91c
11.22
12.30
11.76c
H2
11.90
13.01
12.45ab
12.29
13.95
13.12b
12.09
13.48
12.79b
H3
12.70
13.14
12.92a
13.36
14.15
13.76ab
13.03
13.65
13.34ab
H4
13.12
13.95
13.54a
13.69
14.68
14.18a
13.41
14.31
13.86a
Mean
11.69
12.27
11.98b
12.30b
13.46a
12.88a
12.00b
12.86a
CV (%)
9.91
6.27
8.17
LSD
PP = ns
T = 1.23**
PP × T = nsPP = 0.53**
T = 0.83**
PP × T = nsY = 0.46**
PP = 0.46**
T = 0.72**
PP × T = ns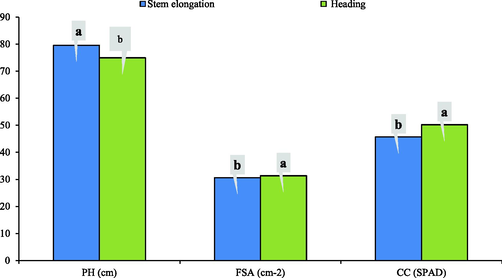
Changes in physiological parameters during two different phenological stages. Humic acid applied at heading stage had more positive impact on grain yield, agronomic and physiological parameters compared to its application at stem elongation stage.
Plant height was similar to the results recorded for GY in both growing seasons, while they were different for humic acid application at different phenological periods. The mean plant height was 79.33 cm in the first growing season, while shorter plants were obtained in the second growing season (75.20 cm). The highest plant height (85.55 cm) in both growing periods was obtained in H4 treatment, while the lowest plant height (66.28 cm) was recorded in the control. The highest plant height (79.57 cm) between the phonological periods was recorded for humic acid application at stem elongation period, while the lowest plant height (74.95 cm) was obtained in the heading period (Fig. 3).
The precipitation in the second year was lower than first year, and drier weather conditions increased the protein accumulation in the grains. The PR (12.88 %) in the second year was higher than first year (11.98 %). The highest PR (13.86 %) was obtained in H4, while the lowest PR value (10.41 %) was recorded in the control (Table 4).
The mean values of physiological characteristics such as FSA, CC and PC are shown in Table 5. The mean FSA in the first year was 31.79 cm2, which decreased by about 4 % in the second year of the study. Like other parameters, the FSA values increased with the increase in humic acid dose. The highest FSA value was noted with the application of the highest humic acid dose, while the lowest value was obtained in the control treatment. The FSA values were significantly different between phenological periods. The mean FSA values of the heading and stem elongation phenological periods were 31.36 and 30.66 cm2, respectively. Here, * and ** significant at 0.05 and 0.01 levels of probability, respectively, NS = non-significant, T = treatments, PP = phenological stages, SE = stem elongation, H = heading, H0 = control, H1 = 1.5 L/ha−1, H2 = 2.5 L/ha−1, H3 = 3.5 L/ha−1, H4 = 4.5 L/ha−1, Y = year. Means followed by different letters within a column are significantly different from each other at 99 or 95 % probability level.
Flag sheet area (cm−2)
Years
2019–20
2020–21
Years average
PP/T
SE
H
Mean
SE
H
Mean
SE
H
Mean
H0
28.65
28.44
28.55e
26.38
24.86
25.62d
27.52
26.65
27.08e
H1
29.72
30.46
30.09d
27.14
28.59
27.87c
28.43
29.53
28.98d
H2
31.77
31.87
31.82c
29.94
31.27
30.61b
30.86
31.57
31.21c
H3
33.05
33.85
33.45b
32.65
33.66
33.15a
32.85
33.67
33.30b
H4
34.00
36.08
35.04a
33.34
34.48
33.91a
33.75
35.28
34.48a
Mean
31.44
32.14
31.79a
29.89
30.57
30.23b
30.66b
31.36a
CV (%)
4.68
4.46
4.58
LSD
PP = ns
T = 1.54**
PP × T = nsPP = ns
T = 1.39**
PP × T = nsY = 0.64**
PP = 0.64*
T = 1.01**
PP × T = ns
Chlorophyll content (SPAD)
H0
39.71
42.64
41.17e
37.21e
37.80e
37.50e
38.46f
40.22ef
39.34e
H1
42.69
45.88
44.29d
39.15de
43.90c
41.52d
40.92e
44.89d
42.90d
H2
46.02
53.02
49.52c
41.13 cd
48.41b
44.77c
43.57d
50.71c
47.14c
H3
51.45
57.32
54.38b
49.73b
55.05a
52.39b
50.59c
56.18b
53.38b
H4
55.88
62.31
59.09a
53.89a
55.88a
54.89a
54.88b
59.10a
56.99a
Mean
47.15b
52.23a
49.69a
44.22b
48.21a
46.21b
45.68b
50.22a
CV (%)
4.90
4.71
4.81
LSD
PP = 1.59**
T = 2.51**
PP × T = nsPP = 1.42**
T = 2.25**
PP × T = 3.18*Y = 1.04**
PP = 1.04**
T = 1.64**
PP × T = 2.32*
Proline content (µg/ DW)
H0
75.27
58.97
67.12a
60.69
61.77
61.23a
67.98
60.37
64.17a
H1
50.55
39.14
44.85b
56.50
50.73
53.61b
53.52
44.93
49.23b
H2
43.44
34.56
39.00bc
52.03
41.61
46.82c
47.74
38.08
42.91c
H3
40.89
32.00
36.45 cd
44.89
48.76
46.82c
42.89
40.38
41.63c
H4
34.58
28.25
31.42d
42.49
37.45
39.97d
38.54
32.85
35.69d
Mean
48.95a
38.58b
43.76b
51.32
48.06
49.69a
50.13a
43.32b
CV (%)
14.22
16.83
15.77
LSD
PP = 4.06**
T × 6.42**
PP × T = nsPP = ns
T = 8.63**
PP × T = nsY = 3.31**
PP = 3.31**
T = 5.24**
PP × T = ns
The CC values in the first and second growing seasons were 49.69 and 46.21 SPAD, respectively. The lowest CC value (39.34 SPAD) was recorded in the control, and the CC value increased by 30.97 % in the H4 treatment compared to the control. The difference in CC values between phenological periods was 9.04 % and the CC values in the heading and stem elongation periods were 50.22 and 45.68 SPAD, respectively.
Mean PC values in the first and second growing seasons were 43.76 and 49.69 µg DW−1, respectively. The highest PC value was obtained in the, while the lowest value was obtained in H4 treatment. The PC value was 43.32 µg DW−1 during the heading period and 50.13 µg DW−1 during stem elongation period.
Highly significant relationship (P ≤ 0.01) was noted between humic acid treatments and GY. Regression analysis showed a significant (r2 = 0.98, p < 0.01) quadratic relationship between humic acid treatments and grain yield (Fig. 4). The grain yield of durum wheat increased with the increase in humic acid dose. A significant (P ≤ 0.01) relationship was also determined between humic acid treatments and PC. A significant (r2 = 0.98, p < 0.01) quadratic relationship was determined between humic acid treatments and PC (Fig. 5).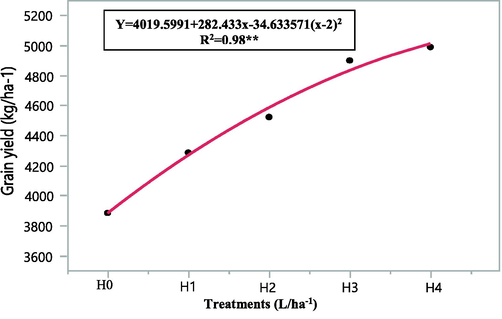
Relationship between humic acid treatments and grain yield.
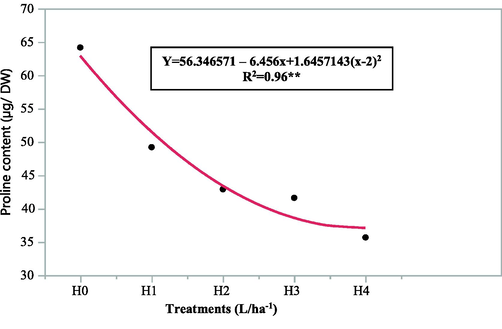
Relationship between humic acid treatments and proline content.
The values of agronomic and physiological parameters such as PH, FSA and CC recorded in the stem elongation and heading periods were significantly different. The mean plant height measured in the heading period was 5.81 % lower than that in the stem elongation period, while the FSA and CC values were higher in the heading period by 2.23 and 9.04 %, respectively. Foliar application of humic acid at stem elongation phase improved plant height, application at heading phase improved GY, FSA and CC.
4 Discussion
The crop was irrigated during both years of the experiment; however, weather data indicated a severe drought during the growing seasons. Sudden increase in temperatures and low relative humidity values in the second year, especially in the post-heading periods, caused an increase in the protein content of the grains, while reduced starch accumulation. This physiological process led to the differences in grain yield between growing seasons. The hydrogen bonds of humic substances increase water binding both in the root zone and in the leaves; thus, it may have contributed to the increase of leaf water holding capacity or the preservation of the existing water capacity. Therefore, increase in humic acid dose increased the GY. The results of physiological parameters such as CC, FSA and PH were in parallel with the results of GY. Merwad (2019) reported that humic substances positively affected plant height and leaf area by promoting cell division, elongation and expansion of cell wall in wheat, which ultimately increased grain yield. The hydrogen bonds of humic acid especially in arid regions increase water holding capacity in the leaf and root zone, which increases yield (Alfatlawi and Alrubaiee, 2020; Baqir and Zeboon, 2019). Like our findings, several other researchers (Yasin and El-Sobky 2017; Sayed et al., 2019) indicated that the increase in humic acid application increased spike length, number of grains per spike, and grain yield. Alfatlawi and Alrubaiee (2020) stated that humic substances improve photosynthesis activity due to presence of amino acid and nutrients; therefore, foliar application of humic acid have positive effects on grain yield and yield components. Muhammad et al. (2013) and Dincsoy and Sonmez (2019) reported that humic acid application during the heading period increased number of spikes, number of grains per spike and grain yield.
Shorter plants were produced in the second year, which had higher temperature and lower relative humidity compared to the first year of the experiment. Contrary to other agronomic and physiological parameters, plant height increased with the application of humic acid at stem elongation period. The results can be explained by the fact that plants concentrate on generative processes instead of vegetative growth during the heading period. Studies comparing 20 kg ha−1 humic acid from soil and 10 mL of L-1 foliar application of humic acid and the control group revealed that he highest plant height, flag leaf area and chlorophyll index values were obtained from foliar application of humic acid (Yasin and El-Sobky, 2017; Al-Tememe and Al-Shammari 2018; Zhao et al., 2018).
The PR, one of the most important grain quality characteristics of durum wheat, was > 12 % in both growing seasons. The organic nitrogen of humic acid increased PR ratios in the grain as the humic acid treatment doses increased. The increase in protein ratio of grains was higher when humic acid was applied at heading stage compared to the stem elongation period. The chlorophyll and protein synthesis in the beginning of the generative stage were at the highest levels, which supported the protein accumulation in the grain. In parallel with our findings Khan et al. (2018) reported that protein content of wheat grains increased with the application of humic acid. Foliar application of humic acid promotes the uptake of macro and micronutrients from soil, as well as has a supportive effect on respiration, photosynthesis, protein, and nucleic acid synthesis in leaves, and regulates the activity of the cell membrane and tonoplast (H+-ATPase) (Tan, 2003; Tejada and Gonzalez, 2003). In a similar study, the increase in humic acid doses increased protein ratios by 2, 5, 8 and 10 % (Elshabrawi et al., 2015). In another study, foliar application of humic acid increased protein ratio in wheat by 63.5 % compared to the control (Bakry et al., 2013). Kandil et al. (2016) stated that 3 L/ha humic acid application to durum wheat leaves increased the protein ratio by approximately 7–8 %. Similarly, the increasing doses of (1.0, 2.0 and 3.0 kg humic acid fad-1) humic acid applications to wheat increased the protein content of wheat by 2.0, 5.3 and 9.4 % (Abdulaziz et al., 2018).
Plants show physiological reflexes such as reducing leaf areas and curling under the extreme drought and heat stress. The adverse climatic conditions experienced in the second year caused a slight decrease in leaf area. The C, H and O bonds of humic substances probably contributed to the healthier photosynthesis activity and to increase the nutrients in the leaves. The difference in FSA values between control and the highest humic acid treatment (H4) was approximately 21.46 %, and the leaf area increased as the humic acid doses increased. Consistent with our findings Ahmed et al. (2008) and Baqir and Zeboon (2019) have also reported that humic acid increased the nutrient uptake from the soil and encouraged plants to produce more nutrients; thus, increased chlorophyll content in leaves, which increased flag leaf area. The humic substances applied to durum wheat regulate soil pH in the root zone, and plant nutrients in the soil with a pH close to 7.0 are released, which increase amino acid concentration in the soil (Yasin and El-Sobky, 2017). These positive changes causes an increase in flag leaf area, plant height and chlorophyll content of the leaves (Altememe and Al-Shammari, 2018).
The values of CC parameter agreed with the data obtained for the FSA parameter. The CC and FSA are proportionally related parameters. The lowest FSA and CC values were obtained in the same growing season. The difference in CC values between years was about 7 %. The results revealed that the CC per unit area of the leaf decreases with the decrease in the leaf area. Humic substances containing C, H, O bonds and organic N had a positive effect on healthy photosynthesis and chlorophyll content. The CC values between phenological periods was significant, and higher CC values were obtained with humic acid application at heading stage. Parvin et al. (2020) found that foliar application of humic acid had a positive effect especially on chlorophyll content and leaf area. The highest chlorophyll a and b content and leaf area index values were obtained in 600 mg L-1 humic acid application, and the highest total chlorophyll content was recorded in 400 mg L-1 humic acid application. Ozbay (2012) and Vasenko and Haiyan (2018) reported that foliar treatments of humic acids increased iron content of leaves. Humic acid substances promote the fringing and elongation of the roots, encourage stem elongation, improve activity of thylakoid membranes in the chlorophyll, regulates gas exchange and promotes the uptake of plant nutrients from soil (Chen and Aviad, 1990; Anwar et al., 2016).
The amount of proline accumulation within the plants can increase 100 or even 1000 times in a short time depending on the intensity of the stress. Proline secreted by the plant allows plants to live comfortably under stress conditions. On the other hand, proline accumulation in large amounts in the tissues can slow down photosynthesis and stomal conductivity to maintain the vitality of plants exposed to severe stresses. This situation adversely affects plant growth and yield. The proline hormone in leaf tissues was >40 µg DW−1 in both growing seasons of the study. Like all other parameters, the proline content was different in growing seasons. However, all other parameters decreased in the second year when the climatic conditions were unfavorable, while proline content increased by 11.93 %. Despite the irrigated conditions in the experiment, the plants used showed a hormonal reaction to the seasonal stress and continued its life cycle in a healthy way. The highest PC value was obtained in the control treatment. The increase in humic acid treatments caused a decrease in PC by 23.28, 33.13, 35.13 and 44.38 %, respectively. The results show that humic acid treatments provided a better environment for plant life cycle. The formation of proline hormone in the leaves decreased with the increase in humic acid doses. Proline, has osmotic protection roles including osmotic regulation (Zadehbagheri et al., 2013), provides membrane stability (Hayat et al., 2012), and sends gene signals to antioxidant enzymes to eliminate reactive oxygen species (Carvalho et al., 2013). Consistent with our findings, Mwadzingeni et al. (2016) stated that the PC values secreted by wheat plants treated with humic acid in drought and optimum conditions varied between 381.18 and 46.72 µg DW−1, respectively. Abhari and Gholinezhad (2019) and Ahmad et al. (2018) reported that humic substances reduce the effect of stress, and the hormone proline is secreted less in humic acid applied plants.
Regression analysis revealed that the elliptic curve obtained between humic acid treatments and grain yield increased with increasing humic acid doses and reached the optimum level after a certain point. The linear increase of the elliptic curve stopped in the H4 treatment, and the grain yield reached the optimum level. The curve started to decrease following the highest humic acid dose.
The elliptic curve obtained between humic acid doses and PC is the reverse of the curve obtained between humic acid doses and GY. The curve showed that the highest PC is obtained in control. The curve decreased vertically with the increase in humic acid treatments and reached the optimum point after a certain point and remained constant. The slope of the curve for H3 and H4 treatments was similar. The results revealed that a humic acid dose between H3 and H4 kept the proline level at the optimum level.
5 Conclusion
The results revealed that humic acid increased photosynthesis activity of plants. Physiological and agronomic parameters recorded higher values when humic acid was applied at heading period compared to stem elongation period. The highest proline hormone was recorded in the control, while it decreased with increasing humic acid dose. Humic substances have created a more comfortable living space for plants. Application of humic acid during the heading period, which is the beginning of the generative period, rather than the stem elongation period would be more appropriate. The highest grain yield and related parameters were noted with the application of highest humic acid dose. Therefore, foliar application of 4.5 L ha−1 humic acid can be recommended for durum wheat cultivation. The humic acid must be combined with manures in organic farming of durum wheat to increase yield.
Declaration of Competing Interest
The authors declare that they have no known competing financial interests or personal relationships that could have appeared to influence the work reported in this paper.
References
- Grain quality and protein yield of three bread wheat cultıvars as affected by some humic acid and compost fertilizer treatments under newly sandy soil condıtıons. Zagazig J. Agric. Res.. 2018;45(3):809-819.
- [Google Scholar]
- Effect of humic acid on grain yield and yield components in chickpea under different irrigation levels. J. Plant Physiol. Breeding. 2019;9(2):19-29.
- [CrossRef] [Google Scholar]
- Effect of humic acid and fulvic acid based liquid and foliar fertilizers on the yield of wheat crop. J. Plant Nutr.. 2018;41(19):2438-2445.
- [CrossRef] [Google Scholar]
- Ammonia volatilization and ammonium accumulation from urea mixed with zeolite and triple superphosphate. Acta Agricultrae Scandinavica Soil and Plant Science. 2008;58:182-186.
- [Google Scholar]
- Akkaya, A. Wheat farming textbook. Sütcü Imam University Journal of Agriculture Faculty Publications. p. 225, 1994.
- Alfatlawi, Z.H.C., Alrubaiee, S., Effect of spraying different concentrations of humic acid on the growth and yield of wheat crop (ipa 99 cultivar) in different stages. Plant Archives 2020; 20(2):1517-1521.http://www.plantarchives.org/SPL%20ISSUE%2020-2/249__1517-1521_.pdf.
- Effect of addition of humic acid and water stress in some growth traits of wheat plant Triticum aestivium L. Euphrates J. Agric. Sci.. 2018;1(3):114-122.
- [Google Scholar]
- Anonymous Turkish Statistical Institute, Production amount of cereals and other plant products in Turkey. 2022 https://data.tuik.gov.tr/Bulten/Index?p=Bitkisel-Uretim-Istatistikleri-2021-37249.
- Anonymous. Food and Agriculture Organization of the United Nations. Record cereal production seen keeping markets adequately supplied in 2021/22. 2021 https://www.fao.org/worldfoodsituation/csdb/en/.
- Response of wheat crop to humic acid and nitrogen levels. EC Agriculture. 2016;3(1):558-565.
- [Google Scholar]
- Effects of lignite-derived humic acid on some selected soil properties, growth and nutrient uptake of wheat (triticum aestivum L.) grown under greenhouse conditions. Pak. J. Bot.. 2015;47(6):2231-2238.
- [Google Scholar]
- Some prospective strategies for improving crop salt tolerance. Adv. Agron.. 2008;97:95-110.
- [CrossRef] [Google Scholar]
- Effects of foliar applications of humic acid on plant growth and mineral nutrients uptake of plant under saline and calcareous conditions. Sakarya University Faculty of Art and Science The Journal of Arts and Science. 2012;14(1):541-548.
- [Google Scholar]
- Effect of humic and ascorbic acids foliar application on yield and yield components of two wheat cultivars grown under newly reclaimed sandy soil. Int. J. Agronomy Plant Production. 2013;4(6):1125-1133.
- [Google Scholar]
- Response of some wheat growth traits for foliar spraying with humic acid glutamic acid. Iraqi J. Agric. Sci.. 2019;50(6):1455-1464.
- [Google Scholar]
- Rapid determination of free proline for water stress studies. J. Plant Soil. 1973;39:205-208.
- [Google Scholar]
- The accumulation of endogenous proline induces changes in gene expression of several antioxidant enzymes in leaves of transgenic swingle citrumelo. Mol. Biol. Rep.. 2013;40(4):1-11.
- [CrossRef] [Google Scholar]
- Chen, Y., Aviad, T., Effects of humic substances on plant growth. Soil Science Society Am., Madison, USA, 1990. doi: 10.2136/1990.humicsubstances.c7
- Humic acid applications to lettuce do not improve yield but do improve phosphorus availability. Soil Plant Sci.. 2005;55:58-63.
- [CrossRef] [Google Scholar]
- The effect of potassium and humic acid applications on yield and nutrient contents of wheat (Triticum aestivum L. var. Delfii) with same soil properties. J. Plant Nutr.. 2019;42(20):2757-2772.
- [CrossRef] [Google Scholar]
- Humic and oxalic acid stimulates grain yield and induces accumulation of plastidial carbohydrate metabolism enzymes in wheat grown under sandy soil conditions. Agric. Sci.. 2015;6:175-185.
- [CrossRef] [Google Scholar]
- Influence of humic acid on increase yield of plants and soil properties. Int. J. Farming Allied Sci.. 2014;3(3):339-341.
- [Google Scholar]
- Effects of three biochar types on activity of β-glucosidase enzyme in two agricultural soils of different textures. Arch. Agron. Soil Sci.. 2018;64(14):1963-1974.
- [CrossRef] [Google Scholar]
- Effects of organic growth-promoting substances as humic acids and indol-acetic acid on wheat crop with special reference to some chemical composition. Minufiya J. Agric. Res.. 2005;30(5):1607-1624.
- [Google Scholar]
- Estimating the leaf area ındex of winter wheat based on unmanned aerial vehicle rgb-image parameters. Sustainability. 2019;11:6829.
- [CrossRef] [Google Scholar]
- Role of proline under changing environments. Plant Signaling Behav.. 2012;7(11):1456-1466.
- [CrossRef] [Google Scholar]
- Evaluates effect of amino acids, humic acid and antioxidants as foliar application on the biochemical content and productivity of wheat under north sinai soils conditions. Am. J. Agric. Forestry. 2020;8(4):167-174.
- [CrossRef] [Google Scholar]
- Effect of proline and potassium humate on growth, yield and quality of broad bean under saline soil conditions. J. Plant Prod.. 2018;9(12):1141-1145.
- [Google Scholar]
- Near infrared spectroscopy in prediction of the crude protein wheat stored for one year at 4˚C. Eur. J. Mol. Clin. Med.. 2020;7(7):3506-3511.
- [Google Scholar]
- Role of humic acid amino acids in limiting loss of nitrogen fertilizer and increasing productivity of some wheat cultivars grown under newly reclaimed sandy soil. Int. J. Adv. Res. Biol. Sci.. 2016;3(4):123-136.
- [Google Scholar]
- Effect of alternative fertilizer on some physicochemical characteristics in wheat flour. Suleyman Demirel University Journal of the Faculty of Agriculture. 2015;10(2):34-39.
- [Google Scholar]
- Effect of different levels of humic acids on the nutrient content, plant growth, and soil properties under conditions of salinity. Soil Water Res.. 2011;6(1):21-29.
- [Google Scholar]
- Effect of humic acid on growth and crop nutrient status of wheat on two different soils. J. Plant Nutr.. 2018;41(4):453-460.
- [CrossRef] [Google Scholar]
- Plant growth stimulation of lignite humic acid part II. Effect of lignite derived ammonium humate on wheat (Triticum aestivum V.) crop using different levels of phosphate fertilizer. Pakistan J. Sci. Industrial Res.. 2002;45:273-276.
- [Google Scholar]
- Using humic substances and foliar spray with moringa leaf extract to alleviate salinity stress on wheat. Handbook of Environmental Chemistry. 2019;77:265-286.
- [CrossRef] [Google Scholar]
- Impact of organic fertilizer, humic acid and sea weed extract on wheat production in pothowar region of Pakistan. Pakistan J. Agric. Sci.. 2013;50(4):677-681.
- [Google Scholar]
- Screening of bread wheat genotypes for drought tolerance using phenotypic and proline analyses. Front. Plant Sci.. 2016;7:1276.
- [CrossRef] [Google Scholar]
- The effects of humic substance applications on plant growth and yield of pickled cucumber grown in stagnant water culture. Turkey J. Nature Sci.. 2012;1(2):58-62.
- [Google Scholar]
- The effect of humic acid foliar application on some qualitative characteristics and micronutrients accumulation in the shoot and grain of triticale (X Tritico-secale Wittmack) J. Crop Prod. Processing Isfahan University Technol.. 2020;10(1):99-112.
- [Google Scholar]
- Piccolo, A., Nardi, S., Concheri, G., Structural characteristics of humic substances as regulated to nitrate uptake and growth regulation in plant systems. Soil Biology and Biochemistry 1992; 24:373-380. https://d1wqtxts1xzle7.cloudfront.net/42067590/Structural_characteristic_of_humic_subst20160204-20505-1wcctap-with-cover-page v2.pdf?Expires=1644182876&Signature=Frb6Z26-FrGTlCq377oqlycTKqhPSXcuhRLrk-
- Impact of humic acid application, foliar micronutrients and biofertilization on growth, productivity and quality of wheat (Triticum aestivum, L.) Middle East J. Agric. Res.. 2015;4(2):130-140.
- [Google Scholar]
- Reynolds, M.P., Sing, P.R., Ibrahim, A., Ageeb, O.A.A., Larquesaavedra, A., Quik, J.S., Evaluating physiological traits to complement expirical selection of wheat in warm environments .H.J. Broum et al., (Eds). Wheat Prospects for Global Improvement 1998; 143-152. doi: 10.1007/978-94-011-4896-2_20.
- Impact of humic acid and nitrogen fertilization on productivity of some bread wheat cultivars. Assiut J. Agric. Sci.. 2019;50(4):22-34.
- [Google Scholar]
- Genome-wide association analyses identify qtl hotspots for yield and component traits in durum wheat grown under yield potential, drought and heat stress environments. Front. Plant Sci.. 2018;9(81):1-16.
- [CrossRef] [Google Scholar]
- The effects of rhizobium inoculation and various nitrogen fertilizer rates on hay, seed, straw and crude protein yields, crude protein percentage and nodule number of irrigated common vetch in Erzurum. Turkish J. Agric. Foresty. 1995;19:137-144.
- [Google Scholar]
- Tan, K.H., Humic matter in soil and environment, principles and controversies, Marcel Dekker, Inc. 270 Madison Avenue, New York, 2003.
- Effects of foliar application of a byproduct of the two-step olive oil mill process on maize yield. Agronomie. 2003;23:617-623.
- [CrossRef] [Google Scholar]
- Effect of leaf fertilization yield and quality of bread wheat. J. Tekirdag Faculty. 2018;15(3):87-95.
- [Google Scholar]
- Impact of humic acid on the morphology and yeild of wheat (Triticum aestivum L.) World Appl. Sci. J.. 2014;30(4):475-480.
- [Google Scholar]
- Effects of Coal derived humic substance on some soil properties and bread wheat yield. Commun. Soil Sci. Plant Anal.. 2011;42(9):150-170.
- [CrossRef] [Google Scholar]
- Influence of humic substances on the solubility and crystallization behavior of calcium phosphates during crystallization from digester supernatant. Elsevier. 2018;44:1681-1686.
- [CrossRef] [Google Scholar]
- Impact of humic acid and nitrogen fertilization on productivity of some bread wheat cultivars. Assiut J. Agric. Sci.. 2019;50(4):22-34.
- [Google Scholar]
- Durum wheat breeding in the Mediterranean region: Current status and future prospects. Agronomy. 2020;10(3):432.
- [Google Scholar]
- Impact of humic acid application and nitrogen fertilizer level on bread wheat productivity under sandy soil conditions. Zagazig J. Agric. Res.. 2017;44(3):887-897.
- [CrossRef] [Google Scholar]
- Proline metabolite transport an efficient approach in corn yield improvement as response to drought conditions. American-Eurasian J. Agric.. 2013;13(12):1632-1641.
- [CrossRef] [Google Scholar]
- Effects of a new humic acid-foliar fertilizer on flag leaf senescence, yield and quality of spring wheat. J. Nanjing Agric. Univ.. 2018;41(4):685-690.
- [CrossRef] [Google Scholar]


