

Translate this page into:
GAN based simultaneous localization and mapping framework in dynamic environment
⁎Corresponding author at: Academic Affairs Office, School Of Mechatronic, Xi'an Technological University, Xi'an 710021, China. bosun12021@163.com (Bo Sun)
-
Received: ,
Accepted: ,
This article was originally published by Elsevier and was migrated to Scientific Scholar after the change of Publisher.
Peer review under responsibility of King Saud University.
Abstract
Objective
Because of interference from dynamic objects, the traditional simultaneous localization and mapping (SLAM) framework execute poorly while operational in a dynamic environment. The Dynamic-SLAM model is introduced by considering the merits of deep learning in object discovery. At the semantic level, the dynamic objects in the new detection are detected to construct the prior knowledge with an SSD object detector. Among the radar and the LiDAR, the synchronization and conversion calibration makes the multi-sensor fusion. Localizing using a camera in a dynamic environment is more challenging because the localization process takes place in moving segments. This further results in unstable pose estimation. A large amount of information of the visual point cloud and high precision of the laser radar information enhances the accuracy of real-time positioning thereby attaining grid map and 3-D point cloud map.
Methods
Here, we have proposed Generative Adversarial Network (GAN) with Aquila Optimizer for moving object detection. The LiDAR measurements check the Radar outcomes. The targeted moving objects are determined via Doppler velocity from the radar and their exact location and mass can be estimated with LiDAR and the proposed GAN-AO approach. Hence the GAN-based AO approach is used to segment the objects inside the point clouds. The arrangements of point clouds are made in a particular range to multiply the vertical points with the laser channel number. If the same objects are identified then the angles are analyzed among the image vectors and then labeled identically for the same points of the object. In addition to this, Velocity compensation is made to estimate the actual moving target from the world frame. This is due to the fact that the estimated velocity of the mmW-radar is in the radial direction with respect to the touching sensors.
Results
The investigation is conducted between different state-of-art methods like Deep Learning (DL), Generative Adversarial Network (GAN), artificial neural network (ANN), Deep neural network (DNN) and propose methods. From this analysis, the proposed method provided 93.8% detection accuracy than other existing methods like DL, ANN, GAN and DNN respectively.
Conclusions
While comparing to the state-of-art techniques, the proposed method demonstrated superior performance results in terms of tracking, detection, root mean square error (RMSE) and accuracy.
Keywords
Localization
Mapping
Cloud
Generative Adversarial Network and Aquila Optimizer

1 Introduction
Visual Synchronization Localization is a process in wireless sensor networks to determine the location of sensor nodes. Under the field of the sensor in which they deployed, the Localization algorithm was designed (Ding et al., 2018; Zhang et al., 2019; Labbé and Michaud, 2019; Fuentes-Pacheco et al., 2015; Tsintotas et al., 2022). Some sensor nodes are static and some are dynamic, based on their nature localization algorithm was built. Localizing using a camera (Zheng et al., 2022; Ruan et al., 2022; Chen et al., 2021; Wang et al., 2021a; Wang et al., 2021b; Wang et al., 2021c; Feng, 2021; Lee et al., 2021; Zhao et al., 2022; Sodhi et al., 2022) in a dynamic environment is more challenging because the localization takes place in moving segments and leads to unstable pose estimation. In this proposed work, we use GAN with an Aquila optimizer for Visual Synchronization Localization and Mapping depending upon the visual point cloud information and laser in a dynamic environment (Shastri et al., 2022; Lindqvist et al., 2021; Venator et al., 2021; Rajendran et al., 2021; Wang et al., 2021a; Wang et al., 2021b; Wang et al., 2021c; Shin et al., 2019). The proposed scheme uses laser and visual point cloud information (Zhao et al., 2022; Ghaffari et al., 2019) to support Visual Synchronization Localization to optimize pose. A large amount of information on the visual point cloud and high precision of the laser radar information enhances the accuracy of real-time positioning thereby attaining grid map and 3-D point cloud map (Morales and Kassas, 2017).
To improve the performance of the Visual Synchronization Localization, we have to combine Radar and Lidar (Schultz and Zarzycki, 2021) to effectively localize the dynamic objects. The static objects are canceled via the measurements of Lidar and a visual point clouds from Lidar are segmented. The input data for the Lidar based Visual Synchronization Localization (Shao et al., 2015) was the filtered visual point clouds. Our proposed method works efficiently in real-time. The accuracy and robustness of Visual Synchronization Localization were improved by Laser and visual point cloud information on the other hand the dynamic objects can be efficiently identified (Yu et al., 2020; Xiao et al., 2019). The major contributions of this study are summarized as follows:
-
The dynamic objects in the new detection are detected to construct the prior knowledge with an SSD object detector at the semantic level.
-
For moving object detection, we used Generative Adversarial Network (GAN) with Aquila Optimizer.
-
Doppler velocity from the radar detects the targeted moving objects and their exact location and mass can be estimated with LiDAR and the proposed GAN-AO approach.
The remaining sections of this article are summarized as: Section 2 illustrated the literature survey. Section 3 explains the system model and the GAN with AO is formulated in section 4. Section 5 delineates the proposed methodology and the experimental results are discussed in section 6. At last, section 7 terminates the article.
2 Related works
By fusing mmW-radar and LiDAR, Dang et al. (2020) suggested an effective method for the reduction of the power of dynamic environment on SLAM. The mapping and localization accuracy was enhanced. Due to doppler effect, the moving objects are eliminated via localization and segmentation with efficient moving object detection. Different real world scenarios were used to validate the performance of moving object elimination. The quick dynamic object detections were provided via calibration and synchronization. Fed the resulting point clouds to SLAM and thereafter removed moving objects.
The mapping system and robust visual-Lidar simultaneous localization were suggested by Qian et al. (2021) for unmanned aerial vehicles. From point clouds via clustering, extract the plane features and more stable line. The least-squares iterative closest point algorithm calculates the relation pose among both consecutive frames. At a lower frequency, construct the texture information with 3-D map thereby referring to the elimination of pose. For unmanned aerial vehicles (UAV), the higher precise and robust mapping and localization with higher cost were achieved.
A robust framework was suggested by Wang et al. (2021a), Wang et al. (2021b), Wang et al. (2021c) for simultaneous mapping and localization by multiple non-repetitive scanning Lidars. The map alignment configures the transformation between two lidars depending upon the rigidity assumption of geometric structure. Time synchronizes the original information from various lidars. While estimating lidar odometry, send all the feature candidates. For enhanced loop detection, integrate the novel place descriptor and remove the dynamic objects. An experimental result verifies large motion and feature-less scenario performances.
Xiao et al. (2019) suggested deep learning (DL) based semantic monocular visual mapping and localization in a dynamic environment. In the following thread, the selective tracking algorithm via feature points of dynamic objects was processed thereby constructing a feature-oriented visual SLAM organization. Compared to the original SSD network, the recall rate of the system is raised from 82.3 % to 99.8 % respectively. In a real-world dynamic environment, an accurate environmental map was localized. But, the environment was more complex and more time-consuming.
3 System model
The system model of the suggested method is depicted in Fig. 1. The multi-sensor fusion can be made with the time synchronization and conversion calibration among the radar and the LiDAR. From the LiDAR dense and precise clouds are produced (Nguyen and Le, 2013). Then the segmentation using the GAN-AO approach is conducted to detect the objects from the surroundings. However, the targeted objects are analyzed and detected by using this approach and then the outcomes are collected on Radar. Meanwhile, the outcomes of Radar are checked with the help of LiDAR measurements and thus filtered the ghost targets effectively (Dubayah and Drake, 2000). The targeted moving objects can be detected by Doppler velocity from the radar and their exact location and mass can be estimated with LiDAR and the proposed GAN-AO segmentation approach.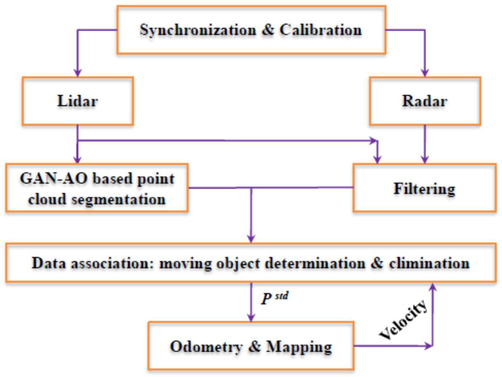
System model.
4 Formulation of Generative Adversarial Network and Aquila Optimizer
This section describes the background of the adopted GAN and AO approaches for segmentation.
4.1 Generative Adversarial network (GAN)
The discriminator D and generator G are the two sub-networks of the GAN network. For training, provides the ground truth data representation is generated via generator attempts. The generator data produces the true ground truth information from data, which are differentiated from the discriminator attempts. According to the distribution P, the binary segmentation map Yis produced via the map . From the generator sub-network, the ground truth mask s represented as Y. The discriminators are indicated via segmenting map into 0 to 1 values and input data comprises the pair of discriminator maps .
Equation (1) expresses the GAN for segmentation and the following equation expresses the objective function.
To make the right decision, the discriminator (D) subnetwork is trained via minimization of
and the maximization of
. While making the right decision, the outputs are generated via the generator sub-network (F). The secondary loss functions of binary cross-entropy (
) are delineated in addition to the GAN objective function (Abdollahi et al., 2021).
The GAN objective functions with the optimal results are delineated as.
The weighting parameters are . The map generates the spatial resolution are increases via a generator. At last, the practical probability outputs are achieved based on both backward and forward passes. However to enhance the segmentation capabilities we have adopted Aquilla optimization. This will help to tune up the parameters.
4.2 Aquila optimization
The parameters of GAN are tuned using the Aquilla Optimization (AO) (AlRassas et al., 2021) which is a swarm-based approach. The estimation of the best solution can be acquired by,
The dimensionality of the segmentation problem in the dynamic object detection is given as Dim. N is the entire amount of solutions to the problem. The best solution can be determined as H. Here, the attained value while performing the ith solution is represented as Hi.
The randomly generated number can be given as and falls under the range of 0 to 1, is the jth lower boundary and jth upper boundary is indicated as .
-
Numerical Expression of AO
The hunting behavior of the AO can be classified as (i) Expanded exploration (ii) Encircling (iii) Expanded exploitation and (iv) Narrowed exploitation.
-
Expanded Exploration (H1)
The targeted ghosts are chosen with the characteristics of Aquila selecting the hunting area for the hunting.
The solution obtained after the first search application is denoted as
. However, the best previous solution can be given as
. That can be used to analyze the exact object. The exploration can be managed by observing the term
for each iteration and
is used to find the position average value of the ongoing solutions and can be evaluated as,
The maximum number of iterations is represented as T.
4.3 Encircling (H2)
According to the behavior of Aquilla encircling and attacking the prey, the targeted ghosts are encircled and analyzed for detection. This is termed as Aquila contour flight which involves a short glide attack and can be given as,
The solution produced by the encircling process can be given as
.
has been indicated as levy flight distribution function and the space dimensionality is given as D. however, the randomly acquired solution ranges between 1 and N is given as
. Then the levy flight distribution function can be estimated as,
4.4 Expanded exploitation (H3)
This follows the segmentation of objects based on the identified exact location and is performed slowly and carefully. It can be determined as,
The solutions obtained using the third stage are given as . The parameters used to change the exploitation stage can be denoted as α and and determined as 0.1. The lower and upper boundaries of the problem can be denoted as L and U.
4.5 Narrowed exploitation (H4)
In this stage, object segmentation can be made with the help of a walk and grab prey approach. It can be evaluated as,
The quality function is indicated as F and the obtained solution in this stage is given as . G1 is the motion tracker and G2 is the flight slope between the first and last location.
To enhance the segmentation accuracy of GAN we have merged it with the AO approach and Fig. 2 demonstrates the proposed segmentation methods with their working mechanism.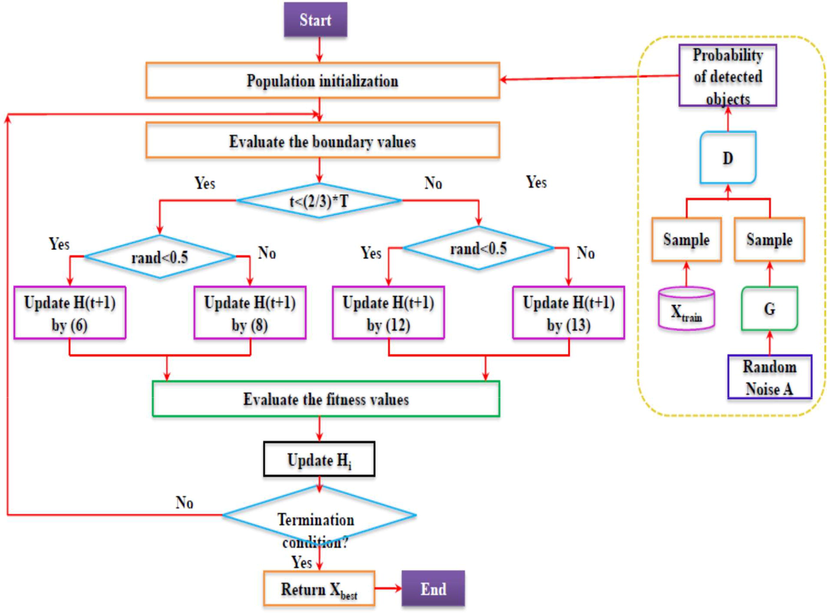
Proposed GAN-AO segmentation approach.
5 Proposed GAN-AO for the elimination of moving objects
This section expresses the process of Generative Adversarial Network and Aquila Optimizer for the elimination of moving objects.
5.1 Point cloud segmentation
During the segmentation process, the earth plane from the point clouds is removed. While performing this estimation is inaccurate and does not match with the SLAM (Bailey and Durrant-Whyte, 2006). Hence the GAN-based AO approach is used to segment the objects inside the point clouds. The arrangements of point clouds are made in a particular range to multiply the vertical points with the laser channel number. If the same objects are identified then the angles are analyzed among the image vectors and then labeled identically for the same points of the object.
5.2 Filtering outcomes from the radar
The object detected using the radar includes noises because of propagation features and multi-path effect of EM waves. Hence to analyze a negative impacts of the inclusion of false alarms a verification strategy is stated along with LiDAR measurements to detect the targeted ghost. The targeted points are converted into a coordinate frame of LiDAR-based on the calibration (Dawkins et al., 2001) outcomes.
5.3 Association of data
Velocity compensation is made to estimate the actual moving target from the world frame. This is due to the fact that the estimated velocity of the mmW-radar is in the radial direction with respect to the touching sensors. The Doppler velocity (Berger, 1957)
is acquired from the radar for each target. Then the absolute velocity
of the target as of the current static frame is determined by the integration of sensor velocity
along with the outcomes of SLAM and can be given as,
6 Experimental results
This section validates the performance of GAN-based Aquila Optimizer for dynamic object detection. The mmWradar (Delphi ESR) with the LiDAR (VLP-16) equips the wheeled robot based on the TUM RGB-D benchmark dataset (Sturm et al., 2012). There is 30°×360° of FOV (field of view) with 100 m for LiDAR detection range. At mid-range, a wide of 90° FOV is combined by radar and the scenarios are recorded through a camera. The baseline as open-source code LOAM conducts a series of experiments and real-time implementations are performed using Robot Operating System (ROS). Fig. 3 explains the sample dataset images.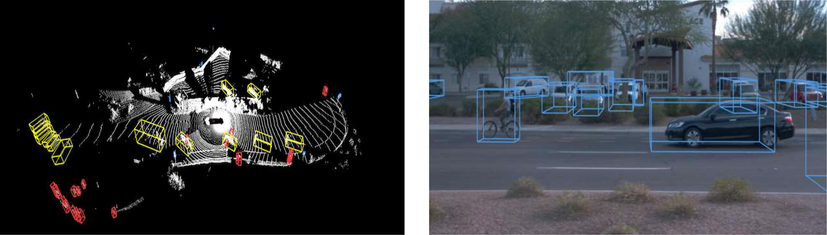
Sample dataset images based on dynamic moving objection detection.
The performance analysis based on tracking and detection results with respect to various experimentations is plotted in Fig. 4. There are eight experimentation conditions with the tracking and detection performance is evaluated in this graph. Next to the enhancement measures, the transplant results are evaluated based on the RGB-D benchmark dataset. From this investigation, the experimentation conditions are increased with decreasing detection d tracking results are obtained.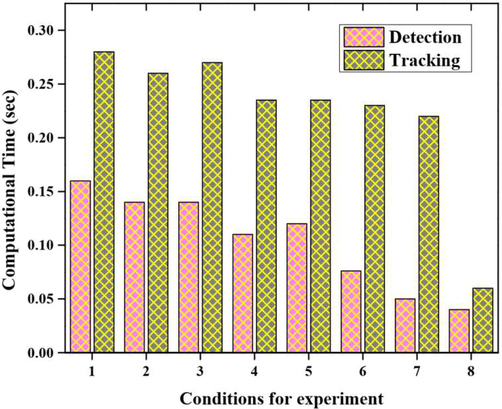
Performance analysis based on tracking and detection results.
The root means square error (RMSE) performance analysis is delineated in Fig. 5. The experimentation conditions are varied from 1 to 8 with respect to varying error values. The RMSE values are varied in each experiment condition. From this, we have obtained 0.23, 0.018, 0.20, 0.22, 0.21, 0.21, 0.25 and 0.15 RMSE output values are obtained based on the experimentation conditions from 1 to 8.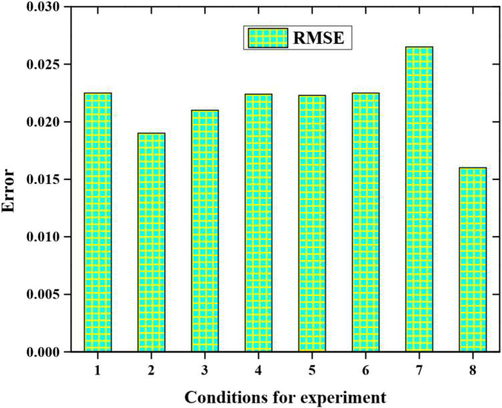
Performance analysis in terms of RMSE.
Table 1 delineates the operation performance evaluation based on three examination time results of ORB-SLAM2, Dynamic SLAM and Improvements. When compared to ORB-SLAM2, the dynamic SLAM accuracy is 7.84 % by taking the RMSE as the standard.
Time (s)
ORB-SLAM2
Dynamic SLAM
Improvements
Median
0.50
0.044
12 %
Mean
0.50
0.045
10 %
Total
42.90
38.40
10.49 %
Fig. 6 expresses the performance analysis based on the number of frames with varying numbers. In this experiment, we have taken three conditions such as static, and dynamic with both static and dynamic conditions. In this experiment, the average number of feature points in every keyframe becomes 3090 in order to highlight the dynamic feature point’s proportions. There are 47.96 % of static feature points with 74.11 % dynamic feature points proportions obtained.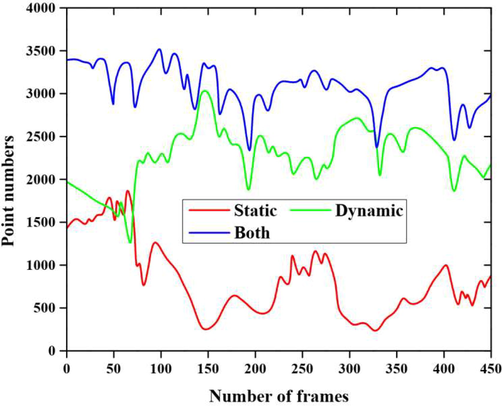
Performance analysis based on number of frames with varying numbers.
The comparative analysis of accuracy results are plotted in Table 2. This investigation is conducted between different state-of-art methods like Deep Learning (DL) (Xiao et al., 2019), Generative Adversarial Network (GAN), Artificial neural network (ANN), Deep neural network (DNN) and proposed methods (Bojaj et al., 2021; anghera et al., 2021). From this analysis, the proposed method provided 93.8 % detection accuracy than other existing methods like DL, ANN, GAN and DNN respectively.
Methods
Accuracy
DL
86 %
GAN
90 %
DNN
90.4 %
ANN
89.45 %
Proposed
93.8 %
7 Conclusion
In this paper, the Visual Synchronization Localization and mapping of the dynamic object are detected using laser and visual cloud point information. Localizing using a camera in a dynamic environment is more challenging because the localization takes place in moving segments and leads to unstable pose estimation. To overcome this problem, the proposed work uses GAN with an Aquila optimizer in a dynamic environment. In this experiment, we have taken three conditions such as static, dynamic with both static and dynamic conditions. The average number of feature points in every keyframe becomes 3090 to highlight the dynamic feature point’s proportions. There are 47.96 % of static feature points with 74.11 % dynamic feature points proportions are obtained. The proposed technique offers 93.8 % detection accuracy than other existing methods like DL, ANN, GAN and DNN. In the future research, various other parameters namely the execution time as well as computational cost will be discussed and taken into consideration.
Funding
Key R & D plan project of Shaanxi Province in 2021 “digital evaluation system of whole dentition based on coded structured light measurement” (Item No: 2021GY-005).
Declaration of Competing Interest
The authors declare that they have no known competing financial interests or personal relationships that could have appeared to influence the work reported in this paper.
References
- Improving road semantic segmentation using generative adversarial network. IEEE Access. 2021;9:64381-64392.
- [Google Scholar]
- Optimized ANFIS model using Aquila Optimizer for oil production forecasting. Processes. 2021;9(7):1194.
- [Google Scholar]
- Simultaneous localization and mapping (SLAM): Part II. IEEE Rob. Autom. Mag.. 2006;13(3):108-117.
- [Google Scholar]
- The nature of Doppler velocity measurement. IRE Trans. Aeronaut. Navig. Electron.. 1957;3:103-112.
- [Google Scholar]
- Treatment of the first COVID-19 case in kosovo and management of the pandemic. SPR. 2021;1(3):58-62.
- [Google Scholar]
- 3D global mapping of large-scale unstructured orchard integrating eye-in-hand stereo vision and SLAM. Comput. Electron. Agric.. 2021;187:106237
- [Google Scholar]
- Moving objects elimination towards enhanced dynamic SLAM fusing LiDAR and MmW-radar. In: 2020 IEEE MTT-S International Conference on Microwaves for Intelligent Mobility (ICMIM). IEEE; 2020. p. :1-4.
- [Google Scholar]
- Laser Map Aided Visual inertial Localization in Changing Environment. In: 2018 IEEE/RSJ International Conference on Intelligent Robots and Systems (IROS). IEEE; 2018. p. :4794-4801.
- [Google Scholar]
- Deep Learning for Depth, Ego-Motion, Optical Flow Estimation, and Semantic Segmentation. University of Essex; 2021. Doctoral dissertation
- Visual simultaneous localization and mapping: a survey. Artif. Intell. Rev.. 2015;43(1):55-81.
- [Google Scholar]
- Ghaffari, M., Clark, W., Bloch, A., Eustice, R.M., Grizzle, J.W., 2019. Continuous direct sparse visual odometry from RGB-D images. arXiv preprint arXiv:1904.02266.
- RTAB-Map as an open-source lidar and visual simultaneous localization and mapping library for large-scale and long-term online operation. J. Field Rob.. 2019;36(2):416-446.
- [Google Scholar]
- Lee, K.M.B., Kong, F.H., Cannizzaro, R., Palmer, J.L., Johnson, D., Yoo, C. and Fitch, R., 2021. Decentralised Intelligence, Surveillance, and Reconnaissance in Unknown Environments with Heterogeneous Multi-Robot Systems. arXiv preprint arXiv:2106.09219.
- ExplorAtion-RRT: A Multi-objective PAth PlAnning and ExplorAtion FrAmework for Unknown and Unstructured Environments. In: 2021 IEEE/RSJ International Conference on Intelligent Robots and Systems (IROS). IEEE; 2021. p. :3429-3435.
- [Google Scholar]
- Morales, J.J., Kassas, Z.M., 2017, September. Distributed signals of opportunity aided inertial navigation with intermittent communication. In Proceedings of the 30th International Technical Meeting of the Satellite Division of The Institute of Navigation (ION GNSS+ 2017) (pp. 2519–2530).
- Nguyen, A., Le, B., 2013, November. 3D point cloud segmentation: A survey. In 2013 6th IEEE conference on robotics, automation and mechatronics (RAM) (pp. 225-230). IEEE.
- Robust visual-lidar simultaneous localization and mapping system for UAV. IEEE Geosci. Remote Sens. Lett. 2021
- [Google Scholar]
- Rajendran, G., Uma, V. and O’Brien, B., 2021. Unified robot task and motion planning with extended planner using ROS simulator. J. King Saud Univ.-Comp. Inf. Sci.
- Advances in molecular quantum chemistry contained in the Q-Chem 4 program package. Mol. Phys.. 2015;113(2):184-215.
- [Google Scholar]
- A review of millimeter wave device-based localization and device-free sensing technologies and applications. IEEE Commun. Surv. Tutorials 2022
- [Google Scholar]
- Loop closure detection in simultaneous localization and mapping using descriptor from generative adversarial network. J. Electron. Imaging. 2019;28(1):013014
- [Google Scholar]
- Sodhi, P., Dexheimer, E., Mukadam, M., Anderson, S., Kaess, M., 2022, January. Leo: Learning energy-based models in factor graph optimization. In Conference on Robot Learning (pp. 234-244). PMLR.
- A BenchmArk for the EvAluAtion of RGB-D SLAM Systems. In: 2012 IEEE/RSJ international conference on intelligent robots and systems. IEEE; 2012. p. :573-580.
- [Google Scholar]
- The revisiting problem in simultaneous localization and mapping: a survey on visual loop closure detection. IEEE Trans. Intell. Transp. Syst. 2022
- [Google Scholar]
- Enhancing collaborative road scene reconstruction with unsupervised domain alignment. Mach. Vis. Appl.. 2021;32(1):1-16.
- [Google Scholar]
- Deep neural network enhanced sampling-based path planning in 3D space. IEEE Trans. Autom. Sci. Eng. 2021
- [Google Scholar]
- A robust framework for simultaneous localization and mapping with multiple non-repetitive scanning lidars. Remote Sensing.. 2021;13(10):2015.
- [Google Scholar]
- SBAS: Salient bundle adjustment for visual SLAM. IEEE Trans. Instrum. Meas.. 2021;70:1-9.
- [Google Scholar]
- Dynamic-SLAM: Semantic monocular visual localization and mapping based on deep learning in dynamic environment. Rob. Auton. Syst.. 2019;117:1-16.
- [Google Scholar]
- Gan-based differential private image privacy protection framework for the internet of multimedia things. Sensors. 2020;21(1):58.
- [Google Scholar]
- A VisuAl SLAM System With LAser Assisted OptimizAtion. In: 2019 IEEE/ASME International Conference on Advanced Intelligent Mechatronics (AIM). IEEE; 2019. p. :187-192.
- [Google Scholar]
- Unsupervised monocular depth estimation in highly complex environments. IEEE Trans. Emerg. Topics Comput. Intelligence 2022
- [Google Scholar]
- 3D Point Cloud Mapping Based on Intensity Feature. In: Artificial intelligence in China. Singapore: Springer; 2022. p. :514-521.
- [Google Scholar]


