

Translate this page into:
Potential antidiabetic activity of barbigerone on glucose and inflammatory cytokine levels in streptozotocin activated diabetic rats
-
Received: ,
Accepted: ,
This article was originally published by Elsevier and was migrated to Scientific Scholar after the change of Publisher.
Peer review under responsibility of King Saud University.
Abstract
Abstract
Aim
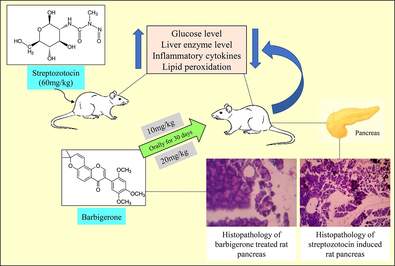
Barbigerone is a natural pyranoisoflavone having antioxidant potential. The current research was aimed to study the anti-diabetic role of barbigerone on streptozotocin-induced experimental rats.
Material & methods
To perform the anti-diabetic activity, the animals were segregated into four groups: Group 1- Control (5 ml/kg saline), Group 2- Streptozotocin control (60 mg/kg i.p.), Group 3 and 4 - Barbigerone (10 and 20 mg/kg, respectively).
Results
Both the doses showed a beneficial effect on all the parameters assessed. The effect was better pronounced by 20 mg/kg than 10 mg/kg. Barbigerone showed a protective effect on blood glucose, lipid profile, antioxidant, liver enzymes, and inflammatory cytokines. It suggested that barbigerone displayed lipid-lowering action and antiperoxidative effect in streptozotocin-activated diabetic animals.
Conclusion
The outcome of this work reflects that 20 mg/kg barbigerone is more potent and produced ameliorative effects in streptozotocin-induced rats.
Keywords
Anti-diabetic
Antihyperlipidemic
Barbigerone
Diabetes mellitus
Streptozotocin

1 Introduction
Diabetes Mellitus, a serious endocrine condition also known as non-insulin-dependent diabetes mellitus impairs the blood glucose balance in the body (Olokoba et al., 2012). Chronic hyperglycemia occurs due to external factors including genetic, environmental, and patient’s lifestyle. The main pathological cause is the rise in oxidative damage, which causes reactive oxygen species (ROS) accumulation, ultimately slowing down the antioxidant defense system (Rajasekaran et al., n.d.). High ROS may also lead to disturbance in cellular functioning that may enhance lipid peroxidation of the cell membrane (Ighodaro, 2018). The antioxidant enzymes play a crucial in protecting the tissue from any injury, but in diabetes altered defense system may lead to tissue damage and cell injury (Khan et al., n.d.). The disease may lead to other associated diseases like diabetic neuropathy, cardiovascular diseases, retinopathy, and diabetic nephropathy (Sen et al., 2011).
Streptozotocin (STZ) is the commonly used cytotoxic agent that induces pancreatic β-cell necrosis and hyperglycemia by destructing the β-cells in rats (Furman, 2015). Chronic administration of streptozotocin may be useful for studying the associated complications like diabetic nephropathy, and neuropathy (Wei et al., 2003). It exerts its cytotoxicity activity through its deoxy form of glucose moiety attached to the methyl nitrosourea. It targets the GLUT2 receptors which are abundant in β-cells and are also present in the liver and kidney, thus liver and kidney functions get impaired (Wu and Yan, 2015). The STZ model is useful in studying all types of natural products, and pharmacological compounds that lower the blood glucose level (Kumar et al., 2012).
Metformin is the standard medication used in managing the hyperglycaemic condition. Metformin act by suppressing liver gluconeogenesis which elevates insulin secretion (Li et al., 2018). Other classes of drugs like glibenclamide (sulfonylureas) directly enhance insulin secretion from the pancreatic β-cell by inhibiting the ATP-sensitive K+ channels. Glibenclamide is utilized as a standard drug in streptozotocin-induced model (Elmalí et al., 2004). Though their wide utility, these drugs are limited due to pharmacokinetic properties, and side effects. So, traditional medicines and plants can be a safer approach to reducing secondary complications at a lower cost (Erejuwa et al., 2010). Medicinal plants contain various phytoconstituents (flavonoids, carotenoids, alkaloids, and vitamins) which have strong antioxidant properties and can be used to treat diabetes (Modak et al., 2007).
Barbigerone belonging from the pyranoisoflavone class was obtained from seeds of Tephrosia barbigeria, family Leguminosae (Wei et al., 2014). Barbigerone has been studied for its pharmacological actions, which include anti-tumor, anti-oxidant, inhibition of 15-lipoxygenase activity, and anti-malarial (Li et al., 2009). Studies have been shown that barbigerone has been used as a therapy for cancer in in-vivo and in-vitro models (Li et al., 2012; Yang et al., 2014).
Thus, knowing the antioxidant potential of barbigerone, we designed a study to check the anti-diabetic effect of barbigerone in STZ-activated rats.
2 Material and methods
2.1 Drugs and reagents
STZ was obtained from Sigma-Aldrich, USA (≥98 % purity, CAS no. 18883-66-4) Barbigerone was obtained from SRL, India. Other reagents and chemicals were acquired from local sources and were of standard quality. The analytical kits for interleukin-6 (IL-6), interleukin-1β (IL-1β), and tumour necrosis factor-alpha (TNF-α) were measured by using commercially available rat enzyme-linked immunosorbent assay kit obtained from Modern Lab, M.S., India.
2.2 Experimental animals
Adult male Wistar rats weighing 200 ± 20 g (5–7 weeks old) were procured and quarantined for an acclimatization period of 7 days. They were segregated into propylene cages with a surplus amount of water and a pellet diet. The animals were maintained at 20 ± 5 °C with relative humidity (65–75 %) and 12hrs light and dark cycle. The research proposal was validated by the institutional animal ethics committee (IAEC-TRS/PT/021/006), India, and followed all the guidelines of CPCSEA.
2.3 Study protocol
Overall, twenty-four rats were randomized into four groups, every single cage containing 6 rats (Fig. 1).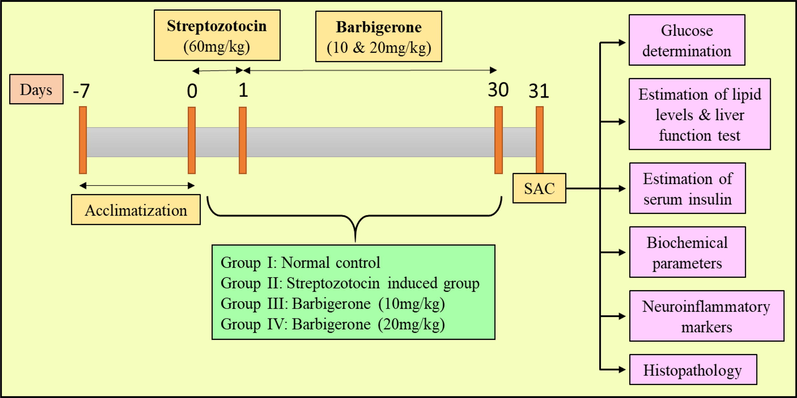
Study protocol of experimental groups. SAC, Sacrifice.
1st Group (Control): All the rats received normal saline (5 ml/kg) as a vehicle throughout the study.
2nd Group (STZ control): All the animals in this group received a single injection of STZ (60 mg/kg) intraperitoneally (Cheng et al., 2012; Erejuwa et al., 2010).
3rd and 4th Group (Treatment groups): The rats received 10 mg/kg and 20 mg/kg of barbigerone respectively to both groups every morning for 30 days after STZ injection (Li et al., 2012; Cheng et al., 2013; Jamal Gilani et al., 2021).
Despite the control group which received saline or vehicle, all other treatment groups received the treatment. After induction with STZ, the animals started to show diabetes-like symptoms like polyuria, dyspepsia, and bodyweight within 48hrs. Fasting blood glucose was measured after 72hrs of STZ injection. The rats which displayed a blood glucose level of more than 255 mg/dl are confirmed diabetic, which then was further chosen for treatment. After 30 days, animals were anesthetized, blood was collected, and euthanized under high anaesthesia. The pancreas and liver were collected immediately and stored under formalin solution for biochemical estimation.
2.4 Acute toxicity study
The study was carried out by following OECD guideline no. 425 (Up and down procedure). During the 14 days, all the animals were examined for mortality and development of any clinical symptoms including changes in the skin, fur, mucous membrane, lacrimation, eyes, response to stimuli, respiration, and body weight (Yang et al., 2014; Touqeer et al., 2013).
2.5 Body weight measurement
All the rats were weighed before starting the main study (basal body weight) and after completing the study prior to sacrificing the animals (29th day). The difference in the rat body weight was noted.
2.6 Estimation of glucose levels
The blood taken from the tail-vein of the rats was placed on the glucose strip and checked by ACCU-CHEK glucometer. Blood glucose level was estimated at 72hrs after STZ injection, and after 30 days of treatment (Xue et al., n.d.).
2.7 Estimation of insulin levels
The serum insulin was estimated by a commercial Rat ELISA insulin kit as per the standard provided procedure.
2.8 Determination of lipid profile and liver function tests
The collected blood was centrifuged at 2000g for 10mins at 4˚C and the separated layer was used for further estimation. The lipid levels include total cholesterol (TC), triglycerides (TG), high-density lipoprotein (HDL) which were assessed spectrophotometrically by following standard assay protocols.
The biomarkers for liver performance include aspartate transaminase (AST) and alanine transaminase (ALT), which were assessed by standard assay kits. The enzymes serve as a biomarker for hepatic injury which determines the concentration of enzymes that draws into the systemic circulation.
2.9 Biochemical analysis
2.9.1 Preparation of homogenate
The pancreas was collected, washed with cold saline, and then homogenized in a homogenizing vessel at 800 rpm with 0.1 M tris-HCL to obtain 10 % w/w homogenate. The suspension was then centrifugated at 2000g for 10 mins at 3–5 °C. The separated supernatant was further used for the quantification of antioxidant enzymes.
2.9.2 Malondialdehyde (MDA) assay
The reaction mixture was prepared by mixing pancreatic homogenate, 20 % w/v glacial acetic acid, 8 % w/v sodium dodecyl sulphate, 0.8 % w/v thiobarbituric acid, and water. The test tubes were incubated for 1 hr, chilled, and centrifugated at 3500 × g for 15–20 mins. The colored MDA-TBA mixture formed was measured spectrophotometrically at 532 nm which is the measure of malondialdehyde formed. The concentration was indicated as nmol of MDA/mg protein (Armagan et al., 2006).
2.9.3 Reduced glutathione (GSH) assay
The method is described by Ellman which includes 0.5 ml homogenate precipitated by trichloroacetic acid (TCA). The mixture was then centrifugated for 10 mins and to the supernatant, Ellman’s reagent was mixed. A yellow-colored product was formed which was measured spectrophotometrically at 412 nm. The quantity of GSH produced was measured as mg/100 g tissue (Pari and Murugan, 2007).
2.9.4 Superoxide dismutase (SOD) assay
To the homogenate, ethanol-chloroform mixture is added, centrifuged and the supernatant was collected. To the supernatant, xanthine and xanthine oxidase in phosphate buffer were mixed. On adding NBT, a blue-colored mixture was formed, which was measured at 550 nm by UV spectrophotometer. Under assay conditions, an enzyme reaction producing 50 % inhibition of NBT in one minute defines one unit of enzyme activity (S et al., 2017).
2.9.5 Catalase (CAT) assay
The test tube contains pancreatic homogenate (0.1 ml) and hydrogen peroxide (0.5 ml) which were incubated at 40 °C for a few mins. To this mixture, ammonium molybdate solution was added as a stopping reagent. The activity was calculated as one unit of catalase that decomposes 1 µmol oh H2O2 per minute (Qujeq and Rezvani, n.d.).
2.9.6 Plasma ferric reducing ability (FRAP) assay
Total antioxidant capacity (TAC) level is the measure of capability to reduce Fe3+to Fe2+ under assay conditions. The assay mixture includes 2,4,6-tripyridyl-S-triazine (TPTZ), ferric chloride (FeCl3) and acetate buffer. To 600 µl freshly prepared solution, 20–25 µl diluted plasma was added and warmed at 37 °C. A blue colour solution is produced due to reaction between Fe2+ and TPTZ was measured spectrophotometrically at 593 nm (Tamaddonfard et al., 2013).
2.10 Proinflammatory markers
The level of IL-6, IL-1β, and TNF-α were quantified by immunoassay kit. The separated protein was used to coat the antibody ELISA wells. The amount of marker was determined by following the assay procedure (Ghowsi et al., 2018).
2.11 Histopathology
For histopathological studies, liver was excised from all the groups and perfused in 10 % formalin. The liver tissues were fixed in embedded paraffin and sliced into 3–5 µm thin transverse sections. The sections were placed on slides spotted with haematoxylin and eosin for few mins. The slides were placed on the microscope, observed for histopathological changes.
2.12 Statistical analysis
The results of the following methods mentioned as a mean ± SEM. The data were estimated by using both one-way and two-way ANOVA following Tukey’s comparison test using Graph pad prism, version 5. One-way ANOVA was used for calculating the difference between the two groups by setting criteria of significance at p < 0.05.
3 Results
3.1 Acute toxicity study
Barbigerone displayed no toxic signs or symptoms throughout the study. There was no notable variance in the weight, behavioural changes, water, and food intake. None of the animals showed any changes studied under gross pathology. Therefore, we selected two doses of barbigerone i.e., 10 mg/kg and 20 mg/kg for the main experiment.
3.2 Effect of barbigerone on body weight
The basal body weight of rats prior to starting the study was compared with the final body weight which was noted on the 31st day. The STZ-induced group displayed a marked decrease in the body weight (p < 0.001) while barbigerone-treatedeated groups signified maintain with 10 mg/kg (p < 0.01) and 20 mg/kg (p < 0.05) (Fig. 2).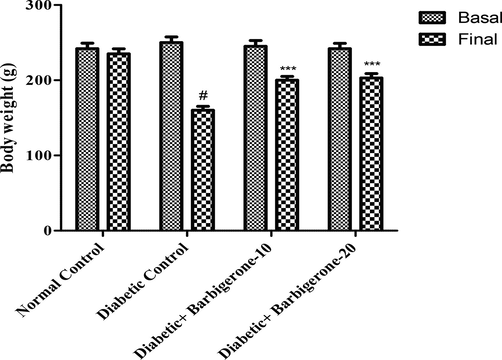
Effect of barbigerone on rat body weight. All values are expressed as mean ± SEM. Correlation among the groups was done using Bonferroni post-comparison test by two- way ANOVA. P value < 0.001 was expressed as *** as compared to diabetic control group. # Signifies comparison to normal control group (P < 0.001).
3.3 Effect of barbigerone on glucose level
The streptozotocin group showed significant elevation (p < 0.001) in the glucose level as collated to the control group. Treatment with either 10 mg/kg (p < 0.05) or 20 mg/kg (p < 0.01) barbigerone significantly decreased the glucose level when collated to the diabetic group (Fig. 3).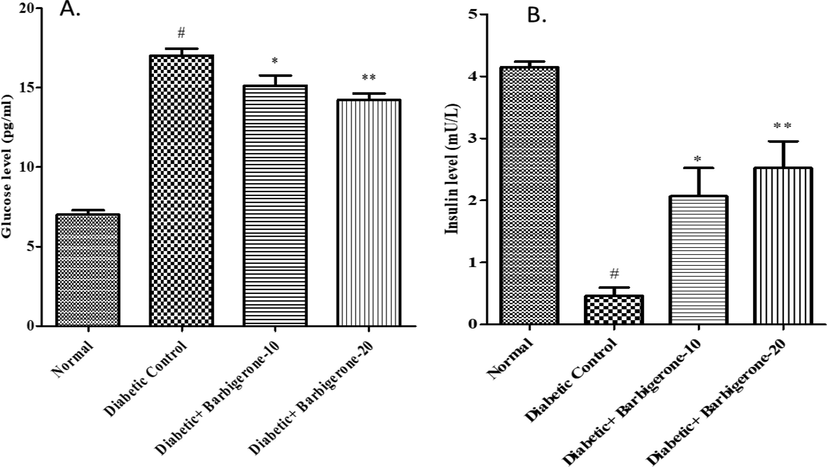
Effect of barbigerone on glucose and insulin levels. A. Glucose level, B. Insulin level. All values are expressed as mean ± SEM. Correlation among the groups was done using Tukey’s test by one- way ANOVA. P value < 0.05, 0.01 were expressed as *, ** respectively as compared to diabetic control group. # Signifies comparison to normal control group (P < 0.001).
3.4 Effect of barbigerone on insulin level
The diabetic group displayed a marked down fall (p < 0.001) in the insulin levels when correlated with the control rats. When treated with barbigerone i.e., 10 mg/kg and 20 mg/kg, it displayed a marked rise in the insulin level having p < 0.05 and p < 0.01 significance respectively as collated to the diabetic rats (Fig. 3).
3.5 Effect of barbigerone on lipid level and liver enzymes
There was a marked rise in the triglyceride and decline in the HDL levels (p < 0.001) in diabetic rats as collated to control group. On administration of 10 mg/kg (p < 0.01) and 20 mg/kg (p < 0.001) barbigerone, a noticeable decline in triglyceride and upsurge in HDL level was observed when correlated to the diabetic rats.
Both AST and ALT were elevated in diabetic control groups as correlated to the normal group. Treatment with barbigerone (10 mg/kg and 20 mg/kg) remarkably reduced (p < 0.001) the liver enzymes as compared with diabetic group (Fig. 4).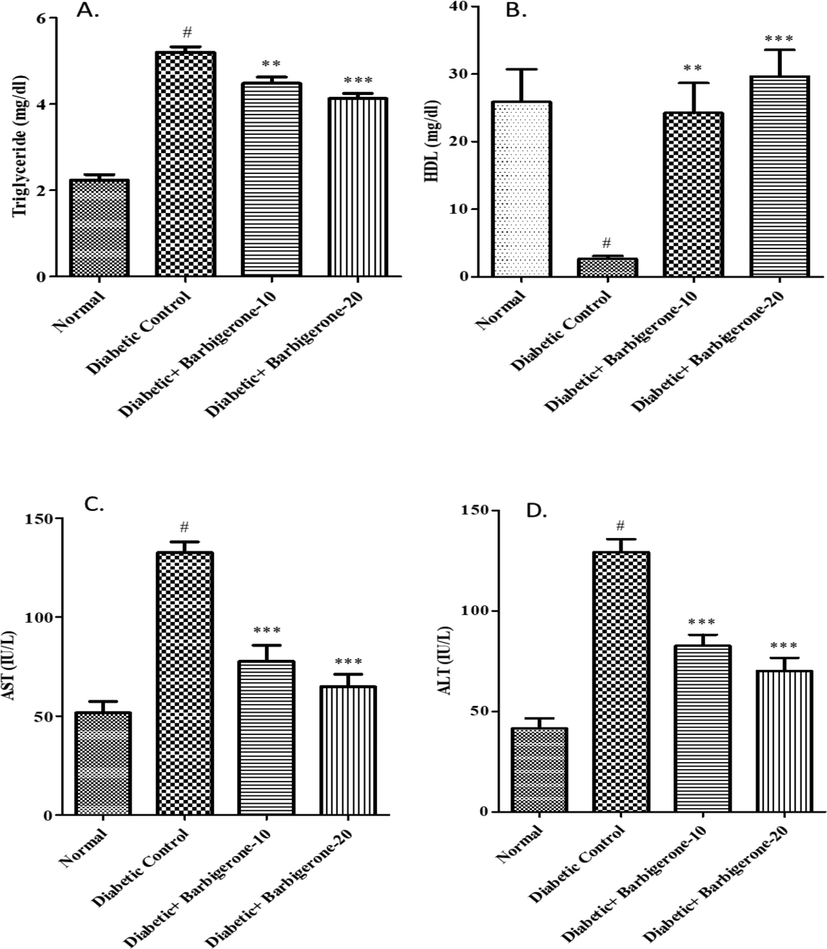
Effect of barbigerone on lipid profile and liver enzymes. A. Triglycerides (TG), B. HDL, C. AST, D. ALT. All values are expressed as mean ± SEM. Correlation among the groups was done using Tukey’s test by one- way ANOVA. P value < 0.01, 0.001 was expressed as **, *** as compared to diabetic control group. # Signifies comparison to normal control group (P < 0.001).
3.6 Biochemical analysis
As shown in Fig. 5, a noticeable upsurge in the MDA level and decline in other antioxidant enzymes (SOD, GSH, Catalase) was remarked in diabetic rats when collated with the control group (p < 0.001). Barbigerone treated group dose-dependently (p < 0.01 at 10 mg/kg and p < 0.001 at 20 mg/kg) dropped the MDA level and elevated the antioxidant enzymes (SOD, GSH, Catalase) as collated to the diabetic group. A rise in TAC level (p < 0.001) was noted in the diabetic control group as collated to the control group. Treatment with 10 mg/kg (p < 0.05) and 20 mg/kg (p < 0.01) barbigerone significantly decreased the TAC levels in correlation to the diabetic group.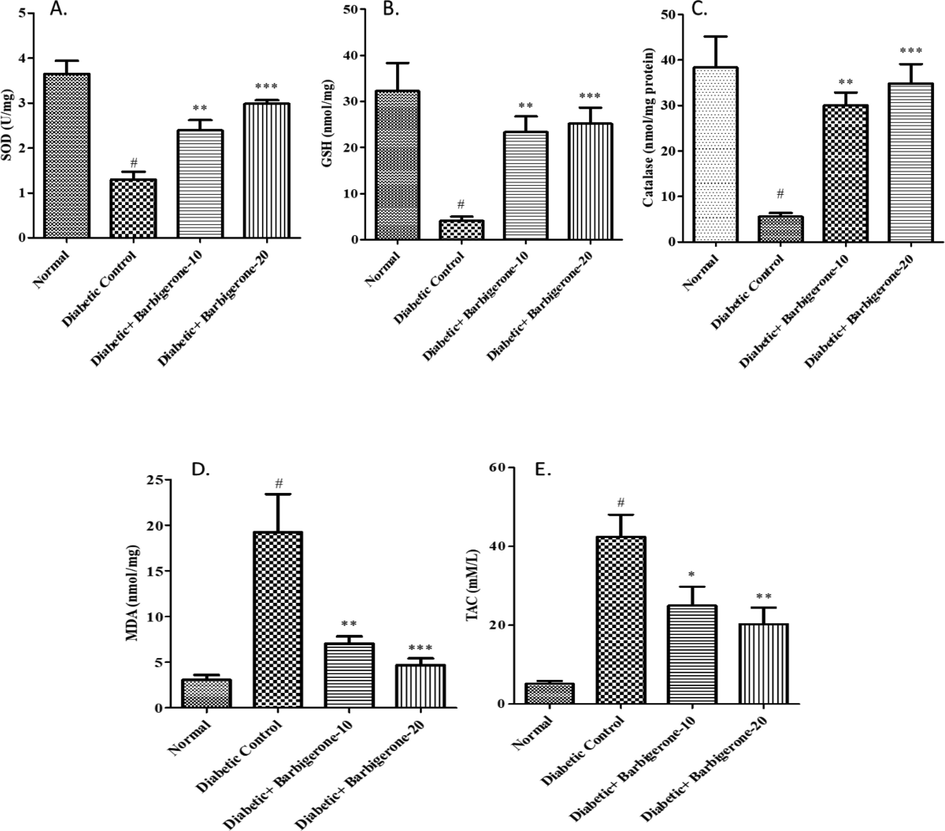
Effect of barbigerone on antioxidant enzyme parameters A. SOD, B. GSH, C. Catalase (CAT), D. MDA, E. TAC. All values are expressed as mean ± SEM. Correlation among the groups was done using Tukey’s test by one- way ANOVA. P value < 0.05, 0.01, 0.001 was expressed as *, **, *** as compared to diabetic control group. # Signifies comparison to normal control group (P < 0.001).
3.7 Effect of barbigerone on inflammatory cytokines
A marked upsurge in the inflammatory cytokines (IL-6, IL-1β, and TNF-α) was noted in the diabetic group as collated to the normal group. Treatment with barbigerone dose-dependently decreased (p < 0.001) the cytokine level when collated to the diabetic group (Fig. 6).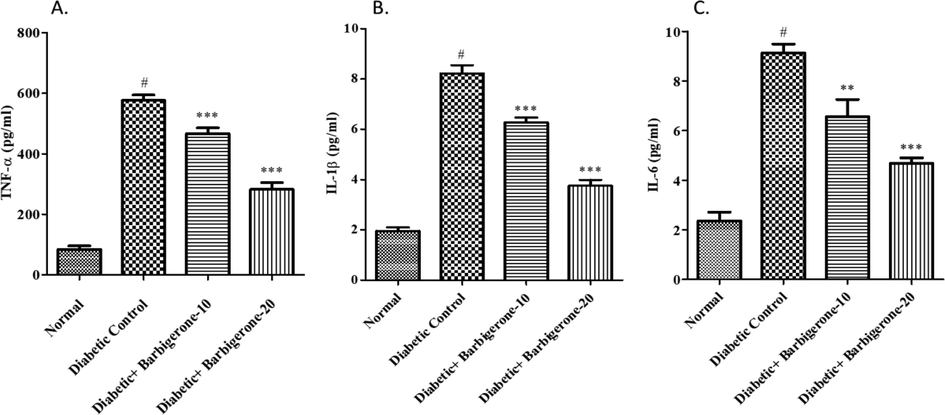
Effect of barbigerone on proinflammatory markers. A. TNF-α, B. IL-1β, and C. IL-6. All values are expressed as mean ± SEM. Correlation among the groups was done using Tukey’s test by one- way ANOVA. P value < 0.01, 0.001 was expressed as **, *** as compared to diabetic control group. # Signifies comparison to normal control group (P < 0.001).
3.8 Histopathological analysis
In Fig. 7, the control group showed rounded islets of Langerhans with lobules surrounding the islets. Diabetic group displayed cellular damage to the pancreatic islets showing shrinkage and degeneration of islet cells with distorted vacuoles. Barbigerone treated diabetic control rats improved cellular injury caused by STZ. Both doses of barbigerone at some extent restored pancreatic islets, increased islet cells, and reduced cell damage.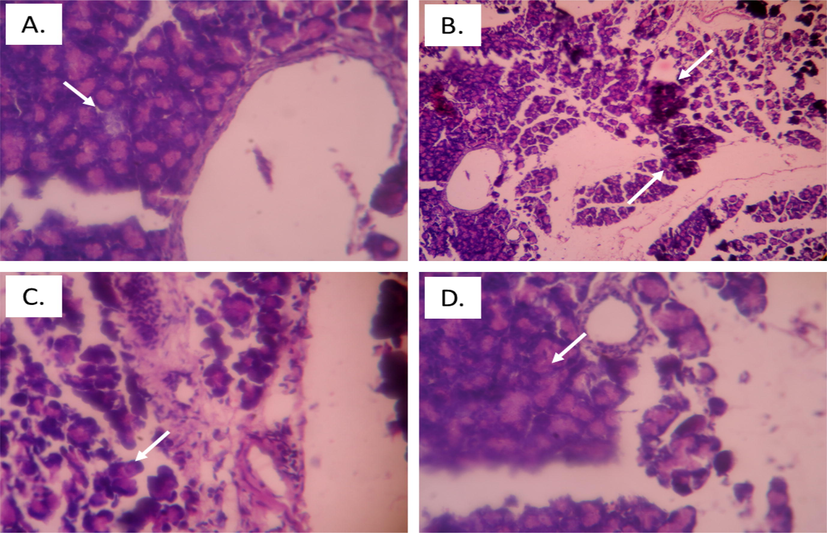
Histopathology of pancreatic tissue in diabetic rats. A. Control rats, arrow depicting normal islet of Langerhans, B. Diabetic control rats, arrow depicts cell damage with distorted cells, C. Barbigerone treated rats (10 mg/kg) D. Barbigerone treated rats (20 mg/kg), arrow showing normal islet of Langerhans with enhanced beta cells.
4 Discussion
Diabetes mellitus is the most alarming disease worldwide caused mainly due to sedentary lifestyle and intake of high caloric food. Diabetes is also linked with nephropathy and cardiovascular complications as lipid metabolism of the body get abnormal (Sadi et al., 2008). Management with naturally derived phytoconstituents can lower down the elevated glucose levels with much fewer side effects (Prabhakar and Doble, 2011). Barbigerone is a natural antioxidant is studied for its anticancer activity by inhibiting the mitogen-activated protein kinase (MAPK) pathway. Barbigerone is not investigated for anti-diabetic activity. Therefore, we assessed the effect of natural phytoconstituent, barbigerone on hyperglycemia, antioxidant markers, and lipid level in STZ-induced rats.
Generally, a sharp decline in body weight was noticed in STZ-induced diabetic rats while on barbigerone administration, there was a significant maintain in body weight. STZ completely induced hyperglycemia in rats by directly targeting the pancreatic β-cells which eventually increased the glucose and lowered the insulin levels ((Biddinger and Kahn, 2006; Pandit et al., 2010)). Oral administration of barbigerone for 30 days significantly decreased the glucose levels and raised the insulin level similar to the previous findings (Eidi et al., 2005).
The major abnormality associated with diabetes is hypertriglyceridemia and hypercholesterolemia which leads to insulin resistance and glucose intolerance (Ogurtsova et al., 2017; Kamalakkannan and Prince, 2006). Barbigerone administration markedly restored thehypertriglyceridemia which may be due to reduction in fatty-acid synthesis. Previous studies stated that hyperglycemia may induce hepatic injury resulting in loss of enzyme functionality (Sokolovska et al., 2015). We observed that STZ-induced rats showed marked elevation in the ALT, AST levels but treatment with barbigerone displayed a significant reduction in the enzyme level, especially with a 20 mg/kg dose. Hyperglycemia is linked with abnormal lipid levels characterized by increased triglyceride level and decline in HDL levels in STZ-induced rats as observed in earlier reports (Najafian et al., 2012). The altered lipid levels were reversed on barbigerone administration, more significantly at a dose of 20 mg/kg.
Oxidative damage results in increased lipid peroxidation leading to free radical generation and inactivation of membrane bound antioxidant enzymes such as MDA (Negre-Salvayre et al., 2008). In our study, MDA and TAC levels were markedly increased with reduction in antioxidant activities like CAT, SOD, and GSH levels in STZ-induced group (Coskun et al., 2005; Mahesh and Menon, 2004). Barbigerone administration decreased the MDA and TAC levels and corrected other antioxidant enzymes dose-dependently.
Oxidative stress stimulates pro-inflammatory cytokines which are the main mediators of inflammation in DM (Schenk et al., 2008). Administration of streptozotocin notably enhanced the cytokine level (IL-6, IL-1β, and TNF-α) similar to earlier findings (García-Galicia et al., 2014; Zeng et al., 2009). After barbigerone treatment at both doses (10 mg/kg and 20 mg/kg) showed marked downfall in the cytokine levels, thus decreasing the inflammation.
Histopathological examination revealed morphological alterations in diabetic rats. Healthy rats (control) group have normal morphological characteristics while STZ-induced rats showed destructed islets of Langerhans and asymmetrical vacuoles which was identical to the previous reports (Ahmed et al., 2015; Babujanarthanam et al., 2011; Masjedi et al., 2013).The abnormal histopathological changes were reduced on barbigerone administration indicating its role in diabetes mellitus.
5 Conclusion
Our study showed ddose-dependentantidiabetic effect which was due to the antioxidant property of barbigerone. From the results, we can conclude that barbigerone has a beneficial effect on lipid profile, glucose levels, inflammatory cytokines, antioxidant and liver enzymes. It also restored the cell injury maintaining overall integrity as displayed in pancreatic histopathology. Moreover, 20 mg/kg barbigerone was more effective than a lower dose suggesting further study on the higher dose range.
Declaration of Competing Interest
The authors declare that they have no known competing financial interests or personal relationships that could have appeared to influence the work reported in this paper.
References
- Antidiabetic, antioxidant, antihyperlipidemic effect of extract of Euryale ferox salisb. with enhanced histopathology of pancreas, liver and kidney in streptozotocin induced diabetic rats. SpringerPlus. 2015;4:315.
- [CrossRef] [Google Scholar]
- Effects of melatonin on lipid peroxidation and antioxidant enzymes in streptozotocin-induced diabetic rat testis. Asian J. Androl.. 2006;8:595-600.
- [CrossRef] [Google Scholar]
- Quercitrin a bioflavonoid improves the antioxidant status in streptozotocin: induced diabetic rat tissues. Mol. Cell. Biochem.. 2011;358(1-2):121-129.
- [Google Scholar]
- Biddinger, S.B., Kahn, C.R., 2006. From mice to men: Insights into the insulin resistance syndromes. Annu. Rev. Physiol. 68, 123–158. https://doi.org/10.1146/annurev.physiol.68.040104.124723
- Cheng, D., Liang, B., Li, Y., 2012. Antihyperglycemic effect of ginkgo biloba extract in streptozotocin-induced diabetes in rats. BioMed Res. Int. 2013, e162724. https://doi.org/10.1155/2013/162724
- Quercetin, a flavonoid antioxidant, prevents and protects streptozotocin-induced oxidative stress and β-cell damage in rat pancreas. Pharmacol. Res.. 2005;51:117-123.
- [CrossRef] [Google Scholar]
- Effect of Salvia officinalis L. leaves on serum glucose and insulin in healthy and streptozotocin-induced diabetic rats. J. Ethnopharmacol.. 2005;100:310-313.
- [CrossRef] [Google Scholar]
- Effect of the sulphonylurea glibenclamide on liver and kidney antioxidant enzymes in streptozocin-induced diabetic rats. Drugs R. D. 2004;5:203-208.
- [CrossRef] [Google Scholar]
- Antioxidant protective effect of glibenclamide and metformin in combination with honey in pancreas of streptozotocin-induced diabetic rats. Int. J. Mol. Sci.. 2010;11:2056-2066.
- [CrossRef] [Google Scholar]
- Streptozotocin-induced diabetic models in mice and rats. Curr. Protoc. Pharmacol.. 2015;70:5.47.1-5.47.20.
- [CrossRef] [Google Scholar]
- Anti-hyperglycemic effect, inhibition of inflammatory cytokines expression, and histopathology profile in streptozotocin-induced diabetic rats treated with Arracacia tolucensis aerial-parts extracts. J. Ethnopharmacol.. 2014;152:91-98.
- [CrossRef] [Google Scholar]
- Evaluation of TNF-α and IL-6 mRNAs expressions in visceral and subcutaneous adipose tissues of polycystic ovarian rats and effects of resveratrol. Iran. J. Basic Med. Sci.. 2018;21:165-174.
- [CrossRef] [Google Scholar]
- Molecular pathways associated with oxidative stress in diabetes mellitus. Biomed. Pharmacother.. 2018;108:656-662.
- [CrossRef] [Google Scholar]
- Fustin ameliorates hyperglycemia in streptozotocin induced type-2 diabetes via modulating glutathione/Superoxide dismutase/Catalase expressions, suppress lipid peroxidation and regulates histopathological changes. Saudi J Biol Sci.. 2021;28(12):6963-6971.
- [CrossRef] [Google Scholar]
- Rutin improves the antioxidant status in streptozotocin-induced diabetic rat tissues. Mol. Cell. Biochem.. 2006;293(1-2):211-219.
- [CrossRef] [Google Scholar]
- Khan, A.N., Khan, R.A., Ahmad, M., n.d. Role of antioxidant in oxidative stress and diabetes mellitus 4.
- GC-MS analysis and screening of antidiabetic, antioxidant and hypolipidemic potential of Cinnamomum tamala oil in streptozotocin induced diabetes mellitus in rats. Cardiovasc. Diabetol.. 2012;11:95.
- [CrossRef] [Google Scholar]
- Molecular mechanisms of metformin for diabetes and cancer treatment. Front. Physiol.. 2018;9:1039.
- [CrossRef] [Google Scholar]
- Barbigerone, an isoflavone, inhibits tumor angiogenesis and human non-small-cell lung cancer xenografts growth through VEGFR2 signaling pathways. Cancer Chemother. Pharmacol.. 2012;70:425-437.
- [CrossRef] [Google Scholar]
- Barbigerone, a natural isoflavone, induces apoptosis in murine lung-cancer cells via the mitochondrial apoptotic pathway. Cell. Physiol. Biochem.. 2009;24:95-104.
- [CrossRef] [Google Scholar]
- Quercetin allievates oxidative stress in streptozotocin-induced diabetic rats. Phytother. Res.. 2004;18:123-127.
- [CrossRef] [Google Scholar]
- Preventive effect of garlic (Allium sativum L.) on serum biochemical factors and histopathology of pancreas and liver in streptozotocin-induced diabetic rats. Iran. J. Pharm. Res. IJPR. 2013;12:325-338.
- [Google Scholar]
- Indian herbs and herbal drugs used for the treatment of diabetes. J. Clin. Biochem. Nutr.. 2007;40:163-173.
- [CrossRef] [Google Scholar]
- Phloridzin reduces blood glucose levels and improves lipids metabolism in streptozotocin-induced diabetic rats. Mol. Biol. Rep.. 2012;39:5299-5306.
- [CrossRef] [Google Scholar]
- Advanced lipid peroxidation end products in oxidative damage to proteins. Potential role in diseases and therapeutic prospects for the inhibitors. Br. J. Pharmacol.. 2008;153:6-20.
- [CrossRef] [Google Scholar]
- IDF Diabetes Atlas: Global estimates for the prevalence of diabetes for 2015 and 2040. Diabetes Res. Clin. Pract.. 2017;128:40-50.
- [CrossRef] [Google Scholar]
- Type 2 diabetes mellitus: a review of current trends. Oman Med. J.. 2012;27:269-273.
- [CrossRef] [Google Scholar]
- Antidiabetic effect of Ficus religiosa extract in streptozotocin-induced diabetic rats. J. Ethnopharmacol.. 2010;128:462-466.
- [CrossRef] [Google Scholar]
- Tetrahydrocurcumin prevents brain lipid peroxidation in streptozotocin-induced diabetic rats. J. Med. Food. 2007;10:323-329.
- [CrossRef] [Google Scholar]
- Mechanism of action of natural products used in the treatment of diabetes mellitus. Chin. J. Integr. Med.. 2011;17(8):563-574.
- [Google Scholar]
- Qujeq, D., Rezvani, T., n.d. Catalase (antioxidant enzyme) activity in streptozotocin-induced diabetic rats 3.
- Rajasekaran, S., Sivagnanam, K., Subramanian, S., n.d. streptozotocin-induced diabetes in rats.
- Hydroalcoholic extract of Stevia rebaudiana bert. leaves and stevioside ameliorates lipopolysaccharide induced acute liver injury in rats. Biomed. Pharmacother.. 2017;95:1040-1050.
- [Google Scholar]
- Effect of vitamin C and lipoic acid on streptozotocin-induced diabetes gene expression: mRNA and protein expressions of Cu–Zn SOD and catalase. Mol. Cell. Biochem.. 2008;309:109-116.
- [CrossRef] [Google Scholar]
- Insulin sensitivity: modulation by nutrients and inflammation. J. Clin. Invest.. 2008;118:2992-3002.
- [CrossRef] [Google Scholar]
- Ameliorative effects of glycyrrhizin on streptozotocin-induced diabetes in rats. J. Pharm. Pharmacol.. 2011;63:287-296.
- [CrossRef] [Google Scholar]
- Changes in glucose transporter expression and nitric oxide production are associated with liver injury in diabetes. Cell Biochem. Funct.. 2015;33:366-374.
- [CrossRef] [Google Scholar]
- Crocin improved learning and memory impairments in streptozotocin-induced diabetic rats. Iran. J. Basic Med. Sci.. 2013;16:91-100.
- [Google Scholar]
- Touqeer, S., Saeed, M.A., Ajaib, M., 2013. A Review on the Phytochemistry and Pharmacology of Genus 40.
- The streptozotocin-diabetic rat as a model of the chronic complications of human diabetes. Heart Lung Circ.. 2003;12:44-50.
- [CrossRef] [Google Scholar]
- Synthesis and biological evaluation of pyranoisoflavone derivatives as anti-inflammatory agents. Fitoterapia. 2014;97:172-183.
- [CrossRef] [Google Scholar]
- Streptozotocin-induced type 1 diabetes in rodents as a model for studying mitochondrial mechanisms of diabetic β cell glucotoxicity. Diabetes Metab. Syndr. Obes. Targets Ther.. 2015;8:181-188.
- [CrossRef] [Google Scholar]
- Xue, W.-L., Mb, X.-S.L., Zhang, J., Liu, Y.-H., Wang, Z.-L., Zhang, R.-J., n.d. Effect of Trigonella foenum-graecum (fenugreek) extract on blood glucose, blood lipid and hemorheological properties in streptozotocin-induced diabetic rats 5.
- Barbigerone inhibits tumor angiogenesis, growth and metastasis in melanoma. Asian Pac. J. Cancer Prev.. 2014;15:167-174.
- [CrossRef] [Google Scholar]
- Effect of selenium on pancreatic proinflammatory cytokines in streptozotocin-induced diabetic mice. J. Nutr. Biochem.. 2009;20:530-536.
- [CrossRef] [Google Scholar]


