

Translate this page into:
Characterization of indigenous phalsa (Grewia subinequalis) genotypes using morphological traits and ISSR markers
⁎Corresponding authors. kashif.razzaq@mnsuam.edu.pk (Kashif Razzaq), liyunzhou2007@126.com (Yunzhou Li)
-
Received: ,
Accepted: ,
This article was originally published by Elsevier and was migrated to Scientific Scholar after the change of Publisher.
Peer review under responsibility of King Saud University.
Abstract
Background
Phalsa (Grewia subinequalis L.) is a commercial and nutritionally important berry fruit. It is cultivated in Pakistan as a minor fruit crop without any variety characterization. Therefore, the objective of to assess genetic diversity through ISSR markers and morphological features of wild phalsa genotypes collected from different parts of Punjab, Pakistan.
Methods
Morphological characteristics such as plant height, stem circumference, growth habit, leaf length, leaf width, leaf area, leaf color and leaf apex shape showed high variation among genotypes.
Results
Among the twenty inter-simple sequence repeats (ISSR) primers, UBC-812 exhibited the highest PIC values of (0.485) and Dj (0.389) compared to other primers, which considered it better for the identification of phalsa genotypes and prediction of diversity. Moreover, the unweighted pair group method with arithmetic mean cluster analysis divided the sampled genotypes into five clusters (clusters A-E) based on morphological analysis, while molecular data divided the genotypes into eight clusters (clusters A-H).
Conclusion
This study confirmed the high diversity in wild populations especially 'O1P2” and “O7P3” genotypes, with both DNA-based and morphological descriptors that depict their potential use for future phalsa breeding programs.
Keywords
Grewia subinequalis
Morphological traits
Genetic diversity
ISSR markers
Cluster analysis

1 Introduction
Grewia asiatica, commonly known as ‘phalsa’, is a minor fruit crop native to south Asia and widely cultivated in tropical and subtropical regions (Chundawat and Singh, 1980). Phalsa is an excellent source of antioxidant, antidiabetic, antihyperglycemic, hepatoprotective, radioprotective, antimicrobial, antipyretic, antifungal, analgesic, and antiviral compounds (Zia-ul-haq et al., 2012; Jyoti et al., 2015; Sinha et al., 2015). In particular, the leaves are a source of fodder for cattle and are applied to treat wounds, cuts, and painful rashes (Yadav, 1999). The bark and stem are used for sugar refining, and the root bark is used for the treatment of rheumatism (Uddin et al., 2013). Fruit consumption is beneficial for patients with heart, blood pressure, and liver problems (Mukhtar et al., 2012). Additionally, several valuable processed products can be made, such as squash, syrups, beverages, nectars, jams, and chutneys (Mitra et al., 2008; Tiwari et al., 2014).
Despite its high medicinal, nutritional, and economic value, their accessibility for commercial use is limited due to the irregular ripening, perishable nature, and large seed size of the fruits (Wani et al., 2015). These undesirable features also prevent it from attracting attention compared to other grown fruit plants. In addition, there is no suitable characterized cultivar of G. subinequalis (Wani et al., 2017). In phalsa breeding sites, some breeders have divided the phalsa genotypes into two groups, local or sharbati and dwarf or tall (Dhawan et al., 1993). It is known and grown as an underutilized native fruit in Pakistan where climatic conditions are suitable for cultivation (Aziz et al., 2018). During the last decade, its area under cultivation is continuously increasing in the country. Currently, it is grown in an area of 1338 ha with annual yield of 4803 tons in 2019–2020 (MNFSR, 2020).
Identification and characterization of the available germplasm are prerequisites for the morphological and genetic development of the crop. In this perspective, germplasm assessment is imperative to understand the genetic background and reproductive value of the existing germplasm (Singh et al., 2004). The use of molecular markers is valuable as an accurate tool to aid plant breeding schemes and effective protection (Koehler-Santos et al., 2003). Some of the most used and readily available applications of DNA fingerprinting are simple sequence repeats (SSRs) or microsatellite DNA markers are ISSR, RFLP, AFLP, and RAPD markers. Among them, ISSR markers are considered highly polymorphic and are very useful in genomic diversity studies, genome mapping, phylogeny, evolutionary biology, and gene tagging (Reddy et al., 2002). In addition, ISSR markers are known as an active marker such as SSR (Ikegami et al., 2009) and RAPD markers (Ruan et al., 2004). On the other hand, Singh et al. (2007) reported that ISSR markers showed great potential for the identification of different genotypes of a particular fruit crop. In the past, ISSR assisted marker technology has been used by many researchers in the characterization of different fruits (Mani et al., 2011; Golein et al., 2011; Santos et al., 2008; Tusa et al., 2002). For traditional morphological characterization, extensive field observations of mature plants are mandatory, which consumes time and effort in addition to their vulnerability to environmental conditions. Despite its disadvantage, the common use of both morphological traits and ISSR markers may provide a more robust framework for exploiting genetic diversity of wild phalsa plants. As the reviewed literature shows, research data on the exploitation and use of the phalsa fruit is very scanty. It is important to consider this fruit, which is currently underutilized to obtain natural bioactive compounds and will expand the fruit market. Considering the importance of this fruit, the present study was designed with the objective to explore the natural genetic diversity of forty-eight phalsa genotypes grown in Punjab (Pakistan) using morphological traits and ISSR markers. Also, statistical calculations were used to clearly define the genotypes and group them into various clusters to establish a relationship between them.
2 Materials and methods
2.1 Sampling area and plant material
Field trials were carried out during 2019–20 in Southern Punjab-Pakistan. A total of elite forty-eight phalsa genotypes were selected in natural ecosystems from sixteen orchards that were selected using snowball methods located in three districts, i.e., Khanewal (30.2864° N, 71.9320° E), Multan (30.1575° N, 71.5249° E) Lodhran (29.5467° N, 71.6276° E)) of Punjab, Pakistan. Selection procedure of these genotypes was based on plant heath with good condition as well as their better morphological traits and high yielding attributes. From each orchard, ten plants were selected using zigzag methods and tagged for sampling. For that purpose, a random sample of twenty fully expanded leaves was collected from each of the selected plants. The detailed information is given in Table 1.
Sr. No.
Genotypes
Orchard location
Geographic locations
1
O1P2
Roshan Ghulam Muhammad Wala, Multan
30° 16′ 5″ N, 72° 6′ 30″ E
2
O1P3
Roshan Ghulam Muhammad Wala, Multan
30° 16′ 5″ N, 72° 6′ 30″ E
3
O1P4
Roshan Ghulam Muhammad Wala, Multan
30° 16′ 5″ N, 72° 6′ 30″ E
4
O2P2
Pul Eesa Shujabad, Multan
30°28′59.99″ N, 72°34′59.99 E
5
O2P3
Pul Eesa Shujabad, Multan
30°28′59.99″ N, 72°34′59.99 E
6
O2P4
Pul Eesa Shujabad, Multan
30°28′59.99″ N, 72°34′59.99 E
7
O2P6
Pul Eesa Shujabad, Multan
30°28′59.99″ N, 72°34′59.99 E
8
O2P7
Pul Eesa Shujabad, Multan
30°28′59.99″ N, 72°34′59.99 E
9
O2P8
Pul Eesa Shujabad, Multan
30°28′59.99″ N, 72°34′59.99 E
10
O4P6
Sarmad Pakipul Shujabad, Multan
30.20402, N 71.45909 E
11
O4P8
Sarmad Pakipul Shujabad, Multan
30.20402, N 71.45909 E
12
O5P7
Haji Zahoor Mohripur, Khanewal
30°24′24″ N, 71°52′00″ E
13
O6P1
Akbar Mohripur, Khanewal
30°24′24″ N, 71°52′00″ E
14
O6P5
Akbar Mohripur, Khanewal
30°24′24″ N, 71°52′00″ E
15
O6P8
Akbar Mohripur, Khanewal
30°24′24″ N, 71°52′00″ E
16
O7P3
Haq Naqaz Qadirpur Rawan, Multan
30°16′ 60.00″ N, 71° 39′ 59.99″ E
17
O7P6
Haq Naqaz Qadirpur Rawan, Multan
30°16′ 60.00″ N, 71° 39′ 59.99″ E
18
O8P6
Muzzaffar Chowk Qadirpur Rawan, Multan
30°16′ 60.00″ N, 71° 39′ 59.99″ E
19
O9P1
Iqbal Aadhi Bagh Shujabad, Multan
30.0510295767, 71.4114599367
20
O10P2
Ishfaq Krari Chowk Shujabad, Multan
29°52′59.9″N 71°18′00.0″E
21
O10P4
Ishfaq Krari Chowk Shujabad, Multan
29°52′59.9″N 71°18′00.0″E
22
O10P5
Ishfaq Krari Chowk Shujabad, Multan
29°52′59.9″N 71°18′00.0″E
23
O10P6
Ishfaq Krari Chowk Shujabad, Multan
29°52′59.9″N 71°18′00.0″E
24
O10P7
Ishfaq Krari Chowk Shujabad, Multan
29°52′59.9″N 71°18′00.0″E
25
O11P2
Adda Makhdoom Aali, Lodhran
29.7875° N, 71.5553° E
26
O11P3
Bypass Shujabad, Multan
29°51′56.6″N 71°17′35.1″E
27
O11P4
Bypass Shujabad, Multan
29°51′56.6″N 71°17′35.1″E
28
O12P2
Adda Makhdoom Aali, Lodhran
29.7875° N, 71.5553° E
29
O12P3
Adda Makhdoom Aali, Lodhran
29.7875° N, 71.5553° E
30
O12P4
Adda Makhdoom Aali, Lodhran
29.7875° N, 71.5553° E
31
O3P1
Ghulam Muhammad Wala, Multan
29°51′56.6″N 71°17′35.1″E
32
O13P2
366-WB Makhdoom Aali, Lodhran
29.7875° N, 71.5553° E
33
O13P8
366-WB Makhdoom Aali, Lodhran
29.7875° N, 71.5553° E
34
O13P9
366-WB Makhdoom Aali, Lodhran
29.7875° N, 71.5553° E
35
O14P1
Arshad Makhdoom Aali, Lodhran
29.7875° N, 71.5553° E
36
O14P2
Arshad Makhdoom Aali, Lodhran
29.7875° N, 71.5553° E
37
O14P3
Arshad Makhdoom Aali, Lodhran
29.7875° N, 71.5553° E
38
O14P5
Arshad Makhdoom Aali, Lodhran
29.7875° N, 71.5553° E
39
O15P1
363-WB Makhdoom Aali, Lodhran
29.7875° N, 71.5553° E
40
O15P2
363-WB Makhdoom Aali, Lodhran
29.7875° N, 71.5553° E
41
O15P4
363-WB Makhdoom Aali, Lodhran
29.7875° N, 71.5553° E
42
O15P9
363-WB Makhdoom Aali, Lodhran
29.7875° N, 71.5553° E
43
O16P1
Jalla Arain, Lodhran
29°44′8.99″ N 71°35′31.19″ E
44
O16P3
Jalla Arain, Lodhran
29°44′8.99″ N 71°35′31.19″ E
45
O16P6
Jalla Arain, Lodhran
29°44′8.99″ N 71°35′31.19″ E
46
O8P10
Qadirpur Rawan, Multan
30°16′60.00 N, 71°39′59.99E
47
O10P10
Ishfaq Krari Chowk Shujabad, Multan
29°52′59.9″N 71°18′00.0″E
48
O11P10
Bypass Shujabad, Multan
29°51′56.6″N 71°17′35.1″E
2.2 Morphological characterization and data analysis
For morphological characterization, The Minimal Descriptors of Agri-Horti Crops Part III: Fruit Crops (Mahajan et al., 2002) was utilized. The morphological traits included plant height, and stem girth were measured manually with the help of measuring tape while leaf length and width were determined by using scale. Moreover, growth habit was assessed visually by the attitude of branches. The angle formed by the branches was observed and the average score was registered as erect and drooping. leaf area was calculated by digital leaf area meter. Leaf apex shape was determined using Minimal Descriptors of Agri-Horti Crops. Analysis of variance was done for all the measured morphological characters to check the significance of differences among various genotypes by the help of computer-based software Statistix® 8.1. Moreover, PAST 2000 software was used for PCA and correlation coefficient analysis.
2.3 DNA extraction and quantification
The DNA was extracted from leaves of each genotype by using a modified standard CTAB method described by Doyle and Doyle (1990). Briefly, 3 µg washed leaf sample was grinded in mortar and pestle with 1000 µL of 2X CTAB buffer [100 mM Tris-HCI, 1.4 M NaCl, 30 mM EDTA, PVP and 2 % (w/v) CTAB; pH = 8.0], followed by an addition of 15 µL β- mercaptoethanol. Samples were subjected to separation and purification processes as per the CTAB method. Finally, extracted DNA samples were stored at −20 °C until further use. The isolated DNA was quantified using a spectrophotometer (Implen Nanophotometer, Germany) for downstream application.
2.4 PCR amplification for ISSR analysis
Twenty ISSR markers were selected for the analysis of forty-eight genotypes. A detail of markers is given in Table 2. Individual PCR amplification for each ISSR primer was performed on a programmable thermal cycler (BioRad, California, USA). The PCR protocol involved a total volume of 20 μL reaction mixture containing 40 ng of genomic DNA, 10X PCR buffer (pH 8.3), and 1 unit of Taq DNA polymerase (Fermentas, USA). PCR reactions were carried out with the following temperature program, initial denaturation step of 94 °C for 5 min, followed by 35 cycles of 30 sec at 94 °C, 30 sec at 55 °C and 1 min at 94 °C, 1 min at 52 or 54 °C and 2 min at 72 °C. The final extension was done at 72 °C for 10 min. Amplified PCR products were visualized using 1 % agarose gel after electrophoresis at 80 voltages for 3 hrs and photographed with a gel documentation system (Photonyx, USA).
Primer Name
Sequence (5′-3′)
Annealing temperature (°C)
UBC-808
AGAGAGAGAGAGAGA GC
52
UBC-809
AGAGAGAGAGAG AGA GG
52
UBC-810
GAGAGAGAGAGAGAG AT
52
UBC-811
GAGAGAGAGAGAGAG AC
52
UBC-812
GAGAGAGAGAGAGAGAA
52
UBC-814
CTCTCTCTCTCTCTCTA
52
UBC-815
CTCTCTCTCTCTCTCTG
52
UBC-816
CACACACACACACACAT
52
UBC-817
CACACACACACACACAA
52
UBC-820
GTGTGTGTGTGTGTGTC
54
UBC-823
TCTCTCTCTCTCTCTCC
50
UBC-825
ACACACACACACACACT
52
UBC-827
ACACACACACACACACG
48
UBC-829
TGTGTGTGTGTGTGTGC
52
UBC-834
AGAGAGAGAGAGAGAGYT
54
UBC-835
AGAGAGAGAGAGAGAGTC
54
UBC-845
CTCTCTCTCTCTCTCTRG
50
UBC-846
CACACACACACACACART
50
UBC-847
CACACACACACACACARC
52
UBC-849
GTGTGTGTGTGTGTGTYA
54
2.5 Data analysis for genetic diversity
The binary data were collected as the absence (0) and presence of bands for each locus. Only distinct and unambiguous bands showing polymorphism were used in the analysis. Molecular and morphological traits were assessed by the Numerical Taxonomy and Multivariate Analysis System (NTSYS) (Rohlf, 2002). A statistical software “STRUCTURE program ver. 2.3.4.” was used for evaluation of the genetic structure and the neighbor-joining tree of forty-eight phalsa genotypes.
3 Results
The plant morphological traits included in the study exhibited considerable variations among forty-eight genotypes (Table 3). In detail, plant height ranged from 5.0 to 13.4 ft whereas stem girth ranged from 1.3 to 4.6 cm. All genotypes showed drooping growth habits, except “O1P3” and “O1P4” which were erect in nature. Leaf length varied from 12.9 to 22.4 cm. Likewise, leaf width ranged from 9.7 to 15.7 cm. The minimum leaf area was noted as 145.20 cm2 and the maximum was 309.32 cm2. Leaf color in the studied genotypes was ranged from dark green to whitish green; twenty-five genotypes had light green, twenty-one genotypes had dark green and only two genotypes had whitish-green leaves. Leaf apex was categorized as acute, acuminate, round, and obtuse. Sixteen genotypes had the obtuse apex, fifteen had acute, thirteen had acuminate and four genotypes showed round leaf apex.
Genotype
Growth habit
Plant height (ft)
Stem girth (cm)
Leaf length (cm)
Leaf width (cm)
Leaf area (cm2)
Leaf apex shape
Leaf colour
O1P2
Drooping
8.0
3.8
20.85
15.29
302.84
Obtuse
Whitish green
O1P3
Erect
7.3
3.8
20.65
14.23
286.19
Acute
Light green
O1P4
Erect
5.0
4.7
19.41
15.74
295.94
Obtuse
Whitish green
O2P2
drooping
8.9
2.0
21.17
13.90
287.45
Accuminate
Dark green
O2P3
Drooping
8.2
3.2
17.03
13.51
234.60
Accuminate
Dark green
O2P4
Drooping
7.4
2.8
18.72
12.90
245.41
Accuminate
Dark green
O2P6
Drooping
7.2
3.9
17.50
12.11
213.28
Obtuse
Dark green
O2P7
Drooping
9.8
3.0
18.92
14.24
270.37
Acute
Light green
O2P8
Drooping
7.5
3.2
20.30
13.44
275.37
Accuminate
Light green
O4P6
Drooping
7.8
3.0
16.77
11.98
203.35
Acute
Light green
O4P8
Drooping
5.8
2.3
21.61
13.57
301.21
Acute
Light green
O5P7
Drooping
10.0
3.5
20.32
13.10
260.32
Obtuse
Light green
O6P1
Drooping
7.5
1.5
19.50
15.70
309.32
Obtuse
Light green
O6P5
Drooping
7.2
3.0
15.20
11.50
170.32
Obtuse
Light green
O6P8
Drooping
5.5
2.8
17.90
14.20
260.21
Round
Light green
O7P3
Drooping
6.4
1.5
22.40
9.70
220.32
Round
Light green
O7P6
Drooping
7.0
1.5
21.40
11.70
245.32
Accuminate
Light green
O8P6
Drooping
6.7
1.8
15.20
15.20
229.21
Obtuse
Light green
O9P1
Drooping
9.8
2.7
19.87
14.27
288.86
Acute
Dark green
O10P2
Drooping
13.4
3.4
17.47
12.99
227.81
Acute
Dark green
O10P4
Drooping
12.6
3.1
15.65
14.77
236.87
Obtuse
Dark green
O10P5
Drooping
10.6
2.9
19.55
13.29
260.32
Obtuse
Dark green
O10P6
Drooping
9.8
2.4
18.44
14.26
267.01
Acute
Dark green
O10P7
Drooping
10.3
2.8
13.42
10.76
157.94
Acute
Dark green
O11P2
Drooping
12.4
2.9
15.01
11.15
178.43
Round
Dark green
O11P3
Drooping
8.3
2.2
17.52
13.28
241.49
Accuminate
Dark green
O11P4
Drooping
9.4
2.7
15.58
11.04
173.01
Accuminate
Dark green
O12P2
Drooping
10.0
2.8
17.72
13.36
204.77
Acute
Light green
O12P3
Drooping
9.8
2.2
17.60
11.14
186.43
Obtuse
Dark green
O12P4
Drooping
12.0
3.2
14.24
12.23
173.81
Obtuse
Light green
O3P1
Drooping
7.1
2.5
19.63
11.84
234.91
Accuminate
Light green
O13P2
Drooping
10.3
3.0
14.73
11.15
159.00
Accuminate
Dark green
O13P8
Drooping
8.9
2.4
17.18
11.05
187.36
Obtuse
Dark green
O13P9
Drooping
9.8
2.3
16.74
11.51
190.96
Obtuse
Light green
O14P1
Drooping
7.2
2.3
15.75
10.91
184.81
Round
Light green
O14P2
Drooping
8.1
2.4
14.69
10.79
169.25
Acute
Light green
O14P3
Drooping
10.3
3.2
17.02
13.35
217.72
Accuminate
Light green
O14P5
Drooping
6.5
2.2
15.32
13.37
215.72
Accuminate
Light green
O15P1
Drooping
9.3
2.7
17.96
11.75
206.38
Obtuse
Light green
O15P2
Drooping
8.7
2.8
18.54
13.35
246.25
Obtuse
Dark green
O15P4
Drooping
6.6
2.2
15.60
12.35
184.09
Acute
Dark green
O15P9
Drooping
7.7
2.2
17.52
12.38
206.29
Acute
Light green
O16P1
Drooping
6.8
1.3
16.60
11.98
194.34
Obtuse
Dark green
O16P3
Drooping
9.3
2.7
20.39
13.81
275.81
Acute
Dark green
O16P6
Drooping
8.5
2.8
17.34
12.92
244.27
Acute
Light green
O8P10
Drooping
7.1
1.8
16.00
13.20
217.21
Acute
Light green
O10P10
Drooping
11.8
2.8
12.95
10.92
145.20
Accuminate
Light green
O11P10
Drooping
7.5
2.2
21.17
13.33
276.25
Accuminate
Dark green
The dendrogram obtained with the eight quantitative and qualitative morphological characteristics, considering the forty-eight genotypes, showed the formation of five main clusters (cluster A-E; Fig. 1). Cluster A consisted of seventeen genotypes. Cluster B was comprised of three genotypes. To others, cluster C was the largest cluster with twenty-two genotypes which was further divided into two sub-clusters, i.e., C1 and C2. Cluster D consisted of two genotypes. Cluster E consisted of two genotypes that exhibited the least similarity coefficient. Interestingly, two genotypes (“O1P2” and “O7P3”) remained independent and did not group with any cluster.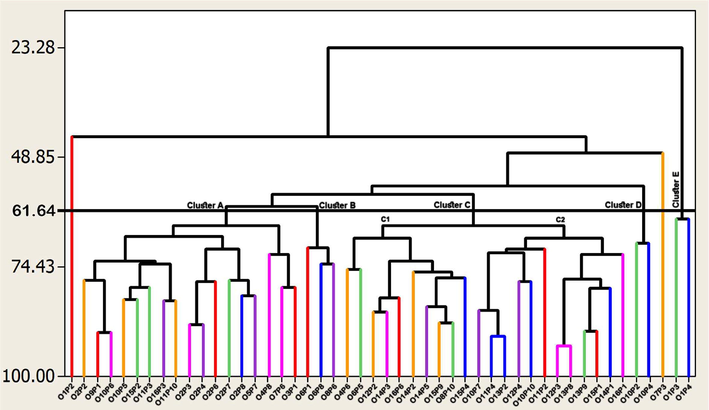
Dendrogram showing a phenotypic relationship among various phalsa genotypes based on morphological characteristics.
A total of 20 UBC (University of British Columbia) ISSRs were applied on collected germplasm to study the genetic diversity (Table 2). Results indicated that all primers are polymorphic (Fig. 2). The range of allele size for ISSRs varied from 300 to 1600 bps (Table 4). The highest value of PIC (0.485) and Dj (0.389) was obtained through UBC-812, while the lowest value of PIC (0.156) and Dj (0.126) was obtained through UBC-849 as compared to other markers. Moreover, the highest value of Cj (0.779) was calculated in UBC-849, while the lowest value of Cj (0.032) was obtained through UBC-812. Further detail regarding the number of loci, the range of allele size, PIC, Cj, and Dj values are given in Table 4.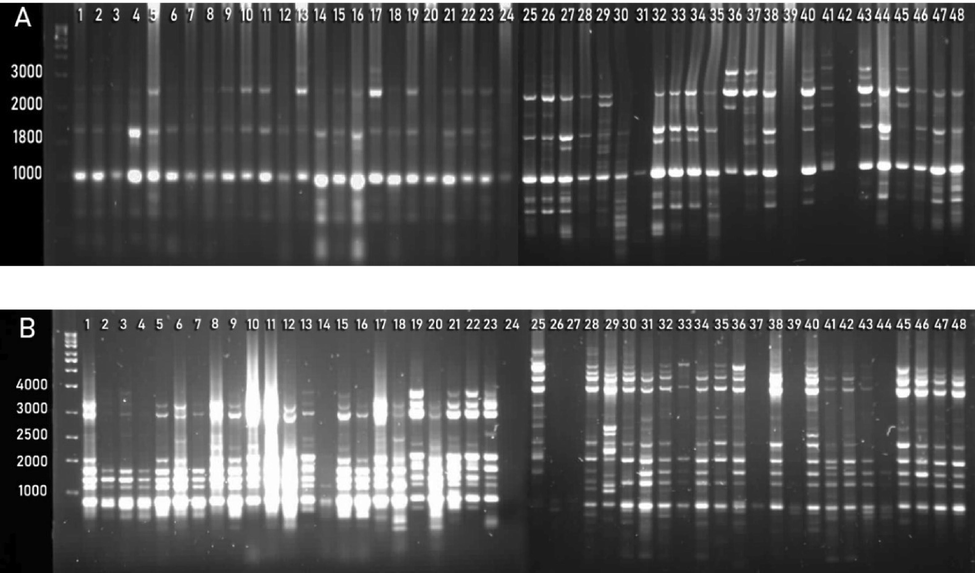
ISSRs amplification of phalsa genotypes generated with primer UBC-825 (A) and UBC-834 (B).
Primer Name
Number of loci
Range of allele size (bp)
PIC
Cj
Dj
UBC-808
8
500–3000
0.284
0.7157
0.355
UBC-809
9
500–3000
0.415
0.601
0.300
UBC-810
9
500–3200
0.467
0.493
0.246
UBC-811
8
500–2500
0.381
0.637
0.318
UBC-812
5
500–1500
0.485
0.032
0.389
UBC-814
7
500–2500
0.413
0.603
0.301
UBC-815
10
500–3000
0.471
0.542
0.271
UBC-816
5
500–1500
0.459
0.510
0.255
UBC-817
5
500–1200
0.276
0.748
0.374
UBC-820
8
500–3000
0.357
0.663
0.330
UBC-823
7
500–3000
0.475
0.537
0.268
UBC-825
6
500–3000
0.430
0.479
0.239
UBC-827
8
500–3000
0.448
0.489
0.244
UBC-829
4
600–1200
0.419
0.597
0.298
UBC-834
6
700–2500
0.248
0.163
0.263
UBC-835
8
500–2200
0.271
0.699
0.349
UBC-845
8
500–3000
0.400
0.560
0.280
UBC-846
8
500–3000
0.166
0.526
0.164
UBC-847
6
500–1200
0.334
0.579
0.370
UBC-849
9
500–3000
0.156
0.779
0.126
Dendrogram, based on ISSR markers, grouped forty-eight genotypes into eight main clusters (cluster A-H) while truncated at a similarity coefficient of 0.63 (63 %) (Fig. 3). Cluster A consisted of two genotypes (“O3P1” and “O12P4”) sharing 72 % genetic similarity. Cluster B contained “O15P4” and “O16P3” which were the least similar genotypes (64 %) to others. Cluster C also contained two genotypes (“O11P4” and “O13P9”). O11P4 shared 69 % genetic similarity with 013P9. Cluster D was the second-largest cluster consisting of thirteen genotypes. Cluster E and Cluster G comprised of three genotypes each, whereas cluster F had five genotypes. Cluster H was the largest cluster and compromised of two sub-clusters (H1 and H2). The sub-cluster H1 consisted of six genotypes in which “O2P4” shared 100 % genetic similarity with “O2P7” while there were ten genotypes in sub-cluster H2. Two genotypes, “O12P2” and “O7P3”, remained independent and did not group with any other genotypes.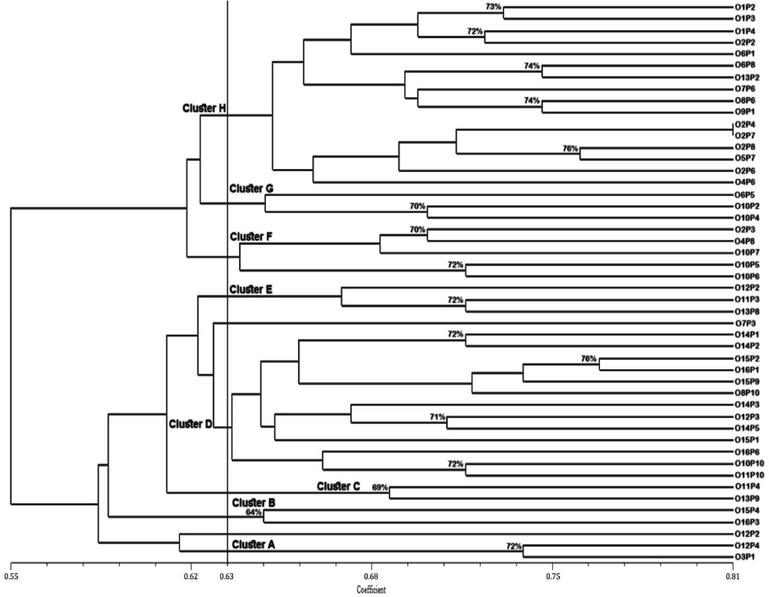
Dendrogram showing a genotypic relationship among phalsa genotypes based on ISSR markers.
Moreover, population structure analysis for forty-eight phalsa genotypes was performed based on ISSRs results by adopting an admixed Bayesian model (Fig. 4A-C). An increase in the logarithm of the data likelihood [Ln (PD)] on average was observed with increasing the numbers of assumed sub-populations (K) from 2 to 10. The adhoc quantity based on the second-order rate of change in the log probability (ΔK) exhibited a clear peak at K = 3. Hence, data analysis suggested that the K value of 3 is the most probable prediction for the number of sub-populations for both ISSRs (Fig. 4A). ISSRs based structure analysis depicted that bar plot has been configured into three different colors, i.e., red, blue, and green. The highest contribution was recorded from green color (Fig. 4B and C).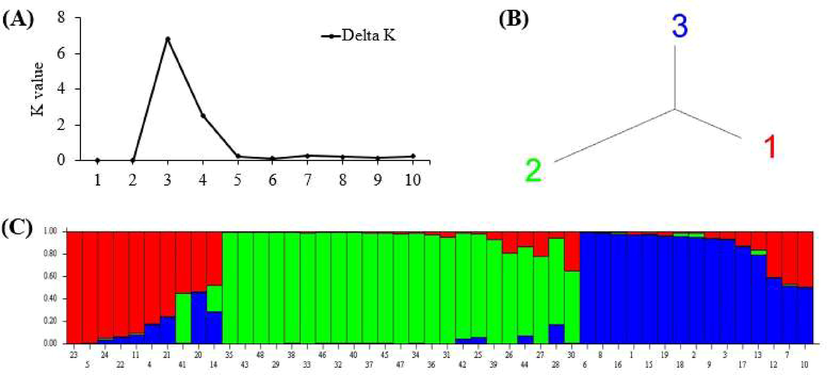
Population structure analysis showing a genetic relationship among forty-eight phalsa genotypes based on ISSR markers: A = best K value graph, B = neighbour-joining tree and C = bar plot.
4 Discussion
According to the current findings, significant levels of diversity were observed in the wild phalsa population of Southern Punjab (Pakistan), both at the morphological and molecular levels. For example, variation in leaf color ranged from dark green to whitish green. Interestingly, the growth habit of two genotypes (“O1P3” and “O1P4”) was upright while the rest of the genotypes showed drooping growth habit. Similarly, variations were observed for other characters of the leaf and plant. Overall, the two genotypes (“O1P2” and “O7P3”) showed significant variability among all genotypes. These differences may be due to environmental changes, as the samples were collected from different locations with varying climatic conditions. It is well known that the interaction of a given genotype with different environments produces possible variations in phenotypic characters (Teng et al., 2002). Pettersen et al. (2006) stated that the differences in essential oil content in the rose plant may be caused by different environmental conditions such as temperature, humidity, and precipitation. Therefore, morphological characterization alone has limitations in providing precise information due to environmental influence (Belaj et al., 2003).
Determination of plant genotype by evaluating genetic differences is an effective tool that strengthens and confirms morphological characterization results. With the use of molecular markers and DNA fingerprinting, genotypes can be accurately identified and the actual relationship between the genotype affected by environmental conditions and geographic location in a population group can be measured (Ahmad et al., 2019). Because the genetic structure is not affected by climatic conditions. Thus, the variability observed by ISSR markers in this study can distinguish and identify different genotypes of different genetic makeup. This study revealed a wide variety of genetic variations in the phalsa germplasm.
In this study, the dendrogram based on ISSRs shows noticeable differences in the number of clusters as well as the position of genotypes within the clusters. The reason for this difference was that molecular markers recognized distinctive regions of DNA variation within the genome (Dongre et al., 2004). The two genotypes (“O2P4” and “O2P7”) showed maximum genetic similarity (100 %) and therefore they were very close to each other in the dendrogram among all genotypes. The fact that “O12P2” and “O7P3” do not cluster with any other genotype indicates that these genotypes have different genetic makeup, distinctive background, and a high degree of polymorphism. Maximum genetic variation in these genotypes requires protection of these genotypes from natural disasters and human activities. Also, collecting and then maintaining various populations is better than collecting a few samples from each population (Kaundun and Park, 2002).
The effectiveness of primers is an important factor in scientific studies, especially when genetic diversity is estimated. PIC is considered equivalent to genetic diversity as it determines the frequency of alleles per locus and the number of alleles expressed. The PIC value also indicates the dominant or co-dominant nature of the marker. ISSR markers PIC values range from 0.0 to 0.5 as they are dominant markers, the higher the PIC value, the higher the genetic diversity. PIC is directly proportional to Dj and inversely proportional to Cj. Primers with a minimum Cj value and a maximum PIC and Dj value are excellent for detecting allelic variation in genotypes (Riek et al., 2001). Minimal genetic diversity was revealed by primer UBC-849 due to low PIC (0.156), Dj (0.126), but highest Cj (0.779). Therefore, the UBC 849 primer would not be more efficient for assessing genetic diversity. Overall, the UBC-812 primer gave maximum PIC (0.485), Dj (0.389) but minimum Cj (0.032). Therefore, it is considered a more efficient primer for the estimation of genetic diversity among plant populations.
5 Conclusion
In the present study, forty-eight genotypes were investigated for identification and characterization. A wide variation was found among genotypes based on morphological and molecular characters. Among twenty ISSR markers, UBC-812 was found to be the most effective for the estimation of genetic variability of phalsa genotypes. Particularly, two genotypes (“O1P2”and “O7P3”) showed distinct variability in morphological and molecular characters among all the genotypes and this variability would be interesting to broaden the genetic base of phalsa breeding programs.
Acknowledgements
The current study was supported by Guizhou Provincial Science and Technology Projects (Qian Ke He Ji Chu-ZK[2022] General 071), the National Natural Science Foundation of China (32060679), the Guizhou University Cultivation Project (Gui Da Pei Yu[2019]No.52). The authors gratefully acknowledge the financial support for the current study under CS-362 funded project by Pakistan Agricultural Research Council-Agricultural Linkages Program. This project was supported by Researchers Supporting Project Number (RSP-2023R7) King Saud University, Riyadh, Saudi Arabia.
Declaration of Competing Interest
The authors declare that they have no known competing financial interests or personal relationships that could have appeared to influence the work reported in this paper.
References
- Genetic Diversity and Selection of Suitable Molecular Markers for Characterization of Indigenous Zizyphus germplasm. Erwerbs-Obstbau.. 2019;61:345-353.
- [Google Scholar]
- Effect of Different Pruning Intensities and Times on Fruit Yield and Quality of Phalsa (Grewia Asiatica L.) J Agric. Res.. 2018;56(2):107-111.
- [Google Scholar]
- Comparative Study of The Discriminating Capacity Of RAPD, AFLP And SSR Markers and Of Their effectiveness In Establishing Genetic Relationships in Olive. Theor. Appl. Genet.. 2003;107:736-744.
- [Google Scholar]
- Effect of Growth Regulators on Phalsa (Grewia Asiatica L.) Growth and Fruiting. Indian J. Hort.. 1980;37(2):124-131.
- [Google Scholar]
- Nutrient Composition and Electrophoretic Pattern of Protein in Two Distinct Types Of Phalsa (Grewia subinequalis DC) Plant Food Hum. Nutr.. 1993;44(3):255-260.
- [Google Scholar]
- Characterization of Cotton (G. hirsutum) Germplasm By ISSR, RAPD Markers and Agronomic Value. Int. J. Biotechnol.. 2004;3:388-393.
- [Google Scholar]
- Identification of Zygotic and Nuclear Seedlings in Citrus Interspecific Crosses by Inter Simple Sequence Repeats (ISSR) Markers. Afr. J. Biotechnol.. 2011;10:18965-18970.
- [Google Scholar]
- Analysis of Genetic Diversity Among European and Asian Fig Varieties (Ficus carica L.) Using ISSR, RAPD, and SSR Markers. Genet. Resources Crop Evolution.. 2009;56(2):201-209.
- [Google Scholar]
- Nutritional and Medicinal Potential of Grewia. J. Med. Plants Res.. 2015;9(19):594-612.
- [Google Scholar]
- Genetic Structure of Six Korean Tea Populations as Revealed by RAPD-PCR Markers. Plant Genet. Resour.. 2002;42(2):594-601.
- [Google Scholar]
- Characterization of Mandarin Citrus Germplasm from Southern Brazil by Morphological and Molecular Analyses. Pesqui. Agropecu. Bras.. 2003;38(7):797-806.
- [Google Scholar]
- Minimal Descriptors of Agri-Horticultural Crops. Part III: Fruit Crops. Pusa Campus, New Delhi: National Bureau of Plant Genetic Resources; 2002.
- Elucidation of Diversity Among Psidium Species Using Morphological and SPAR Methods. J. Phytol.. 2011;3:53-61.
- [Google Scholar]
- Underutilized Tropical and Subtropical Fruits of Asia. Acta Hortic.. 2008;770(7):67-76.
- [Google Scholar]
- MNFSR, 2020. Fruit, Vegetable and Condiments Statistics of Pakistan. 2019-20. Ministry of National Food Security & Research Economic Wing Islamabad, Pakistan.
- Standardization and Preliminary Phytochemical Investigation of The Fruits of Grewia asiatica Linn. Res. J. Pharmacogn. Phytochem.. 2012;4(4):212-214.
- [Google Scholar]
- Air Humidity Control EEssential For Rose Production Under Continuous Lighting. Acta. Hort.. 2006;711:323-331.
- [Google Scholar]
- Inter Simple Sequence Repeat (ISSR) Polymorphism and Its Application in Plant Breeding. Euphytica. 2002;128:9-17.
- [Google Scholar]
- Rohlf, F.J., 2002. NTSYS-pc Numerical Taxonomy and Multivariate Analysis System (Version 2.0), Exterer Software, Setauket, New York, USA.
- Genetic Relationships Among Some Cultivars of Sea Buckthorn from China, Russia and Mongolia Based on RAPD Analysis. Sci. Horti.. 2004;101(4):417-426.
- [Google Scholar]
- ISSR Markers as A Tool for The Assessment of Genetic Diversity in Passiflora. Biochem. Genet.. 2008;49(7–8):540-554.
- [Google Scholar]
- Response Of Pruning on Growth, Flowering and Fruiting in Phalsa (Grewia subinaequalis D.C.) Horticul. J.. 2004;17(1):9-13.
- [Google Scholar]
- Assessment Of Genetic Diversity In (Ziziphus mauritiana) Using Inter-Simple Sequence Repeat Markers. J. Plant Biochem. Biotechnol.. 2007;16(1):35-40.
- [Google Scholar]
- Nutritional And Medicinal Potential of Grewia Subinaequalis DC. (syn. G. asiatica.) (Phalsa) J. Med. Plants Res.. 2015;9(19):594-612.
- [Google Scholar]
- Genetic Relationships of Pyrus Species and Cultivars Native to East Asia Revealed By Randomly Amplified Polymorphic DNA Markers. J. Amer. Soc. Hortic. Sci.. 2002;127(2):262-270.
- [Google Scholar]
- Bioactive Compounds and Processed Products of Phalsa (Grewia subinaequalis L.) fruit. Pop. Kheti.. 2014;2(4):128-1113.
- [Google Scholar]
- Identification Of Zygotic and Nucellar Seedlings in Citrus Interploid Crosses by Means of Isozymes, Flow Cytometry And ISSR-PCR. Cell Mol. Biol. Lett.. 2002;7:703-708.
- [Google Scholar]
- Grewialin And Optivanin New Constituents from The Stem Bark of Grewia Optiva Drummond ex Burret (Tiliaceae) Nat. Prod. Res.. 2013;27(3):215-220.
- [Google Scholar]
- “Promiscuous Breeding Behaviour in Relation to Reproductive Success in Grewia asiatica L. (Malvaceae) Flora-Morphol. Distrib. Funct. Ecol. Plants. 2015;211:62-71.
- [Google Scholar]
- Molecular And Functional Characterization of Two Isoforms of Chalcone Synthase and Their Expression Analysis in Relation to Flavonoid Constituents in Grewia asiatica L. PLOS ONE. 2017;12(6):e0179155.
- [Google Scholar]
- Yadav, A.K., 1999. Phalsa: A potential New Small Fruit for Georgia. 348-352. In: J. Janick. Perspectives On New Crops and New Uses, ASHS Press, Alexandria, Virginia, USA. 348-352.
- Antiplatelet Activity of Methanol Extract of G. asiatica L. Leaves And Terminalla chebula Retz. Fruits. J. Med. Plants Res.. 2012;6(10):2029-2032.
- [Google Scholar]


