

Translate this page into:
Research on mountain environment factors and tang poetry's natural ecology using big data in the ecological urbanization
⁎Corresponding author. yishen202204@163.com (Yi Shen)
-
Received: ,
Accepted: ,
This article was originally published by Elsevier and was migrated to Scientific Scholar after the change of Publisher.
Peer review under responsibility of King Saud University.
Abstract
The process of urbanization in the world has improved the quality of people's lives, and has also intensified ecological and environmental problems. Mountain cities are an integral part of the urban ecosystem, and the development of cities is supported by various ecological services provided by the municipal ecosystem. Therefore, it is very important to evaluate the mountain environmental factors that affect the urban ecosystem. The mountain urban ecosystem has more and more complex regional environments and environmental characteristics. Therefore, this article analyzes the municipal ecosystem based on the application of big data, which can provide decision-making directions for city managers and facilitate the development of urbanization. Research on ecosystem services in mountainous cities is compatible with the promotion and improvement of mountainous city planning and management methods. At the same time, this article takes the traditional beauty poems described in Tang poems as examples, and uses the richly poetic landscape perspective to study the natural landscape environment more deeply. The study of natural ecology from a new perspective has further accelerated the pace of research on natural ecosystems, which is conducive to the development of natural landscape environments, provides support for the construction and depth of modern landscape environments, and has a positive impact on the natural ecological landscape of buildings. Through the research of mountain environment factors based on the application of big data, this paper applies it to the study of natural ecology in Tang poetry, thereby promoting the development of the ecological environment.
Keywords
Big data application
Mountain environment factors
Tang poetry
Natural ecology research

1 Introduction
For the ancients, mountains and water were essential to their ideal living conditions. Mountains and water are the Chinese people's general concept of nature and ecology throughout all Chinese traditional arts. People's aesthetic endeavors based on sustainable awareness include mountain and water-themed paintings and poetry. Pictures of ancient Chinese mountains and rivers typically depict the landscape of ancient China. These paintings are all about the human–nature relationship in Chinese mountains and waterways paintings. Ancient Chinese grasp of ecology and nature may be seen in the beautiful mountains and rivers they carved out of the earth. Within the confines of a canvas, a painting can convey a wide range of feelings and express a wide range of thoughts. Nature and ecology are intertwined in ancient Chinese landscape art, making it a useful tool for understanding the universe according to Chinese philosophy.
The process of urbanization in the world has brought about the rapid development of high-growth economy and technology industry, followed by a series of serious environmental problems (Asaad and Omer, 2020). China is facing the gradual reduction of traditional resources, and the skyrocketing population has led to a lot of unequal distribution of resources. The problem is in a huge city (Aarab et al., 2020). According to data, the annual population increase in China's large cities is about 18 million. The rapid growth of urban population will definitely put great pressure on the urban ecological environment, push the ecological environment problems to the forefront, and lead to the disorderly spread and expansion of major cities, etc. problem (Abdallah and Eid, 1989). At the same time, the demand for infrastructure, service facilities, housing and job opportunities within the overall scope of the city will inevitably increase gradually (Abohamida and Rakha, 2013). However, the process of Chinese cities did not stop because of this, and the different scales of municipal construction projects continued to increase and develop (Aydan et al., 2010). Therefore, China's development and urban development should pay more attention to urban ecosystem issues (Barbero and Barla, 2010). In this article, the ecosystem services are analyzed based on the application of big data, and the strategies for upgrading and optimizing mountain urban green space planning based on mountain environmental factors are summarized (Chen et al., 2008). Respectively, it puts forward optimization strategies and suggestions from the aspects of ecological value enhancement of mountainous city green space, ecological planning and design strategy, mountainous city green space landscape structure optimization, and green space planning regulation and management (Chen et al., 2016). At the same time, this article studies the ancient natural ecological environment described in Tang poetry (Du et al., 2015). Tang poetry is one of the peaks of poetry in Chinese history. There is a shining star in the history of Chinese literature. There are various types of poetry in the Tang Dynasty. And in the heyday of the Tang Dynasty when the country was prosperous and the people were strong, the creation of Tang poetry reached its peak, exploring the natural ecological research, natural ecological construction, spatial distribution, composition elements, artistic conception, etc. of the Tang Dynasty, as well as some ancient geography and Natural ecological research of historical culture (Gibson et al., 2018). Compare and analyze the current status of existing natural landscapes, inspire urban natural ecological landscapes, construct poetic landscape environment, spatial entities and spiritual connotations are indispensable, and dig deep into traditional landscapes to create modern natural landscapes, which is important for the development of urban natural environment (Han et al., 2020). It is of great significance to realize the coexistence and common beauty of the relationship between nature, city and human beings to create an urban landscape that can withstand the test of time, the precipitation of history, and the changes in aesthetics (He and Athens, 1994). It helps to realize the construction of poetry city landscape, improve the spiritual meaning of city culture, and improve the safety and competitiveness of city culture (Jiang et al., 2012).
2 Materials and methods
2.1 Overview of the study area
Urban environmental quality (UEQ) in mountain areas is evaluated in physical, constructed, and natural hazard aspects before an investigation of its spatial pattern was carried out. Pollution and densely populated areas were found to have a considerable impact on the UEQ. The density of the built environment was closely linked to road density, impervious percentage, and floor–area ratio, whereas the pollution factor was substantially linked with commercial land ratio and surface temperature. A certain ridge in the study area of this experiment is the hinterland of a certain ridge. It is located in the south of city 1, south of city 2, and north of city 3. The east and west are bounded by the provincial boundary of a certain western province. The iconic feature of the mountains is the altitude. The weather, vegetation, soil and natural geography of the mountains have a particularly prominent vertical differentiation (Lee et al., 2001). The slope is also an important topographical factor, as well as from light. There are various differences in water, temperature, soil, etc., so the composition of plant species, the degree of species abundance, the life forms and biomass of various biological plants are different (Lei, 2014). Therefore, slope has a great effect in allocating ecological space in mountainous areas.
2.2 Theoretical basis
Temperature changes that occur on a daily basis are known as weather. Forecasts are based on weather data, such as air pressure (temperature), wind speed (direction and speed), and humidity, which are collected at numerous meteorological stations. These data are then fed into a variety of applications and models in order to uncover distinct patterns, a process known as mountain weather forecasting. Weather forecasting operations for the alpine environment have advanced greatly during the past 50 years. Numerical equations are what make up the model in question. To keep track of changes in climatic attributes, a computer software solves these equations. Everything's possible to finish it all at once or to plan ahead a few days. As the world's population rises, so does the demand for food production. Weather forecasting and big data analytics should be used to improve agricultural productions in order to increase their quality. Soil degradation, overwatering, and dryness can all be prevented with the help of weather forecasts. The ability to predict rainfall allows farmers to plan their crops with greater precision, as well as to anticipate the price of food. The proper management of store inventory is made possible by weather forecasts. There are many reasons why people go on vacation, from vacationing with family and friends to attending conferences and business meetings. When it comes to choosing a destination for a vacation, the weather is by far the most important factor. In other words, climate change may have an impact on the final destination. When it comes to travellers and their desired destinations, weather forecasts play an important role. Furthermore, weather forecasting can be used to assess the economic benefits of this sector.
This article believes that as data increases, big data becomes larger, and the complexity of the relationship between data will lead to changes in the level of occurrence, so the control method and data system will change (Li and Huang, 2008). Not only does it collect a large amount of data, but the relationship between the data is also very complicated, making it difficult for traditional data management techniques to deal with this problem, and a new theory and new thinking are needed to solve new phenomena (Napier and Pcircc, 1997).
The functional characteristics of big data change with the changes of big data. From a comprehensive perspective, big data has 5 characteristics: a large amount of data, fast speed, data diversity, value, and accuracy. Agricultural data is the implementation of big data theory and large data technology in the agricultural field. In addition to its own big data in addition to the characteristics of agriculture, it also has characteristics of the agricultural field (Petersen et al., 2015). Agricultural data also contains the following functions: ubiquity, periodicity, and intersectionality. Big data technology can be divided into data collection, data storage, data analysis (distribution calculation, data mining, statistical analysis and artificial intelligence) according to the steps. Supporting the operation of big data processing systems is a new practice of data engineering application technology (Qin and Qian, 2008).
Landsense creation usually includes at least eight principles, such as the bidirection principle of vision manifestation, the multiscale principle of spatiotemporal combination, the vein-compliance principle of orientation or bearing, the systematicness principle of physical senses, the integrity principle of psychological perceptions, the integration principle of physical senses and psychological perceptions, and the dissimilarity principle of different regions. It is said that the “bidirection principle of vision manifestation” relates to the idea that humans (designers) can both graft their visions onto a landsense and also understand these visions through this landsense. Multiple spatial and temporal scales, as well as cross-scale or discontinuous trans-scales or trans-scales, can be combined in a landsense. As for the vein-compliance principle of orientation or bearing, it refers to that landsense components can be'subjectively established' according to the characteristics of the environment, the veins of mountain, river and associated fields, and especially the spatial distribution of landsense elements. Position and orientation may not be what they appear to be based on these artificial settings. Traditional Chinese poetry and mountains-and-waters paintings naturally and figuratively incorporate the bidirection principle of vision manifestation, the multiscale principle of spatiotemporal combination, and the vein-compliance concept of orientation.
2.3 Data sources
Source of extreme weather event index data: The used El Niño index ONI and SOI and Southern Oscillation Index POD data are from the National Oceanic and Atmospheric Administration (NOAA) Climate Prediction Center (CPC), and the time range is 1964–2020.
2.4 Research methods
According to the analysis of the linear trend of phenological changes, a one-variable regression equation is established, namely:
The method analysis of the unary linear regression trend is the slope rate of the least squares method of pixel-by-pixel fitting variables (climate factors, phenological period parameters), and the trend of changes in the simulation variables at each step can be simulated, and the overall area reflected the time and space changes, its formula:
Based on the site and meta-scale, the phenological beginning, final, and growth periods are analyzed with various weather factors, extreme weather indicators and ENSO event indicators, respectively. Calculation formula:
The Hurst index based on the rescaled range (R/S analysis) method is an effective method to quantitatively describe the long-term dependence of time series information. It was first proposed by the British hydrologist Hurst. Its basic principles are:
Mean:
3 Results
3.1 Changes in environmental temperature and precipitation factors in mountainous areas
Fig. 1 shows the bioclimatic diagram of a certain ridge from 1964 to 2020. According to the figure, the annual temperature curve shows a downward state, and the precipitation curve shows an upward downward state. The average rainfall from July to September is above 100 mm. It can be seen that the water and heat coordination conditions in a certain ridge area are good, the rain and heat are at the same time, and the climate is humid, which is conducive to the growth of vegetation.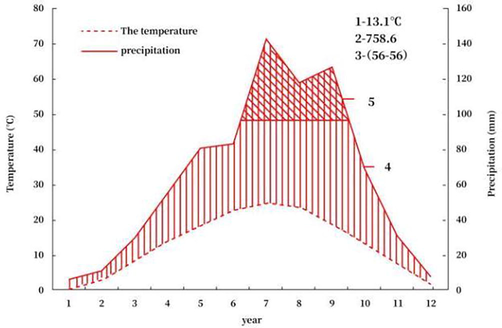
The bioclimatic diagram of a certain area from 1964 to 2020.
Fig. 2 shows the change sequence of the annual average temperature anomaly in a certain area from 1964 to 2020.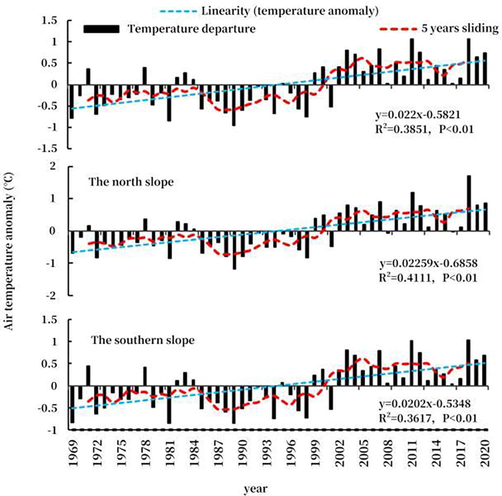
Changes in temperature anomalies in a certain area from 1964 to 2020.
Fig. 3 shows the change sequence of the annual average precipitation anomaly in a certain area from 1964 to 2020. In a specific area, there is no significant change in precipitation, but there are considerable differences in the trend of some changes. The drought trend on the northern slope is obviously higher than that on the southern slope. From the smooth curve of the 5-year precipitation anomaly, it is a rainy zone in the 1980s and a drier zone in the 1990s. The rainfall has increased since 2000.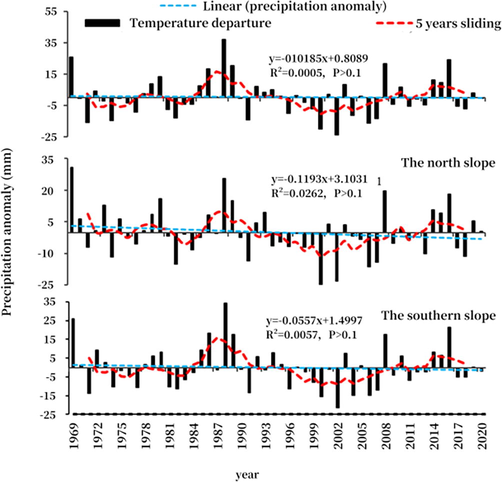
Changes in precipitation anomaly in a certain area from 1964 to 2020.
Fig. 4 shows the wavelet transform and variance of the average precipitation change in a certain ridge area from 1964 to 2020. It can be seen from Fig. 4 that the water changes in a specific area have multiple time scales. In general, there are three types of cyclical changes in precipitation, 23 to 32 years, 10 to 22 years, and 3 to 9 years. Among them, the 3 to 9 year cycle energy is relatively weak, but it always exists in the process of this research. This reflects the high-frequency oscillation characteristics of the precipitation sequence, and this cycle has a specific impact on the change of precipitation in a shorter period of time.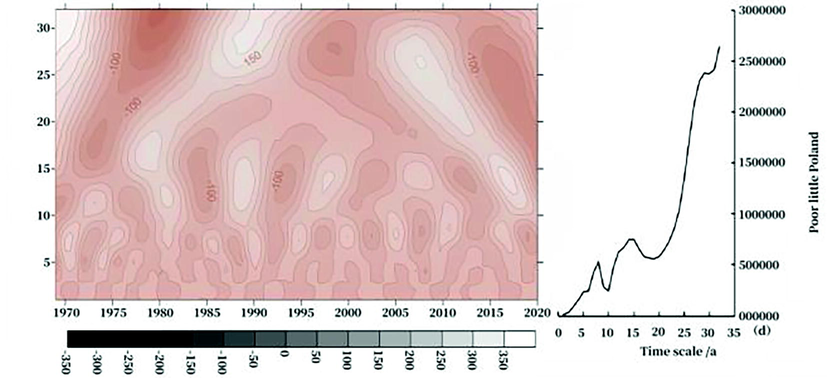
Wavelet transform and variance of the average annual precipitation change in a certain ridge from 1964 to 2020.
3.2 Influencing factors of mountain environment phenology
Table 1 shows the change trend of daily average temperature during the beginning and ending period of phenology and before and after the sudden change of phenology from 1964 to 2020.
Pre-mutation trend
R2 and significance
Post-mutation trend
R2 and significance
Phenological onset
y = 0.0327x − 53.264
R2 = 0.0567
y = 0.1406x − 268.33
R2 = 0.6626
End of phenology
v = 0.0138x − 18.228
R2 = 0.0188
y = 0.065x − 129.08
R2 = 0.4747
Table 2 shows the change trend of daily average precipitation during the beginning and ending period of phenology and before and after the sudden change of phenology from 1964 to 2020. The precipitation in the beginning period showed a significant decreasing trend, and the precipitation in the end period had large fluctuations and did not change significantly.
Pre-mutation trend
R2 and significance
Post-mutation trend
R2 and significance
Phenological onset
y = −0.04541x + 90.892
R2 = 0.3905
y = −0.0012x − 3.416
R2 = 0.0005
End of phenology
y = −0.0039x + 8.9076
R2 = 0.0018
y = −0.00951 + 20.11
R2 = 0.0338
Table 3 shows the correlation between the beginning and ending periods of the phenology and the effective accumulated temperature of each period ≥10℃ in the previous period. Table 3 shows that the effective gas temperature of ≥10℃ in the study area begins in February, that is, the effective accumulation of ≥10℃ from February is significantly negatively correlated, which means that as the temperature rebounds in early spring, the weather has a positive effect on the phenological beginning. The temperature effect is delayed by one month. As the temperature increases, the delay effect is weaker, and after the temperature abruptly changes, the delay effect becomes stronger. Regardless of whether it is on the 52-year scale or after the phenological mutation, the end of the phenology is directly proportional to any time period from the beginning of August, that is, any time period in each period is related, that is, the final temperature of the final stage is delayed The effect is about 1 month to 3 months. The correlation between the two before the phenological mutation is not important, but it is especially obvious after the phenological mutation, and it has a large cumulative effect.
From the beginning of different time periods to the day when the phenology start period occurs
Phenological onset
From the beginning to the end of the phenological period in different periods
End of phenology
52 years
Before mutation
After mutation
52 years
Before mutation
After mutation
August (213d)
0.608
0.174
0.605
February (32d)
−0.339
−0.075
−0.475
September (the 244d)
0.627
0.232
0.612
Early March (60th day)
−0.315
−0.058
−0.441
Early October (274d)
0.646
0.221
0.695
Mid-March (70th day)
−0.206
−0.017
−0.274
Mid-October (No. 284d)
0.601
0.143
0.665
Late March (80th day)
0.148
0.163
0.204
Late October (the 294th)
0.571
0.316
0.558
Table 4 shows the correlation between the beginning and ending periods of the phenology and the precipitation in each period of the previous period. Table 4 shows that the beginning of the phenology and the accumulated precipitation for each time period since January are positively correlated, that is, there is a delay effect of 1 to 3 months in the beginning of the phenology, and the beginning of the phenology is with the precipitation added in the previous period. The increase in the amount is delayed, and the increase in the amount of precipitation decreases.
From the beginning of different time periods to the day when the phenology start period occurs
Phenological onset
From the beginning to the end of the phenological period in different periods
End of phenology
52 years
Before mutation
After mutation
52 years
Before mutation
After mutation
January (1d)
0.446
0.548
0.406
August (213d)
0.165
−0.061
0.352
February (32d)
0.452
0.572
0.412
September (the 244d)
0.078
0.032
0.304
Early March (60th day)
0.551
0.622
0.529
Early October (274d)
0.076
0302
0.021
Mid-March (70th day)
0.515
0.588
0.488
Mid-October (No. 284d)
0.155
0.295
−0.032
Late March (83d)
0.561
0.715
0.552
Late October (the 294th)
0.406
0.278
0.422
3.3 The relationship between Tang poetry and natural ecological landscape design
In Chinese tradition, the “eight scenic spots” are actually important phenomena that can effectively display geographic and cultural characteristics. People have a representative point of view in a specific area, as a local symbolic landscape named “Eight Sceneries”. There are countless literati and painters who have created a large number of related paintings, poems, dramas and other derivatives for the “Eight Sceneries”, thus constructing the Eight Scenery Cultural System. In the culture of the eight sceneries, the eight sceneries poetry refers to the description of the eight sceneries using poems. This is an important part of the eight sceneries cultural system. It constitutes the effective display of the eight sceneries. This is an important part of the eight sceneries cultural system, and it constitutes the effective display of the eight sceneries. The traditional eight sceneries not only create landscape space, but also create cultural ideas.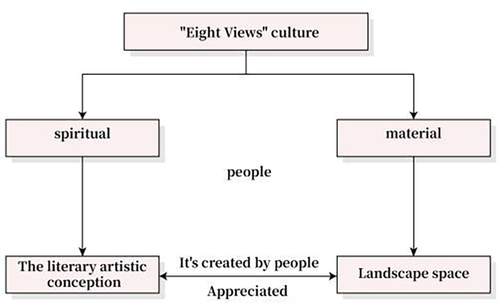
The relationship between the culture of the eight scenic spots and the landscape.
The descriptions of the eight scenic landscapes in Tang poems are characterized by a large number, clear overall imagery, precise expression of word meaning, clear spatial relationships, and clear spatial elements. To a certain extent, they make up for the shortcomings of the eight scenic landscapes that are difficult to renew today, for the study of ancient natural landscapes (Song et al., 2018). Construction provides direction. By studying and studying the eight scenic landscapes depicted in poems, it can help understand the construction of modern natural landscapes by analyzing related poems, using the analysis of related poems, extracting spatial clues, tracing the origin, and analyzing the natural landscape conditions of the eight scenic spots in the Tang Dynasty. Excavating below the human geography, exploring the construction of the eight sceneries.
There are two types of descriptions of the eight sceneries in Tang poetry. One is a large description describing the objective scenery of the eight sceneries, and the second is the poet's attitude towards the eight sceneries or views or feelings of viewing the landscape (Sun, 1988). Therefore, the eight sceneries of Tang poetry contain a large number of humanistic views, the history of the landscape environment and the expression of literary emotions. Through the description of the poet, the viewer creates an association or imagination, forms an outstanding eight sceneries in the soul, and integrates the emotions I feel into the Tang poetry. At this time, the fictional eight sceneries are integrated with the emotion of subjective appreciation. It can respond to the emotions generated by the real views of the landscape at that time, and then make the eight sceneries to create a natural space, showing the poetic modern eight sceneries. As shown in Fig. 6.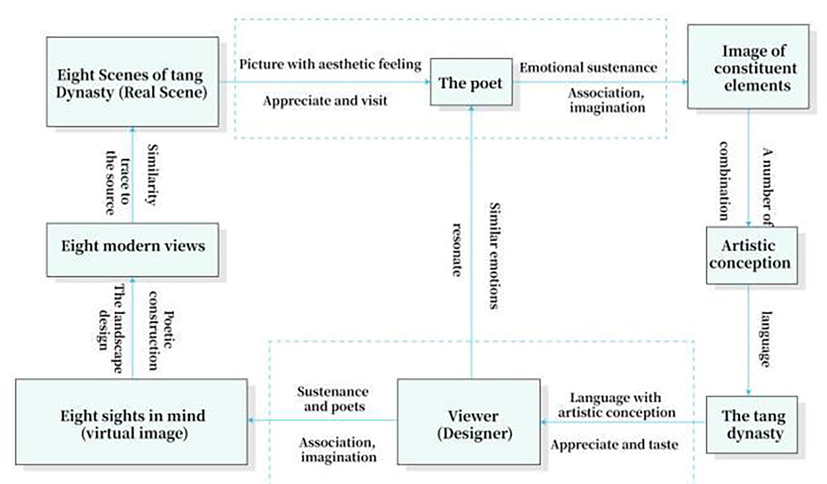
The relationship between Tang poetry and landscape construction.
3.4 The application path of Tang poetry in natural ecology
As one of the eight scenic spots, Hiraizumi Villa no longer exists. We can only learn about Hiraizumi Villa from a large number of text records. Undoubtedly, this is undoubtedly a great regret and loss for the study of the eight scenic spots in Mouyang and the literati gardens of the Tang Dynasty in Mouyang. Through relevant poetry records, there are more theoretical studies on the construction techniques of Hiraizumi villas and the construction of the gardening artistic conception. In this chapter, the poetic representation of the former site is not a mechanical restoration. This is a “preservation of the image and the removal of the appearance”.
With water landscape as the main body, different kinds of architectural sketches with different functions are established, and dynamic and static partitions are established, which meets the needs of daily life and the needs of quiet reading, and meets the needs of gatherings and meditation, as well as a place to enjoy the moon and drink. The garden presents the spatial characteristics of aloofness and degree, the reflection of the virtual and the reality, and the separation of movement and static. Therefore, it is necessary to pay attention to the application of traditional gardening techniques in the method of manufacturing landscape.
The concept of landscape artistic conception creates an era background and regional characteristics, and the design expresses the artistic conception of literati gardens in the Tang Dynasty. In the process of traveling through the gardens, following the continuous conversion of the tourist route, “stepping to different sceneries”, focusing on the rich spatial changes, resulting in a continuous arrangement of the forest and garden spaces, creating a harmonious and unified layout.
Taking the poet's historical story as the main part, the combination of landscape and poetry reflects the historical culture possessed by the gardens of poets in the Tang Dynasty. The landscape is integrated with poetry, and the selection of vegetation is based on the depiction in the poems. The landscape sequence analysis diagram of a spring villa is shown in Fig. 7.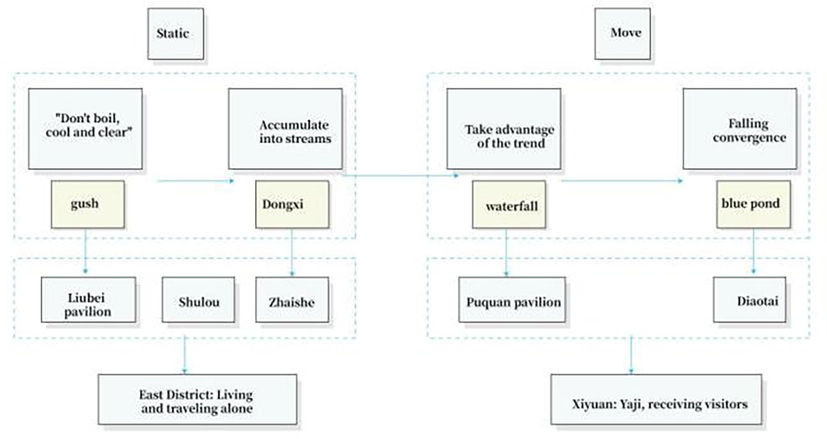
A landscape sequence analysis diagram of a spring villa.
The spring source is located in a very high geographical area of the garden. It adopts this geographical feature and uses the water scenery as the main constituent element, showing four different forms of state. The viewing platform is located in the center of the garden. The location is very high and quiet, suitable for reading. It is reasonable to set up a viewing platform in this place to experience the broad mind of ancient poets standing on tall buildings and looking into the distance. The overall design is based on the waterscape as a prominent point. The eastern area is a quiet area. Visitors feel elegant and clean, as if talking with ancient people. The western area is based on boats, fishing, waterfall watching, weird stones and other activities as themes, and the overall waterscape is the main landscape axis. The analysis diagram of the landscape node and axis of a mountain villa is shown in Fig. 8.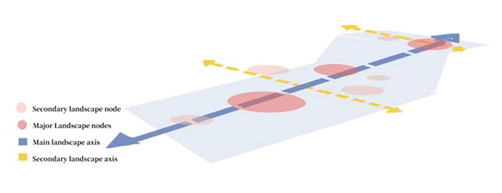
A landscape node and axis analysis diagram of a mountain villa.
The architectural style is characterized by the calm roof of the Tang line and the majestic and sparse dougong. It reflects an amazing style, presenting a sense of boldness on a large scale, and echoes the historical identity of the villas that the builders worked hard to create. The builders pay attention to the harmony of the nearby structure and the landscape. The architectural atmosphere of different dynamic and static zones is different. The sight relationship between the surrounding landscapes of the building is used to enrich the tour experience, forming opposite scenes, obstructed scenes, framed scenes and other pictures.
Establish a stone viewing area and focus on the characteristic of having peculiar stones, so that when visitors enter the viewing area, they can make all kinds of strange stones in their eyes and feel a unique temperament of the landscape area. It can also increase cultural knowledge and broaden horizons.
4 Discussion
4.1 Analysis of changes in mountain environmental factors
During the study period, the temperature increase in specific mountain areas is significant. The trend of temperature increase in the north slope is more significant than that in the south slope, and the temperature change has specific abrupt characteristics. In the past 52 years, the climatic period in certain mountainous areas has dried up and warmed in the final stage of the beginning of phenology. Compared with the last trend, the trend in the initial period is more alarming, and this trend is especially obvious after the sudden change of phenology. The temperature in the late period is the most significant, the change rate of the initial period is higher than that of the start period of the end point, and the number of sunshine hours does not change significantly, but the final trend of the change has reached a significant slowdown trend. Before the sudden change, the climate factors in the beginning and ending periods did not change much. After the sudden change, whether it is the period or the end, the temperature rise increased more obviously, and the change was always obvious and uniform. The precipitation showed a decreasing trend, and the change in the end period was more obvious than the beginning period. The number of sunshine hours has changed from a decreasing trend before the sudden change to an obvious increasing trend, and the rate of change in the beginning period is higher than that in the end period.
The initial and ending periods of the phenology have different responses to weather factors, and the effect of the phenological period on the weather changes after abrupt changes is more severe. Plants in a certain ridge area react strongly to a temperature of 10 ℃. The increase in daily average temperature during the same period has the strongest impact on the early start of the phenology and the delay of the end; The accumulation of precipitation in the previous period decreases and advances; the influence of sunshine on the advancement of the beginning period is significant with the mean value of the same period, while the end period shows a significant cumulative effect.
Before the sudden change, the subtle changes in weather factors had no obvious influence on the phenology. After the sudden change, the daily average temperature during the beginning and ending period increased by 1 ℃, the beginning period was 3 days earlier, and the end period was delayed by 12 days; the cumulative precipitation in the beginning period decreased every time The 1 mm start period is earlier by 1.3 d, and the end period is delayed by 1 d for each additional 1 mm; the start period and the end period are increased by 1 h, the start period is earlier by 4.3 days, and the end period is delayed by 18.3 days.
4.2 The natural ecological landscape construction techniques of Tang poetry
The eight sceneries were formed in the Tang Dynasty. The poets of the Tang Dynasty had a deep understanding and comprehension of the beauty contained in natural landscapes. They put their feelings in the mountains and rivers, or highlighted their personal characteristics, or judged the world lightly, or appreciated the value of natural beauty. Using poetry to describe the quiet, silent, empty and rich life of Shanshui, and bringing the description of Shanshui poetry to a crazy height, these poems are widely spread, which has contributed a lot to the fame of the Eight Views. Among the eight sceneries, they are mainly based on natural sceneries, which are all natural sceneries discovered and excavated by people. The large-view natural landscapes such as green waters, green mountains, sunset clouds and solitary sails show people's pursuit and yearning for nature, and express their own ideas.
Landscape is visual art, but there is more than just visual art. Creating a variety of sensory experiences can create the greatest degree of rich landscape experience, such as hearing, touch, smell and so on. Among the eight sceneries, hearing and smell are more widely used, and they are also the most extensive.
Hearing-use different sounds to stimulate the original static landscape objects to make them dynamic and vigorous, so that people can arouse people's imagination, and stimulate people's poetic and artistic spirit. The use of hearing can be used as the finishing touch in landscape design.
The construction of the eight sceneries also reflects the characteristics of static combination. Some of the landscape components in the eight sceneries are stationary, while other driving elements are rich in changes. The static landscape components are combined with the dynamic landscape components. Create scenery with multiple levels and rich senses. For example, the autumn breeze in Luopu, the autumn breeze blowing by the river, the tranquil air has the dynamic sense of wind, giving people a special sense of experience.
Artistic conception is embodied in the eight scenes, mainly in the following three aspects. First of all, it is the artistic conception created by the article's poems and songs. In the landscape, the existence of words can highlight the interesting meaning in the landscape, or name, or widely praised poetry, which can enable tourists to feel the emotional tone that these landscapes want to convey when visiting.
Second, anthropomorphize plants, symbolic artistic conception. The garden is created through the characteristics of plants. For example, the lotus represents nobleness, the peony represents wealth, and the plum blossom represents tenacity, which causes visitors to resonate in thought, as well as some decorative elements, such as floor coverings, doors and windows commonly used the ice cracks make people imagine the scene of returning from spring.
Finally, time and space are transformed, and the scene is merged together. In the process of appreciating the landscape, people tend to enter a state of forgetting themselves, connecting this time and this scene with some people in their own lives and integrating them into the same landscape.
4.3 Enlightenment of Tang poetry's natural ecological landscape construction
The poetic landscape created by the Eight Views has received a great deal of attention. The creation of a geographical landscape with urban characteristics, and the optimization of the human life environment is a cultural problem that a city must solve as a historical and cultural ancient city. Looking at it today, the status quo of the eight sceneries is both good and bad. Most of them have disappeared in the long history of time. The overall style of the eight sceneries and the historical and cultural background need to be further excavated and passed on.
In order to establish the modern eight sceneries and enhance the poetic flavor of the modern eight sceneries into a poetic and pictorial landscape, it is necessary to transform the Tang poetry artistic conception into a corresponding landscape artistic conception, which is a process of transforming from literature to space. The “image” is a link point in the conversion process between the two. The so-called “imagery” refers to the element environment mentioned by the poet in Tang poems that can stimulate one's own feelings and express one's own feelings. It is to use the “scene” in the lyrical scene by borrowing the scenery, base the feelings on the scenery in these environments, and put one's own feelings. Transform into the corresponding space environment, and create the emotional atmosphere expressed by the poet based on these space environments. Visitors are affected by the environmental atmosphere and make historical associations to achieve the purpose of poetic landscape as the emotions in the poetry echo. This is the reason why Tang poetry can trace the roots of the eight landscapes in the Tang Dynasty, and also provide drawings for the poetic construction of the eight landscapes. For different types of eight landscapes and current conditions, the construction methods are also different, which are divided into the following categories.
Poetic methods can be adopted for landscapes with relatively small details and relatively small spatial sizes. So far, inheritance means that the original form of well-protected space is used today, and it is necessary to protect the original state as much as possible to reduce the possibility of damage. However, in the process of inheritance, we must abide by the era of development, inject fresh blood, continuously improve it, consider new forms and artistic conceptions, and give play to the value of landscape and culture.
Some of the scenes depicted in the Eight Fields are not fully presented to us, but some historical imprints have been saved, such as ancient trees, addresses, broken bridges, temples, cemeteries, sculptures and other landscape elements. These historical imprints are fortunate to be preserved. They not only symbolize landscape elements, but also shoulder heavy responsibilities in inheriting history and culture, as well as having a strong proving role in the existence of certain cultures, and provide the value of space history. The image of the landscape mentioned in the Tang poems can be combined on the remaining landscape elements, reflecting the poeticization of the eight sceneries and also showing the historical heaviness of experiencing the baptism of the times. For example, the authentic relic of the original bridge was found about 100 m away from the west side of the current bridge. The original appearance is maintained and the outline of the past is always shown to modern people.
The landscape has historical influence and great cultural value. It can be restored by using the landscape and reproduced according to relevant historical textual materials or related pictures. A certain street disappeared with the evolution of history. In order to introduce the previous appearance of the street, we have now built a brand new certain street, and the overall style is restored to the previous certain street.
For the poetry Tang describes the various humanistic or social life in the eight scenic landscapes, such as poets’ poems, enjoying the moon by car, and feelings of leaving friends, etc., you can use the way of experience to define and construct the corresponding cultural space, so that modern people can experience this experience, feel the taste of life of the poets in the Tang Dynasty and their attitudes towards politics at that time.
5 Conclusion
With the wave of urbanization set off in the world, people’s happiness index has been improved, but serious environmental problems have come with it. This article uses big data applications to model and analyze urban ecosystems, and use multi-source data to analyze urban mountain areas. The value of the ecosystem service functions of the ecosystem should be quantitatively evaluated to find out the factors that affect the mountain environment. At the same time, this article also analyzed the natural landscape in Tang poems, studied the landscape environment in depth from the ancient and modern perspectives, accelerated natural ecological research, and promoted the development of natural ecological landscapes. When compared with last urbanization environment, our research accomplished the greatest effectiveness in the urbanization environment throughout the mountain regions of China.
Acknowledgement
The authors are thankful to the higher authorities for the facilities provided.
Authors’ contribution
This study was done by the authors named in this article, and the authors accept all liabilities resulting from claims which relate to this article and its contents.
Conflicts of interest
There are no conflicts of interest.
Availability of data and materials
The data used to support the findings of this study are available from the corresponding author upon request.
Statements and declarations
The author declares that no conflict of interest is associated with this study.
Funding
This article is one of the research achievements of Jiangsu social science foundation project, and Tang Jun is the host of the project. (Project Name: Research on ecological consciousness and Chinese aesthetic spirit in Tang poetry, project number: 16ZWD002).
References
- Facies characterization and depositional environment of Baluti Formation (Late Triassic) from selected sections in the Kurdistan region. Northern Iraq. Arab. J. Geosci.. 2020;13:1253.
- [Google Scholar]
- Direct flotation of low-grade Moroccan phosphate ores: a preliminary micro-flotation study to develop new beneficiation routes. Arab. J. Geosci.. 2020;13(23)
- [Google Scholar]
- Finite element analysis of tidal currents over the Red Sea. Hydrol.. 2013;1(2):13-17.
- [Google Scholar]
- Response and stability of underground structures in rock mass during earthquakes. Rock. Mech. Rock. Eng.. 2010;43(6):857-875.
- [Google Scholar]
- Stability analysis of a rock column in seismic conditions. Rock. Mech. Rock. Eng.. 2010;43(6):845-855.
- [Google Scholar]
- A study of reservoir-induced earthquake of three gorges project. Chin. J. Rock. Mech. Eng.. 2008;27(8):1513-1524.
- [Google Scholar]
- Experimental study of motion characteristics of rock slopes with weak intercalation under seismic excitation. J. Mt. Sci.. 2016;13(3):546-556.
- [Google Scholar]
- Methods for determining early warning indices based on natural frequency monitoring. Rock. Soil. Mech.. 2015;36(8):2284-2290.
- [Google Scholar]
- Pseudo-static failure modes and yield accelerations in rock slopes. Int. J. Rock. Mech. Min. Sci.. 2018;102:1-14.
- [Google Scholar]
- Model test on the bearing behaviors of the tunnel-type anchorage in soft rock with underlying weak interlayers. Bull. Eng. Geol. Environ.. 2020;79(2):1023-1040.
- [Google Scholar]
- Mechanical properties of shock-damaged rocks. Int. J. Rock. Mech. Min. Sci.. 1994;31(5):525-533.
- [Google Scholar]
- Research on health assessment technique of tunnel lining based on power spectrum density characteristics of microtremors. J. Japan Soc. Civ. Eng.. 2013;68(3):I_111-I_118.
- [Google Scholar]
- Influence of asperity degradation on the mechanical behavior of rough rock joints under cyclic shear loading. Int. J. Rock. Mech. Min. Sci.. 2001;38(7):967-980.
- [Google Scholar]
- Lei, P., 2014. Analysis on shear properties of through discontinuity and stability of slope with through discontinuity. Dissertation. Chongqing University.
- Some thoughts on reservoir-induced earthquakes. Technol. Earthq. Disaster Pre.. 2008;3(1):61-71.
- [Google Scholar]
- The use of a multiple expansion techniques to analyze large scale fracture process and seismic recurrence effects in deep level mines. Int. J. Rock. Mech. Min. Sci.. 1997;34(3/4):680-691.
- [Google Scholar]
- The 2014 United States National Seismic Hazard model. Earthquake Spectra. 2015;31(1_suppl):S1-S30.
- [Google Scholar]
- The relation between acceleration and intensity of reservoir induced earthquake. Seismol. Geomagn. Obs. Res.. 2008;29(3):1-9.
- [Google Scholar]
- Dynamic response characteristics of a rock slope with discontinuous joints under the combined action of earthquakes and rapid water drawdown. Landslides. 2018;15(6):1109-1125.
- [Google Scholar]
- Structural mechanics of rock mass. Beijing: Scientific Press; 1988.


