

Translate this page into:
Correlation between platelet metrics and cardiovascular risk in prediabetes with coronary artery disease: A two-year cross-sectional study
⁎Corresponding authors. sunilkumarmed@gmail.com (Sunil Kumar), ssohrab@kau.edu.sa (Sayed Sartaj Sohrab)
-
Received: ,
Accepted: ,
This article was originally published by Elsevier and was migrated to Scientific Scholar after the change of Publisher.
Abstract
Objectives
Prediabetes is associated with coronary artery disease (CAD), as even a 1% increase in glycated hemoglobin (HbA1c) may increase CAD severity and associated mortality over ten years. A definite association exists between platelet indices, CAD, and diabetes mellitus. Although research has demonstrated an association between CAD and prediabetes as well as platelet indices, there have been no attempts to assess the association of platelet indices in prediabetic patients who are at risk of CAD.
Methods
A cross-sectional study took place between 2019 and 2020 in the medical department of a rural medical college located in Central Maharashtra, India. A total of 180 patients with prediabetes and documented CAD on coronary angiography were enrolled in this study. For all participants, platelet indices, blood sugar levels, glycosylated hemoglobin (HbA1c) levels, lipid profiles, and anthropometric measurements were recorded, and then statistical analysis was conducted.
Results
Mean platelet volume had a substantial positive correlation with HbA1c, fasting blood sugar, postprandial blood sugar, systolic blood pressure, diastolic blood pressure, body mass index, waist circumference, and waist/hip ratio, with correlation coefficients of 0.2, 0.173, 0.219, 0.218, 0.234, 0.165, 0.182, and 0.164, respectively. A significant negative correlation was found between platelet distribution width and high-density lipoprotein (HDL) level, with a correlation coefficient of −0.373.
Conclusion
Platelet indices, which are routinely available through standard clinical investigations, can effectively predict the risk of CAD in prediabetic patients. Their strong association with multiple risk factors allows for enhanced prognosis and facilitates early intervention planning for CAD in this high-risk group.
Keywords
Prediabetes
Coronary artery disease
Platelet indices
Mean platelet volume
Platelet count
Plateletcrit
Platelet distribution width

1 Introduction
Coronary artery disease (CAD) is among the most important and prevalent causes of mortality worldwide (Sreeniwas & Sinha, 2020). Patients with prediabetes may be at greater risk of acquiring diabetes. The diagnosis of prediabetes is usually confirmed through fasting, glycosylated hemoglobin, postprandial blood glucose levels, or a simple glucose tolerance test (Tabák et al., 2012; Gleissner et al., 2007). Recently, a significant association between the prediabetic stage and CAD has been identified (Papa et al., 2013; Pereg et al., 2010). Notably, an increase of 1 % in HbA1c levels can elevate the severity of CAD and its associated mortality over a ten-year period. This leads to advanced vascular changes characteristic of atherosclerosis, including endothelial-dependent vasodilation, smooth muscle dysfunction, and increased arterial stiffness (Kansal & Kamble, 2016; Bansal, 2015).
Platelets are anucleate cells that vary in size, density, and hemostatic potential. Larger platelets are more reactive, making platelet size a crucial marker of platelet function (Demirin et al., 2011). With the advent of automated cell counts, platelet parameters are now routinely available in most clinical laboratories and have been linked to CAD. However, no research has explored the connection between platelet parameters and cardiovascular risk factors, such as lipid profiles and anthropometric measures like body mass index, waist circumference, and waist-to-hip ratio, in prediabetic patients who develop CAD before advancing to diabetes mellitus, as highlighted in this article.
In nutshell, prediabetes and CAD represent significant global health risks. Prediabetes, marked by elevated blood sugar levels, is a precursor to both diabetes and CAD. Prediabetic individuals face a higher risk of developing CAD, emphasizing the need for early intervention and lifestyle modifications. Understanding the connection between prediabetes and CAD can guide targeted interventions to reduce the CAD burden in this population. Identifying platelet indices in prediabetic patients could greatly enhance the clinical management of CAD screening. Increased platelet indices, including mean platelet volume (MPV), platelet distribution width (PDW), and platelet count, are linked to heightened platelet activation and aggregation, which contribute to CAD. Incorporating these indices into the assessment of prediabetic patients improves CAD prediction, prevention, and management, leading to more tailored and effective clinical approaches.
2 Material and methods
2.1 Participation selection
A prospective cross-sectional study was conducted, enrolling 200 patients after receiving ethical approval from the institutional ethics committee, spanning from September 2019 to August 2021. Inclusion criteria were patients over 18 years of age with CAD documented by coronary angiography, fasting blood sugar levels between 110 and 125 mg/dl, postprandial sugar levels between 140 and 200 mg/dl, HbA1c levels between 5.7 % and 6.4 %, and those who provided informed consent (Talwar et al., 2023). Exclusion criteria included patients under 18, pregnant females, patients with thrombocytopenia, hereditary platelet disorders, malignancies, and liver or renal disease. The flow chart in Fig. 1 illustrates the study design and sample selection process.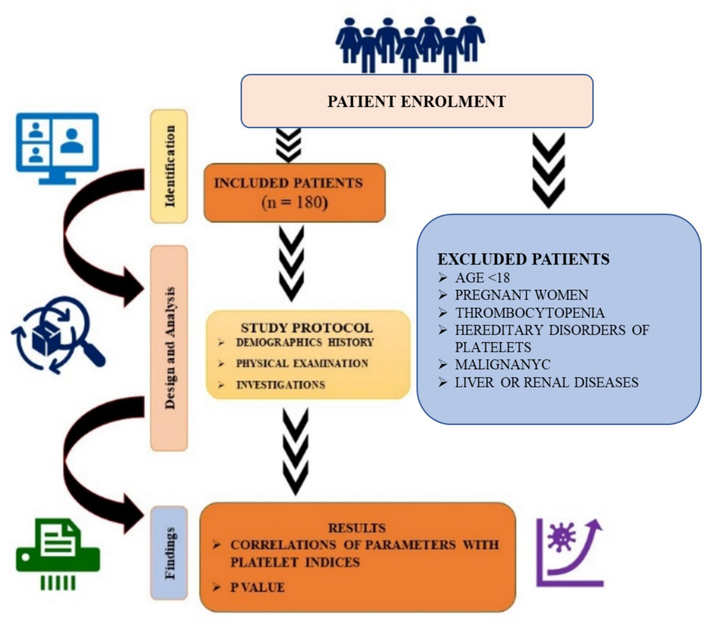
Flow diagram of the cross-sectional study.
2.2 Sample size
Considering a prevalence of 12.8 % and a value of 1.96 at 5 % type I error, the sample size (N) was computed using the following formula: in this formula, p was 10 % = 0.128,1-p was calculated as 1–0.128, and d represented the desired margin of error = 5 % = 0.05 (Farias et al., 2010). Using this formula, the sample size (N) was calculated to be 172. Therefore, an initial sample size of 200 was chosen, and ultimately, 180 patients were included in the study.
Study definitions.
Weight − Weight was measured using a digital scale set to 0.0. Participants removed their footwear and stood in the center of the scale with minimal clothing, feet slightly apart, hands at their sides, and eyes straight ahead. The resultant score of weight was noted.
Height − Height was measured with a portable stadiometer while subjects stood erect, with weight evenly distributed and feet flat on the platform, looking straight ahead. Height was measured and recorded.
Waist circumference − Using non-stretchable tape, waist circumference was measured to the nearest 0.1 cm at the midpoint between the iliac crest and the last costal margin in the back, and the umbilicus in the front. This measurement was taken at the end of normal expiration with the subject standing upright in a relaxed position.
Hip circumference − Hip circumference was recorded with a measuring tape to the nearest 0.1 cm at the widest part of the participant’s ischial tuberosity.
The waist-to-hip ratio (WHR) was determined by dividing the waist circumference (cm) by the hip circumference (cm). According to the World Health Organization (WHO), the cutoff for WHR is > 0.90 for men and > 0.85 for women (Pasalic et al., 2016).
BMI (Asia-Pacific criteria) − Body mass index (BMI) was calculated by dividing body weight in kilograms by height in meters squared (kg/m2). According to the Asia Pacific standards, the categories were: underweight (<18.5), normal (18.5–22.9), overweight (23.0–24.9), and obese (>25.0) (Dogru et al., 2007).
Blood pressure measurement − Blood pressure was measured twice with a mercury sphygmomanometer, 5 min apart, and the average was recorded. Hypertension is defined as a blood pressure reading of 140/90 mmHg or higher on two or more occasions, or if the individual is receiving treatment for or has been previously diagnosed with systemic hypertension (Shimodaira et al., 2013).
Glycated hemoglobin (HbA1c) − HbA1c reflects the average plasma glucose level over the past 8–12 weeks. Prediabetes was diagnosed with an HbA1c level of 5.7 to 6.4 %, while patients with an HbA1c level above 6.5 % were diagnosed with diabetes mellitus and excluded from the study (Braester et al., 2021).
Fasting blood glucose − Fasting blood glucose concentrations should range between 70 and 110 mg/dL. Patients were excluded from the trial if their fasting blood glucose level exceeded 126 mg/dL on two separate occasions, as this indicated diabetes (Braester et al., 2021).
The oral glucose tolerance test (OGTT) − Measures blood sugar levels before and two hours after the intake of a 75 g oral glucose load. Prediabetes was diagnosed when blood sugar levels after the ingestion of 75 g of glucose were between 140 and 199 mg/dl. Diabetes was diagnosed when 2-hour blood sugar levels were greater than or equivalent to 200 mg/dl, and the patient was excluded from the trial.
Prediabetes − According to the WHO, prediabetes is defined by fasting blood glucose levels between 110 and 125 mg/dl and an oral glucose tolerance test showing blood glucose levels between 140 and 199 mg/dl (Kurt et al., 2017).
Coronary artery disease definition based on coronary angiography (CAG) − CAG was conducted using the Judkins procedure with a radial or femoral artery puncture. CAG results were independently evaluated by two cardiologists. The percentage of coronary stenosis was computed using in-house Philips software. Coronary artery disease was defined as > 50 % of the coronary vessel block on coronary angiography (Pasalic et al., 2016; Dogru et al., 2007).
Mean platelet volume (MPV) − MPV measures the size of platelets. Numerous studies indicate that the normal range for MPV is between 7.2 and 11.7 fL (Demirin et al., 2011; Farias et al., 2010).
Plateletcrit (PCT) − PCT represents the percentage of blood volume occupied by platelets, calculated using the formula PCT = (platelet count × MPV) / 10,000. Under physiological conditions, platelet quantity is maintained through regeneration and removal, with a typical PCT range of 0.22–0.24 % (Demirin et al., 2011; Farias et al., 2010).
Platelet distribution width (PDW) − PDW measures platelet anisocytosis, calculated from the distribution of individual platelet volumes. The reference range for PDW is 10.0 %-17.9 % (Demirin et al., 2011; Farias et al., 2010).
Platelet Count − This is the number of platelets per cubic millimeter (cumm) of whole blood. Normally, the platelet count ranges from 1.5 to 4.5 lakhs per μL of blood (Demirin et al., 2011).
Statistical analysis
Numbers and percentages (%) represent categorical variables, whereas quantitative data are expressed as mean ± SD. The Mann-Whitney test was utilized for comparing quantitative variables between two groups, and the Kruskal-Wallis test for comparisons involving multiple groups. The Spearman rank correlation coefficient evaluated correlations between factors and platelet indices. Analyses were conducted using IBM SPSS software (version 21.0; IBM, Chicago, USA), with P < 0.05 considered statistically significant.
3 Ethical approvalxxx
The institutional ethics committee (DU/IEC/Aug-2019/8220) approved the study for the period from September 2019 to August 2021. All participants provided written informed consent for their inclusion and the use of their data for research and educational purposes. The study procedures complied with the Declaration of Helsinki guidelines.
4 Results
This study included 130 (72.22 %) male and 50 (27.78 %) female patients. The mean age of the study subjects (in years) was 57.1 ± 10.1 years. As shown in Fig. 2, 55 patients with single-vessel disease (SVD), 65 patients with double-vessel disease (DVD), and 60 patients with triple-vessel disease (TVD) were included. Furthermore, among the 65 patients diagnosed with DVD, 15 were nonalcoholic females. Other patient demographics and characteristics are illustrated in Fig. 2.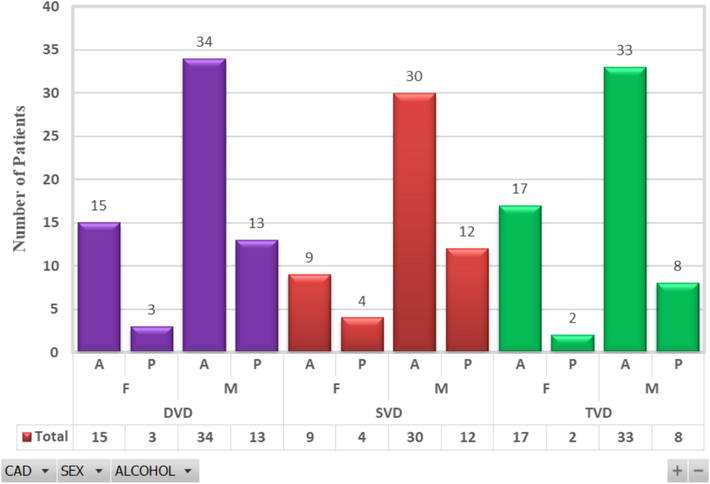
Distribution of patients with CAD, sex (M: Male, F: Female) and alcohol consumption status (A: Absent, P: Present). This study included 180 patients with CAD, sub-categorized as follows: 55 patients with single vessel disease (SVD) indicated in red, 65 patients with double vessel disease (DVD) indicated in purple, and 60 patients with triple vessel disease (TVD) indicated in green. Among the DVD group, there were 18 female patients, 15 of whom were alcohol absent (A) and 3 alcohol presents (P). Additionally, there were 47 male patients in the DVD group, with 34 being alcohol absent and 13 alcohol presents. In the SVD group, there were 13 female patients, 9 of whom were alcohol absent and 4 alcohol present, and 42 male patients, with 30 being alcohol absent and 12 alcohol presents. In the TVD group, there were 19 female patients, 17 of whom were alcohol absent and 2 alcohol present, and 41 male patients, with 33 being alcohol absent and 8 alcohol presents. (For interpretation of the references to colour in this figure legend, the reader is referred to the web version of this article.)
The baseline characteristics of the patients are shown in Table 1. The platelet distribution width (%) in the nonalcoholic group was 16.3, significantly greater than that in the alcoholic group (15.3 %, p value = 0.005). The platelet count (cells/mm3), mean platelet volume (fL), and plateletcrit (%) in hypertensive patients were 3.15, 10.1, and 0.3, respectively, which were significantly greater than those in non-hypertensive patients (2.96 (p = 0.012), 9.24 (p = 0.005), and 0.27 (p = 0.005), respectively). A significant association was observed between CAG and platelet count (cells/mm3), mean platelet volume (fL), plateletcrit (%), and platelet distribution width (%) (p < 0.05). * − Spearman rank correlation coefficient, fL − femtoliters, s.d. − standard deviation, † −.
Parameters
Platelets count(cells/mm3)
Mean ± s.d.P value
Mean platelet volume(fL)
Mean ± s.d.P value
Plateletcrit (%)
Mean ± s.d.P value
Platelet distribution width (%)
Mean ± s.d.P value
Male(n = 130)
3.18 ± 0.44
0.941
9.58 ± 1.14
0.854
0.3 ± 0.07
0.733
15.62 ± 1.38
0.269
Female(n = 50)
3.22 ± 0.43
0.941
9.57 ± 1.13
0.854
0.31 ± 0.07
0.733
15.86 ± 1.31
0.269
Smokers(n = 53)
3.16 ± 0.41
0.601
9.62 ± 1.16
0.703
0.3 ± 0.07
0.861
15.45 ± 1.31
0.08
Nonsmokers(n = 127)
3.2 ± 0.45
0.61
9.56 ± 1.13
0.73
0.3 ± 0.07
0.81
15.79 ± 1.37
0.08
Alcoholic(n = 42)
3.12 ± 0.46
0.56
9.46 ± 1.1
0.34
0.29 ± 0.06
0.46
15.14 ± 1.5
0.005*
Nonalcoholic(n = 138)
3.21 ± 0.43
0.56
9.61 ± 1.15
0.34
0.31 ± 0.07
0.46
15.85 ± 1.28
0.005*
Hypertension (n = 109)
3.26 ± 0.46
0.012*
9.75 ± 1.13
0.005*
0.32 ± 0.07
0.005*
15.62 ± 1.39
0.508*
Non hypertension (n = 71)
3.08 ± 0.38
0.012*
9.3 ± 1.09
0.005*
0.28 ± 0.06
0.005*
15.8 ± 1.31
0.508*
18.5–24.99{Normal BMI}(n = 57)
3.1 ± 0.48
0.102†
9.08 ± 1.31
0.002†
0.28 ± 0.08
0.008†
14.76 ± 1.5
0<.0001†
25–29.99{Overweight} (n = 112)
3.22 ± 0.41
0.102†
9.83 ± 0.95
0.002†
0.31 ± 0.06
0.008†
16.11 ± 1.02
0<.0001†
>30{Obese}(n = 11)
3.29 ± 0.47
0.102†
9.55 ± 1.19
0.002†
0.31 ± 0.08
0.008†
16.17 ± 1.34
0<.0001†
Single vessel disease(n = 55)
3.08 ± 0.47
0.012†
8.99 ± 1.29
0.0002†
0.28 ± 0.08
0.0006
14.57 ± 1.4
0<.0001†
Double vessel disease(n = 65)
3.27 ± 0.43
0.012†
9.94 ± 0.77
0.0002†
0.32 ± 0.06
0.0006
16.08 ± 0.87
0<.0001†
Triple vessel disease(n = 60)
3.21 ± 0.4
0.012†
9.72 ± 1.13
0.0002†
0.31 ± 0.07
0.0006
16.28 ± 1.15
0<.0001†
A significant association was observed between the mean platelet volume (fL), platelet count (%), and platelet distribution width (%) and body mass index (kg/m2). The correlations between systolic blood pressure and various platelet parameters, including platelet count (cells/mm3), mean platelet volume (fL), plateletcrit (%), and platelet distribution width (%), were thoroughly examined (Fig. 3). This correlation analysis explored the potential relationships between systolic blood pressure and these platelet indices, shedding light on the possible associations between blood pressure regulation and platelet function. Furthermore, the figure presents a correlation regression equation for each platelet index in relation to systolic blood pressure.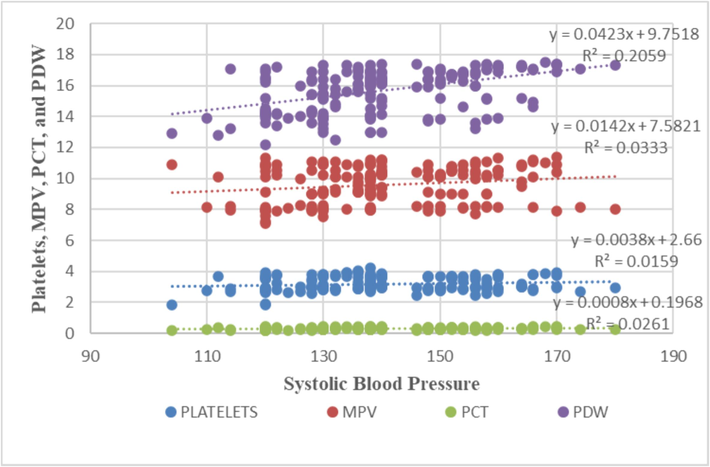
Correlations of various platelet indices with systolic blood pressure. This plot determines the correlation between platelet metrics and systolic blood pressure with maximum r2 values in between MPV and PDV. To ascertain the relationship between various parameters and platelet indices, the Spearman rank correlation coefficient was utilized. Detail sample size presented in Fig. 2.
A detailed examination of the correlation between body BMI and various platelet indices is presented in Fig. 4. The objective of this analysis was to explore the potential associations between BMI and platelet characteristics, intending to reveal insights into the relationship between body weight and platelet function. Moreover, the figure illustrates the correlation regression equation for each platelet index with respect to BMI.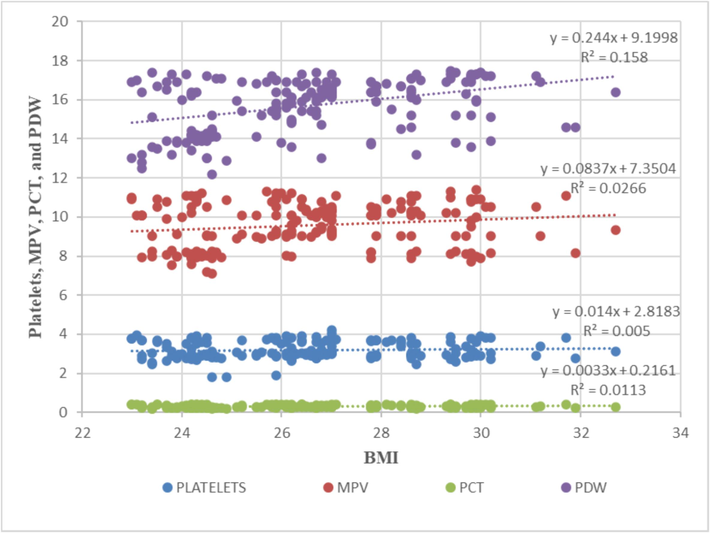
Correlations of various platelet indices with BMI. This plot determines the correlation between platelet metrics and BMI with maximum r2 values in between MPV and PDV. To ascertain the relationship between various parameters and platelet indices, the Spearman rank correlation coefficient was utilized. Detail sample size presented in Fig. 2.
Fig. 5 shows a detailed examination of the correlation between the waist/hip ratio and various platelet indices. The primary aim of this analysis was to investigate the potential associations between the waist/hip ratio and platelet characteristics, focusing on understanding how central adiposity may affect platelet function. Furthermore, the correlation regression lines for each platelet index with respect to the waist/hip ratio were calculated. By presenting these correlations and the regression equation in Fig. 5, this study sought to enhance our understanding of the interplay between the waist/hip ratio and platelet features.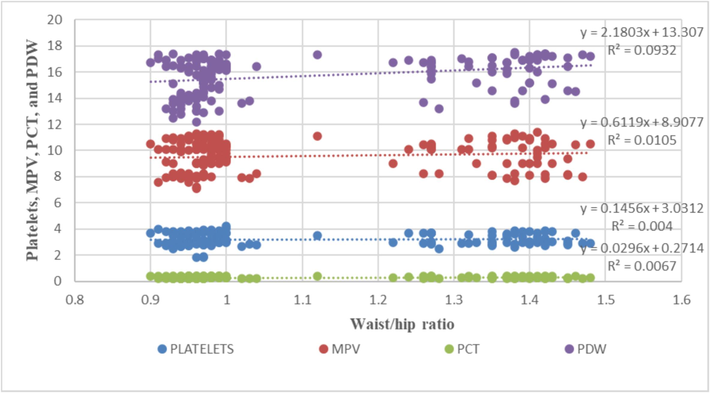
Correlations of various platelet indices with the waist/hip ratio. This plot determines the correlation between platelet metrics and waist/hip ratio with maximum r2 values in between MPV and PDV. To ascertain the relationship between various parameters and platelet indices, the Spearman rank correlation coefficient was utilized. Detail sample size presented in Fig. 2.
Fig. 6 presents an intricate examination of the correlation and equation between high-density lipoprotein (HDL) levels and various platelet indices (Fig. 6). This investigation is significant because it contributes to unraveling the potential links between lipid profiles, specifically HDL, and platelet function, which could have implications for cardiovascular health and thrombotic risk. The correlations and p values between different platelet parameters and various cardiovascular risk factors are shown in Table 2. *Spearman rank correlation coefficient.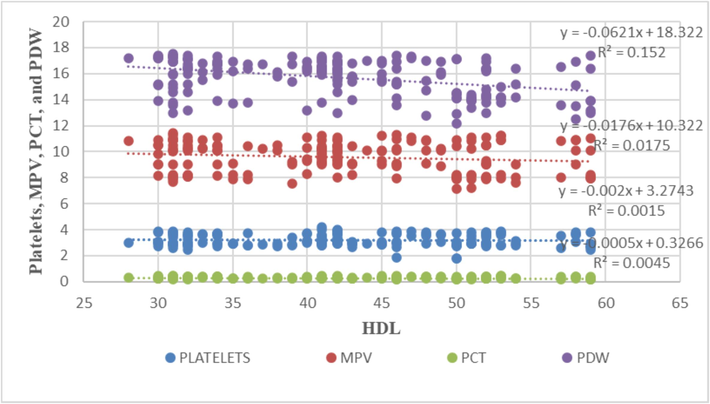
Correlations of various platelet indices with HDL. This plot determines the correlation between platelet metrics and HDL with maximum r2 values in between MPV and PDV. To ascertain the relationship between various parameters and platelet indices, the Spearman rank correlation coefficient was utilized. Detail sample size presented in Fig. 2.
Variables
Platelets count (cells/mm3)
Mean platelet volume
(fL)
Plateletcrit (%)
Platelet distribution width (%)
Age(years)
Correlation coefficient
−0.03
−0.052
−0.043
−0.0964
P value
0.68 (NS)
0.48 (NS)
0.56 (NS)
0.198 (NS)
Total cholesterol (mg/dL)
Correlation coefficient
0.012
−0.015
−0.010
−0.040
P value
0.876 (NS)
0.842 (NS)
0.897 (NS)
0.595 (NS)
HDL (mg/dL)
Correlation coefficient
−0.031
−0.121
−0.091
−0.373
P value
0.675(NS)
0.107
0.222
<0.0001
Triglyceride (mg/dL)
Correlation coefficient
0.022
0.023
0.034
−0.013
P value
0.769 (NS)
0.757 (NS)
0.646 (NS)
0.861 (NS)
LDL (mg/dL)
Correlation coefficient
0.022
0.003
−0.001
−0.026
P value
0.774 (NS)
0.966 (NS)
0.994 (NS)
0.726 (NS)
HbA1C (%)
Correlation coefficient
0.077
0.200
0.164
0.468
P value
0.304 (NS)
0.007 (S)
0.028 (S)
<0.0001 (S)
Fasting blood sugar (mg/dL)
Correlation coefficient
0.036
0.173
0.119
0.388
P value
0.629 (NS)
0.021 (S)
0.112 (NS)
<0.0001 (S)
Post prandial blood sugar (mg/dL)
Correlation coefficient
0.101
0.219
0.188
0.457
P value
0.175 (NS)
0.003 (S)
0.012 (S)
<0.0001 (S)
Systolic blood pressure(mmHg)
Correlation coefficient
0.111
0.218
0.199
0.456
P value
0.136 (NS)
0.003 (S)
0.008 (S)
<0.0001 (S)
Diastolic blood pressure(mmHg)
Correlation coefficient
0.113
0.234
0.208
0.445
P value
0.131 (S)
0.002 (S)
0.005 (S)
<0.0001 (S)
Body mass index(kg/m2)
Correlation coefficient
0.094
0.165
0.146
0.389
P value
0.208 (NS)
0.027 (S)
0.051 (S)
<0.0001 (S)
Waist circumference(cm)
Correlation coefficient
0.118
0.182
0.167
0.389
P value
0.114 (NS)
0.014 (S)
0.025 (S)
<0.0001 (S)
Waist/hip ratio
Correlation coefficient
0.115
0.164
0.152
0.367
P value
0.125 (NS)
0.028 (S)
0.042 (S)
<0.0001 (S)
Significant positive correlations were found between mean platelet volume (fL) and various factors: HbA1c (%), fasting blood sugar (mg/dL), postprandial blood sugar (mg/dL), systolic blood pressure (mmHg), diastolic blood pressure (mmHg), body mass index (kg/m2), waist circumference (cm), and waist/hip ratio, with correlation coefficients of 0.2, 0.173, 0.219, 0.218, 0.234, 0.165, 0.182, and 0.164, respectively. Similarly, plateletcrit (%) showed significant positive correlations with HbA1c (%), postprandial blood sugar (mg/dL), systolic blood pressure (mmHg), diastolic blood pressure (mmHg), weight (kg), waist circumference (cm), and waist/hip ratio, with correlation coefficients of 0.164, 0.188, 0.199, 0.208, 0.167, and 0.152, respectively. Platelet distribution width (%) also had significant positive correlations with HbA1c (%), fasting blood sugar (mg/dL), postprandial blood sugar (mg/dL), systolic blood pressure (mmHg), diastolic blood pressure (mmHg), body mass index (kg/m2), waist circumference (cm), and waist/hip ratio, with correlation coefficients of 0.468, 0.388, 0.457, 0.456, 0.445, 0.389, 0.389, and 0.367, respectively. In contrast, a significant negative correlation was observed between platelet distribution width (%) and HDL (mg/dL), with a correlation coefficient of −0.373.
5 Discussion
Coronary artery disease (CAD) remains the primary cause of death globally. Platelet indices such as mean platelet volume, platelet distribution width, and platelet count are frequently utilized as markers for assessing the severity and prognosis of CAD (Walinjkar et al., 2019; Talwar et al., 2023). In our study, males constituted 72.22 % of the study population, while females constituted 27.78 %. We included patients who underwent angiography at our institute. Males tend to have a greater incidence of CAD, coupled with a greater male-to-female ratio in India, which may have contributed to this male predominance (Walinjkar et al., 2019; Talwar et al., 2023). We found no significant correlations between sex and the MPV, PDW, or platelet count. The literature presents conflicting data on the impact of aging on MPV; however, some studies have reported an increase in MPV with age (Lippi et al., 2012; Verdoia et al., 2020). The platelet count ranged from 1.81 to 4.21 × 10⁵ cells/mm3, with a mean of 3.19 ± 0.44 × 10⁵ cells/mm3. We did not find any correlations between platelet count and age, total cholesterol, triglyceride levels, LDL levels, HbA1c, or fasting blood sugar. Although platelet count had a mild positive correlation with postprandial blood sugar, systolic blood pressure, diastolic blood pressure, weight, BMI, and waist circumference, these correlations were insignificant. The mean platelet volume was 9.58 ± 1.14 fL. MPV showed significant positive correlations with HbA1c, fasting blood sugar, postprandial blood sugar, systolic blood pressure, diastolic blood pressure, weight, BMI, waist circumference, and the waist/hip ratio. While previous studies have suggested a positive correlation between MPV and lipid profiles and age, our study did not find such correlations (Kamble et al., 2020; Vogiatzis et al., 2019). The platelet distribution width was 15.69 ± 1.36 %, and the plateletcrit was 0.3 ± 0.07 %. PDW has been reported as an excellent prognostic marker for CAD (Talwar et al., 2023). In our study, PDW showed significant positive correlations with HbA1c, fasting blood sugar, postprandial blood sugar, systolic blood pressure, diastolic blood pressure, weight, BMI, waist circumference, and the waist/hip ratio.
Smoking is a recognized independent risk factor for CAD. According to Swaminathan et al., smoking is linked to increased mean platelet volume (Anandhalakshmi et al., 2015). However, our study did not observe any significant correlation between smoking status and platelet indices. This finding aligns with Pujani et al.'s study of 220 participants, which also reported no significant difference in MPV between smokers and nonsmokers (Pujani et al., 2021). They found a significant difference in MPV among mild, moderate, and heavy smokers, which increased as the number of pack-years increased. In their cohort study, Verdoia et al. concluded that changes in platelet indices and poor outcomes in patients with CAD were more strongly associated with hypertension than with diabetes (Verdoia et al., 2014). Hypertension was significantly associated with the PLT, MPV, and PLT. These indices were greater in hypertensive patients than in non-hypertensive patients. Hypertension was not associated with the platelet distribution width. BMI was significantly associated with platelet indices. The platelet count, mean platelet volume, plateletcrit, and platelet distribution width in obese individuals (BMI > 25) were substantially greater than those in overweight individuals (BMI 23–24.99). Studies have shown that there is a reduction in mean platelet volume after bariatric surgery and weight loss, revealing an association between body mass index and platelet indices. Therefore, an increase in platelet index values indicating an increase in platelet activation may be a contributing factor to the increased risk of atherosclerosis in the obese population. In a study conducted by Riyahi et al., patients with an increased body mass index had a greater mean platelet volume and higher levels of platelet-related cytokines (soluble P-selectin), indicating increased platelet activation in obese individuals and increased levels of soluble CD40 ligand, indicating a pro-inflammatory state in obese individuals (Riyahi et al., 2018). In another study conducted by Coban et al., a positive correlation was found between mean platelet volume and body mass index (Coban et al., 2005). These findings are similar to those of the present study. Some studies have shown the MPV to be a predictive factor of prediabetes, BMI, and lipid profile, but it is not a predictive factor for the presence of CVD (Braester et al., 2021).
In our study, we found that waist circumference and the waist/hip ratio were significantly associated with mean platelet volume, platelet count, and platelet distribution width. Android fat, compared to gynecoid fat, is more responsive to lipolytic stimulation, leading to increased production of proinflammatory cytokines and higher platelet counts and indices (Walinjkar et al., 2019; Talwar et al., 2023). This contrasts with Gan et al.'s findings, which indicated a significant association between platelet count and both waist circumference and the waist/hip ratio, but no significant association with mean platelet volume and platelet distribution width (Han et al., 2018). In our study, all indices—mean platelet volume, plateletcrit, and platelet distribution width—were significantly associated with waist circumference and waist/hip ratio, while no significant association was observed with platelet count. Hou et al. also found the waist/hip ratio and waist circumference to be sensitive markers for changes in mean platelet volume and platelet distribution width, aligning with our findings (Hou et al., 2015). Prediabetes is linked to dyslipidemia, hypertension, abdominal obesity, microalbuminuria, and endothelial dysfunction, characterized by inflammation and hypercoagulability, which are associated with impaired glucose levels and insulin resistance (Talwar et al., 2023). Studies have shown that elevated glucose levels in prediabetic patients lead to increased platelet activation and aggregation (Coban et al., 2005; Han et al., 2018; Hou et al., 2015). This increased platelet activation is indicated by higher mean platelet volume, platelet distribution width, platelet count, and plateletcrit. Additionally, larger platelets are more enzymatically active and thrombogenic, increasing the cardiovascular risk in these patients compared to those without diabetes.
Identifying platelet indices in prediabetic patients has the potential to revolutionize clinical approaches to CAD screening. Elevated platelet indices, such as mean platelet volume (MPV), signal increased platelet activation linked to CAD development. By monitoring these indices, clinicians can proactively assess CAD risk in prediabetic individuals, enabling tailored interventions like lifestyle modifications, tighter glycemic control, and early antiplatelet therapy. Additionally, integrating platelet indices into CAD screening enhances risk stratification and refines prediction models, aiding personalized treatment plans. This comprehensive approach fosters early risk assessment, targeted interventions, and preventive strategies, ultimately enhancing outcomes for prediabetic patients at CAD risk.
This study demonstrates that platelet indices, like mean platelet volume (MPV), are closely linked to various risk factors for CAD in prediabetic patients. These indices show significant correlations with markers such as HbA1c, blood sugar levels, blood pressure, and body measurements. This suggests that platelet indices could serve as valuable predictors of CAD risk in prediabetic individuals. By identifying these associations, clinicians can use platelet indices to guide early intervention strategies and improve outcomes for prediabetic patients at risk of CAD. We propose that platelet and glycemic indices can be used to stratify the risk of CAD in prediabetic patients.
6 Conclusion and future research recommendation
We conclude that platelet indices are an underutilized, readily available diagnostic tool for prediabetic patients with subclinical hyperglycemia, particularly in rural healthcare centers. This study also highlights the significance of ongoing research efforts to elucidate the role of platelets in the pathophysiology of CAD in prediabetic patients. More research is needed to establish platelets as a major cause of coronary disease in patients with prediabetes. While platelet dysfunction appears to contribute to cardiovascular complications, more research is needed to establish precise mechanisms and causal relationships. This knowledge could enhance early diagnosis and intervention, ultimately improving patient outcomes.
CRediT authorship contribution statement
Sunil Kumar: Methodology, Formal analysis, Data curation, Conceptualization. Harshitha Reddy: Writing – original draft, Formal analysis, Data curation. Sourya Acharya: Writing – review & editing, Formal analysis, Data curation, Conceptualization. Avinash Parepalli: Writing – review & editing, Formal analysis, Data curation. Dhruv Tawar: Writing – review & editing, Formal analysis, Data curation. Samyank Jain kumar: Writing – review & editing, Formal analysis, Data curation. Meraj Khan: Writing – review & editing, Software, Formal analysis, Data curation. Mohammad Athar: . Esam Ibraheem Azhar: . Sayed Sartaj Sohrab: Writing – review & editing, Funding acquisition, Conceptualization.
Acknowledgments
This research work was funded by Institutional Fund Projects under grant No. IFPIP:1514-141-1443. The authors gratefully acknowledge the technical and financial support provided by the Ministry of Education and King Abdulaziz University, DSR, Jeddah, Saudi Arabia.
Declaration of Generative AI and AI-assisted technologies
All authors declare that they have not used AI and AI-assisted technologies during the preparation of this MS.
Authors contribution
SK, HR, DT, SSS and SA designed the study, contributed to the acquisition of the data, the analysis and interpretation of the data, and the writing and checking of the original manuscript. SK, HR, DT, SA, AP, MK, MA and SJK contributed to the analysis, interpretation of the data and writing and editing of the manuscript. MK and MA revised the manuscript and figures. SSS and EIA reviewed and edited the manuscript. SSS-Funding acquisition. The manuscript has been read, reviewed, and endorsed by all authors and meets the previously stated authorship criteria. Each author is confident that the manuscript reflects honest work.
References
- Anandhalakshmi S., Kalaivani A., Shivasekar., Saravanan A., 2015. Evaluation of the impact of cigarette smoking on platelet parameters. Natl. J. Physiol. Pharm. Pharmacol. 5(5): 426-430.
- Prediabetes diagnosis and treatment: a review. World J. Diabetes. 2015;6(2):296-303.
- [Google Scholar]
- What a family doctor should know about incidental finding of high mean platelet volume, metabolic syndrome, and pre-diabetes. Israel Med. Assoc. J.: IMAJ. 2021;23(11):699-702.
- [Google Scholar]
- The mean platelet volume in patients with obesity. Int. J. Clin. Pract.. 2005;59(8):981-982.
- [Google Scholar]
- Normal range of mean platelet volume in healthy subjects: insight from a large epidemiologic study. Thromb. Res.. 2011;128(4):358-360.
- [Google Scholar]
- Dogru, T., Genc, H., Tasci, I., Sonmez, A., Erdem, G., Ural, et al., 2007. Platelet aggregation is not enhanced in patients with prediabetes. Upsala J. Med. Sci. 112(3), 338–346.
- Definition of reference ranges for the platelet distribution width (PDW): a local need. Clin. Chem. Lab. Med.. 2010;48(2):255-257.
- [Google Scholar]
- Mechanisms by which diabetes increases cardiovascular disease. Drug Discovery Today. Disease Mechanisms. 2007;4(3):131-140.
- [Google Scholar]
- Han, S., Gan, D., Wang, G., Ru, Y., Huang, C., Lin, J., et al., 2018. Associations of Platelet Indices with Body Fat Mass and Fat Distribution. Obesity (Silver Spring, Md.), 26(10), 1637–1643.
- Association of adiposity indices with platelet distribution width and mean platelet volume in Chinese adults. PLoS One. 2015;10(6):e0129677.
- [Google Scholar]
- Kamble T. K., Kapse A., Kumar S., Acharya S., Ghule A., 2020. Study of Myocardial Performance Index in Prediabetes and Its Correlation with Other Cardiovascular Risk Factors. J. Evolut. Med. Dent. Sci. 9(10): 721–725.
- The increment of mean platelet volume in early stages of pre-diabetes and type 2 diabetes mellitus. Biomed. Res. (India) 2017:28.
- [Google Scholar]
- Mean platelet volume increases with aging in a large population study. Thromb. Res.. 2012;129(4):e159-e160.
- [Google Scholar]
- Macrovascular complication phenotypes in type 2 diabetic patients. Cardiovasc. Diabetol.. 2013;12:20.
- [Google Scholar]
- Platelets as biomarkers of coronary artery disease. Semin. Thromb. Hemost.. 2016;42(3):223-233.
- [Google Scholar]
- Mean platelet volume on admission correlates with impaired response to thrombolysis in patients with ST-elevation myocardial infarction. Platelets. 2010;21(2):117-121.
- [Google Scholar]
- The effect and correlation of smoking with platelet indices, neutrophil lymphocyte ratio and platelet lymphocyte ratio. Hematol. Transfusion Cell Therapy. 2021;43(4):424-429.
- [Google Scholar]
- Platelet-related cytokines among normal body mass index, overweight, and obese Malaysians. Asia Pac. J. Clin. Nutr.. 2018;27(1):182-188.
- [Google Scholar]
- Correlation between mean platelet volume and fasting plasma glucose levels in prediabetic and normoglycemic individuals. Cardiovasc. Diabetol.. 2013;12:14.
- [Google Scholar]
- Sreeniwas K, A., Sinha, N., 2020. Cardiovascular disease in India: A 360-degree overview. Medical J., Armed Forces India, 76(1), 1–3.
- Prediabetes: a high-risk state for diabetes development. Lancet (London, England). 2012;379(9833):2279-2290.
- [Google Scholar]
- Platelet parameters may be predictors of coronary artery disease in prediabetes: rural hospital-based cross-sectional study. J. Pract. Cardiovasc. Sci.. 2023;9(2):127-131.
- [Google Scholar]
- Verdoia, M., Schaffer, A., Barbieri, L., Cassetti, E., Nardin, M., Bellomo, G., et al., Novara Atherosclerosis Study (NAS) group., 2014. Diabetes, glucose control and mean platelet volume: a single-centre cohort study. Diabetes research and clinical practice, 104(2), 288–294.
- Impact of aging on immature platelet count and its relationship with coronary artery disease. Platelets. 2020;31(8):1060-1068.
- [Google Scholar]
- The mean platelet volume in the prognosis of coronary artery disease severity and risk stratification of acute coronary syndromes. Med. Arch. (Sarajevo, Bosnia and Herzegovina). 2019;73(2):76-80.
- [Google Scholar]
- Platelet indices as a predictor of microvascular complications in type 2 diabetes. Ind. J. Endocrinol. Metabol.. 2019;23(2):206-210.
- [Google Scholar]


