

Translate this page into:
Health risk assessment of groundwater quality: A case study of Pratapgarh district U.P, India
⁎Corresponding author. abhishek.ce@srmu.ac.in (Abhishek Saxena) abhisheksaxena.ce@srmu.ac.in (Abhishek Saxena)
-
Received: ,
Accepted: ,
This article was originally published by Elsevier and was migrated to Scientific Scholar after the change of Publisher.
Abstract
To investigate the geochemical factors contributing to the presence of fluoride and nitrate in groundwater and their implications for human health, samples from the Sadar Region, Pratapgarh district, Uttar Pradesh, India underwent analysis for diverse chemical parameters. The findings indicate that the groundwater exhibits an alkaline nature, primarily characterized by the presence of Na-K-SO4-Cl and Ca-Mg-SO4-Cl type facies. According to the water pollution index, in pre-monsoon 47.5 %, 50 % monsoon, and 48 % of Post-monsoon, samples were considered “extremely polluted,” with a WPI score greater than 1, indicating that the water was unsafe for human consumption. By computing Total Hazard Index (THI) values, it’s determined that 12 sample sites show significant contamination, with over 65 % of males, 83 % of females, and 90 % of children exhibiting THI values surpassing 1.0, indicating the highest levels of contamination. Health risk assessments highlight the increased vulnerability of children and females to potential health hazards. The Piper plot illustrates the dominance of Cl- and some SO42- type waters, indicating a prevalence of strong acid dominance over weak acid waters. Cation composition analysis reveals the preponderance of alkaline earth metals over alkali metals, primarily composed of Ca2+ with some Mg2+ type water. This research underscores the urgency of addressing groundwater contamination and its potential health impacts, emphasizing the need for comprehensive mitigation strategies in the Indo-Gangetic alluvium.
Keywords
Water pollution index
Health risks
Groundwater pollution
Seasonal variation
Multivariate statistical analysis

1 Introduction
Global water scarcity poses a significant challenge to humanity and sustainable development, affecting various sectors like transportation, energy, and industry. Limited access to clean water hinders socio-economic progress and increases disease prevalence. Factors contributing to water scarcity include mismanagement, inadequate infrastructure, contamination, and human activities like population growth and excessive fertilizer use (Rafika et al., 2022).
Management of groundwater, a crucial resource, faces challenges due to its hidden nature, limited monitoring, recharge difficulties, undefined flow boundaries, transboundary issues, and complex groundwater-surface connections (Subba Rao et al., 2020). India, the world's largest groundwater extractor, accounts for a quarter of global extraction, highlighting its pivotal role. Groundwater pollution, notably by fluoride, nitrate, arsenic, iron, and salinity, poses significant health risks, with fluoride-endemic cases affecting 260 million people across 28 nations (Bai et al., 2022).
Long-term exposure to fluoride causes fluorosis, impacting dental, skeletal, and muscular health, and lowering children's IQ levels (Subba Rao et al., 2020). Excessive nitrate in drinking water leads to health issues like blue baby syndrome, cancer, goiter, and hypertension (Chen et al., 2017). In India, especially in states like Uttar Pradesh, fluoride and nitrate contamination is prevalent, posing serious health risks to millions (Das et al., 2023). Agricultural practices and human activities raise fluoride levels, while nitrate enrichment is linked to nitrogenous fertilizers and industrial effluents (Rao et al., 2021).
In Uttar Pradesh, groundwater dependence is dire due to high fluoride levels, impacting regions like Pratapgarh, Agra, Varanasi, Rae Bareli, and Kanpur, where over 50 % suffer from fluorosis (Maurya et al., 2021). Given the urgency, a thorough health risk assessment is crucial, especially in underexplored regions like Pratapgarh. Previous research indicates significant groundwater depletion in Pratapgarh, necessitating a Health Risk Assessment (HRA) to link water pollution to potential health hazards. Using indices like chronic daily intake (CDI) and total hazard index (THI), this assessment evaluates non-carcinogenic health risks from fluoride and nitrate contamination in groundwater for male female and children. This study underscores the need to address groundwater contamination in the Indo-Gangetic alluvium, advocating for comprehensive mitigation strategies to safeguard the health of the population in the Sadar block of Pratapgarh district, Uttar Pradesh.
2 Methodology
2.1 Study area
A detailed study was conducted on different locations within Sadar block in Pratapgarh district, Uttar Pradesh, as shown in Fig. 1. Pratapgarh district, located at coordinates 25°34′N to 26°11′N latitudes and 81°19′E to 82°27′E longitudes. The usual climate is arid to semi-arid, with scorching summers and chilly winters. The rainy season runs from June to September, and there is a 1000 mm average yearly rainfall throughout this time (Maurya and Saxena, 2022). The region is characterized by quaternary alluvial sediments that consist mainly of a texture group containing very coarse silt, very fine sand, very fine sandy, and muddy sand (Maurya et al., 2021).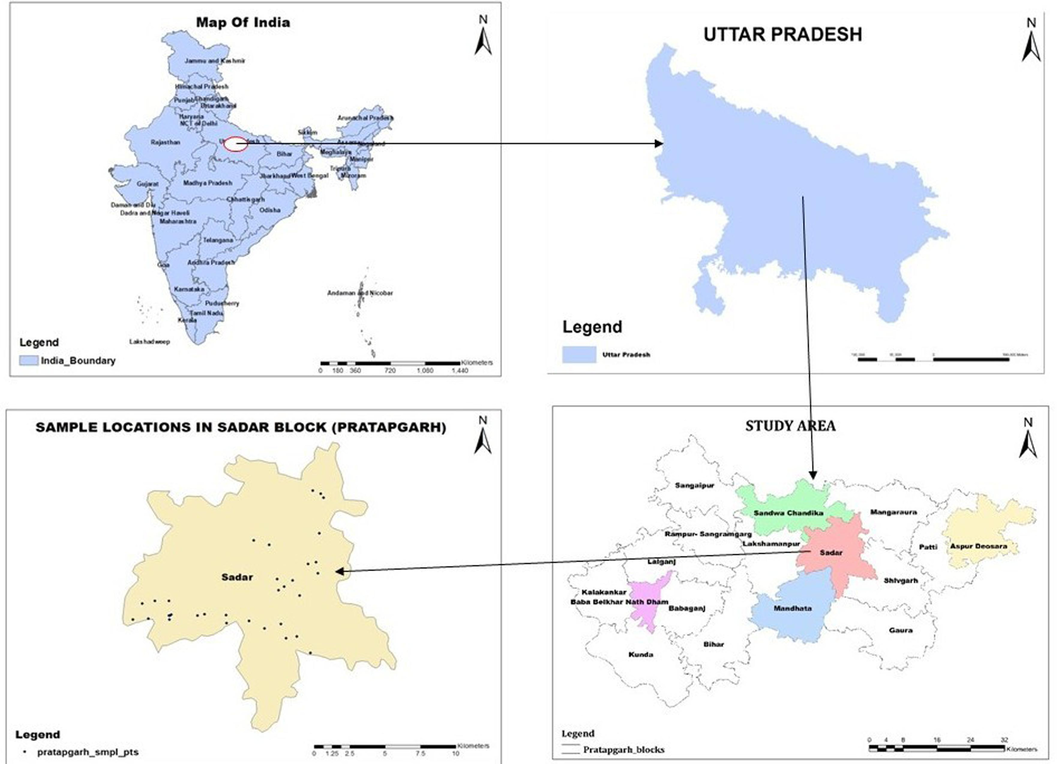
Location map of the study area showing sampling points.
These rocks include calcium carbonate, dolomite, limestone and calc-silicate, plagioclase feldspar, orthoclase feldspar, and other fluoride and nitrate bearing minerals lead to heightened levels of fluoride, nitrate and other pollutants in certain environments (Tiwari et al., 2018). The silicate minerals like feldspars and micas might pollute groundwater by releasing substances like NO3– and F-.
2.2 Collection and analysis of samples
In February, July, and November 2021–2022, groundwater samples were collected from Numerous locales within the Sadar block of Pratapgarh district during the PRM, POM, and MON periods from dug well, tube well and hand pump. Sample bottles and glassware were sterilized overnight with 5 % HNO3– solution before collecting samples in pre-washed polyethylene bottles, following 5–10 min of well pumping. GPS devices tracked sample locations, stored subsequently at 4 °C. The physicochemical analysis was conducted, and EC/TDS and pH electrodes were used to monitor pH, electrical conductivity (EC), TDS, and other salinity properties. Additionally, samples were tested for total hardness (HCO3–, CO3– and Cl-) by trimetric method, and cations (K+, Ca2+, Mg2+, Na+) were analyzed after flame photometer calibration. Fluoride (F-), nitrate (NO3–), and sulfate (SO42-) were measured using an ultraviolet (UV) spectrophotometer following APHA's standard procedures for assessing water and wastewater.
2.3 Data validity
To assess the accuracy of the ionic measurements, the analyzed data underwent evaluation using two criteria:
(a) Charge Balance Error (CBE) (Shukla and Saxena, 2020).
(b) The EC/TDS ratio, which determines the reliability and precision of the analytical data.
The percentage error (E%) was calculated using the formula:
2.4 Water pollution index calculation (WPI)
The WPI is calculated using pollution load index (Hossain and Patra, 2020).
When pH is less than or more than 7, the value of PLi determined from equation
When the PL for any parameter reaches zero, let's consider the scenario where there are “r” parameters with zero PL then WPI:
2.5 Health-risk evaluation
3 Results and discussions
3.1 Physico-chemical analysis
The data in Table 1 illustrates the outcomes of different physicochemical tests and statistical evaluations conducted on groundwater samples gathered throughout the seasons. The pH values of the samples ranged from 6.6 to 8.4. This indicates that most of the samples were slightly alkaline. Note: Electrical conductivity in μS/cm, all other parameters in mg/L except pH; SD: standard deviation
pH
EC
TDS
NO3–
F-
Cl-
SO42-
TH
HCO3–
Na+
K+
Ca2+
Mg2+
WPI
Pre-Monsoon
Mean
7.28
2622.25
1243.80
27.50
1.41
617.64
413.40
594.53
273.68
64.54
13.67
45.53
45.75
1.27
SD
0.40
2929.65
1321.19
15.25
0.86
447.98
429.05
410.08
215.73
48.74
46.44
48.24
30.59
1.12
Minimum
6.60
480.00
210.00
0.90
0.20
35.00
28.00
160.00
18.00
8.00
1.20
12.00
11.67
0.27
Median
7.20
1840.00
920.00
23.00
1.25
744.50
351.00
410.00
223.00
46.25
3.90
24.00
32.75
1.07
Maximum
8.40
12980.00
5248.00
62.00
4.50
1490.00
2460.00
1600.00
820.00
280.00
56.00
201.00
116.58
5.72
Monsoon
Mean
6.98
2108.88
1035.45
22.66
0.99
599.05
398.58
559.45
259.98
59.32
12.60
39.83
43.30
1.17
SD
0.36
2039.60
1022.30
13.66
0.72
441.67
424.49
395.74
213.45
45.18
45.37
44.79
29.64
0.98
Minimum
6.20
418.00
202.00
0.60
0.10
28.00
23.00
140.00
4.00
7.40
0.80
8.00
10.50
0.26
Median
7.00
1557.50
803.00
19.50
1.00
692.00
336.00
404.00
205.00
44.30
2.90
20.00
32.58
1.01
Maximum
7.90
9860.00
4930.00
50.00
3.30
1482.00
2450.00
1520.00
806.00
270.00
52.00
186.00
111.17
5.26
Post-Monsoon
Mean
7.11
2206.33
1091.49
24.27
1.19
605.15
404.10
577.33
265.60
61.30
13.19
43.08
44.52
1.20
SD
0.34
2224.00
1113.38
13.93
0.79
441.98
426.33
402.05
214.81
46.07
45.72
47.28
29.99
1.03
Minimum
6.40
420.00
220.00
0.80
0.00
30.00
25.00
150.00
8.00
7.90
1.00
10.00
11.17
0.27
Median
7.1
1705.0
856.0
21.0
1.1
699.0
340.0
408.0
213.0
44.9
3.3
22.0
32.8
1.0
Maximum
8.0
10880.0
5440.0
52.0
3.8
1488.0
2455.0
1550.0
810.0
240.0
52.4
195.0
112.9
5.5
However, approximately 79 % of the study sites contained drinkable water with very few seasonal variations. The total dissolved solids values ranged from 210 to 5248 mg/L, saline to brine throughout the year, with approximately 60 % of the samples exceeding the prescribed limit of TDS. Drinking water with TDS levels higher than 500 mg/L can cause gastrointestinal problems, arthritis, and other health issues, and is unfit for consumption (Maurya and Saxena, 2022).
Furthermore, the electrical conductivity (EC) values ranged from 480 to 12,980 μS/cm, indicate that the salinity levels ranged from saline to brackish water in all seasons, with 82.5 % of the samples exceeding the permissible limit. Elevated EC values in water samples indicate dissolved minerals, potentially posing health risks including hypertension, skin diseases, renal failure, and pulmonary edema (Tiwari et al., 2018). In addition, 33 % of the samples collected during all seasons exceeded the acceptable level of 600 mg/L of total hardness (TH). The range of TH concentration during the PRM period was 160 to 1600 mg/L. Drinking water with a TH concentration above 600 mg/L regularly may increase the risk of various health issues, including anencephaly, kidney stones, urolithiasis etc (Karunanidhi et al., 2019).
3.2 Chemistry of major cation
The research region is bordered by perennial rivers such as the Ganga and Sai. Due to their prolonged residency, the soil stratum gets dissolved, and the primary ionic concentrations of Na, K, Cl, and HCO3 are raised, as observed by (Maurya et al., 2021). The abundance of cations in groundwater was found to be in the order of Mg2+ > Na+ > Ca2+ > K+, with Mg2+ being the most dominant in all seasons. The concentration of Mg2+ assortments from 11 to 116 mg/L. The decomposition of calcium carbonate, dolomite limestone, and calc-silicate rocks is the most common source of magnesium in groundwater. However, excess magnesium beyond the permissible limit in drinking water can cause hypertension and cardiovascular problems, which can be fatal, as reported by (Chen et al., 2017).
Na+ is the second most dominating cation throughout all periods. More than 50 % of the samples exceeded the permissible limit of sodium (200 mg/l) as WHO (2017) and BIS (2011) guidelines in all seasons.
The average values of K+ were 1.20 to 56 mg/L. However, only 5 % of the samples exceeded the permissible limit of Potassium of 12 mg/L (WHO, 2011) in all seasons. Excess potassium can result in congenital abnormalities, renal troubles, and neurological disorders (Shukla & Saxena, 2020). The concentration of calcium in groundwater ranged from 12 to 201 mg/L. However, almost 20 % of the samples were higher than the prescribed limit of 75 mg/L in all seasons. Increased levels of calcium and magnesium ions at many sites may be a result of silicate minerals deteriorating, dolomite minerals as observed by (Tiwari et al., 2018). High intake of hard water causes an unpleasant taste and kidney stones, and urolithiasis. The direct release of Na+, K+, Cl-, and HCO3– ions into the soil occurs due to phosphate fertilizer, which is a significant cause of soil pollution (Dai et al., 2022).
3.3 Chemistry of major anion
The most abundant anion in groundwater in all seasons was SO4- > Cl- >HCO3– > NO3– > F-. Groundwater analysis revealed that SO4- was the most abundant anion, followed by Cl-, HCO3–, NO3–, and F- in all seasons. However, the concentration of sulfate should not exceed 250 mg/L (Shukla and Saxena, 2020). The test sample showed a sulfate range of 28 to 2460 mg/L, 53 % of the SO4- samples consistently exceeded the permissible limit throughout the year. Sources of sulfate in groundwater include rock mineral weathering, clay-dominated sediment, sewage discharge, etc. Moreover, excessive sulfate concentration can lead to an unpleasant taste in drinking water.
Chloride is the second most abundant anion in the study area, with a high concentration of 35 to 1490 mg/L, indicating groundwater salinity deterioration. Approximately 68 % of samples throughout the year exceeded the prescribed limit of 250 mg/L. The introduction of chloride into groundwater could be due to poor hygiene habits, improper untreated sewage disposal, septic tank linkage to underground water etc. (Subba Rao et al., 2024).
In the groundwater, the range of bicarbonate was 18 to 820 mg/L, mainly generated from the soil layer through the dissociation of CO2, CO3, and silicate minerals (Ravindra et al., 2023). However, 18 % of samples in all seasons exceeded the permissible level of carbonates, which is 500 mg/L. Groundwater analysis showed that NO3– concentrations ranged from 0.9 to 62 mg/L, indicating 18 % of samples in all seasons exceeded the prescribed limit of 45 mg/L. The high levels of NO3– in Mohanganj are expected due to the high level of nitrogenous fertilizer application and a greater net area under irrigation. The F- level in the samples ranged from 0.2 to 5 mg/L. 65 %, exceeded the prescribed limit of 1 mg/L of fluoride in PRM, and 50 % of samples in POM and 35 % in MON periods also exceeded the BIS limit. Geogenic sources could be responsible for high levels of fluoride (Marghade et al., 2020). The elevated concentration of fluoride in groundwater in the study area is likely due to weathering of mica minerals, such as muscovite or biotite (Maurya et al., 2023). Excessive fluoride can cause dental fluorosis, which leads to a loss of luster and shine, yellow stains, and mottling in teeth (Gaikwad et al., 2020). The cation and anion statistics reveal that the pre-monsoon season was the most polluted, whereas the monsoon season was the least polluted. This shift could be due to the dilution of contaminated water by rainwater during the MON season. The POM season has good quality water, while the monsoon period has excellent quality water.
The findings of piper plot (Fig. 2) indicate that Cl- dominated. The anion triangle and some SO4- type water, indicating strong acid dominance over weak acids during all sessions. The triangle of cation is dominated by Ca2+ and some of the Mg2+ type water, indicating that alkaline earth metal is dominating over alkali metals. There were no dominant species in the rest of the sample in all periods. These results suggested that more than 50 % of the samples showed no dominant species in all the periods. Additionally, the study found that the majority of the samples were about evenly split between the Na-K-SO4-Cl mixed kind of water (23 % PRM and POM), and the Ca-Mg-SO4-Cl water type (about 10 % PRM, POM, and MON). No mix dominance was found in the 3rd and 4th classes. Calcium/Magnesium-Chloride/Sulfate-bicarbonate are the most common types of ions found in the samples. This trend indicates reverse ion exchange between Ca–Mg with Cl–SO4. In the surveyed region, the majority of the population relies on agriculture, often employing intensive fertilization practices, including the use of phosphate fertilizers (Maurya et al., 2023), release the concentration of Na+, K+, Cl-, and HCO3– ions in the soil. Gypsum and calcium-bearing minerals such as biotite and calcretes, when dissolved in water produce Ca2+, SO42-, and HCO3– ions, which might be the reason for the ion exchange process (Selvakumar et al., 2017).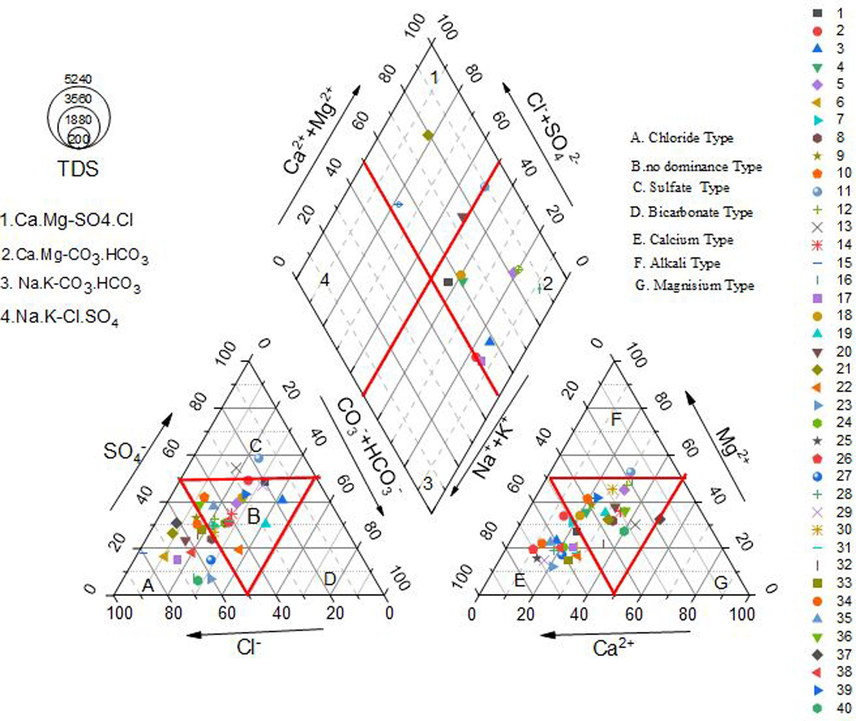
Piper plot showing Facies of hydrochemistry of groundwater in the study area.
3.4 Correlation diagrams between the chemical elements
A correlation matrix generated in Origin Pro 2022b software measures the degree of linear correlation between variables using the correlation coefficient “r” (Maurya and Saxena, 2022). The strength of the relationship between two variables is determined by the absolute value of “r”: |r| > 0.9: very strong correlation, 0.75 ≤ |r| ≤ 0.9: strong correlation, 0.5 ≤ |r| < 0.75: good correlation, |r| < 0.5: weak correlation.
TDS, EC, and F- display a strong correlation (r = 0.9) and a good correlation (r = 0.7) with several parameters, except for K+ where the correlation coefficient is 0.5. Noteworthy associations include those between NO3–, F-, and HCO3–, while TH, Ca2+, K+, and Mg2+ exhibit weaker correlations. Fluoride shows a good to strong correlation (0.7 > r > 0.5) with all parameters except K+. A strong correlation is evident among TH, Ca2+, and Mg2+ (r = 0.9).
Strong or good correlations suggest that they may have come from the same source and exhibit similar geochemical behavior (Fig. 3).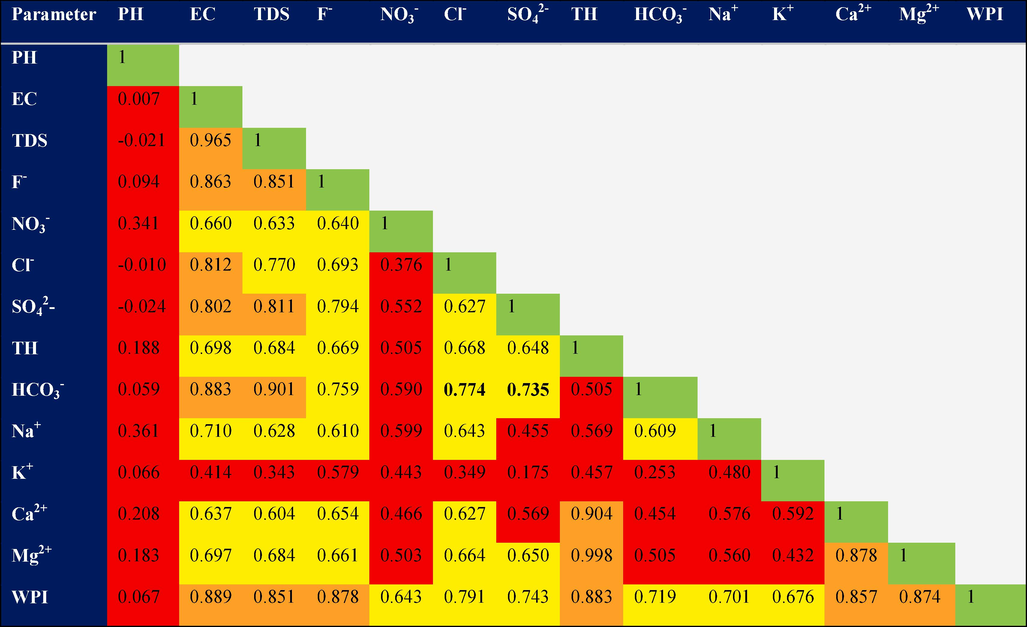
Correlation diagrams between the physico-chemical elements.
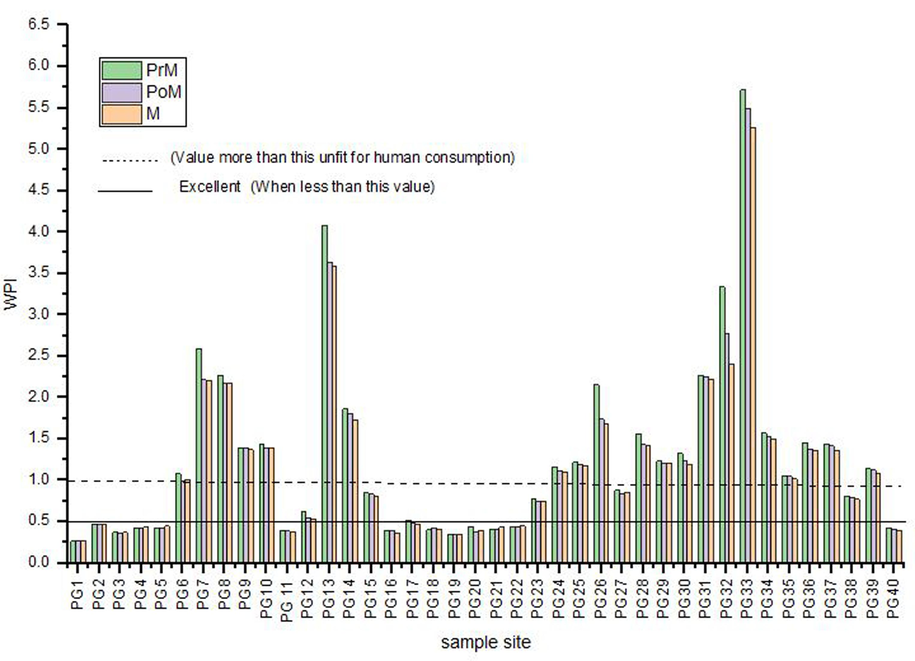
3.5 Water pollution index
The WPI values may be classified, based on the ‘n’ number of parameters into four different categories as mentioned in Table 2, and the water pollution index of these sample sites is graphically represented (Fig. 4). According to table the Water Pollution Index ranges from 0.27 to 5.72 across the region, with only 35 % classified as “excellent” (WPI < 0.5) in all seasons. 2.5 % are “good” (WPI 0.5–0.75), while 15 % are moderately polluted (WPI 0.75–1), and the majority, 47.5 %-50 %, are “extremely polluted” (WPI > 1), indicating unsafe water for consumption. During the MON, WPI values are similar for dug wells and Mark-II sources, but POM, Mark-II shows a slight decline. Table 3 identifies influential parameters based on pollution load index (PLi). Note: (PrM) Pre-Monsoon, (M) Monsoon, (PoM) Post-Monsoon
S.N
WPI Value
Category of water
Total Contaminated sample
% of samples in each category
PrM
M
PoM
PrM
M
PoM
1
<0.5
Excellent Water
14
14
14
35
35
35
2
0.5–0.75
Good
1
2
2
2.5
5
5
3
0.75–1
Moderately polluted
6
4
5
15
10
12.5
4
>1
Highly polluted
19
20
19
47.5
50
47.5
Site-Wise variation of Water Pollution Index (WPI).
Sample code
Turbidity
Pli
PH
Pli
EC
Pli
TDS
Pli
Salinity
Pli
Cl-
Pli
SO42-
Pli
TH
Pli
HCO3–
Pli
Na+
Pli
K+
Pli
Ca2+
Pli
Mg2+
Pli
WPI
PG1
3.2
0.64
7.9
0.3
446
0.59
232
0.46
232
0.464
35
0.14
86
0.344
320
0.64
56
0.11
42.2
0.70
1.2
0.10
18
0.24
302
6.04
0.83
PG2
1.5
0.3
7.4
0.55
608
0.81
313
0.63
482
0.964
80
0.32
162
0.648
400
0.8
82
0.16
47.5
0.79
3.9
0.33
14
0.19
386
7.72
1.09
PG3
2
0.4
7.2
0.65
761
1.01
388
0.78
570
1.14
35
0.14
82
0.328
200
0.4
86
0.17
37
0.62
5
0.42
12
0.16
188
3.76
0.77
PG4
3.1
0.62
7.1
0.7
674
0.90
371
0.74
561
1.122
70
0.28
95
0.38
400
0.8
62
0.12
36.5
0.61
2.4
0.20
20
0.27
380
7.6
1.10
PG5
2.1
0.42
7.1
0.7
691
0.92
351
0.70
512
1.024
106
0.424
120
0.48
440
0.88
79
0.16
16.1
0.27
2.1
0.18
24
0.32
416
8.32
1.14
PG6
8.2
1.64
6.8
0.85
2048
2.73
611
1.22
1791
3.582
876
3.504
200
0.8
240
0.48
128
0.26
45.3
0.76
2.5
0.21
22
0.29
218
4.36
1.59
PG7
14.2
2.84
6.7
0.9
4558
6.08
2765
5.53
3601
7.202
1418
5.672
880
3.52
800
1.6
760
1.52
95.7
1.60
2.7
0.23
36
0.48
764
15.28
4.03
PG8
10.6
2.12
7
0.75
4455
5.94
2301
4.60
3681
7.362
1418
5.672
660
2.64
1080
2.16
662
1.32
87
1.45
3.9
0.33
87
1.16
993
19.86
4.26
PG9
6.02
1.204
6.8
0.85
2551
3.40
1501
3.00
1815
3.63
875
3.5
610
2.44
520
1.04
260
0.52
37.9
0.63
4.1
0.34
24
0.32
496
9.92
2.37
PG10
6
1.2
7.1
0.7
2587
3.45
1068
2.14
2112
4.224
565
2.26
850
3.4
840
1.68
226
0.45
56
0.93
8.1
0.68
32
0.43
808
16.16
2.90
PG 11
4
0.8
7.3
0.6
617
0.82
310
0.62
455
0.91
35
0.14
120
0.48
400
0.8
50
0.10
8
0.13
2.6
0.22
18
0.24
382
7.64
1.04
PG13
42
8.4
7.1
0.7
5257
7.01
3045
6.09
4411
8.822
1240
4.96
2660
10.64
1480
2.96
720
1.44
88.4
1.47
10.7
0.89
158
2.11
1322
26.44
6.30
PG14
7.8
1.56
7.3
0.6
3512
4.68
2911
5.82
2881
5.762
957
3.828
860
3.44
1000
2
650
1.30
62.8
1.05
3
0.25
78
1.04
922
18.44
3.83
PG15
3.1
0.62
7.2
0.65
871
1.16
451
0.90
650
1.3
921
3.684
210
0.84
680
1.36
22
0.04
42
0.70
4.2
0.35
30
0.40
650
13
1.92
PG16
0.9
0.18
7.3
0.6
511
0.68
258
0.52
451
0.902
240
0.96
28
0.112
400
0.8
92
0.18
9.8
0.16
2.3
0.19
21
0.28
379
7.58
1.01
PG17
1.9
0.38
7.1
0.7
611
0.81
311
0.62
451
0.902
380
1.52
82
0.328
240
0.48
86
0.17
45.1
0.75
4.1
0.34
22
0.29
218
4.36
0.90
PG18
2.8
0.56
7.3
0.6
617
0.82
321
0.64
472
0.944
35
0.14
94
0.376
360
0.72
60
0.12
32.2
0.54
6.1
0.51
17
0.23
343
6.86
1.00
PG20
2
0.4
7.1
0.7
571
0.76
273
0.55
424
0.848
200
0.8
76
0.304
400
0.8
48
0.10
23.1
0.39
1.2
0.10
28
0.37
372
7.44
1.04
PG22
2.1
0.42
7.3
0.6
799
1.07
399
0.80
688
1.376
140
0.56
62
0.248
200
0.4
117
0.23
43.1
0.72
4.2
0.35
22
0.29
178
3.56
0.82
PG23
4.8
0.96
7.4
0.55
1541
2.05
770
1.54
1450
2.9
600
2.4
69
0.276
160
0.32
320
0.64
56.8
0.95
6.7
0.56
20
0.27
140
2.8
1.25
PG24
7.2
1.44
7.3
0.6
2050
2.73
1040
2.08
1890
3.78
870
3.48
620
2.48
230
0.46
520
1.04
46
0.77
4.2
0.35
18
0.24
212
4.24
1.82
PG25
5.1
1.02
7.6
0.45
1949
2.60
974
1.95
1840
3.68
780
3.12
560
2.24
240
0.48
480
0.96
62.4
1.04
21
1.75
16
0.21
224
4.48
1.84
PG26
11
2.2
7.8
0.35
4245
5.66
2145
4.29
3125
6.25
709
2.836
630
2.52
600
1.2
460
0.92
160
2.67
10.6
0.88
25
0.33
575
11.5
3.20
PG27
4.2
0.84
7.2
0.65
1454
1.94
727
1.45
1325
2.65
820
3.28
220
0.88
240
0.48
412
0.82
62
1.03
1.2
0.10
23
0.31
217
4.34
1.44
PG28
8
1.6
7.3
0.6
2843
3.79
1421
2.84
2620
5.24
920
3.68
560
2.24
480
0.96
418
0.84
120
2.00
2.3
0.19
36
0.48
444
8.88
2.56
PG29
16.1
3.22
7.3
0.6
2911
3.88
1455
2.91
2810
5.62
283
1.132
616
2.464
260
0.52
416
0.83
86.2
1.44
4.1
0.34
22
0.29
238
4.76
2.15
PG30
12.2
2.44
7.6
0.45
2310
3.08
1155
2.31
2205
4.41
875
3.5
480
1.92
960
1.92
420
0.84
45.9
0.77
1.2
0.10
45
0.60
915
18.3
3.13
PG31
16.4
3.28
7.4
0.55
3018
4.02
1509
3.02
2018
4.036
779
3.116
612
2.448
1080
2.16
512
1.02
160
2.67
85.4
7.12
120
1.60
960
19.2
4.17
PG32
18.9
3.78
7.9
0.3
3347
4.46
1673
3.35
2216
4.432
1276
5.104
584
2.336
1400
2.8
412
0.82
192
3.20
10.2
0.85
168
2.24
1232
24.64
4.49
PG33
122
24.4
7.3
0.6
5050
6.73
2520
5.04
4025
8.05
1488
5.952
780
3.12
1600
3.2
518
1.04
177
2.95
289
24.08
201
2.68
1399
27.98
8.91
PG34
8.9
1.78
7.4
0.55
2090
2.79
1045
2.09
1190
2.38
1000
4
620
2.48
800
1.6
320
0.64
180
3.00
8.2
0.68
35
0.47
765
15.3
2.90
PG35
4.2
0.84
7.2
0.65
2025
2.70
1012
2.02
1995
3.99
532
2.128
460
1.84
400
0.8
218
0.44
82.4
1.37
4.2
0.35
21
0.28
379
7.58
1.92
PG36
3.1
0.62
7.6
0.45
2112
2.82
1010
2.02
2010
4.02
960
3.84
580
2.32
1080
2.16
220
0.44
61.2
1.02
2.2
0.18
82
1.09
998
19.96
3.15
PG37
6.2
1.24
7.4
0.55
1740
2.32
874
1.75
1620
3.24
878
3.512
442
1.768
1400
2.8
112
0.22
45.2
0.75
8.6
0.72
160
2.13
1240
24.8
3.52
PG38
8.1
1.62
7.2
0.65
976
1.30
488
0.98
746
1.492
875
3.5
260
1.04
240
0.48
280
0.56
52
0.87
2.3
0.19
18
0.24
222
4.44
1.34
PG39
9.2
1.84
7.4
0.55
1900
2.53
1100
2.20
1890
3.78
354
1.416
514
2.056
960
1.92
322
0.64
61
1.02
4
0.33
42
0.56
918
18.36
2.86
PG40
6.4
1.28
7.3
0.6
780
1.04
390
0.78
670
1.34
300
1.2
29
0.116
240
0.48
128
0.26
20
0.33
1.2
0.10
26
0.35
214
4.28
0.93
Mean
10.7
2.1
7.3
0.6
2029.4
2.7
1067.2
2.1
1672.6
3.3
646.6
2.6
447.9
1.8
615.4
1.2
290.1
0.58
68.3
1.1
14.6
1.2
47.6
0.6
567.8
11.4
2.42
Min
0.9
0.2
6.7
0.3
446.0
0.6
232.0
0.5
232.0
0.5
35.0
0.1
28.0
0.1
160.0
0.3
22.0
0.04
8.0
0.1
1.2
0.1
12.0
0.2
140.0
2.8
0.77
Max
122.0
24.4
7.9
0.9
5257.0
7.0
3045.0
6.1
4411.0
8.8
1488.0
6.0
2660.0
10.6
1600.0
3.2
760.0
1.52
192.0
3.2
289.0
24.1
201.0
2.7
1399.0
28.0
8.91
SD
20.0
4.0
0.3
0.1
1415.8
1.9
820.9
1.6
1157.6
2.3
447.2
1.8
463.1
1.9
423.5
0.8
217.1
0.43
49.3
0.8
47.8
4.0
49.7
0.7
379.2
7.6
1.72
3.6 Non-carcinogenic health risk
Nitrate concentrations (HQNitrate) range from 0 to 1.49 for male, 0 to 1.76 for female 0 to 2.02 for children, with slightly lower values in the post-monsoon and monsoon periods. Fluoride concentrations (HQFluoride) vary from 0.13 to 2.56 for males, 0.15 to 3.03 for females, and 0.17 to 3.47 for children (Table 4). Adults may better tolerate these risks due to their higher body weight (Shukla and Saxena, 2020).
Sample code
Pre-Monsoon
Post-Monsoon
Monsoon
HQFlouride
HQNitrate
HQFlouride
HQNitrate
HQFlouride
HQNitrate
Male
Female
Children
Male
Female
Children
Male
Female
Children
Male
Female
Children
Male
Female
Children
Male
Female
Children
PG1
0.58
0.68
0.78
0.53
0.63
0.72
0.51
0.61
0.69
0.48
0.57
0.65
0.45
0.53
0.61
0.43
0.51
0.59
PG2
0.58
0.68
0.78
0.79
0.94
1.07
0.45
0.53
0.61
0.77
0.91
1.04
0.38
0.45
0.52
0.75
0.88
1.01
PG3
0.32
0.38
0.43
0.48
0.57
0.65
0.19
0.23
0.26
0.43
0.51
0.59
0.19
0.23
0.26
0.43
0.51
0.59
PG4
0.38
0.45
0.52
0.22
0.26
0.29
0.32
0.38
0.43
0.17
0.20
0.23
0.32
0.38
0.43
0.17
0.20
0.23
PG5
0.32
0.38
0.43
0.24
0.28
0.33
0.26
0.30
0.35
0.19
0.23
0.26
0.26
0.30
0.35
0.17
0.20
0.23
PG6
1.03
1.21
1.39
0.55
0.65
0.75
0.58
0.68
0.78
0.53
0.63
0.72
0.51
0.61
0.69
0.48
0.57
0.65
PG7
1.09
1.29
1.47
1.11
1.31
1.50
0.96
1.14
1.30
0.75
0.88
1.01
0.83
0.98
1.13
0.75
0.88
1.01
PG8
1.03
1.21
1.39
0.60
0.71
0.81
0.96
1.14
1.30
0.58
0.68
0.78
0.90
1.06
1.21
0.58
0.68
0.78
PG9
0.90
1.06
1.21
0.48
0.57
0.65
0.90
1.06
1.21
0.43
0.51
0.59
0.77
0.91
1.04
0.41
0.48
0.55
PG10
0.96
1.14
1.30
0.55
0.65
0.75
0.96
1.14
1.30
0.53
0.63
0.72
0.71
0.83
0.95
0.48
0.57
0.65
PG 11
0.64
0.76
0.87
0.48
0.57
0.65
0.58
0.68
0.78
0.43
0.51
0.59
0.38
0.45
0.52
0.34
0.40
0.46
PG12
0.58
0.68
0.78
0.24
0.28
0.33
0.51
0.61
0.69
0.14
0.17
0.20
0.38
0.45
0.52
0.12
0.14
0.16
PG13
2.88
3.41
3.90
1.30
1.53
1.76
2.24
2.65
3.03
1.15
1.36
1.56
2.05
2.42
2.77
1.08
1.28
1.46
PG14
1.41
1.67
1.91
1.01
1.19
1.37
1.28
1.52
1.73
0.96
1.14
1.30
0.71
0.83
0.95
0.96
1.14
1.30
PG15
0.64
0.76
0.87
0.02
0.03
0.03
0.58
0.68
0.78
0.02
0.02
0.03
0.26
0.30
0.35
0.01
0.02
0.02
PG16
0.51
0.61
0.69
0.58
0.68
0.78
0.45
0.53
0.61
0.53
0.63
0.72
0.13
0.15
0.17
0.48
0.57
0.65
PG17
0.13
0.15
0.17
0.96
1.14
1.30
0.00
0.00
0.00
0.91
1.08
1.24
0.06
0.08
0.09
0.82
0.97
1.11
PG18
0.38
0.45
0.52
0.48
0.57
0.65
0.32
0.38
0.43
0.43
0.51
0.59
0.19
0.23
0.26
0.34
0.40
0.46
PG19
0.32
0.38
0.43
0.50
0.60
0.68
0.26
0.30
0.35
0.48
0.57
0.65
0.13
0.15
0.17
0.46
0.54
0.62
PG20
0.64
0.76
0.87
0.29
0.34
0.39
0.06
0.08
0.09
0.24
0.28
0.33
0.13
0.15
0.17
0.19
0.23
0.26
PG21
0.71
0.83
0.95
0.34
0.40
0.46
0.64
0.76
0.87
0.29
0.34
0.39
0.58
0.68
0.78
0.24
0.28
0.33
PG22
0.77
0.91
1.04
0.65
0.77
0.88
0.71
0.83
0.95
0.63
0.74
0.85
0.64
0.76
0.87
0.63
0.74
0.85
PG23
0.90
1.06
1.21
0.34
0.40
0.46
0.83
0.98
1.13
0.29
0.34
0.39
0.77
0.91
1.04
0.24
0.28
0.33
PG24
0.96
1.14
1.30
0.96
1.14
1.30
0.83
0.98
1.13
0.26
0.31
0.36
0.71
0.83
0.95
0.24
0.28
0.33
PG25
0.96
1.14
1.30
1.06
1.25
1.43
0.90
1.06
1.21
1.01
1.19
1.37
0.77
0.91
1.04
0.96
1.14
1.30
PG26
1.35
1.59
1.82
1.11
1.31
1.50
1.28
1.52
1.73
1.08
1.28
1.46
0.64
0.76
0.87
1.01
1.19
1.37
PG27
0.71
0.83
0.95
0.22
0.26
0.29
0.64
0.76
0.87
0.21
0.25
0.29
0.71
0.83
0.95
0.20
0.24
0.27
PG28
1.41
1.67
1.91
1.13
1.34
1.53
0.71
0.83
0.95
1.01
1.19
1.37
0.64
0.76
0.87
0.96
1.14
1.30
PG29
0.90
1.06
1.21
0.99
1.16
1.33
0.83
0.98
1.13
0.96
1.14
1.30
0.77
0.91
1.04
0.91
1.08
1.24
PG30
0.83
0.98
1.13
1.01
1.19
1.37
0.77
0.91
1.04
0.99
1.16
1.33
0.64
0.76
0.87
0.96
1.14
1.30
PG31
1.15
1.36
1.56
1.15
1.36
1.56
1.09
1.29
1.47
0.99
1.16
1.33
0.96
1.14
1.30
0.96
1.14
1.30
PG32
2.05
2.42
2.77
1.30
1.53
1.76
1.92
2.27
2.60
1.18
1.39
1.59
1.86
2.20
2.51
1.11
1.31
1.50
PG33
2.56
3.03
3.47
1.49
1.76
2.02
2.44
2.88
3.29
1.25
1.48
1.69
2.12
2.50
2.86
1.20
1.42
1.63
PG34
0.90
1.06
1.21
0.55
0.65
0.75
0.83
0.98
1.13
0.53
0.63
0.72
0.77
0.91
1.04
0.48
0.57
0.65
PG35
0.77
0.91
1.04
0.48
0.57
0.65
0.71
0.83
0.95
0.43
0.51
0.59
0.64
0.76
0.87
0.38
0.45
0.52
PG36
0.90
1.06
1.21
0.58
0.68
0.78
0.77
0.91
1.04
0.48
0.57
0.65
0.64
0.76
0.87
0.43
0.51
0.59
PG37
0.71
0.83
0.95
0.24
0.28
0.33
0.58
0.68
0.78
0.19
0.23
0.26
0.38
0.45
0.52
0.17
0.20
0.22
PG38
0.71
0.83
0.95
0.53
0.63
0.72
0.51
0.61
0.69
0.48
0.57
0.65
0.38
0.45
0.52
0.45
0.53
0.60
PG39
0.90
1.06
1.21
0.72
0.85
0.98
0.64
0.76
0.87
0.72
0.85
0.98
0.58
0.68
0.78
0.67
0.80
0.91
PG40
0.58
0.68
0.78
0.19
0.23
0.26
0.58
0.68
0.78
0.19
0.23
0.26
0.45
0.53
0.61
0.14
0.17
0.20
Mean
0.91
1.07
1.23
0.66
0.79
0.90
0.77
0.91
1.04
0.59
0.69
0.79
0.64
0.76
0.86
0.55
0.65
0.74
Min
0.13
0.15
0.17
0.02
0.03
0.03
0.00
0.00
0.00
0.02
0.02
0.03
0.06
0.08
0.09
0.01
0.02
0.02
Max
2.88
3.41
3.90
1.49
1.76
2.02
2.44
2.88
3.29
1.25
1.48
1.69
2.12
2.50
2.86
1.20
1.42
1.63
Avg
0.91
1.07
1.23
0.66
0.79
0.90
0.77
0.91
1.04
0.59
0.69
0.79
0.64
0.76
0.86
0.55
0.65
0.74
SD
0.56
0.66
0.76
0.37
0.44
0.50
0.51
0.61
0.69
0.34
0.40
0.46
0.47
0.76
0.86
0.33
0.39
0.45
The total hazard index (Fig. 5) exceeds 1 in 65 % for males, 83 % for females, and 90 % for children, indicating potential carcinogenic risks from groundwater ingestion (Peng et al., 2022). Children are particularly vulnerable to fluoride and nitrate effects compared to adults (Karunanidhi et al., 2019). High THI values (>5.0) at PG 13 and P33 correlate with elevated fluoride and nitrate concentrations, suggesting residents in these areas seek alternative water sources to mitigate health risks from fluoride and nitrate toxicity.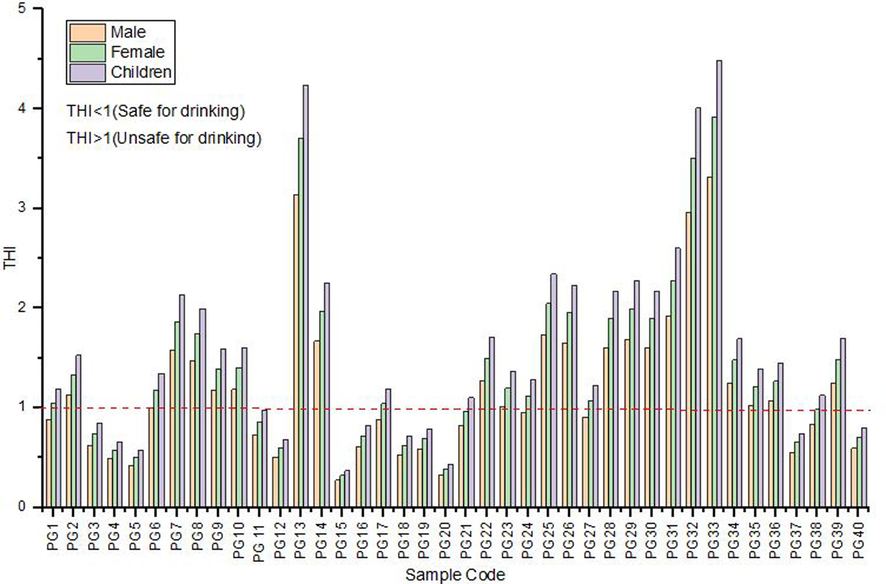
Variation of THIMale, THIFemale, and THIChildren in the study area.
4 Conclusions
Groundwater analysis revealed high NO3− and F- levels, posing health risks across age groups, prompting urgent intervention measures.
-
Groundwater analysis reveals elevated levels of TDS, EC, TH, Sodium, K, Ca, SO4, Cl, CO3, NO3, and F in 60 %, 82 %, 33 %, 50 %, 5 %, 20 %, 53 %, 68 %, 18 %, 18 %, and 65 % of samples, respectively, exceeding safe drinking water standards and posing health risks.
-
Natural geological processes are the main contributors to the presence of NO3− and F− ions in groundwater, although Human activities also play a significant role in their release.
-
WPI analysis flags 47.5 % PRM, 50 % Mon, and 48 % POM samples as “extremely polluted,” unfit for human consumption.
-
The total hazard index varied in the range (THI > 1) of 65 % for males, 83 % for females, and 90 % for children. Ingesting groundwater with THI values exceeding 1 can cause carcinogenic health risks from fluoride and nitrate exposure particularly children.
-
It was found that children may be at a greater risk of non-carcinogenic health effects associated with consuming nitrate and fluoride-contaminated water, as evidenced by the high THI values observed at sites PG13, PG14, PG32, and PG33, where HQFluoride had a more significant impact on THI values than HQNitrate
-
Implementing effective solutions like water treatment, waste management, and aquifer recharge reduces ionic concentrations, enhancing health; addressing pollution roots and robust monitoring sustain rural and urban health.
Funding
The authors declare that no funds, grants, were received during the preparation of this manuscript.
CRediT authorship contribution statement
Sandhya Maurya: Writing – review & editing, Writing – original draft, Methodology. Abhishek Saxena: Supervision.
Acknowledgements
This study was made possible by the laboratory facilities provided by Dr. Devendra Sharma, Vice-Chancellor of Shri Ramswaroop Memorial University. This project (Project Number RSP2024R315) was supported by King Saud University, Riyadh, Saudi Arabia.
Declaration of Competing Interest
The authors declare that they have no known competing financial interests or personal relationships that could have appeared to influence the work reported in this paper.
References
- The remediation efficiency of heavy metal pollutants in water by industrial red mud particle waste. Environ. Technol. Innov.. 2022;102944
- [Google Scholar]
- Assessing nitrate and fluoride contaminants in drinking water and their health risk of rural residents living in a semiarid region of Northwest China. Expo Health. 2017;9:183-195.
- [Google Scholar]
- Pollution characteristics and source analysis of microplastics in the Qiantang River in southeastern China. Chemosphere. 2022;293:1.
- [Google Scholar]
- Nitrate contamination in groundwater and its health implications in a semi-urban region of Titrol block, Jagatsinghpur district, Odisha, India. Phys. Chem. Earth, Parts a/b/c. 2023;132:103424
- [Google Scholar]
- Assessment of the groundwater geochemistry from a part of the west coast of India using statistical methods and water quality index. Hydro Res.. 2020;3:48-60.
- [Google Scholar]
- Water pollution index – A new integrated approach to rank water quality. Ecol. Ind.. 2020;117:106668
- [Google Scholar]
- Risk of fluoride-rich groundwater on human health: remediation through managed aquifer recharge in a hard rock terrain South India. Nat. Resour. Res.. 2019;29:2369-2395.
- [Google Scholar]
- Geochemical assessment of fluoride enriched groundwater and health implications from a part of Yavtmal District, India. Hum. Ecol. Risk Assess. Int. J.. 2020;26(3):673-694.
- [Google Scholar]
- The sources, leaching, remediation, and environmental concerns associated with groundwater salinity. Environ. Sci. Pollut. Res.. 2023;30(47):103405-103423.
- [Google Scholar]
- Evaluation of ground water quality and health risk assessment due to nitrate and fluoride in the Middle Indo-Gangetic plains of India. Hum. Ecol. Risk Assess. Int. J.. 2021;27(5):1349-1365.
- [Google Scholar]
- Spatiotemporal assessment of groundwater quality in the Central Ganga Plain, India, using multivariate statistical tools. Environ. Monit. Assess.. 2022;194(12):865.
- [Google Scholar]
- Hydrochemical characteristics and health risk assessment of groundwater in karst areas of southwest China: A case study of Bama, Guangxi. J. Clean. Prod.. 2022;341:130872
- [Google Scholar]
- The combination of the quality index, isotopic, and GIS techniques to assess water resources in a semi-arid context (Essaouira watershed in Morocco) Groundw. Sustain. Dev.. 2022;17:100768
- [Google Scholar]
- Appraisal of vulnerable zones of non-cancer-causing health risks associated with exposure of nitrate and fluoride in groundwater from a rural part of India. Environ. Res.. 2021;202:111674
- [Google Scholar]
- Groundwater quality monitoring for assessment of pollution levels and potability using WPI and WQI methods from a part of Guntur district, Andhra Pradesh, India. Environ. Dev. Sustain.. 2023;25(12):14785-14815.
- [Google Scholar]
- Hydrogeochemical characteristics and groundwater contamination in the rapid urban development areas of Coimbatore, India. Water Resour. Ind.. 2017;17:26-33.
- [Google Scholar]
- Water Quality Index Assessment of Groundwater in the Central Ganga Plain with Reference to Raebareli District, Uttar Pradesh, India. Current Sci.. 2020;119(8):1308.
- [Google Scholar]
- Geochemical and health risk evaluation of fluoride rich groundwater in Sattenapalle Region, Guntur district, Andhra Pradesh, India. Hum. Ecol. Risk Assess. Int. J.. 2020;26(9):2316-2348.
- [Google Scholar]
- Hydrochemical characterization and water quality perspectives for groundwater management for urban development. Groundw. Sustain. Dev.. 2024;24:101071
- [Google Scholar]
- Assessment of groundwater quality of Pratapgarh district in India for suitability of drinking purpose using water quality index (WQI) and GIS technique. Sustainable Water Resour. Manage.. 2018;4(3):601-616.
- [Google Scholar]
Appendix A
Health-Risk evaluation
Here, RfD reference dose for nitrate (1.6 mg/kg/day) and fluoride (0.04 mg/kg/day)
Male
Female
Children
IR (Ingestion rate)
2.5 L/day
2.5 L/day
0.78 L/day
EF (Exposure frequencies)
365 days/year
365 days/year
365 days/year
ED (Exposure duration)
64 years
67 years
12
AW (Average weight)
65 kg
58 kg
15 kg
AT (Average weight)
23360 days
24455 days
4380 days


