

Translate this page into:
Near-surface groundwater exploration using the geoelectrical resistivity method: A case study of Wadi Nisah, Riyadh, Saudi Arabia
⁎Corresponding author. ssalarifi@ksu.edu.sa (Saad S. Alarifi),
-
Received: ,
Accepted: ,
This article was originally published by Elsevier and was migrated to Scientific Scholar after the change of Publisher.
Peer review under responsibility of King Saud University.
Abstract
In desert regions like Saudi Arabia, groundwater exploration is critical for drinking, household, and agricultural purposes. The purpose of this study is to use Vertical Electric Sounding (VES) to assign near-surface groundwater sources in the Wadi Nisah area of central Saudi Arabia. Twenty VES stations were installed in the central part of Wadi Nisah, with a maximum half current electrode separation (AB/2) of 100 m, utilizing a Syscal R2 resistivity-meter with Schlumberger electrode design. The interpretation of these VES's revealed five geoelectric layers, the first of which is formed of dry sand with greater resistivity values and has a depth of around 3 m. The groundwater-bearing aquifer is represented by the fifth layer, which is the deepest, with depths ranging from 37.8 to 52.25 m below the surface and resistivities ranging from 47 Ω-m to 115.3 Ω-m. Six geoelectrical cross-sections were also mapped to show the lateral and vertical heterogeneities of the underlying lithology in the study area. These findings suggest that the groundwater bearing layer is a hydrologically promising zone capable of delivering optimal groundwater yield for drinking and agricultural use in the study area; the VES technique is a useful tool for identifying groundwater prospective zones.
Keywords
Electrical resistivity sounding
Groundwater
Nisah
Riyadh
Saudi Arabia

1 Introduction
In Saudi Arabia, groundwater aquifers are the primary source of water. These aquifers run alongside important wadies in the Riyadh region, including Wadi Nisah, where around 14 * 106 m3 of water potentiality is stored (Abdulrazzak, 1976). Wadi Nisah's significance is due to its ability to provide water to the Riyadh region for many years. Wadi Nisah is located about 40 km south of Riyadh city (Fig. 1) and is the area's longest drainage wadi, stretching 75 km in a nearly east–west direction with an average width of 2.5 km. According to Denis et al. (1991), the drainage pattern, particularly Wadi Nisah, has a significant impact on groundwater occurrences in the area. Wadi Nisah receives a significant amount of annual rainfall, which results in fertile soil that is suited for agricultural development.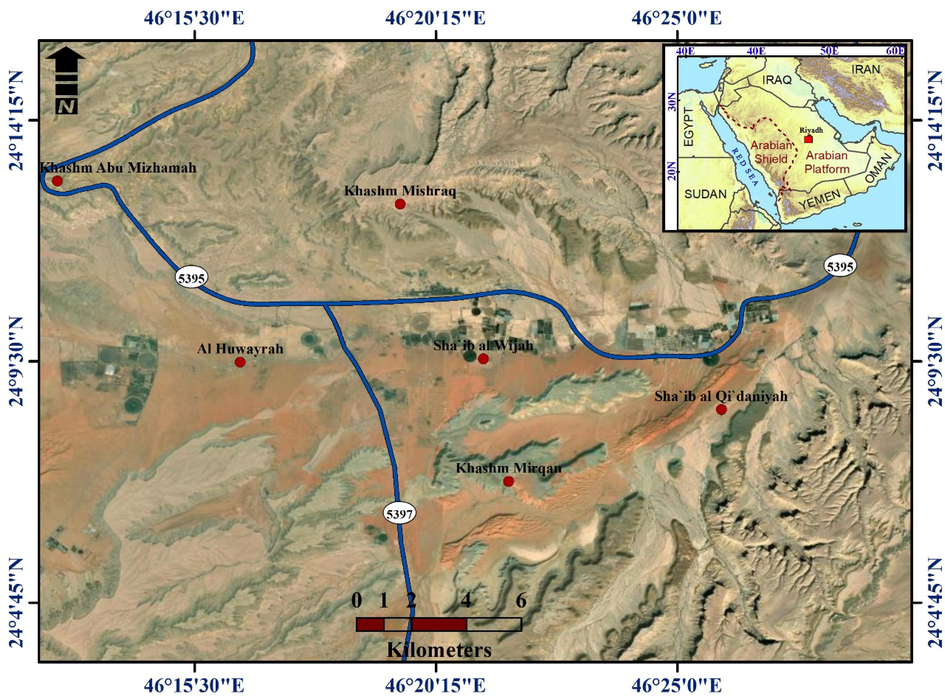
The study area's location map.
Since 1963, groundwater in Wadi Nisah has been used, and the quality of the water is regarded as outstanding, with total dissolved solids ranging from 404 to 456 parts per million (Abdulrazzak, 1976). The gravels of the wadi channels are the only source of groundwater in the shallow zone. Precipitation is responsible for recharging groundwater in near-surface sediments. According to Sogreah (1967), the annual recharge is between 1.5 and 3.5 million cubic meters. The gravel groundwater-bearing aquifer runs from the current wadi channel's ground surface to the solid limestone bed. The thickness of the gravel aquifer determines how much groundwater is stored. Due to a difference in elevation, groundwater contained in the gravel travels downstream through the gravel and may also escape into the limestone fissures in the wadi beds. According to Abdulrazzak (1976), the average yearly infiltration is 7.15 million cubic meters (5800 acre-feet).
One of the geoelectrical procedures is the vertical electrical sounding (VES), which is used to establish a one-dimensional resistivity distribution in vertical profiling. VES has been certified for use in hydrogeological research around the world (for example; Suryadi et al., 2018; Asry et al., 2012; Azhar et al., 2016; Hamzah et al., 2008, 2007; Bashir et al., 2014; Manu et al., 2019; Octova et al., 2019; Gisland et al., 2017). Some hydrogeological and hydrochemical research has been carried out in Saudi Arabia (Hafiz et al., 2013; Aboud et al., 2014; Alhenaki and Alsoma, 2015; Al Rajeh et al., 2017; Alharbi, 2018; Musaed et al., 2020). The main goal of this study is to determine the groundwater potentiality of near-surface alluvial deposits in the Wadi Nisah area using ground electrical resistivity measurements.
2 Geological setting of the study area
The Phanerozoic succession, which sits on the Proterozoic basement, underpins Wadi Nisah (Phoenix Corporation, 1985). In much of the area, this sequence is unconformably overlain by Late Tertiary to Quaternary eolian, fluviatile, and (lacustrine) depression deposits. The outcrop sequence has a slightly dipping homocline and is associated with Mesozoic to Cenozoic lithological formations. With a length of 90 km and a width of 2–8 km, Wadi Nisah is considered an east–west trending graben (Fig. 2). (Powers et al., 1966; Vaslet et al., 1991). It is surrounded by normal faults that dip at 60° to 70° under the down-dropped floor. It is included in the central Arabian graben and trough system (Powers et al., 1966). The creation of the graben could have occurred during the Plio-Quaternary period (Weijermars, 1998). The complex of Jurassic and Early Cretaceous geological formations outcropping within the Wadi Nisah drainage basin, according to Wolfart (1961) and Sogreah (1968) geological studies, are primarily limestone and of marine origin.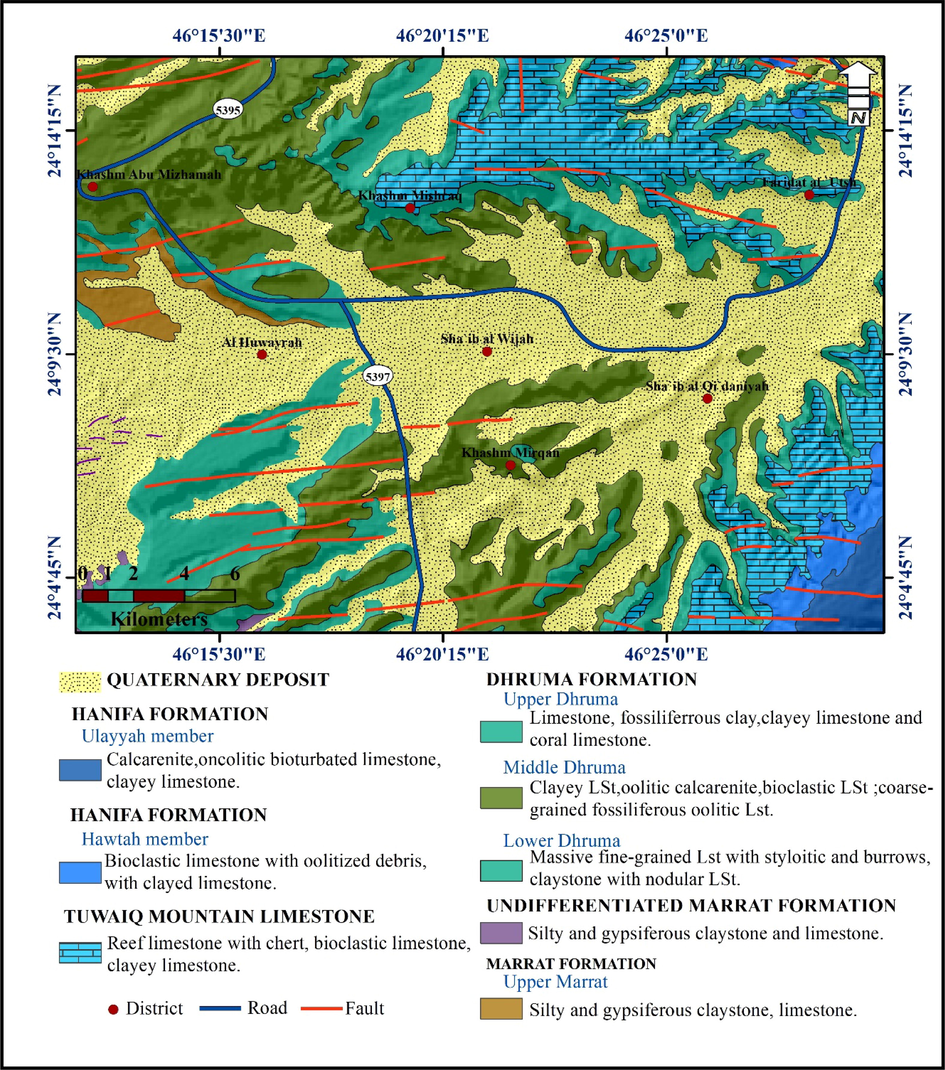
Wadi Nisah geological setting map (Denis et al., 1991).
The subsurface water flow in the area surrounding Wadi Nisah is affected by this tectonic setting, but in Wadi Nisah, a block of porous sandstone, the Lower Cretaceous Biyadh sandstone, is lowered down in the graben to form a groundwater aquifer (Brown and Lough, 1963). The limestone and marly limestone of the Jurassic (Tuwaiq, Hanifa, Jubailah, and Arab Formations) and Early-Middle Cretaceous (Sulay, Yamama, Buwayb, and Biyadh formations) outcrop on both banks of Wadi Nisah (Hancock et al., 1981). The Sha'al Formation, which dates from the Neogene to the Early Quaternary, rests unconformably on top of the Biyadh Formation. The valley's unconsolidated alluvial sediments dates from the Quaternary Epoch.
Hydrogeological, the Minjur sandstone aquifer, the Dhruma carbonate aquifer, and the quaternary alluvial deposits are all part of the study area's multi-layered aquifer system. The Minjur sandstone Formation and Quaternary alluvial deposits provide the majority of the region's water supply (Alharbi, 2018). In and nearby the study area, the depth of groundwater level measured in 14 wells ranged from 35 to 190 m. The alluvial aquifer is tapped by shallow wells in the area, while the Minjur and Dhruma Formations are tapped by deeper wells (Musaed et al., 2020). The Manjur Formation, Jurassic Limestone Formations, Cretaceous Wasia, and Biyadh Formation, as well as Quaternary alluvial deposits, are the main sources of water supply in the research area.
3 Materials and methods
The vertical electrical sounding (VES) technique was used to define the near-surface prospective groundwater-bearing zones in this research. The survey used a Schlumberger array arrangement with a maximum half current electrode spacing of 100 m. (Fig. 3). Furthermore, this array requires at least three individuals for data collection, improved resolution, and larger penetration depth (Kearey and Brooks, 1984). The Schlumberger array consists of four collinear electrodes separated by a known distance (the outer two are current electrodes while the interiors are potential) (Sharma, 1997). At each VES station, the apparent resistivity was measured using a Syscal R2 resistivitymeter. The potential electrodes were placed in the middle of the electrode array at each sounding location, with electrode spacing less than one-fifth that of the current electrodes (Sharma 1997).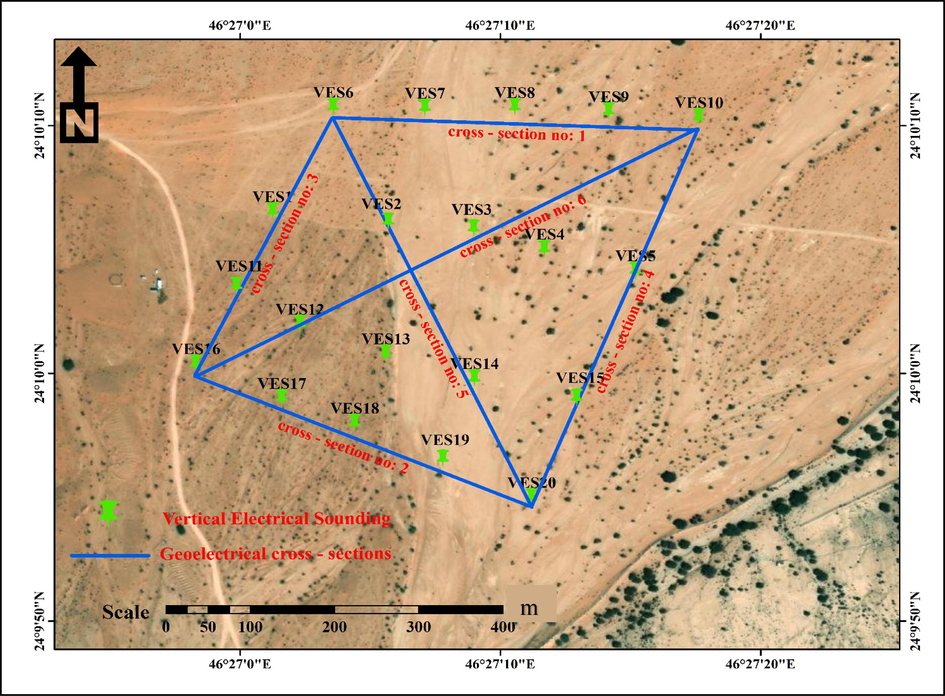
Shows the placement of VES stations as well as geoelectrical cross-sections in the studied area.
Field data was recorded and plotted on a bi-logarithmic graph of apparent resistivity against half-electrode spacing. The VES curves created were smoothed to guarantee that the effects of lateral inhomogeneity and other types of noisy fingerprints were eliminated (Bhattacharya and Patra, 1968). The resistances were multiplied by the geometric factor at each station to convert the field data to apparent resistivity (Sharma, 1997). The AGI EarthImager 1D software (https://www.agiusa.com/agi-earthimager-1d-ves) was used to create a 1D model of the sounding curve from the final computed apparent resistivity data. In EarthImager 1D, both smooth model inversion and damped least-squares inversion algorithms were incorporated (Mogaji et al., 2015). The evaluation of the final 1D resistivity model revealed information concerning layer resistivity, thicknesses, and occurrence depths. These 1D VES models were then used to derive the geological model. A tolerable root mean square error (RMS) value of 5–8% was maintained in the data fit.
4 Results and interpretation
Table 1 and Fig. 4 illustrate the VES model resistivity values and their corresponding thicknesses. These findings revealed that five geoelectric layers exist in the studied area; the uppermost (superficial) geoelectric layer has resistivity values extending from 188 Ω.m (VES18) to 641.6 Ω.m (VES8) and a thickness of 0.11 m (VES19) to 2.2 m. (VES9). The resistivity of the second layer ranges from 146.8 Ω.m (VES15) to 849.2 Ω.m (VES16), with a thickness of 1.54 m (VES20) to 8.51 m (VES12). The third layer has a resistivity of 167.1 Ω.m (VES3) 604 Ω.m (VES1) with a thickness of 6.0 m (VES1) to 25.66 m (VES15). The fourth layer has a resistivity range of 107 Ω.m (VES15) to 374.5 Ω.m (VES1) and a thickness range of 18.21 m (VES18) to 34.25 m (VES14). The resistivity of the fifth layer varies from 47.0 Ω.m (VES8) to 111.2 Ω.m (VES14). The upper limit of this layer is only recognized while the thickness cannot be computed because it is the deepest layer that has been located beneath the VES stations.
VES No:
Layer 1
Layer 2
Layer 3
Layer 4
Layer 5
Resistivity
(Ω.m)Thickness
(m)Resistivity (Ω.m)
Thickness
(m)Resistivity
(Ω.m)Thickness
(m)Resistivity
(Ω.m)Thickness
(m)Resistivity
(Ω.m)Thickness
(m)
VES1
569.6
1.2
661.6
3.8
604.1
6
374.5
18.57
89.9
–
VES2
291.2
0.41
501.2
3.3
320.5
6.84
285.8
25.88
71.1
–
VES3
249.2
0.95
316.5
3.9
167.1
10.25
280.0
20.15
73.1
–
VES4
760.7
0.42
492.8
2.6
326.1
10
190.7
22.17
86.4
–
VES5
566.7
0.34
230.7
4.5
373.7
11.20
139.5
33.19
87.4
–
VES6
320.8
0.49
261.4
3.1
528.3
7.2
185.3
33.43
92.0
–
VES7
334.9
0.22
258.3
2.360
375.2
6.11
210.0
44.5
59.2
–
VES8
641.6
1.31
363.4
4.95
463.5
9.35
250.1
25.11
47.0
–
VES9
430.1
2.2
244.6
3.5
244.6
11.96
122.4
20.1
61.8
–
VES10
522.0
0.38
969.9
2.99
322
12.22
206.5
24.60
51.6
–
VES11
436.2
0.88
674.9
2.25
444.6
15.2
167.4
20
69.9
–
VES12
344
2.1
444.5
6.5
341.8
20
184
29.8
57.9
–
VES13
400.1
0.4
319.7
4.19
351.8
9.98
197.6
20.1
68.5
–
VES14
557
2.2
245.3
3.42
274.3
12
128.2
34.25
111.2
–
VES15
541
1.56
146.8
3.14
240.5
20.12
107.2
26.84
75.4
–
VES16
528.5
0.18
849.2
2.62
506.5
13.74
333.6
29.33
115.3
–
VES17
524.9
1.3
308.8
3.8
373.7
12.21
182.3
23.11
69.5
–
VES18
188
0.16
312.2
3.22
426.5
11.12
166.8
18.21
100.5
–
VES19
395.8
0.15
583.3
2.44
215.1
9.50
184.9
29.97
105.4
–
VES20
477.8
0.12
580.9
1.54
226.8
5.54
365.6
35.4
91.5
–
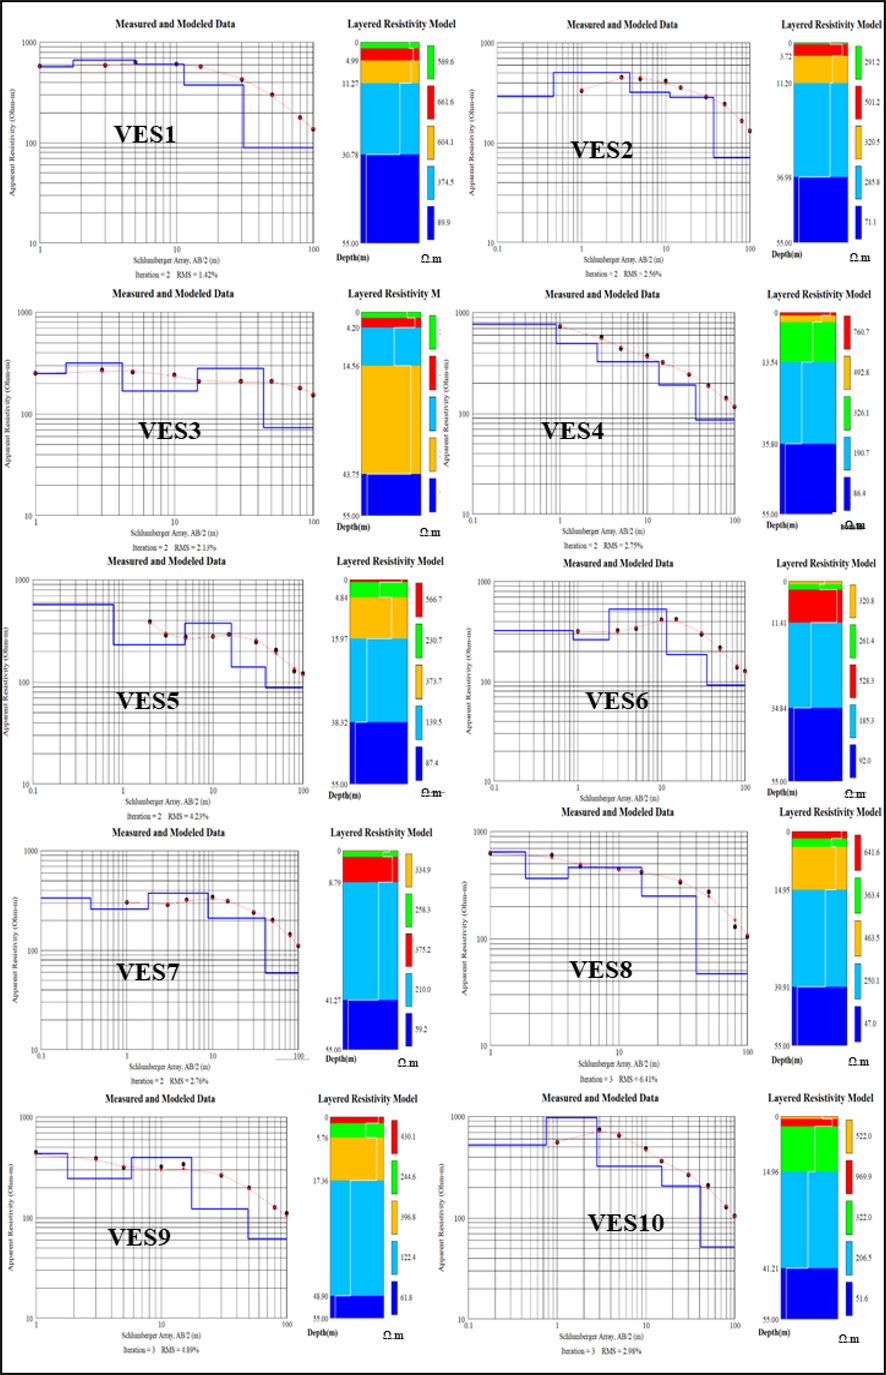
The one-dimensional inverse model for each in the study area.
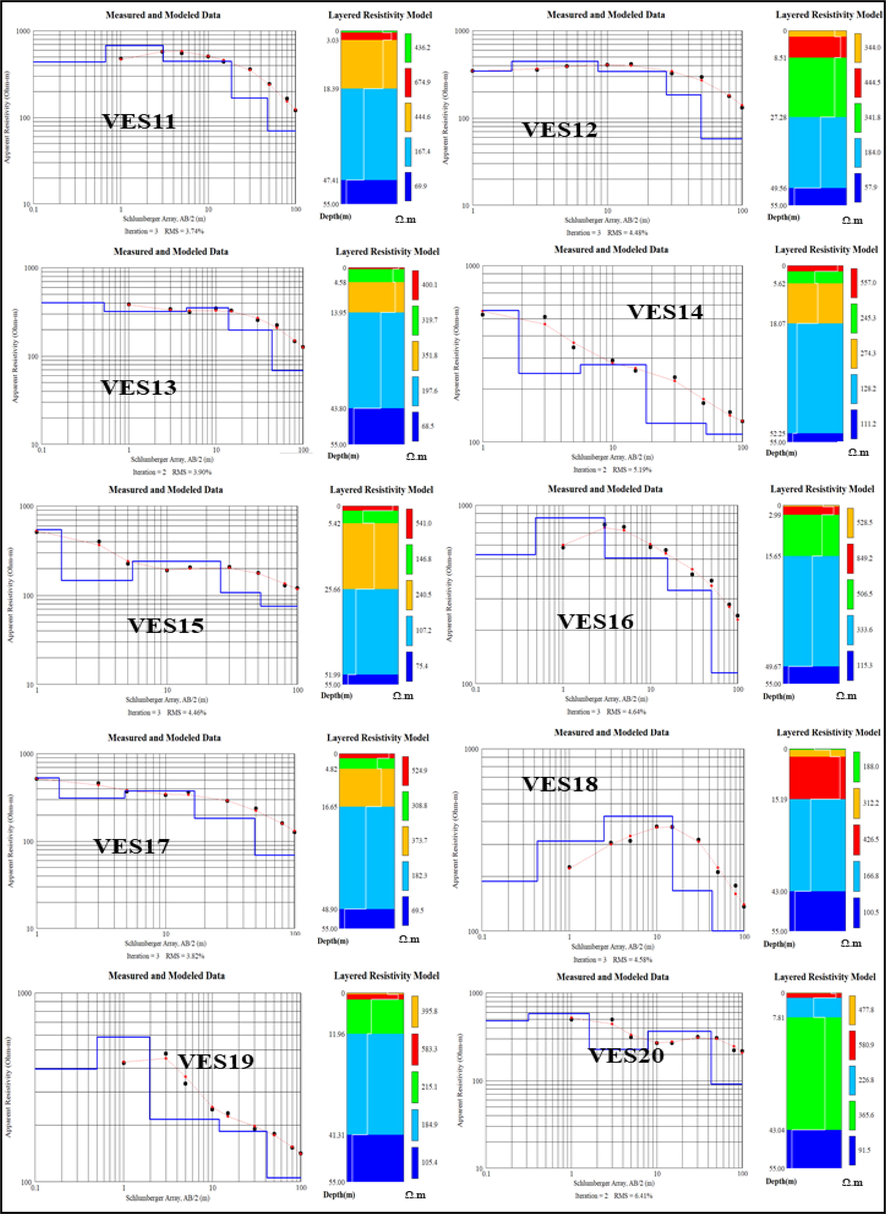
The one-dimensional inverse model for each in the study area.
The fifth layer represents the near-surface groundwater-bearing layer in the study region, based on data collected from the local farms that are distributed inside and near the study area, and this is corroborated by the electrical resistivity values of this layer derived from this study. Table 2 shows the electrical parameters of electrical resistivity and conductivity in the groundwater bearing layer (zone), as well as their depth, while Figs. 5 and 6 show the distribution of these parameters within the studied area.
VES No:
True Resistivity (Ω/m)
Ec (m/Ω)
Depth(m)
VES1
89.9
0.011123
30.78
VES2
71.1
0.014065
36.98
VES3
73.1
0.01368
43.75
VES4
86.4
0.011574
35.8
VES5
87.4
0.011442
38.32
VES6
92
0.01087
34.84
VES7
59.
0.016892
41.27
VES8
47
0.021277
39.91
VES9
61.8
0.016181
48.9
VES10
51.6
0.01938
41.21
VES11
69.9
0.014306
47.41
VES12
57.9
0.017271
49.56
VES13
68.5
0.014599
43.8
VES14
111.2
0.008993
52.25
VES15
75.4
0.013263
51.99
VES16
115.3
0.008673
49.67
VES17
69.5
0.014388
48.9
VES18
100.5
0.00995
43
VES19
105.4
0.009488
41.31
VES20
91.5
0.010929
43.04
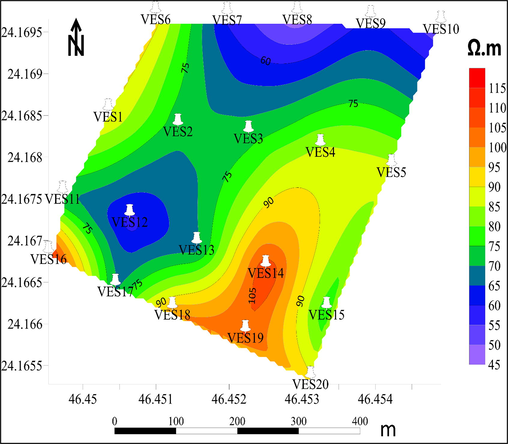
The shallow groundwater bearing zone's geoelectrical resistivity contour map.
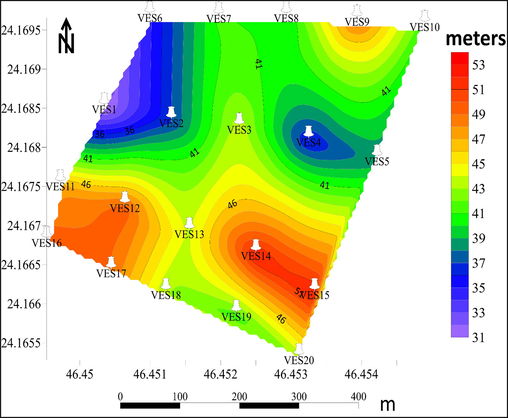
Shallow groundwater be depth contour map.
Fig. 5 depicts the lateral distribution of groundwater bearing zone resistivity values, which range from 47.0 Ω.m (in the northern part of the analyzed area) to 111.2 Ω.m (in the southeastern zone). The resistivity values in the southeastern and western zones of the studied area, although the central zone has moderate values of about 75 Ω.m, as seen in this figure. The depth of the groundwater bearing layer (zone) varies from 30.78 m (VES1) to 52.25 m (VES14) (Fig. 6). The shallowest zone is found in the northwestern zone, while the middle zone is defined by moderate depth, which runs from 39 to 43 m. The typical drop of the groundwater bearing zone towards the southern part of the studied area could explain these findings.
4.1 Electrical conductivity (EC)
The electrical conductivity (EC) value (1/ρ) has been calculated, which reflects the porosity and amount of dissolved material in water and represents the ability of an electric current to pass through it. The conductivity of water increases as the amount of dissolved particles increases. The lateral distribution of electrical conductivity (EC) of the groundwater bearing zone (layer) through the selected area for a present investigation is depicted in Fig. 7, with higher conductivity values obtained in the northern sections and extending southwestward to cover the majority of the area. The smallest conductivity values have been found in the area's southeastern zone.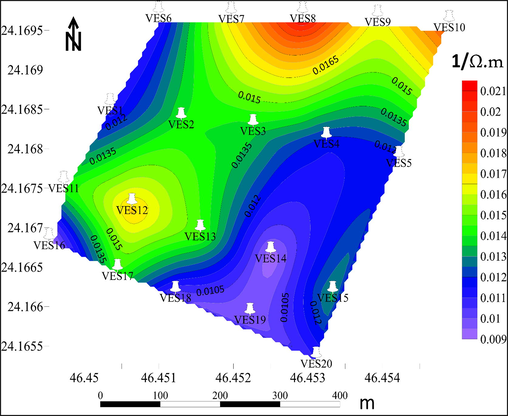
Shows a contour map of electrical conductivity (EC) in a shallow groundwater-bearing aquifer.
4.2 Geoelectrical cross-sections
Six geoelectric cross-sections (shown in Fig. 3) were built in the Wadi Nisah studied area, linking the majority of VES stations (approximately 15 VES from the total number of VESes). The resistivity values obtained from the inverted 1D resistivity profiles are used to assess the lithology and fluid content (Fig. 8a–f).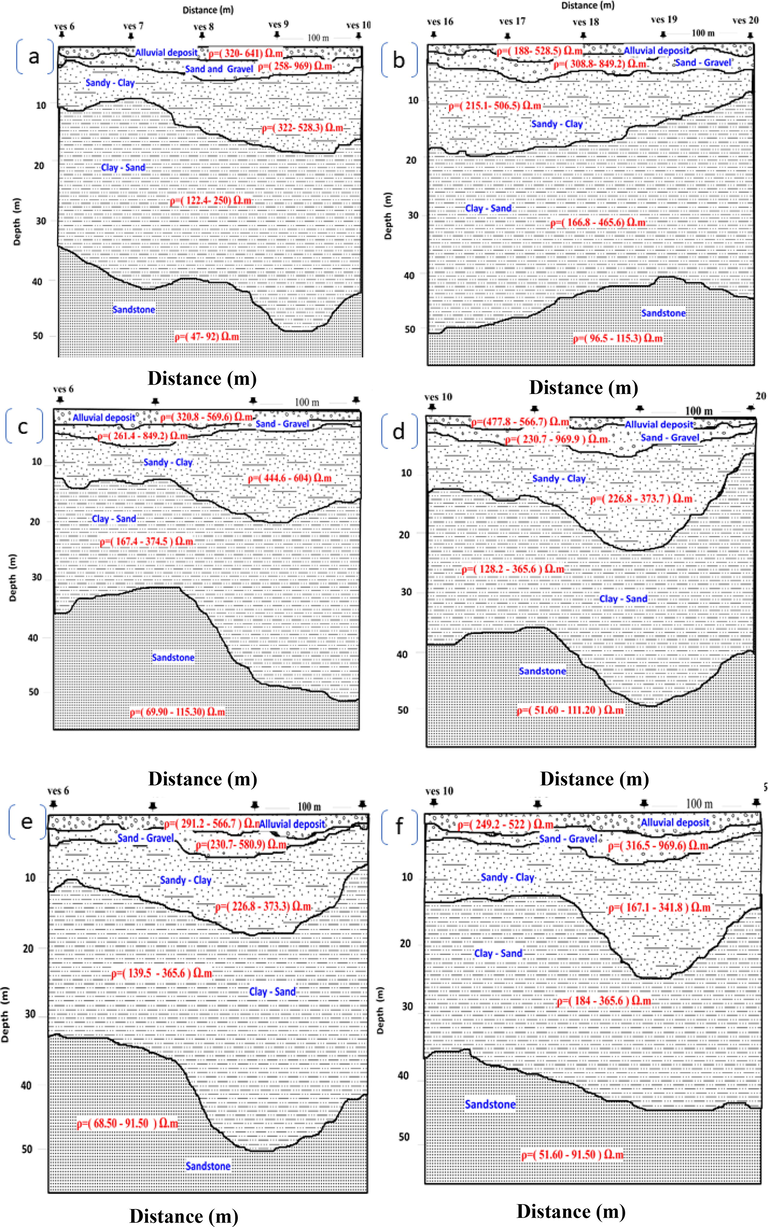
The geoelectrical cross-section through the studied area.
The geoelectrical cross-section No.1 (Fig. 8a) extends W-E and connects the VESes 6, 7, 8, 9, and 10. This cross-section displays five geoelectric layers arranged from top to bottom as; 1st geoelectrical layer has a wide range of resistivity values ranging from 320 (VES6)-641 Ω.m (VES8) that, in turn, due to the great heterogeneity of this thin layer (Alhenaki and Alsoma, 2015). The thickness varies between 0.22 m (VES7) and 2.2 m (VES9). This layer represents the superficial (topmost) layer and is composed of dry alluvial deposits; the 2nd layer is constituted by sands and gravel of resistivities spread from 258 (VES7) to 969 Ω.m (VES10) with thickness between 2.36 m (VES7) and 5.76 (VES8); the 3rd layer has resistivities in the range from 244 Ω.m (VES9) 528.3 Ω.m (VES6) and thickness from 6.11 m (VES7) to 12.22 m (VES10). This layer is occupied with sandy clay deposits where its thickness increases eastward; the 4th layer has a thickness that varies from 20.1 m (VES9) to 44.5 m (VES7) and resistivity values from 122.4 Ω.m (VES9) to 250 Ω.m (VES8). This layer consists of clayey sand deposits; the 5th layer signifies the bottom layer in the cross-section with resistivity values in the range from 47.0 Ω.m (VES8) to 92.0 Ω.m (VES6). This layer represented the groundwater bearing layer where it is composed of sandstone belonging to the Bayadh Formation (Hafiz et al., 2013) which epitomizes the shallow groundwater aquifer in the Riyadh region.
The geoelectrical cross-section No.2 (Fig. 8b) extends WNW-ESE and connects the VESes 16, 17, 18, 19, and 20. This cross-section displays five geoelectric layers arranged from top to bottom as; 1st geoelectrical layer has a wide range of resistivity values ranging from 188 (VES18) 528.5 Ω.m (VES16), which is due to the thin layer with great heterogeneity (Alhenaki and Alsoma, 2015). The thickness ranges from 0.12 m (VES20) and 1.3 m (VES17). This layer is the superficial (topmost) layer and is made up of dry alluvial deposits; the 2nd layer is constituted by sands and gravel with resistivities ranging from 308.8 (VES17) to 849 Ω.m (VES16) and thicknesses between 1.54 m (VES20) and 3.8 (VES17); the 3rd layer has resistivities ranging from 215 Ω.m (VES19) 506.5 Ω.m (VES16) and thickness from 5.54 m (VES20) to 13.7 m (VES16). This layer is occupied with sandy clay deposits where its thickness increases eastward; the 4th layer is having a thickness ranging from 18.21 m (VES18) to 35.4 m (VES20) and resistivity values from 166.8 Ω.m (VES18) to 365.6 Ω.m (VES20). This layer comprises clayey sand deposits; the 5th layer represents the cross-section indicating the bottom layer, with resistivity values varying from 69.5 Ω.m (VES17) to 115.3 Ω.m (VES16). This layer represented the groundwater bearing layer, which is made up of sandstone of the Bayadh Formation (Hafiz et al., 2013), which reflects the shallow groundwater aquifer through the Riyadh region.
The geoelectrical cross-section No. 3 (Fig. 8c) extends NNE-SSW and connects the VESes 6, 1, ,11 and 16. This cross-section shows five geoelectric layers arranged from top to bottom as; 1st geoelectrical layer has resistivity values ranging from 320 (VES6) 569 Ω.m (VES1), which, in turn, is related to the heterogeneity of the thin layer (Alhenaki and Alsoma, 2015). The thickness ranges from 0.18 m (VES16) and 1.2 m (VES1). This layer represents is the topmost layer and is composed of dry alluvial deposits; the 2nd layer is constituted by sands and gravel of resistivities spread from 261 (VES6) to 849 Ω.m (VES16) with thickness between 2.25 m (VES11) and 3.8 (VES1); the 3rd layer has resistivities in the range from 444.6 Ω.m (VES11) 604 Ω.m (VES1) and thickness from 6 m (VES1) to 15.2 m (VES11). This layer is occupied with sandy clay deposits where its thickness increases eastward; the 4th layer is characterized by thickness from 18.6 m (VES1) to 33.4 m (VES6) and resistivity values from 167.4 Ω.m (VES11) to 374.5 Ω.m (VES1). This layer consists of clayey sand deposits; the 5th layer denotes the bottom layer in the cross-section with resistivity values in the range from 69.9 Ω.m (VES11) to 115.3 Ω.m (VES16). This layer signified the groundwater bearing layer where it is made up of sandstone belonging to the Bayadh Formation (Hafiz et al., 2013), which reflects the shallow groundwater aquifer in the Riyadh region.
The geoelectrical cross-section No. 4 (Fig. 8d) extends NNE-SSW and connects the VESes 10, 5, 15, and 20. This cross-section displays five geoelectric layers arranged from top to bottom as; 1st geoelectrical layer has a wide range of resistivity values ranging from 477 (VES20)-566.7 Ω.m (VES5) that, in turn, due to the great heterogeneity of this thin layer (Alhenaki and Alsoma, 2015). The thickness varies between 0.12 m (VES20) and 1.5 m (VES15). This layer represents the superficial (topmost) layer and is made up of dry alluvial deposits; the 2nd layer is constituted by sands and gravel of resistivities spread from 146.8 (VES15) to 969.9 Ω.m (VES10) with thickness between 1.54 m (VES20) and 4.5 (VES5); the 3rd layer has resistivities in the range from 226.8 Ω.m (VES20) to 373.7 Ω.m (VES5) and thickness from 5.54 m (VES20) to 20.2 m (VES15). This layer is occupied with sandy clay deposits where its thickness increases eastward; the 4th layer is characterized by thickness from 24.6 m (VES10) to 35.4 m (VES20) and resistivity values from 107.2 Ω.m (VES15) to 365.6 Ω.m (VES20). This layer consists of clayey sand deposits; the 5th layer represents the bottom layer in the cross-section with resistivity values in the range from 51.6 Ω.m (VES10) to 91.5 Ω.m (VES20). This layer signified the groundwater bearing layer where it is composed of sandstone that belongs to the Bayadh Formation (Hafiz et al., 2013) which represents the shallow groundwater aquifer in the Riyadh region.
The geoelectrical cross-section No.5 (Fig. 8e) joins the VESes 2, 6, 14, and 20 and runs NW-SE. This cross-section illustrates five geoelectric layers as follows from top to bottom; 1st geoelectrical layer with resistivity values ranging from 291 (VES2) 557 Ω.m (VES14) which, in turn, reflects the heterogeneity of this layer (Alhenaki and Alsoma, 2015). The thickness varies between 0.12 m (VES20) and 2.2 m (VES14). This is the topmost layer and is represented by dry alluvial deposits; the 2nd layer is consisting of sands and gravel with resistivities spread from 245.3 (VES14) to 580.9 Ω.m (VES20) with thickness between 1.54 m (VES20) and 3.4 (VES14); the 3rd layer has resistivities in the range from 226.8 Ω.m (VES20) 528.3 Ω.m (VES6) and thickness from 5.54 m (VES20) to 12 m (VES14). This sandy clay layer where its thickness increases eastward; the 4th layer is characterized by thickness from 25.88 m (VES2) to 35.4 m (VES20) and resistivity values from 128.2 Ω.m (VES14) to 365.6 Ω.m (VES20). This layer comprises clayey sand deposits; the 5th layer in the cross-section defines the bottom layer with resistivity values ranging from 71.1 Ω.m (VES2) to 111.2 Ω.m (VES14). This layer is the groundwater bearing layer, which is composed of sandstone of the Bayadh Formation (Hafiz et al., 2013), which is the shallow groundwater aquifer in the Riyadh region.
The geoelectrical cross-section No.6 (Fig. 8f) extends NE-SW and connects the VESes 10, 3, 12, and 20. This cross-section exhibits five geoelectric layers organized from top to bottom as; 1st geoelectrical layer characterized by resistivity values ranging from 249.2 (VES3)-522 Ω.m (VES10) that, in turn, related to the heterogeneity of this layer (Alhenaki and Alsoma, 2015). The thickness varies between 0.12 m (VES20) and 2.1 m (VES12). This layer is the superficial layer and is made up of dry alluvial deposits; the 2nd layer is of sands and gravel with resistivities ranging from 444.5 Ω.m (VES6) to 969.9 Ω.m (VES10) and thickness varies between 1.54 m (VES20) and 6.5 m (VES12); the 3rd layer has resistivities in the range from 167.1 Ω.m (VES3) 341.8 Ω.m (VES12) and thickness from 5.54 m (VES20) to 20 m (VES12). This layer is of sandy clay deposits where its thickness increases eastward; the 4th layer is characterized by thickness from 20.15 m (VES3) to 35.4 m (VES20) and resistivity values from 184 Ω.m (VES12) to 365.6 Ω.m (VES20). This layer consists of clayey sand deposits; the 5th layer in the cross-section reveals the bottom layer, with resistivity values ranging from 51.6 Ω.m (VES10) to 91.5 Ω.m (VES20). This layer is the groundwater bearing layer where it is composed of sandstone belonging to the Bayadh Formation (Hafiz et al., 2013), which indicates the shallow groundwater aquifer in the Riyadh region.
5 Conclusions
The vertical electrical sounding (VES) procedure is one of the least expensive methods for obtaining resistivity per unit depth. A Schlumberger configuration with current electrodes half-spacing that reach 100 m was used to conduct the vertical electrical soundings at 20 sites using IRIS Syscal R2 field resistivity-meter. The data analysis and resistivity results show that there are five geoelectric layers. the resistivity of the first layer range from 188 to 760.7 Ω/m, the resistivity of the second layer range from 146.8 to 969 Ω/m, the resistivity values of the third layer range from 167.1 to 604 Ω/m, the resistivity of the fourth layer range from 107.2 to 374.5 Ω/m and the resistivity of the fifth layer from 47 to 115.3 Ω/m, the conductivity of the fifth layer range from 0.008993 to 0.0212777 m/Ω, also the depth of the five-layer range from 3.78 m to 52.25 m. The decrease in the resistivity and the increase in the conductivity of the fifth layer indicate the groundwater-bearing layer.
The groundwater-bearing layer is indicated by drop-in resistivity values in the fifth layer. According to these findings, the fifth layer, which has a lower value of resistivity, is water-bearing and serves as the primary supply of water for the region's agricultural areas.
Acknowledgements
This research was supported by Researchers Supporting Project number (RSP2022R496), King Saud University, Riyadh, Saudi Arabia.
Declaration of Competing Interest
The authors declare that they have no known competing financial interests or personal relationships that could have appeared to influence the work reported in this paper.
References
- Groundwater System Evaluation for Wadi Nisah. Tucson: University of Arizona; 1976. M.S. Thesis
- Water exploration using Magnetotelluric and gravity data analysis; Wadi Nisah, Riyadh, Saudi Arabia. NRIAG J. Astron. Geophys.. 2014;3(2):184-191.
- [Google Scholar]
- Identification of hydrogeochemical processes and their influence on groundwater quality for drinking and agricultural usage in Wadi Nisah, Central Saudi Arabia. Arab. J. Geosci.. 2018;11(13):359.
- [Google Scholar]
- Use of Vertical Electrical Sounding Survey for Study Groundwater in Nisah Region. Saudi Arabia: AGU General Assembly Conference Abstracts, Vol. 17; 2015.
- Al Rajeh H., Abdelrahman K., Ibrahim E. (2017). Groundwater exploration using vertical electrical sounding: Case study of Al-Amar region, southwest Riyadh, Saudi Arabia. International Conference on Engineering Geophysics, Al Ain, United Arab Emirates, 9-12 October 2017.
- Groundwater investigation using electrical resistivity imaging technique at Sg. Udang, Melaka, Malaysia. BGSM. 2012;58:55-58.
- [Google Scholar]
- 2D geo-electrical resistivity imaging (ERI) of hydrocarbon contaminated soil. EJGE (Electron. J Geotech. Eng.). 2016;21:299-304.
- [Google Scholar]
- Bashir I. Y., Izham M. Y., Main R. (2014). Vertical electrical sounding investigation of aquifer composition and its potential to yield groundwater in some selected towns in Bida Basin of North Central Nigeria. J. Geograph. Geol. 6(1) (2014) 60–69.
- Bhattacharya P. K. & Patra H. P.(1968). Direct Current Electric Sounding (Methods in Geochemistry and Geophysics, 9.) ix + 135 p., 47 figs., 16 tables. Elsevier Publishing Co., Amsterdam, London, New York.
- Water supply for Riyadh, Saudi Arabia. Washington, D. C.: U. S. Geological Survey; 1963.
- Denis, V., Mohammed S. Al-Muallem, Sami S. Maddah, Jean -Michel Brosse, Jackie F., Jean-Paul B., and Yves- Michel Le N., (1991). Explanatory Notes to the Geologic Map of the Ar Riyadh Quadrangle: Sheet 24 I, Kingdom of Saudi Arabia.
- Potensi Akuifer Air Tanah Pada Batuan Sedimen Tersier Berdasarkan Analisis Data Geolistrik Di Distrik Waisai Kota Kabupaten Raja Ampat, Provinsi Papua Barat. Bull. Sci. Contrib. Geol.. 2017;15(2):181-192.
- [Google Scholar]
- Mapping shallow groundwater aquifer by performing high-resolution seismic reflection technique in Wadi Nisah. ASEG Extended Abstracts. 2013;2013(1):1-4.
- [Google Scholar]
- Hamzah, U., Ismail, M.A., Samsudin, A.R., 2008. Geophysical techniques in the study of hydrocarbon-contaminated soil 54, 133 138. https://doi.org/10.7186/bgsm2008020.
- Groundwater investigation in Kuala Selangor using vertical electrical sounding (VES) surveys. Environ. Geol.. 2007;51(1349):1359.
- [CrossRef] [Google Scholar]
- Structural and photogeological evidence for the boundaries to an East Arabian’ block. Geol. Mag.. 1981;118(5):533-538.
- [Google Scholar]
- An Introduction to Geophysical Exploration. Oxford: Blackwell Scientific Publication; 1984. p. :198-217.
- (2019): Application of vertical electrical sounding for groundwater exploration of Cape Coast municipality in the Central Region of Ghana. Arab. J. Geosci.. 2019;12:196.
- [CrossRef] [Google Scholar]
- Modeling of groundwater recharge using multiple linear regression (MLR) recharge model developed from geophysical parameters: a case of groundwater resources management. Environ. Earth Sci.. 2015;73(3):1217-1230.
- [Google Scholar]
- Hydrochemical assessment of groundwater in Mesozoic sedimentary aquifers in an arid region: a case study from Wadi Nisah in Central Saudi Arabia. Environ. Earth Sci.. 2020;79(6):1-12.
- [Google Scholar]
- Identification of aquifer using geoelectrical resistivity method with Schlumberger Array in Koto Panjang Area, Nagari Tigo Jangko, Lintau Buo Sub-District, Tanah Datar Regency. J. Phys. Conf. Ser.. 2019;1185:012009.
- [Google Scholar]
- Phoenix, H.C., (1985). United States Court of Appeals, District of Columbia Circuit, Argued March 12, 1985.
- Geology of Arabian Peninsula: Sedimentary Geology of Saudi Arabia. U.S. Geological Survey Professional Paper; 1966. p. :560D.
- Sharma, P.V. (1997). Environmental and Engineering Geophysics. Cambridge University Press, Cambridge, 1-475. http://dx.doi.org/10.1017/CBO9781139171168.002.
- Sogreah (1967). Riyadh Water Supply. Unpublished Report, Ministry of Agriculture and Water, Riyadh, Saudi Arabia.
- Sogreah, 1968. Riyadh Water Supply, Sogrea Consulting Co., Grenoble, France, Ministry of Agr. & Water, Kingdom of Saudi Arabia.
- Suryadi A., Putra D., Kausarian H., Prayitno B., Fahlepi R. (2018). Groundwater exploration using Vertical Electrical Sounding (VES) Method at Toro Jaya, Langgam, Riau. J. Geosci. Eng. Environ. Technol. 03(04) 226-230.
- Vaslet, D., Brosse, J.M., Breton, J.P., Manivit, J., Le Strat, P., Fourniguet, J., Shorbaji, H., 1991. Explanatory Notes to the Geologic Map of the Shaqra Quadrangle: Sheet 25H, Kingdom of Saudi Arabia. Ministry of Petroleum and Mineral Resources, Saudi Arabia.
- Plio-quaternary movement of the eastern Arabian block. GeoArabia. 1998;3(4):509-540.
- [Google Scholar]


