

Translate this page into:
Study of LHCGR gene variants in a sample of colombian women with polycystic ovarian syndrome: A pilot study
⁎Corresponding author at: Universidad Pedagógica y Tecnológica de Colombia, Sede Central Tunja–Boyacá, Avenida Central del Norte 39-115, Colombia. maribel.forero@uptc.edu.co (Maribel Forero-Castro)
-
Received: ,
Accepted: ,
This article was originally published by Elsevier and was migrated to Scientific Scholar after the change of Publisher.
Peer review under responsibility of King Saud University.
Abstract
Purpose
To evaluate the association between polymorphisms of the LHCGR gene and PCOS in a sample from Colombian women.
Methods
We included 49 Colombian women with PCOS and 49 healthy women. Genotype distributions between groups were compared, and phenotype-genotype association analysis was performed in the PCOS group. Identification of five SNP’s in the LHCGR gene was carried out through the iPLEX and MassARRAY system (Agena Bioscience).
Results
Our results showed that the rs7371084 variant was negatively associated with PCOS under the codominant, dominant, and overdominant models. Women with the TC + TT genotypes in rs2293275 had shorter menstrual cycles (p = 0.026), and women with the CT + CC genotypes in rs6732721 showed a decrease in the number of antral follicles (p = 0.038).
Within the endocrine parameters, we identified associations between GA + GG genotypes in rs13405728 and CT + CC genotypes in rs6732721, and the decrease in LH levels (p = 0.013; p = 0.04, respectively). Women with TC + TT genotypes in rs2293275 had increased DHEAS (p = 0.047) and androstenedione (p = 0.045) levels. Regarding metabolic parameters, we identified associations between GA + GG genotypes in rs13405728 and CT + CC genotypes in rs6732721, and an increase in fasting glucose levels (p = 0.028; p = 0.017, respectively).
Conclusion
We found that the rs7371084 variant was negatively associated with PCOS. Also, we identify associations between combined genotypes of the LHCGR gene and the phenotypic traits of PCOS, such as shorter menstrual cycle length, fewer follicles, lower LH levels, and increased DHEAS, androstenedione, and fasting glucose levels. The results of this pilot study provide a basis to clarify the genetics and pathophysiology of PCOS in the Colombian population. Future large-scale studies are recommended for this population.
Keywords
Colombian women
Genetic polymorphisms
LHCGR
Phenotype-genotype associations
Polycystic ovary syndrome

- PCOS
-
Polycystic ovary syndrome
- IR
-
Insulin resistance
- HPG
-
Hypothalamic-pituitary-gonadal
- FSH
-
Follicle-stimulating hormone
- FSHR
-
FSH receptor
- LH
-
Luteinizing hormone
- LHCGR
-
LH receptor
- GWAS
-
Genome-wide association studies
- SNPs
-
Single nucleotide polymorphisms
- SHBG
-
Sex hormone binding globulin
- BMI
-
Body mass index
- CFA
-
Antral follicle count
- DHEAS
-
Dehydroepiandrosterone sulfate
- AMH
-
Anti-mullerian hormone
- TSH
-
Thyroid-stimulating hormone
- HOMA-IR
-
Homeostatic model assessment for insulin resistance
- HOMA-IS
-
Homeostatic model assessment for insulin sensitivity
- AIC
-
Akaike information criteria
Abbreviations
1 Introduction
Polycystic ovary syndrome (PCOS) is an ovarian, hormonal and metabolic disorder characterized by the presence of at least two of the following manifestations: hyperandrogenism at a clinical or biochemical level, anovulation, and/or oligo-ovulation, and polycystic ovarian anatomy (Coyle and Campbell, 2019). The prevalence of PCOS is 6–10% in women of reproductive age worldwide. PCOS is associated with female infertility, which is represented by 70% of cases of anovulatory infertility (Brassard et al., 2008). Women with this syndrome are prone to insulin resistance (IR), android type obesity, diabetes, anxiety, depression, and other psychological disorders that impact their quality of life (Teede et al., 2010).
Although the etiology of PCOS is not yet clear, it has been established that hormonal and genetic factors such as altered ovarian steroid synthesis, dysfunction in folliculogenesis, hyperinsulinemia, dysfunction in gonadotropin secretion, and neuroendocrine abnormalities, influence the pathogenesis of the syndrome (Saadia, 2020). Since alterations in the hypothalamic-pituitary–gonadal (HPG) axis cause ovarian failure, multiple candidate genes along the HPG axis such as follicle-stimulating hormone (FSH), FSH receptor (FSHR), luteinizing hormone (LH), the LH receptor (LHCGR) androgen receptor, and sex hormone binding globulin (SHBG), have been studied (Zhao and Chen, 2013). In PCOS, the same genes have been identified as susceptible loci in previous genome-wide association studies (GWAS) (Hiam et al., 2019; Yumiceba et al., 2020).
LHCGR gene is known as the receptor for LH and human chorionic gonadotropin (HCG) (Robeva et al., 2018). This gene is located on chromosome 2p16.3 and it has 11 exons. The coded protein belongs to the G-protein coupled receptor 1 family and allows the body's physiological and morphological response to be complementary to the two hormones (Thathapudi et al., 2015). In women, LHCGR is expressed in theca and granulosa cells, as well as in adipose tissue (Kanamarlapudi et al., 2016). Multiple Single Nucleotide Polymorphisms (SNPs) have been identified in the LHCGR gene, and it has been established that they could alter gene expression and the protein function. Since LHCGR plays a fundamental role in androgen metabolism and ovulation, SNPs could influence the risk of PCOS (El-Shal et al., 2016).
Clinical conditions like Leydig cell agenesis, Leydig cell tumor, testotoxicosis, sex differentiation disorders, hermaphroditism, pseudohermaphroditism, male infertility, LH resistance, malignant breast neoplasm, precocious puberty, primary hypogonadism, and PCOS have been associated with LHCGR (DisGeNET database, https://www.disgenet.org/). The analysis of genetic variations in this gene across various studies has allowed the association of SNPs with phenotypic characteristics in a wide range of women with PCOS, such as high body mass index (BMI), abnormalities in menarche (oligo-ovulation / anovulation) (Almawi et al., 2015; Cui et al., 2013), preeclampsia (Zhang et al., 2019), poor regulation of testosterone, elevated triglycerides, and low-density lipoproteins (Ha et al., 2015). Furthermore, LHCGR shows overexpression in adipose tissue of non-obese women with PCOS (Vishnubotla et al., 2020). Given the above, this study aims to evaluate the association between five variants (rs13405728, rs7371084, rs4953616, rs2293275, and rs6732721) in the LHCGR gene and PCOS in a sample of Colombian women. Selection of the variants was performed according to their reporting frequency in previous association studies with PCOS (Almawi et al., 2015; Branavan et al., 2018; Capalbo et al., 2012; El-Shal et al., 2016; Thathapudi et al., 2015; Xia et al., 2019; Zhang et al., 2019).
2 Materials and methods
2.1 Subjects
Clinical characteristics, inclusion and exclusion criteria have been previously described (Alarcón-Granados et al., 2022). In summary, this study included 98 unrelated Colombian women, 49 patients with PCOS, and 49 healthy women. Inclusion of patients was based on a diagnosis of PCOS according to the Rotterdam Consensus proposed in 2003 (Bozdag et al., 2016). At least two of the following three features needed to be present: oligo-ovulation or anovulation, clinical and/or biochemical signs of hyperandrogenism, and sonographic evidence of polycystic ovary (Fauser, 2004). All women were of reproductive age, over 18 years old, and non-pregnant. Women with pelvic inflammatory disease, reproductive failure, and ovarian surgery, were excluded from the study.
Healthy women between 24 and 30 years old, without endocrine-metabolic and ovulatory dysfunctions, were included in the control group. Women with premature ovarian failure, chronic pelvic pain during the menstrual cycle, polycystic ovaries, hormonal disorders (thyroid and prolactin), or a reproductive surgical history were excluded.
Written informed consent was obtained from each patient which was approved by Universidad Pedagógica y Tecnológica de Colombia (Reference number: SGI code 2386 - VIE 05 of 2018; SGI code 2677 - VIE 06 of 2019) and Universidad de Boyacá (Reference number: 011–2019 CB, 29/03/2019) Ethics Review Committees.
2.2 Clinical measurements
Medical history from the participants was collected, and anthropometric data: height (m) and weight (kg), were used to calculate BMI using the formula BMI = weight (kg) / height (m2). A transvaginal pelvic ultrasound was also performed using a PHILIPS EnVisor M2540 Ultrasound. Data of antral follicle count (CFA) between 2 and 10 mm in size were registered. Sociodemographic data, menstrual and obstetric history, presence of signs and symptoms of PCOS, family history of polycystic ovaries, endometriosis, and other pathologies, were obtained by interview. Clinical features (acne, hair loss, facial hair, abdominal hair, oily discharge from the scalp and face, acanthosis nigricans, cystic lesion resection, interruption of menstrual bleeding for more than 3 months, multiple menstrual bleeding within a month, postcoital bleeding, dysmenorrhea, contraceptive treatment) were registered. Contraceptive treatment consisted of ethinylestradiol 0.02 mg + drospirenone 30 mg, one tablet oral administration at the first day of the menstrual cycle during 21 days. This contraceptive scheme was administered to ensure that all patients had a periodic cycle and to perform the ultrasound study between the second and fifth menstrual cycle day.
2.2.1 Endocrine and metabolic evaluation of PCOS women
Endocrine-metabolic parameters (DHEAS, free testosterone, fasting insulin, postprandial insulin, fasting blood glucose, postprandial glucose, HOMA-IR, HOMA-IS, and glycosylated hemoglobin) and lifestyle habits (smoker, regular exercise, and daily coffee consumption) were only measured in the PCOS group.
After an overnight fast, venous blood samples were obtained for genetic study and hormonal profile. Blood sampling was performed during the early follicular phase (between 2 and 5 days of the menstrual cycle). Levels of follicle-stimulating hormone (FSH), dehydroepiandrosterone sulfate (DHEAS), and luteinizing hormone (LH) were measured using the chemiluminescence technique. ELISA immunoassay (MyByosource, San Diego CA.USA, MBS2023458, and DiaMetra, Italy, DKO008) was used to measure the levels of anti-mullerian hormone (AMH) and androstenedione, respectively. Free testosterone concentrations were measured using the radioimmunoassay technique (RIA). Glycosylated hemoglobin was measured using the HbA1C monoclonal antibody technique (MyByosource, San Diego CA.USA, MBS2031845) according to the manufacturer’s instructions.
Plasma glucose levels were measured using the hexokinase method (GLUC3 GLUCOSE HK GEN.3 04404483190, Roche Diagnostics). Finally, the levels of pre and post insulin, estradiol, and thyroid-stimulating hormone (TSH) were measured using the amplified enzyme chemiluminescence technique (SIEMENS-IMMULITE, Germany). The homeostatic model assessment for insulin resistance (HOMA-IR) was calculated as follows [fasting insulin (mIU/L) × fasting glucose (mmol/L)] /22.5, and the homeostatic model assessment for insulin sensitivity (HOMA-IS) was calculated as follows 1/ [fasting insulin (mIU/L) × fasting glucose (mmol/L)] (Du et al., 2015). The reference values are detailed in Supplementary Table 1. Abbreviations: BMI: Body mass index; FSH: Follicle-stimulating hormone; AMH: Antimüllerian hormone; LH: Luteinizing hormone; TSH: Thyroid-Stimulating hormone; E2: Estradiol; AFC: Antral follicular count. Data in bold indicate statistically significant results (p < 0.05). These clinical characteristics have been previously described (Alarcón-Granados et al., 2022).
PCOS (n = 49)
Controls (n = 49)
P-value
Age (years)
28 (24–33)
27 (24–30)
0.448†
Weight (kg)
60.8 (55–74)
60 (52–64)
0.037†
Height (m)
1.62 (1.59–1.66)
1.6 (1.56–1.64)
0.064†
BMI (kg/m2)
23.16 (21.48–25.6)
22.6 (20–24.98)
0.22†
Menarche (years)
13 (12–14)
12 (11.5–14)
0.185†
Menstrual cycle length (days)
31 (29.5–45)
28 (28–30)
<0.0001†
Period length (days)
5 (4–8)
5 (4–5)
0.129†
FSH (mUl/ml)
5.95 ± 3.47
9.5 ± 5
<0.0001††
AMH (ng/ml)
8.02 (5.07–12.55)
4.87 (3.05–6.77)
<0.0001†
LH (mUl/ml)
6.8 (4.55–10.3)
3.2 (2.12–5.17)
<0.0001†
LH/FSH ratio
1.27 (0.83–1.74)
0.38 (0.18–0.64)
<0.0001†
TSH (mUl/ml)
1.67 (1.29–2.69)
1.65 (1.05–2.47)
0.284†
E2 (pg/ml)
53.3 (32.72–72.87)
29.7 (15–40.6)
<0.0001†
Total ovarian volume (cm3)
12.25 (9.62–18.75)
7.61 (6.63–9.47)
<0.0001†
Total AFC (number of follicles)
27 (23–34,75)
16 (13–20)
<0.0001†
FAMILY BACKGROUND
Family history of polycystic ovaries
22 (44.8%)
6 (12.24%)
<0.0001†††
Family history of endometriosis
10 (20.4%)
4 (8.16%)
0.013†††
Family history of breast and ovarian cancer
10 (20.4%)
6 (12.24%)
0.196†††
REPRODUCTIVE FEATURES
Pregnancies
12 (24.48%)
33 (67.34%)
<0.0001†††
Early pregnancy loss
8 (16.32%)
2 (4.08%)
0.045†††
Spontaneous abortion
7 (14.28%)
2 (4.08%)
0.091†††
2.3 DNA isolation and genotyping
DNA was extracted from blood samples using Invisorb R Spin Universal Kit (Stratec Molecular) according to the manufacturer’s instructions. Samples were quantified using EPOCHTM2 Microplate Spectrophotometer (Biotek) and subsequently kept at −20° C until use.
Primers were designed in the Assay Design Suite (ADS) software; design data is shown in Supplementary Table 2. Allelic discrimination was performed using the iPLEX Assay and MassARRAY system from Agena Bioscience. In summary, in this procedure, the desired region of interest is PCR-amplified using specific primers for the LHCGR gene. Subsequently, an iPLEX single base extension is performed to identify the alleles. The primer is extended, dependent upon the template sequence, resulting in an allele-specific difference in mass between extension products. The difference in mass of the alleles is what allows the software to identify the genotype for each SNP. The iPLEX reaction products are dispensed into a SpectroCHIP Array, which is placed on the MALDI-TOF mass spectrometer. Genotyping is determined in real-time while results are displayed in the Typer software. Detailed genotyping procedures were carried out as described by Storm et al., 2003, Oeth et al. 2005, and Gabriel et al., 2009 (Gabriel et al., 2009; Oeth et al., 2005; Storm et al., 2003). Abbreviations: DHEAS: Dehydroepiandrosterone sulfate; HOMA-IR: Homeostasis model Assessment-Insulin resistance; HOMA-IS: Homeostasis model Assessment-Insulin sensitive. These clinical characteristics have been previously described (Alarcón-Granados et al., 2022).
Endocrine-Metabolic parameters
Value†
Androstenedione (ng/ml)
1.49 ± 0.59
DHEAS (ug/dL)
152.8 ± 64.51
Free testosterone (pg/ml)
1.34 (0.91–2.40)
Fasting insulin (uUl/ml)
4.68 (2.62–9.16)
Post meal insulin (uUl/ml)
28.3 (13.1–43.6)
Fasting blood glucose (mg/dL)
83.91 ± 8.51
Post meal glucose (mg/dL)
80.5 (72.5–95)
HOMA-IR
0.84 (0.48–1.95)
HOMA-IS
0.49 (0.02–0.08)
Glycosylated hemoglobin (%)
5.24 (5.01–5.74)
Clinical parameters
n (%)††
Acne
30(60%)
Hair loss
43(86%)
Facial hair
34(68%)
Abdominal hair
30(60%)
Fatty discharge from scalp and face
33(66%)
Acanthosis nigricans
10(20%)
Cystic lesion resection
2(4%)
Menstrual bleeding stopped for more than 3 months
30(60%)
Multiple menstrual bleeds in one month
25(50%)
Postcoital bleeding
5(10%)
Dysmenorrhea
29(58%)
Contraceptive treatment
17(34%)
Smoker
9(18%)
Exercise regularly
28(56%)
Daily coffee consumption
32(64%)
2.4 Statistical analysis
Systematization and analysis of the data were performed in IBM SPSS Statistics v21.0. A value of p < 0.05 was considered statistically significant. Kolmogorov-Smirnov and Shapiro Wilk tests were used to determine the normality of the variables. Data were shown as mean ± SD for parametric variables, and as median (interquartile range) for nonparametric. Data were summarized in absolute frequencies and percentages. Comparisons between two independent groups for parametric variables were made using the Student’s t-test, for nonparametric variables using the Mann-Whitney U test, and for categorical variables using the Chi-square test.
Using the SNPStats virtual tool (https://www.snpstats.net/start.htm) the Hardy-Weinberg equilibrium, genotype calculations, allelic associations, and the OR values and their respective 95% confidence intervals were evaluated. (95% CI). The risk of PCOS was analyzed under the codominant, dominant, recessive, overdominant and, additive inheritance models, adjusted by logistic regression for age and BMI. The Akaike Information Criteria (AIC) was used to determine the best model for each SNP, which corresponded to the model with the lowest AIC value (Branavan et al., 2020). The association analysis between genotypes and phenotypes in women with PCOS was performed under the best-identified inheritance model. To determine associations in the genotype vs phenotype analysis, the Kruskal-Wallis test or ANOVA was used, as appropriate.
Linkage disequilibrium analysis (LD) between SNPs was performed in Haploview software version 4.2 ( https://www.broadinstitute.org/haploview) (Barrett et al., 2005). The LD level was defined as strong LD (D’greater than 0.8), moderate LD (0.4 < D’≤ 0.8), and weak LD (D ≤ 0.4) (Ding and Kullo, 2007). The haplotype blocks were defined and their frequencies were estimated (frequency ≥ 1% and the threshold r2 was 0.8). Using a chi-square test, haplotype frequencies were compared between cases and controls.
2.5 Data availability
The authors declare that the data supporting the findings of this study are available within the paper and its supplementary information files.
3 Results
3.1 Subjects
Table 1 shows the clinical and endocrine characteristics in women with PCOS and control women which have been described in a previous study (Alarcón-Granados et al., 2022). Women with PCOS had increased values in weight (60.8 vs 60 kg; p = 0.037), menstrual cycle length (31 vs 28 days; p < 0.0001), AMH (8.02 vs 4.87 ng/ml; p < 0.0001), LH (6.8 vs 3.2 mUl/ml; p < 0.0001), E2 (53.3 vs 29.7 pg/ml; p < 0.0001), total ovarian volume (12.25 vs 7.61 cm3; p < 0.0001), total number of follicles (27 vs 16; p < 0.0001), family history of polycystic ovaries (44.8% vs 12.24%, p < 0.0001), family history of endometriosis (20.4% vs 8.16%; p < 0.013), and early pregnancy loss (16.32% vs 4.08%; p = 0.045). In contrast, compared to the control group, women with PCOS had decreased FSH levels (5.95 vs 9.5 mUl/ml; p < 0.0001) and fewer pregnancies (12 vs 33; p < 0.0001).
It should be noted that the samples of the control group included in this study corresponded to previously extracted DNAs, and therefore we did not have access to some endocrine, metabolic, and lifestyle parameters in this group.
The characterization of women with PCOS is shown in Table 2. Most women with PCOS (≥60%) presented characteristics associated with hyperandrogenism such as acne, hair loss, facial hair, abdominal hair, and fatty discharge from scalp and face. Also, it was observed that more than 50% of the women had problems associated with menstruation, at some point in their life, such as menstrual bleeding stopped for more than 3 months, multiple menstrual bleeds in one month, and dysmenorrhea.
3.2 Genotype and allele frequency distribution
Genotype and allelic frequencies of LHCGR polymorphisms in cases and controls are presented in Table 3. Genotype distributions were in Hardy-Weinberg equilibrium in both groups. No differences were observed in genotypic and allelic frequencies in the two groups (p > 0.05). The distribution of genotypes was clustered for the whole sample (n = 98) and is illustrated in Fig. 1. In this study, the minor allele frequency (MAF) for each variant was rs13405728-G, rs7371084-C, rs4953616-C, rs2293275-T, and rs6732721-C. This results coincided with those reported by the 1000 Genomes Project (Supplementary Table 3). Abbreviations: OR (CI 95%): Odds ratio and 95% confidence intervals; H-W test: Hardy-Weinberg equilibrium test; NC: Not calculated. † Pearson’s chi-square test, was used to evaluate the association between SNP and groups (PCOS and control).
Variant
Genotype
PCOS frequency
(n = 49)Control frequency
(n = 49)OR (95% CI)
P- value†
rs13405728
Genotypes
0.6
AA
40 (0.82)
36 (0.74)
Reference
GA
8 (0.16)
12 (0.24)
0.60 (0.22–1.63)
GG
1 (0.02)
1 (0.02)
0.90 (0.05–14.92)
H-W test††
0.4
1
Alleles
0.383
A
88 (0.90)
84 (0.86)
Reference
G
10 (0.10)
14 (0.14)
0.682 (0.287–1.619)
rs7371084
Genotypes
0.055
TT
37 (0.76)
28 (0.57)
Reference
TC
11 (0.22)
21 (0.43)
0.40 (0.16–0.96)
CC
1 (0.02)
0
NC
H-W test††
1
0.091
Alleles
0.131
T
85 (0.87)
77 (0.79)
Reference
C
13 (0.13)
21 (0.21)
0.561 (0.263–1.196)
rs4953616
Genotypes
0.81
TT
22 (0.45)
25 (0.51)
Reference
CT
23 (0.47)
21 (0.43)
1.24 (0.55–2.84)
CC
4 (0.08)
3 (0.06)
1.52 (0.31–7.53)
H-W test††
0.74
0.73
Alleles
0.531
T
67 (0.68)
71 (0.72)
Reference
C
31 (0.32)
27 (0.28)
1.217 (0.658–2.249)
rs2293275
Genotypes
0.31
CC
20 (0.41)
23 (0.47)
Reference
TC
23 (0.47)
24 (0.49)
1.10 (0.48–2.52)
TT
6 (0.12)
2 (0.04)
3.45 (0.62–19.05)
H-W test††
1
0.29
Alleles
0.284
C
63 (0.64)
70 (0.71)
Reference
T
35 (0.36)
28 (0.29)
1.515 (0.305–7.526)
rs6732721
Genotypes
0.72
TT
38 (0.78)
35 (0.71)
Reference
TC
10 (0.20)
12 (0.25)
0.77 (0.29–2.00)
CC
1 (0.02)
2 (0.04)
0.46 (0.04–5.30)
H-W test††
0.53
0.59
Alleles
0.414
T
86 (0.88)
82 (0.84)
Reference
C
12 (0.12)
16 (0.16)
0.715 (0.319–1.603)
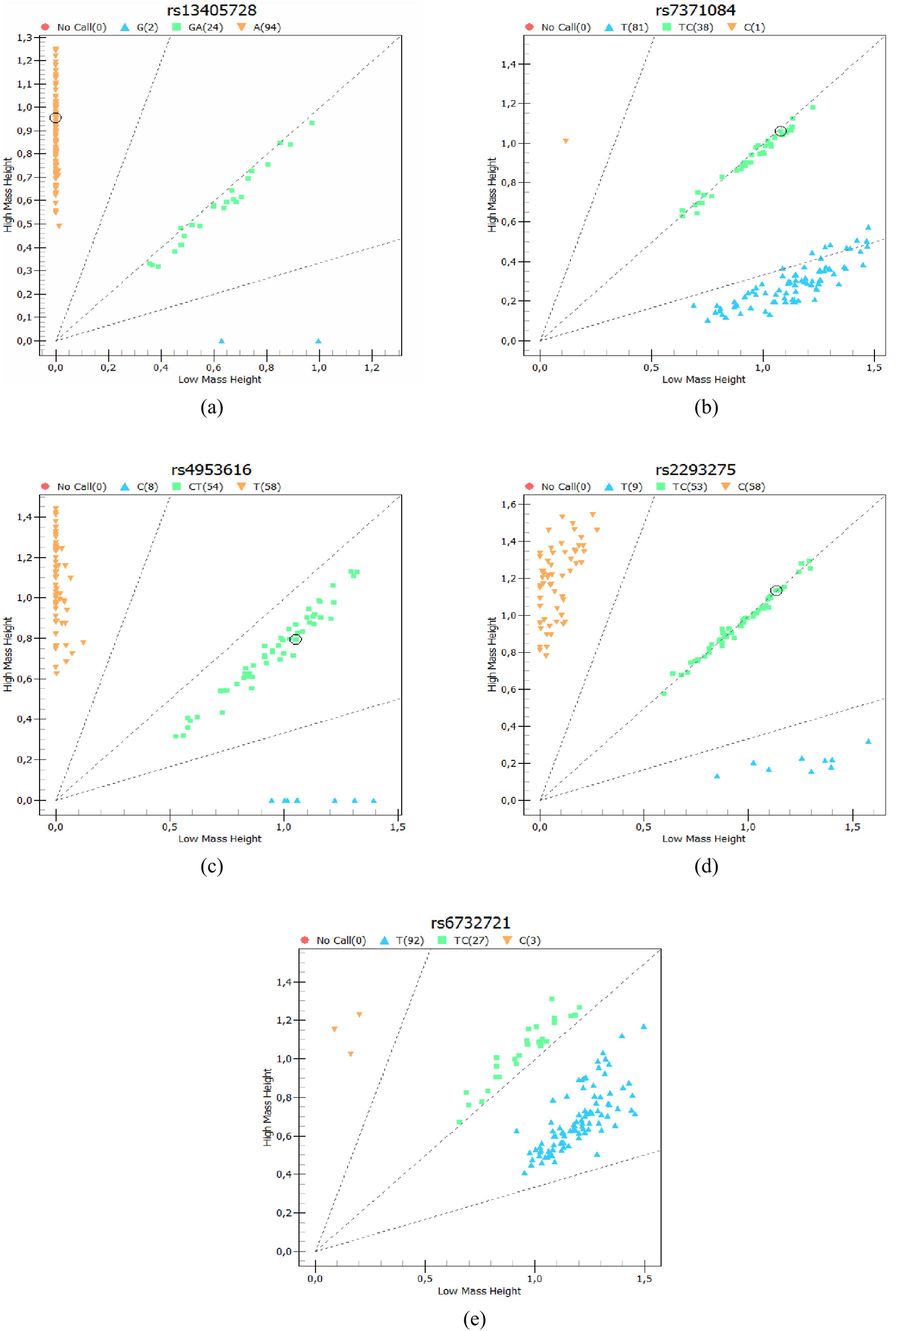
Cluster analysis. Genotypes were clustered for all women included in the study (n = 98) in (a) rs13405728; (b) rs7371084; (c) rs4953616; (d) rs22932758; (e) rs6732721.
The variants rs13405728, rs7371084, and rs6732721, in PCOS and the control groups, presented a greater number of individuals with wild-type homozygous genotypes (AA, TT, TT, respectively). No participant in the control group had the polymorphic homozygous genotype CC of rs7371084. Although in rs4953616 the control group presented a greater number of wild-type homozygous genotypes TT (51%), in the PCOS group the frequency of heterozygous CT carrying risk allele C was higher (47%). The variant rs2293275 presented a greater number of heterozygous TC in both groups (47% in cases and 49% in controls), the highest number of women with PCOS with the polymorphic homozygous genotype TT (12%) was found in this polymorphism with respect to the others evaluated (Table 3).
Fig. 1Cluster analysis. Genotypes were clustered for all women included in the study (n = 98) in (a) rs13405728; (b) rs7371084; (c) rs4953616; (d) rs22932758; (e) rs6732721. The association analysis between LHCGR SNPs and PCOS under multiple models of inheritance, allowed us to identify that rs7371084 was associated with the syndrome under the codominant (OR: 0.36 CI: 0.15–0.90, p = 0.038), dominant (OR: 0.40 CI: 0.16–0.98, p = 0.04) and overdominant models (OR: 0.35 CI: 0.14–0.87, p = 0.021) (Table 4). No significance was observed for the other SNPs analyzed. Abbreviations: OR (CI 95%): Odds ratio and 95% confidence intervals; AIC: Akaike Information Criteria. Bold values denote statistical significance at the p < 0.05 level.
Variant
Model
Genotype
PCOS frequency
(n = 49)Control frequency
(n = 49)OR (95% CI)
P- value
AIC
rs13405728
Codominant
AA
40 (0.82)
36 (0.74)
Reference
0.55
141.1
GA
8 (0.16)
12 (0.24)
0.57 (0.20–1.60)
GG
1 (0.02)
1 (0.02)
0.62 (0.03–12.74)
Dominant
AA
40 (0.82)
36 (0.74)
Reference
0.27
139.1
GA + GG
9 (0.18)
13 (0.26)
0.57 (0.21–1.56)
Recessive
AA + GA
48 (0.98)
48 (0.98)
Reference
0.84
140.2
GG
1 (0.02)
1 (0.02)
0.74 (0.04–14.79)
Overdominant
AA + GG
41 (0.84)
37 (0.76)
Reference
0.29
139.2
GA
8 (0.16)
12 (0.24)
0.58 (0.21–1.61)
Additive
0.63 (0.26–1.53)
0.3
139.2
rs7371084
Codominant
TT
37 (0.76)
28 (0.57)
Reference
0.038
135.7
TC
11 (0.22)
21 (0.43)
0.36 (0.15–0.90)
CC
1 (0.02)
0
NC
Dominant
TT
37 (0.76)
28 (0.57)
Reference
0.04
136.1
TC + CC
12 (0.24)
21 (0.43)
0.40 (0.16–0.98)
Recessive
TT + TC
48 (0.98)
49 (1)
Reference
0.21
138.7
CC
1 (0.02)
0
NC
Overdominant
TT + CC
38 (0.78)
28 (0.57)
Reference
0.021
134.9
TC
11 (0.22)
21 (0.43)
0.35 (0.14–0.87)
Additive
0.48 (0.20–1.12)
0.085
137.3
rs4953616
Codominant
TT
22 (0.45)
25 (0.51)
Reference
0.95
142.2
CT
23 (0.47)
21 (0.43)
1.13 (0.48–2.62)
CC
4 (0.08)
3 (0.06)
0.95 (0.16–5.53)
Dominant
TT
22 (0.45)
25 (0.51)
Reference
0.81
140.2
CT + CC
27 (0.55)
24 (0.49)
1.11 (0.49–2.52)
Recessive
TT + CT
45 (0.92)
46 (0.94)
Reference
0.89
140.2
CC
4 (0.08)
3 (0.06)
0.88 (0.16–4.84)
Overdominant
TT + CC
26 (0.53)
28 (0.57)
Reference
0.76
140.2
CT
23 (0.47)
21 (0.43)
1.13 (0.50–2.56)
Additive
1.05 (0.53–2.09)
0.89
140.2
rs2293275
Codominant
CC
20 (0.41)
23 (0.47)
Reference
0.22
139.3
TC
23 (0.47)
24 (0.49)
0.97 (0.41–2.29)
TT
6 (0.12)
2 (0.04)
3.97 (0.69–22.65)
Dominant
CC
20 (0.41)
23 (0.47)
Reference
0.67
140.1
TC + TT
29 (0.59)
26 (0.53)
1.19 (0.53–2.70)
Recessive
CC + TC
43 (0.88)
47 (0.96)
Reference
0.084
137.3
TT
6 (0.12)
2 (0.04)
4.02 (0.74–21.85)
Overdominant
CC + TT
26 (0.53)
25 (0.51)
Reference
0.61
140
TC
23 (0.47)
24 (0.49)
0.81 (0.35–1.83)
Additive
1.42 (0.74–2.72)
0.28
139.1
rs6732721
Codominant
TT
38 (0.78)
35 (0.71)
Reference
0.6
141.2
TC
10 (0.20)
12 (0.25)
0.78 (0.29–2.07)
CC
1 (0.02)
2 (0.04)
0.31 (0.02–4.07)
Dominant
TT
38 (0.78)
35 (0.71)
Reference
0.47
139.7
TC + CC
11 (0.22)
14 (0.29)
0.71 (0.28–1.81)
Recessive
TT + TC
48 (0.98)
47 (0.96)
Reference
0.38
139.5
CC
1 (0.02)
2 (0.04)
0.33 (0.03–4.30)
Overdominant
TT + CC
39 (0.80)
37 (0.76)
Reference
0.68
140.1
TC
10 (0.20)
12 (0.24)
0.82 (0.31–2.15)
Additive
0.69 (0.31–1.54)
0.36
139.4
3.3 Association between the genotypes and clinical-endocrine-metabolic parameters in PCOS women
Table 5 shows the significant associations identified in the genotype-phenotype analysis. Supplementary Tables 4, 5, 6, 7 and 8 show all the association analyzes for each variant according to the best inheritance model identified by the AIC. Using the dominant model in rs13405728, it was identified that the wild-type homozygous genotype AA was associated with an increase in LH levels (7.15 vs 5 mUl/ml, p = 0.013), and LH/FSH ratio (1.39 vs 0.85, p = 0.014). Furthermore, this genotype was associated with low levels of fasting blood glucose compared to the GA + GG genotype (82.56 vs 89.46 mg/dL, p = 0.028). Abbreviations: LH: Luteinizing hormone; FSH: Follicle-stimulating hormone; AMH: Anti-Mullerian hormone; AFC: Antral follicular count. Bold values denote statistical significance at the p < 0.05 level.
Variant
Best inheritance model
Endocrine-metabolic parameter
Genotypes
P-value
AA
GA + GG
rs13405728
Dominant
LH (mUl/ml)
7.15 (4.79–11.47)
5 (1.98–5.56)
0.013
LH/FSH ratio
1.39 (1.03–1.78)
0.85 (0.37–1.20)
0.014
Fasting blood glucose (mg/dL)
82.56 ± 8.44
89.46 ± 7.03
0.028
rs7371084
Overdominant
TT + CC
TC
LH (mUl/ml)
7.15 (5.3–10.65)
3.32 (1–6.93)
0.02
rs4953616
Overdominant
TT + CC
CT
AMH (ng/ml)
6.75 (4.78–9.06)
12 (5.15–16.2)
0.03
Total ovarian volume (cm3)
14.98 (11.68–22.76)
11.1 (8.11–15.67)
0.026
TT
CT
CC
rs6732721
Additive
Fasting blood glucose (mg/dL)
82.27 ± 8.46
88.92 ± 7.17
92
P TT and CT: 0.028
Total AFC (number of follicles)
30 (23.75–35.25)
25 (17–28)
14
P TT and CT: 0.031
In SNP rs7371084, according to the overdominant model, an increase in LH levels was observed in the TT + CC genotype compared to the TC genotype (7.15 vs 3.32 mUl/ml, p = 0.02). Similarly, according to the overdominant model in rs4953616, it was observed that the CT genotype presented increased levels of AMH (12 vs 6.75 ng/ml, p = 0.03) and the TT + CC genotype presented an increase in the total ovarian volume (14.98 vs 11.1 cm3, p = 0.026). Finally, following the additive model in rs6732721, it was observed that the CT genotype presented increased levels of fasting blood glucose compared to the wild-type homozygous genotype TT (88.92 vs 82.27 mg/dL, p = 0.028), and the TT genotype presented a greater number of CFA compared to CT genotype (30 vs 25 follicles, p = 0.031) (Table 5). No association was observed in rs2293275 (Supplementary Table 7).
3.4 Linkage disequilibrium and haplotype analysis
Haploview analysis demonstrated a complete LD (D’=1) among SNPs rs7371084-rs4953616 and rs6732721-rs13405728. Two blocks were constructed: block 1 spanned 1 kb and included the SNPs rs7371084 and rs4953616, while block 2 spanned 12 kb and included the SNPs rs6732721 and rs13405728 (Fig. 2).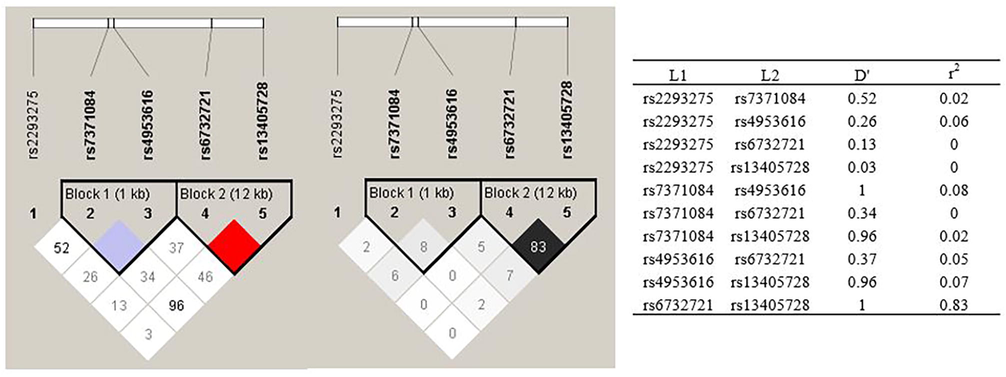
Linkage disequilibrium (LD) map and haplotype block map for all the SNPs of the LHCGR gene. The LHCGR SNPs were genotyped by Haploview.
The frequencies of the haplotypes in cases and controls are shown in Table 6. No significant differences were observed in the distribution of haplotypes between groups. However, it was observed that in block 1 there was a higher frequency of the TT haplotype (53.1%), and in block 2 a higher frequency of the TA haplotype (85.7%). Both haplotypes correspond to combinations that do not include the MAF.
Haplotypea
Global frequency
PCOS frequency
Control frequency
χ2b
P-value
Block 1c
TT
0.531
0.551
0.51
0.328
0.567
TC
0.296
0.316
0.276
0.392
0.5314
CT
0.173
0.133
0.214
2.277
0.1313
Block 2d
TA
0.857
0.878
0.837
0.667
0.4142
CG
0.122
0.102
0.143
0.76
0.3834
CA
0.02
0.02
0.02
0
1
4 Discussion
In the present pilot study, we evaluated the association between LHCGR gene polymorphisms and PCOS in a sample of Colombian women. It has been observed that during the differentiation of the granulosa cells, the expression of the LHCGR gene allows a response of the pre-ovulatory follicle to increase in LH in the middle of the cycle. As a consequence, ovulation and release of the mature oocyte occur (Saadia, 2020). However, in women with PCOS, the presence of identified LHCGR variants has been associated with LH hypersecretion, ovarian enlargement, oligomenorrhea, androgen excess, and infertility (Robeva et al., 2018). Therefore, multiple studies have sought to evaluate associations between SNPs in the LHCGR gene and the risk of PCOS, as well as the phenotype-genotype relationship. The results of the PCOS risk assessment have been contradictory and are closely related to the population studied, while the results of the associations with phenotypic traits show less heterogeneity (Louwers et al., 2013).
Our results showed that the rs7371084 variant was negatively associated with PCOS under the codominant, dominant, and overdominant models. A negative association between rs7371084 and PCOS was also described in the Arab population (p = 0.023, OR 0.44, 95% IC: 0.24–0.80) (Almawi et al., 2015). In the other SNPs, no significant associations with PCOS were observed. Similar results were found in rs4539842 (p = 0.79) in Egyptian women (El-Shal et al., 2016), rs2293275 (p = 1), rs4597581 (p = 0.89), rs13405728 (p = 0.51), rs4073366 (p = 0.29) in Arabian women (Almawi et al., 2015), rs12470652 (p = 1), rs2293275 (p = 0.491) in Bulgarian women (Robeva et al., 2018), and rs13405728 (p = 0.34, OR 1.15, 95% IC: 0.86–1.52) in women of European descent (Welt et al., 2012).
Association analysis between the clinical and endocrine-metabolic characteristics and the genotypes of the variants in the PCOS group, using the best inheritance model for each one, allowed us to identify that an increase in LH levels in women with the wild-type AA genotype of rs13405728, and women with the TT + CC genotypes of rs7371084. Women with AA genotype in rs13405728 also had a higher LH / FSH ratio. Similarly, Thathapudi et al (Thathapudi et al., 2015), identified that the wild-type genotype GG in rs2293275 in the PCOS group presented increased LH values and increased LH/FSH ratio. It has been established that reproductive abnormalities in women with PCOS are the result of increased LH levels. In addition to having higher basal LH levels, women with PCOS have a greater number of LH pulses, which increases LH levels (Coutinho and Kauffman, 2019). This contributes to the synthesis of androgens and estrogens by theca cells, which in turn triggers hyperandrogenism in PCOS. Likewise, an abnormal increase in the LH / FSH ratio, which in women with PCOS is generally between 2 and 3, alters steroid hormone production (Saadia, 2020). Future functional studies are needed to assess which genotypes are crucial to determine the potential causal effect on LH levels in patients with PCOS.
The GA + GG and CC genotypes in rs13405728 and rs6732721, respectively, showed the highest levels of fasting blood glucose, although the values are within the normal ranges. This can be attributed to the MAF (G and C) in these variants. Elevated fasting blood glucose levels contribute to the risk of developing prediabetes, which could later become type 2 diabetes, a pathology associated with PCOS (Javed et al., 2016). However, more in-depth studies are required to confirm this claim.
An increase in AMH levels in women with the CT genotype in rs4953616 was observed. The increase in AMH levels in women with PCOS compared to healthy women is due to alterations in folliculogenesis, which results in the accumulation of small antral and pre-antral follicles ≤ 4 mm (Woo et al., 2012). Once the follicles reach 8 mm, the expression of AMH decreases significantly. Women with PCOS have a greater number of small follicles, as a result, the levels of AMH are increased in this group (Crespo et al., 2018). Therefore, the presence of the CT genotype in rs4953616 could be associated with the polycystic ovarian phenotype in women with PCOS. Although variants in LHCGR may play a relevant functional role in androgen synthesis, it is also likely that hormonal regulation is modulated at different levels, hence, research is required in a multigenic and multifactorial context (Capalbo et al., 2012).
Haploview analysis allowed us to identified a complete LD (D’=1) and low recombination (r2 = 0.08) among rs7371084-rs4953616, and a complete LD and strong recombination (r2 = 0.83) among rs6732721-rs13405728. In a dataset of 188 Colombian subjects from Medellin obtained from https://ldlink.nci.nih.gov/, were reported a D'=1 and r2 = 0.097 for rs7371084-rs4953616, and a D’=0.939 and r2 = 0.591 for rs6732721-rs13405728 (Supplementary Fig. 1), values that agree with those obtained in this study. We did not find differences in the distribution of haplotypes between cases and controls. Similar results in the LHCGR gene were found by Almawi et al (Almawi et al., 2015), who evaluated the haplotypes of the SNPs rs2293275, rs7371084, rs4953616, rs4597581, rs13405728, and rs4073366, and found no significant differences between both groups.
The findings of this study suggest that the presence of LHCGR variants contributes to the risk of exhibiting several of the pathophysiological characteristics of PCOS. Our results are consistent with the increase in ovarian androgen production in response to LH hypersecretion, which is crucial in the development of anovulation, dyslipidemia, and hyperinsulinemia in women with PCOS (Jones et al., 2015; Lerchbaum et al., 2011).
According to Ossa et al 2016 (Ossa et al., 2016), in Colombia, there is a stratified population from Native and non-Native populations living in its 5 continental regions: Andes, Caribe, Amazonia, Orinoquia, and Pacific regions. The ancestry of the Colombian population comprises a large number of well-differentiated Native communities belonging to diverse linguistic groups. Their gene pool results from the admixture of Native Americans, Europeans, and Africans. Therefore, future studies are necessary to compare the behavior of the PCOS genetic variants between this population regarding other world populations and other ethnic groups within the Colombian population.
It is worth mentioning that, within the limitations of our pilot study are the inclusion of women in treatment, which is a confounding factor for the endocrine-metabolic profile and the small sample size that reduces the statistical power. Therefore, the identified associations cannot be considered definitive, although they can provide preliminary results for future population research with larger sample size, with adequate power. Future population research with a homogeneous cohort without therapy for PCOS is recommended.
5 Conclusion
This pilot study showed that the rs7371084 variant was negatively associated with PCOS under the codominant, dominant, and overdominant models. It is worth mentioning that using the dominant model of inheritance, combined genotype variants of the LHCGR gene influence decreased LH secretion, menstrual dysfunction with shorter menstrual cycles and fewer follicles; excess androgens with increased levels of DHEAS and androstenedione; and impaired glucose metabolism with an increase in fasting glucose levels. With these results, we suggest that variants of the LHCGR gene plays an important role in the pathogenesis of PCOS. We hope to validate our results with population researches with an adequate statistical power to detect associations for polygenic conditions such as PCOS.
6 Disclosure of funding
This research was funded through an inter-institutional cooperation between the Universidad Pedagógica y Tecnológica de Colombia and Universidad de Boyacá (SGI code 2386 - VIE 05 of 2018; SGI code 2677 - VIE 06 of 2019).
CRediT authorship contribution statement
María Camila Alarcón-Granados: Methodology, Formal analysis, Investigation, Resources, Data curation, Writing – original draft, Visualization. Harold Moreno-Ortíz: Methodology, Investigation, Resources, Data curation, Visualization. Milena Rondón-Lagos: Methodology, Investigation, Resources, Visualization. Gloria Eugenia Camargo-Villalba: Conceptualization, Methodology, Investigation, Resources, Visualization, Supervision, Project administration, Funding acquisition. Maribel Forero-Castro: Conceptualization, Methodology, Formal analysis, Investigation, Resources, Data curation, Writing – review & editing, Visualization, Supervision, Project administration, Funding acquisition.
Acknowledgements
This work was supported by research projects SGI 2386 and SGI 2677 made in agreement between the Research Group in Biomedical Sciences of the UPTC (GICBUPTC) from Universidad Pedagógica y Tecnológica de Colombia and the Group of Public Health Research (HYGEA) from Universidad de Boyacá. The genotyping service was carried out at CEGEN-PRB3-ISCIII; it is supported by grant PT17/0019, of the PE I + D + i 2013-2016, funded by ISCIII and ERDF. We appreciate the advice on the management of the Haploview software provided by Luis Antonio Corchete Sánchez from thw Biology Faculty of Salamanca University (Spain). We would like to thank Ph.D. Ignacio Briceño Balcazar of the Sabana University of Colombia, for his academic concept about LD analysis.
Declaration of Competing Interest
The authors declare that they have no known competing financial interests or personal relationships that could have appeared to influence the work reported in this paper.
References
- Assessment of THADA gene polymorphisms in a sample of Colombian women with polycystic ovary syndrome: A pilot study. Heliyon. 2022;8(6)
- [CrossRef] [Google Scholar]
- Leutinizing hormone/choriogonadotropin receptor and follicle stimulating hormone receptor gene variants in polycystic ovary syndrome. J. Assisted Reprod. Genet.. 2015;32(4):607-614.
- [Google Scholar]
- Haploview: Analysis and visualization of LD and haplotype maps. Bioinformatics. 2005;21:263-265.
- [CrossRef] [Google Scholar]
- The prevalence and phenotypic features of polycystic ovary syndrome: A systematic review and meta-Analysis. Hum. Reprod.. 2016;31:2841-2855.
- [CrossRef] [Google Scholar]
- Identification of selected genetic polymorphisms in polycystic ovary syndrome in Sri Lankan women using low cost genotyping techniques. PLoS ONE. 2018;13(12):e0209830.
- [Google Scholar]
- In depth analysis of the association of FTO SNP (rs9939609) with the expression of classical phenotype of PCOS: A Sri Lankan study. BMC Med. Genet.. 2020;21:1-9.
- [CrossRef] [Google Scholar]
- Basic infertility including polycystic ovary syndrome. Med. Clin. North Am.. 2008;92:1163-1192.
- [CrossRef] [Google Scholar]
- The 312N variant of the luteinizing hormone/choriogonadotropin receptor gene (LHCGR) confers up to 2.7-fold increased risk of polycystic ovary syndrome in a Sardinian population. Clin. Endocrinol.. 2012;77:113-119.
- [CrossRef] [Google Scholar]
- The role of the brain in the pathogenesis and physiology of polycystic ovary syndrome (PCOS) Med. Sci.. 2019;7:84.
- [CrossRef] [Google Scholar]
- An update of genetic basis of PCOS pathogenesis. Arch. Endocrinol. Metab.. 2018;62:352-361.
- [Google Scholar]
- Genotype-phenotype correlations of PCOS susceptibility SNPs identified by GWAS in a large cohort of Han Chinese women. Hum. Reprod.. 2013;28(2):538-544.
- [Google Scholar]
- Methods for the selection of tagging SNPs: A comparison of tagging efficiency and performance. Eur. J. Hum. Genet.. 2007;15:228-236.
- [CrossRef] [Google Scholar]
- Statistical Genomic Approach Identifies Association between FSHR Polymorphisms and Polycystic Ovary Morphology in Women with Polycystic Ovary Syndrome. Biomed Res. Int.. 2015;2015:1-7.
- [Google Scholar]
- Association between genes encoding components of the Leutinizing hormone/Luteinizing hormone-choriogonadotrophin receptor pathway and polycystic ovary syndrome in Egyptian women. IUBMB Life. 2016;68(1):23-36.
- [Google Scholar]
- Revised 2003 consensus on diagnostic criteria and long-term health risks related to polycystic ovary syndrome. Fertil. Steril.. 2004;81:19-25.
- [CrossRef] [Google Scholar]
- SNP genotyping using the sequenom massARRAY iPLEX Platform. Curr. Protoc. Human Genet.. 2009;60(1)
- [CrossRef] [Google Scholar]
- Association study between polycystic ovarian syndrome and the susceptibility genes polymorphisms in Hui Chinese women. PLoS ONE. 2015;10(5):e0126505.
- [Google Scholar]
- The Genetics of Polycystic Ovary Syndrome: An Overview of Candidate Gene Systematic Reviews and Genome-Wide Association Studies. J. Clin. Med.. 2019;8:1606.
- [CrossRef] [Google Scholar]
- Fasting Glucose Changes in Adolescents with Polycystic Ovary Syndrome Compared To Obese Controls: A Retrospective Cohort Study Asma. J. Pediatr. Adolesc. Gynecol.. 2016;139–148
- [CrossRef] [Google Scholar]
- Systems Genetics Reveals the Functional Context of PCOS Loci and Identifies Genetic and Molecular Mechanisms of Disease Heterogeneity. PLoS Genet.. 2015;11(8):e1005455.
- [Google Scholar]
- Luteinizing hormone/chorionic gonadotrophin receptor overexpressed in granulosa cells from polycystic ovary syndrome ovaries is functionally active. Reproductive BioMedicine Online. 2016;32(6):635-641.
- [Google Scholar]
- Susceptibility loci for polycystic ovary syndrome on chromosome 2p16.3, 2p21, and 9q33.3 in a cohort of Caucasian women. Horm. Metab. Res.. 2011;43(11):743-747.
- [Google Scholar]
- Cross-Ethnic meta-Analysis of genetic variants for polycystic ovary syndrome. J. Clin. Endocrinol. Metab. 2013
- [Google Scholar]
- Oeth, P., Beaulieu, M., Park, C., Kosman, D., Mistro, G., Boom, D. Van Den, Jurinke, C., 2005. iPLEXTM Assay: Increased Plexing Efficiency and Flexibility for MassARRAY, System Through Single Base Primer Extension with Mass-Modified Terminators 1 1–12.
- Outlining the ancestry landscape of colombian admixed populations. PLoS One. 2016;11(10)
- [CrossRef] [Google Scholar]
- LHCG receptor polymorphisms in PCOS patients. Biotechnol. Biotechnol. Equip.. 2018;32(2):427-432.
- [Google Scholar]
- Follicle Stimulating Hormone (LH: FSH) Ratio in Polycystic Ovary Syndrome (PCOS) - Obese vs. Non- Obese Women. Med. Archiv. (Sarajevo, Bosnia and Herzegovina). 2020;74:289-293.
- [CrossRef] [Google Scholar]
- Storm, N., Darnhofer-patel, B., Boom, D. Van Den, Rodi, C.P., 2003. MALDI-TOF Mass Spectrometry-Based SNP Genotyping, Single Nucleotide Polymorphisms: Methods and Protocols.
- Polycystic ovary syndrome: A complex condition with psychological, reproductive and metabolic manifestations that impacts on health across the lifespan. BMC Medicine. 2010;8(1)
- [CrossRef] [Google Scholar]
- Association of Luteinizing Hormone Chorionic Gonadotropin Receptor Gene Polymorphism (rs2293275) with Polycystic Ovarian Syndrome. Genet. Test. Mol. Biomarkers. 2015;19(3):128-132.
- [Google Scholar]
- Pooled genetic analysis identifies variants that confer enhanced susceptibility to PCOS in Indian ethnicity. Gene. 2020;752:144760
- [CrossRef] [Google Scholar]
- Variants in DENND1A are associated with polycystic ovary syndrome in women of European ancestry. J. Clin. Endocrinol. Metab.. 2012;97:1342-1347.
- [CrossRef] [Google Scholar]
- Differences of the association of anti-Müllerian hormone with clinical or biochemical characteristics between women with and without polycystic ovary syndrome. Endocr. J.. 2012;59:781-790.
- [CrossRef] [Google Scholar]
- Association of Rs13405728, Rs12478601, and Rs2479106 single nucleotide polymorphisms and in vitro fertilization and embryo transfer efficacy in patients with polycystic ovarian syndrome: A case control genome-wide association study. Kaohsiung J. Med. Sci.. 2019;35:49-55.
- [CrossRef] [Google Scholar]
- Oncology and pharmacogenomics insights in polycystic ovary syndrome: an integrative analysis. Front. Endocrinol.. 2020;11:585130
- [CrossRef] [Google Scholar]
- Association study between variants in LHCGR DENND1A and THADA with preeclampsia risk in Han Chinese populations. J. Maternal-Fetal Neonatal Med.. 2018;32(22):3801-3805.
- [Google Scholar]
- Genetic association studies in female reproduction: From candidate-gene approaches to genome-wide mapping. Mol. Hum. Reprod.. 2013;19:644-654.
- [CrossRef] [Google Scholar]
Appendix A
Supplementary data
Supplementary data to this article can be found online at https://doi.org/10.1016/j.jksus.2022.102202.
Appendix A
Supplementary data
The following are the Supplementary data to this article:


