Translate this page into:
Blood volume and structural imaging as an early indicator for photodynamic response
⁎Corresponding author. ahchaudhry@ksu.edu.sa (Atif Hanif)
-
Received: ,
Accepted: ,
This article was originally published by Elsevier and was migrated to Scientific Scholar after the change of Publisher.
Peer review under responsibility of King Saud University.
Abstract
This study aims to discuss blood volume (BV), total hemoglobin concentration quantification, and ultrasound signal variations for their correlation with photodynamic therapy-induced modifications in the tumor and possibly with tumor response. The images were interpreted in the frequency domain by applying a two-dimensional fast Fourier transform to the spatial domain images. The experimental results from animals treated with verteporfin showed a significant reduction in BV.
Keywords
Blood volume
Total hemoglobin concentration
Ultrasound
Fast Fourier transform
Verteporfin
1 Introduction
Photodynamic therapy (PDT), or the light-controlled generation of reactive oxygen species (ROS), has been approved for some malignancies (Agostinis et al., 2011), including skin, bladder, prostate, cervix, and glioma, in various jurisdictions. PDT uses a photosensitizer (PS) to generate cytotoxic radicals or ROS upon light absorption, resulting in apoptosis or coagulative necrosis of the target tissue or both. Cell death is promoted by either vascular shutdown, which causes deprivation of oxygen and nutrients, or by direct cell kill. The former is known as vascular-mediated PDT. Light activation is provided shortly after intravenous administration of the PS, whereas the latter relies on preferential PS accumulation or retention in highly proliferating tissues, such as malignancies (Guo et al., 2020; Laufer et al., 2012; Leff et al., 2008), or both.
PDT is a minimally invasive therapy (MIT), often applied as a single outpatient therapy with minimal reported morbidity (Brown et al., 2004). It has a huge potential to improve the quality of life of cancer patients. PDT can augment or replace standard oncological treatments while providing higher tumor selectivity, for example, in the proximity of eloquent brain structures or vasculature. Light can penetrate 1–2 cm into the tissue at therapeutic intensities depending on the wavelength. Therefore, light source proximal micrometastases can also be targeted, which may not be reached by a surgeon (Mallidi et al., 2015; Maslov et al., 2008; Sethuraman et al., 2008; Standish et al., 2007; Yang et al., 2009; Yu et al., 2005; Atif et al., 2016, 2021).
PDT efficacy is governed by the spatial–temporal overlap of PS, molecular oxygen in its triplet ground state, 3O2, and the photon to provide the reaction energy to produce 1O2. Hence, prediction of the treatment outcome depends on the knowledge of the spatial PS and 3O2 concentrations, whereas the overall treatment efficacy is modulated by controlling the local photon density or fluence rate, H [J cm−2]. This study aims to develop a standardized PDT treatment module by quantifying the photon density distribution based on tissue optical properties and personalized clinical images for target volume definition, resulting in preferential source placements. However, the treatment response does not follow a fluence rate distribution. It is also subject to local PS and oxygen availability, which depends on the patent vasculature throughout the tumor volume. Hence, an adequate blood supply throughout the PDT target volume should be established during patient selection prior to administrating PS. Post-PDT patient management can be improved when tumor response prediction is feasible within 24–48 h of post-light exposure. Tumor response based on vascular changes was demonstrated for some vascular-acting PSs based on perfusion imaging 12 and 24 h after light exposure. Vasculature shutdown for cell-targeting PDT requires a more extended observation period because the vascular tree pruning due to reduced nutrient and oxygen demand requires significant time and it can be masked by possible regrowth. The proposed surrogate markers for the PDT response predictor focus on functional analysis of the tumor and surrounding vasculature of tissues pre- and post-PDT (Johansson et al., 2013; Kim et al., 2010a,b; Konecky et al., 2012; Nakajima et al., 2014; Wang and Hu, 2012).
PDT induces a change in the partial oxygen saturation (Hb-pO2), total hemoglobin concentration (HbT), and met-hemoglobin (met-heme) accumulation as indicators of hemorrhaging and vascular stasis, which can be imaged by photoacoustic imaging (PAI) (Akens et al., 2007; Fisher and Lilge, 2015; Jalali et al., 2014; Johansson et al., 2010; Kaspler et al., 2016).
Less attention has been given to the structural changes of the tissue, accessible by ultrasound (US); however, changes in the acoustic impedance post-PDT have been demonstrated.
This study aims to demonstrate that quantification of blood volume (BV), total HbT, and US signal changes can correlate with PDT-induced modifications in the tumor.
2 Materials and methods
2.1 Tumor models
Human PC3 prostate cancers (Lin et al., 2014; Liu et al., 2013) were grown as subcutaneous (SC) xenografts on both hind limbs of nude and balb/c mice, following induction of five million cells in 100 µL phosphate-buffered saline (PBS) into the SC fascia of anesthetized animals. Animals with 5–8-mm diameter tumors were anesthetized with isoflurane (5% induction and maintenance at 2.5% in O2) for PAI (PAI, VevoLazr, Visualsonic. Toronto, Canada). Structural US images and total hemoglobin (808 nm) and oxy/deoxyhemoglobin (750 and 850 nm, respectively) were collected from both tumors. Partial blood oxygen saturation (Hb-pO2) was calculated as the ratio of the oxyhemoglobin signal to the sum of the deoxy and oxyhemoglobin signals and presented as arbitrary values. BV is given by the ratio of the hemoglobin signal area to the total tumor area.
Imaging took 40–60 min depending on the tumor size and location in the hind limbs of the animals. Post-PAI, verteporfin, known as BPD-MA, was injected intravenously at 0.5 mg kg−1 (QLT, Canada), and PDT was initiated 3 h later by 690 nm irradiation. The diameter of the illumination spot was 15 mm, encompassing the entire tumor and surrounding normal tissue. The irradiance and radiant exposure were set to 200 mW cm−2 and 75 J cm−2, respectively. PAI was repeated at 4 and 24 h for treatment response prediction. Animals were euthanized following the final imaging session. The tumor was removed, fixed in 10% formalin, and paraffin-embedded for standard H&E-based histological assessment of tissue response to PDT.
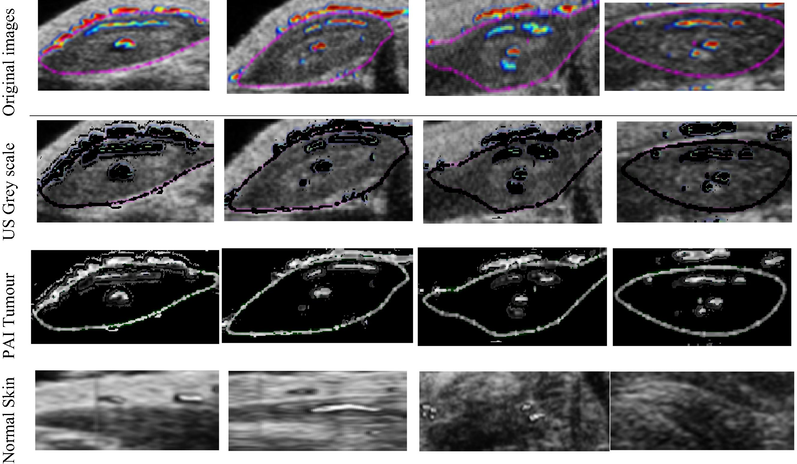
Image analysis was performed using MATLAB (version R2018a) on an IBM Thinkpad X230. The combination of US and PAI images was separated into a greyscale US anatomical image contribution. The color-coded PAI data pre-presented total hemoglobin absorption (see Table 1). Regions of interest (ROI) representing the tumor and normal tissue within and outside the PDT light irradiation field were selected for image analysis. We binned 256 intensities into 51 equal bins for spatial intensity domain histograms; moreover, intensities were normalized such that the sum of the histogram was equal to 1 to compensate for the different-sized ROIs. The same ROIs were utilized for the fast Fourier transform (FFT) using the FFT2 MATLAB command, converting the spatial domain image into a frequency domain image. Difference histograms for the spatial and frequency domain histograms were generated for the pre-PDT, post-PDT, and 4 h and 24 h post-PDT datasets. The FFT histogram vertical axis was converted to log scale, and the data were normalized for all the images shown in FFT.

3 Results and discussion
Visualsonic device provides PAI and US information about changes in the vascular volume, vascular function, and acoustic impedance post-PDT, and therefore both datasets can be used for analysis. The area inside the tumor and the normal overlying tissue change their properties from pre-PDT to 24 h in the time and frequency domains (Table 1).
The preliminary results for the PAI-determined vascular volume change pre-and post-PDT are summarized in Table 1. Pre-and post-PDT PAI images showed qualitatively close spatial correlations between Hb-pO2 and BV signal distributions. Both PAI datasets for excitation at 750 and 850 nm were collected with close temporal relationships. The optical properties of the tissue and BV were comparable. However, the light scattering coefficient was 20% lower for 850 nm excitation; therefore, the overall illuminated tissue volume remained the same.
Verteporfin-treated animals showed a substantial decrement in BV attributed to PDT-induced endothelial cell damage, followed by platelet adhesion and thrombus formation, resulting in vascular shutdown at short periods post-PDT. Hb-pO2 decreased because of the continuous O2 consumption of surviving tumor cells at this point.
Histograms of the spatial intensity distribution and variations thereof were prepared through frequency domain histograms to obtain a more quantitative interpretation of the results. The US-based data provided information about the absolute and variable acoustic impedances of tissues within the ROIs. The PAI-based data encoded information regarding the HB-pO2 distribution, its volume, and its spatial variation.
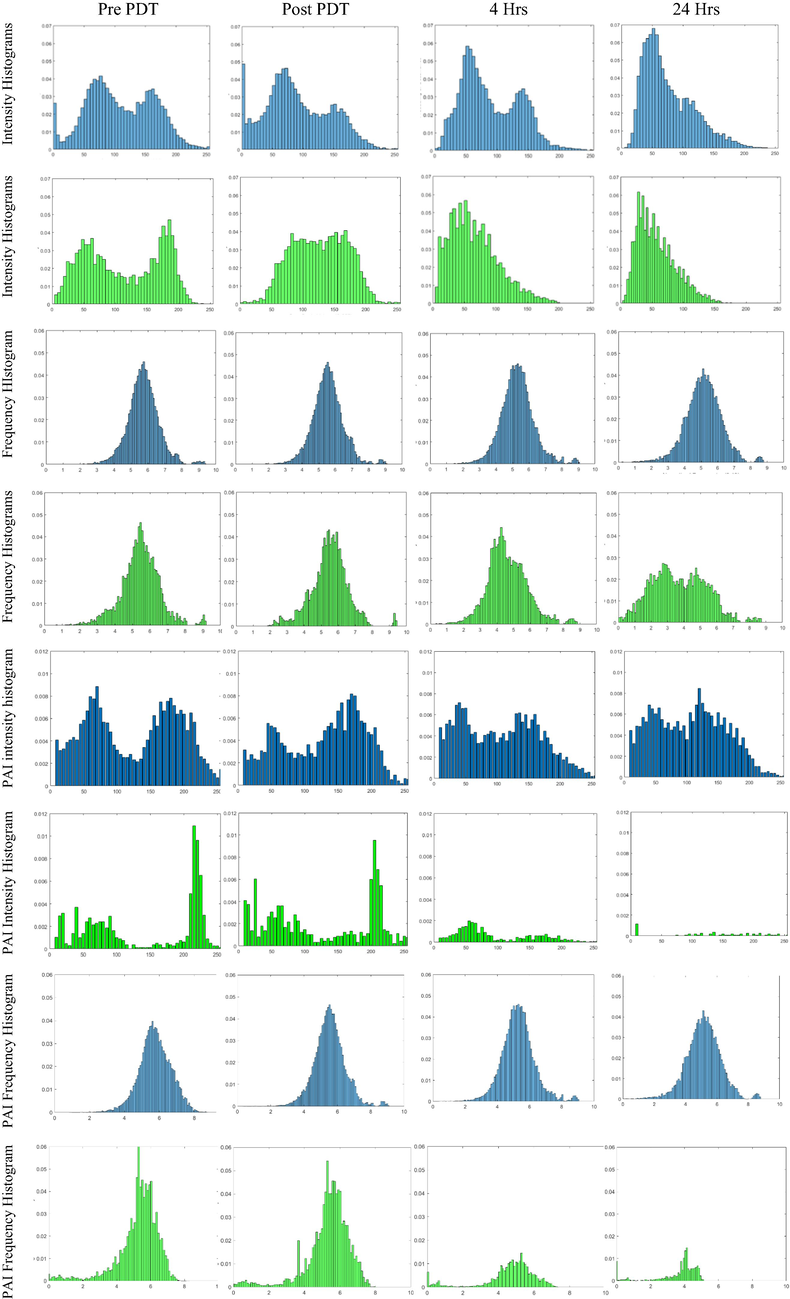
It is evident from rows 1 and 2 of Table 2 that the tumor and normal overlying skin within the PDT treatment field had a similar distribution of acoustic mismatches; however, their temporal evolution differed despite ending in comparable distributions after 24 h. Particularly, the loss of high US reflection signals, which encode significant acoustic impedance differences, given by connective tissue and cellular nuclei were lost at 24 h, possibly due to vacuolization; the change proceeded faster for the PDT-exposed normal tissue compared to the tumor. In particular, the US signal is much weaker for normal tissues than for tumors, suggesting a more advanced coagulative state.
The spatial distribution of the acoustic mismatch-causing structure was analyzed by applying two-dimensional FFT (Leng, 2022; Beibei et al., 2022) to spatial domain images. The histograms related to the frequency domain analysis peaked for tumor ROIs at slightly lower frequencies compared to the normal skin, indicating a more homogenous distribution of the acoustic mismatch-causing structures. The histogram peak frequency did not shift significantly for the tumor; however, the distribution broadened predominantly towards a higher frequency, which can be attributed to the generation of apoptotic bodies post-PDT (Banihashemi et al., 2008; Fisher et al., 2019, 2017). Conversely, the spatial frequency histogram for the normal tissue showed a clear shift towards lower frequencies starting at 4 h, indicating that the different tissue layers within the skin, epidermis, dermis, SC adipose tissue, and connective tissue become more homogenous.
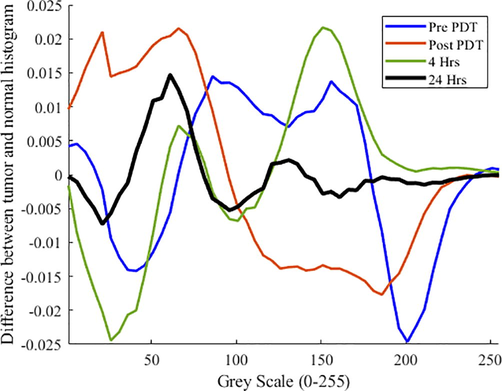
Fig. 1 shows the absolute sum of differences of the histograms for the tumor and outside the tumor region for Pre PDT to 24 h post-PDT. The sum of differences decreased from Pre PDT to 24 h post-PDT, confirming that PDT-exposed tumor and normal skin tissues express similar ultrastructural and vascularity attributes.
Histogram differences between tumor and normal skin ROIs, pre-photodynamic therapy (PDT) and up to 24 h.
PAI-derived Hb-pO2 intensity histograms for tumor and normal tissue showed a broad distribution with low and high intensities associated with the venous and arterial flows, respectively (see rows 5 and 6 of Table 2). An overall shift towards more deoxyhemoglobin for the tumor and the normal tissue, albeit much more substantial for the latter, combined with a general signal loss, was observed. The vascular shutdown in the normal skin was completed more dramatically than in the tumor (see row 6 of Table 2). This can be explained by the large feeder vessels for the tumor that had not reached flow stasis and continued to supply the malignancy with nutrients and some oxygen. This is also reflected in the frequency histogram (row 7 of Table 2), which remained primarily unchanged for the tumor ROI. The loss of PAI signal in PDT-exposed normal skin at 4 and 24 h post-PDT did not allow a detailed analysis of its Hb-pO2 spatial frequency behavior; however, the peak frequencies remained stable until at least 4 h post-PDT.
4 Conclusion
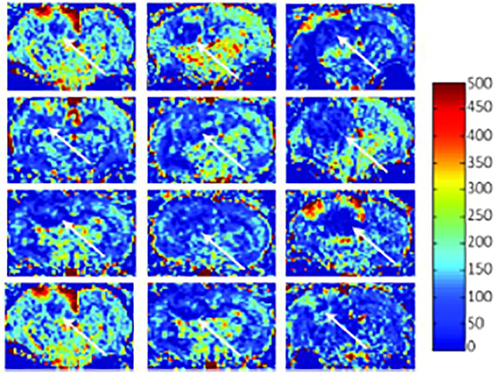
The results are preliminary and interesting. However, US and PAI imaging post-PDT has a high potential to inform early, within 24 h, about Chlorine e6-mediated PDT outcome. In the future, the US and PAI combined prediction of tumor response should be determined at Day 7 using this orthotopic tumor model to have a clinically valid endpoint. US and PAI signals should be monitored several days post-PDT. However, the US and PAI imaging depth may not be sufficient for the clinical translation of solid tumors; moreover, MRI-based BV (Fig. 2) for FAIR-derived BV images of a rat brain needs to be considered.
Representative blood flow maps of the PDT target volume central slice from multiple animals three days post 125 mg/kg ALA-PDT, color-coded on a scale of 0–500 ml/min/100 g tissue; Arrows mark out tumor location. Right tumor and cerebral blood flow measured by MRI post PDT.
Acknowledgement
This Project was funded by the National Plan for Science, Technology, and Innovation (MAARIFAH), King Abdulaziz City for Science and Technology, Kingdom of Saudi Arabia, Award Number (2-17-01-001-0068).
Declaration of Competing Interest
The authors declare that they have no known competing financial interests or personal relationships that could have appeared to influence the work reported in this paper.
References
- Akens, M.K., Yee, A.J.M., Wilson, B.C., Burch, S., Johnson, C.L., Lilge, L., Bisland, S.K., 2007. Photodynamic therapy of vertebral metastases: Evaluating tumour-to-neural tissue uptake of BPD-MA and ALA-PpIX in a murine model of metastatic human breast carcinoma, Photochem. Photobiol. https://doi.org/10.1111/j.1751-1097.2007.00172.x.
- Atif, M., Zellweger, M., Arabia, S., Oxygen, S., 2016. Review of the role played by the photosensitizer ’ s photobleaching during photodynamic therapy 18, 338–350.
- Atif, M., Hanif, A., Alsalhi, M.S., Altamimi, H.A., Lilge, L., 2021. Associating vascular imaging with hypoxia and cell survival in vivo for Biophotonics applications. In: 2021 SBFoton International Optics and Photonics Conference: Keep on Shining, SBFoton IOPC 2021. https://doi.org/10.1109/SBFotonIOPC50774.2021.9461965.
- Ultrasound imaging of apoptosis in tumor response: Novel preclinical monitoring of photodynamic therapy effects. Cancer Res.. 2008;68(20):8590-8596.
- [Google Scholar]
- Ionic liquid exfoliated Ti3C2Tx MXene nanosheets for photoacoustic imaging and synergistic photothermal/chemotherapy of cancer. J. Mater. Chem. B. 2022;10(8):1226-1235.
- [Google Scholar]
- The present and future role of photodynamic therapy in cancer treatment. Lancet Oncol.. 2004;5(8):497-508.
- [Google Scholar]
- Liposomal lapatinib in combination with low-dose photodynamic therapy for the treatment of glioma. J. Clin. Med.. 2019;8(12):2214.
- [Google Scholar]
- Photodynamic therapy in the treatment of intracranial gliomas: A review of current practice and considerations for future clinical directions. J. Innov. Opt. Health Sci.. 2015;08(01):1530005.
- [Google Scholar]
- ALA-PpIX mediated photodynamic therapy of malignant gliomas augmented by hypothermia. PLoS One. 2017;12(7):e0181654.
- [Google Scholar]
- Jalali, S., Chung, C., Foltz, W., Burrell, K., Singh, S., Hill, R., Zadeh, G., 2014. MRI biomarkers identify the differential response of glioblastoma multiforme to anti-angiogenic therapy. Neuro. Oncol. https://doi.org/10.1093/neuonc/nou040.
- Protoporphyrin IX fluorescence and photobleaching during interstitial photodynamic therapy of malignant gliomas for early treatment prognosis. Lasers Surg. Med.. 2013;45(4):225-234.
- [Google Scholar]
- Interstitial photodynamic therapy of brain tumours. IEEE J. Sel. Top. Quantum Electron. 2010
- [CrossRef] [Google Scholar]
- A ruthenium(II) based photosensitizer and transferrin complexes enhance photo-physical properties, cell uptake, and photodynamic therapy safety and efficacy. Photochem. Photobiol. Sci. 2016
- [CrossRef] [Google Scholar]
- Quantification of in vivo fluorescence decoupled from the effects of tissue optical properties using fiber-optic spectroscopy measurements. J. Biomed. Opt. 2010
- [CrossRef] [Google Scholar]
- A fiberoptic reflectance probe with multiple source-collector separations to increase the dynamic range of derived tissue optical absorption and scattering coefficients. Opt. Express. 2010;18:5580.
- [Google Scholar]
- Spatial frequency domain tomography of protoporphyrin IX fluorescence in preclinical glioma models. J. Biomed. Opt.. 2012;17(5):056008.
- [CrossRef] [Google Scholar]
- In vivo preclinical photoacoustic imaging of tumour vasculature development and therapy. J. Biomed. Opt. 2012
- [CrossRef] [Google Scholar]
- Diffuse optical imaging of the healthy and diseased breast: A systematic review. Breast Cancer Res. Treat.. 2008;108(1):9-22.
- [CrossRef] [Google Scholar]
- Leng, X., 2022. Photoacoustic imaging of colorectal cancer and ovarian cancer.
- Nanoparticle-enabled, image-guided treatment planning of target specific RNAi therapeutics in an orthotopic prostate cancer model. Small. 2014;10:3072-3082.
- [CrossRef] [Google Scholar]
- Inherently multimodal nanoparticle-driven tracking and real-time delineation of orthotopic prostate tumours and micrometastases. ACS Nano 2013
- [CrossRef] [Google Scholar]
- Prediction of tumour recurrence and therapy monitoring using ultrasound-guided photoacoustic imaging. Theranostics 2015
- [CrossRef] [Google Scholar]
- Optical-resolution photoacoustic microscopy for in vivo imaging of single capillaries. Opt. Lett.. 2008;33:929.
- [Google Scholar]
- Orthotopic lung cancer murine model by nonoperative transbronchial approach. Ann. Thorac. Surg.. 2014;97(5):1771-1775.
- [CrossRef] [Google Scholar]
- Spectroscopic intravascular photoacoustic imaging to differentiate atherosclerotic plaques. Opt. Express. 2008;16(5):3362.
- [Google Scholar]
- Interstitial Doppler optical coherence tomography monitors microvascular changes during photodynamic therapy in a Dunning prostate model under varying treatment conditions. J. Biomed. Opt.doi. 2007;10
- [CrossRef] [Google Scholar]
- Photoacoustic tomography: In vivo imaging from organelles to organs. Science. 2012;335:1458-1462.
- [CrossRef] [Google Scholar]
- Noninvasive monitoring of murine tumour blood flow during and after photodynamic therapy provides early assessment of therapeutic efficacy. Clin. Cancer Res. 2005
- [CrossRef] [Google Scholar]


