

Translate this page into:
ONECUT2 regulates proliferation and apoptosis in glioblastoma cell lines
⁎Corresponding authors at: King Abdullah International Medical Research Center (KAIMRC), King Saud Bin Abdulaziz University for Health Sciences (KSAU-HS), Ministry of National Guard – Health Affairs, Saudi Arabia, P.O. Box 22490, Riyadh 11426. rfaeib@ksau-hs.edu.sa (Bahauddeen M. Alrfaei), alrfaeiba@ngha.med.sa (Mana Alshehri) alshehrima3@ngha.med.sa (Mana Alshehri)
-
Received: ,
Accepted: ,
This article was originally published by Elsevier and was migrated to Scientific Scholar after the change of Publisher.
Peer review under responsibility of King Saud University.
Abstract
Glioblastoma multiforme (GBM) is a highly aggressive brain tumor associated with a high mortality rate, with an average survival time of less than two years. GBM treatment faces significant challenges due to its infiltrative nature, genetic diversity, protection by the blood–brain barrier (BBB), drug resistance, and post-treatment side effects. Transcription factors (TFs) play a crucial role in regulating gene expression during cancer initiation and progression. This study aimed to investigate the impact of altering the function of ONECUT-2 (OC-2) in GBM cells, focusing on metabolic activity, proliferation, cell cycle, and apoptosis. To confirm the successful reduction of OC-2 expression in U251 and U87 cells compared to the control cells (wild types; WT), quantitative real-time polymerase chain reaction (qPCR) was performed. The downregulation of OC-2 resulted in a significant decrease in metabolic activity (MTT) of U251 cells by 47 % (P = 0.0056) and U87 cells by 36.4 % (P = 0.0003) compared to WT cells. In U251 cells, OC-2 downregulation caused cell cycle arrest in both the G0/G1 phase (13.6 %) and the S/G2 phase (52.52 %) compared to WT cells. Similarly, in U87 cells, downregulation of OC-2 led to cell cycle arrest in the G0/G1 phase (90.5 %) and the G2 phase (76.61 %) compared to WT cells. Furthermore, OC-2 downregulation significantly affected early-stage apoptosis in U251 cells (95.46 %, P = 0.0005) and U87 cells (19.64 %, P = 0.0004). Conversely, upregulation of OC-2 significantly increased the metabolic activity (MTT) of U251 cells by 94 % (P = 0.0067) and U87 cells by 58 % (P = 0.0028) compared to WT cells. These findings highlight the essential role of OC-2 in regulating the progression of GBM cells. Consequently, OC-2 represents a potential therapeutic target for inhibiting GBM. Overall, this study demonstrates that OC-2 plays a significant role in cell progression, suggesting its potential as a therapeutic target for GBM treatment.
Keywords
Transcriptional factor
ONECUT2
GBM
Brain
Cell cycle
Apoptosis

1 Introduction
Glioblastoma multiforme (GBM), or grade IV astrocytoma, is the most aggressive form of nervous system tumor. GBM is characterized by cytological atypia, anaplasia, mitotic division, microvascular proliferation and necrosis, with a generally poor prognosis (Kabel et al., 2018, Wu et al., 2021, Alswailem et al., 2022). GBM accounts for more than 50 % of all diagnosed malignant brain cancers and approximately 20 % of all primary intracranial tumors (Van Meir et al., 2010, Alrfaei et al., 2020). In the United States, the prevalence of GBM increases with age, with the highest rates occurring in individuals aged 75 to 84 years (Wu et al., 2021). Annually, approximately 15,000 new cases of GBM and central nervous system (CNS) malignancies are diagnosed (Alrfaei et al., 2020). Despite the highest level of care, the average patient survival time is less than two years (Kruchko et al., 2018, Alrfaei et al., 2020). In Saudi Arabia, there is an increased incidence of cancer, according to Saudi Cancer Registry (SCR) estimates, which reported 3 % of total cancer patients are brain cancer cases (Al-Rawaji et al., 2018, Moin et al., 2021).
Transcription factors belonging to the ONECUT (OCs) family play crucial roles in CNS development and have been extensively studied across various species, including zebrafish, sea urchins, ascidians, Drosophila species, frogs, and mice (Francius and Clotman, 2010, Espana and Clotman, 2012). These factors are involved in the regulation of neuronal differentiation in some of these organisms (Espana and Clotman, 2012). ONECUT2 (OC-2) is the second member of the OCs families (Lu et al., 2018, Yu et al., 2020), and it was initially identified by Jacquemin et al. in 1999 (Jacquemin et al., 1999, Choi et al., 2022). The OC-2 coding gene is located on chromosome 18 in humans and consists of two exons and one intron. The OC-2 protein binds to specific DNA sequences to stimulate the expression of target genes. It plays a regulatory role in cell proliferation, migration, and differentiation (Choi et al., 2022). In humans, OC-2 is predominantly expressed in the liver, gallbladder, duodenum, and small intestines, with lower expression levels in the brain, testes, stomach, and pancreas (Jacquemin et al., 1999, Yu et al., 2020). OC-2 has also been implicated in angiogenesis and epithelial-mesenchymal transition (EMT) (Sun et al., 2014, Lu et al., 2018, Zhang et al., 2018). Furthermore, OC-2 is involved in the regulation of pancreatic cell identity, retinal horizontal cells, and liver cell differentiation (Vanhorenbeeck et al., 2007, Francius and Clotman, 2010, Wu et al., 2012, Ma et al., 2019). (Sun et al., 2014, Zhang et al., 2018, Yu et al., 2020). Onecut2 is crucial for the proper neuronal formation of neurons. It has a key role in the formation of particular motor neurons and interneurons (Hodge et al., 2007, Thiebes et al., 2015, Kabayiza et al., 2017). Overexpression of OC-2 activates oncogenic pathway genes in neurons, influencing development, angiogenesis, extracellular matrix organization, as well as cell locomotion, migration, and proliferation. Conversely, downregulation of OC-2 primarily impacts genes associated with the inflammatory response and chemotaxis (Ma et al., 2019).
OC-2 is a significant player in cancer, as it is involved in various processes such as tumor cell proliferation, cancer cell manifestation, metastasis, tumorigenesis, angiogenesis, EMT, and potentially tumor stemness. There have been specific studies on OC-2′s involvement in bladder cancer, where it showed high specificity and sensitivity in an epigenetic analysis (Lu et al., 2018). Additionally, OC-2 plays critical roles in neuroendocrine prostate cancer (NEPC), metastatic castration-resistant prostate cancer, and ovarian cell adenocarcinoma (Vanhorenbeeck et al., 2007, Wu et al., 2012, Lu et al., 2018, Ma et al., 2019, Yu et al., 2020). In NEPC, OC-2 interacts with hypoxic conditions to inhibit androgen signaling and induce neuroendocrine plasticity. It also activates the SMAD3 gene, resulting in NEPCs exhibiting higher levels of hypoxia compared to prostate adenocarcinomas (Guo et al., 2019).
However, the specific role of OC-2 in the progression of glioblastoma (GBM) remains unclear. The OC-2 has not been studied in brain cancer even though it involves in many neural activities including malignancies. Therefore, the objective of this study was to explore the pathological relationship between OC-2 and the development of brain tumors, specifically GBM. To accomplish this objective, we conducted experiments to investigate whether OC-2 is implicated in the apoptosis and/or proliferation of human glioblastoma U251 and U87 cells.
2 Results
2.1 Efficiency of OC-2 transduction
U251 and U87 cells, which are derived from aggressive glioblastoma tumors, were modified by introducing OC-2 overexpression through the use of lentiviruses, as shown in Fig. 1. To estimate how effectively the cells were modified, the level of green fluorescent protein (GFP) expression in infected cells was assessed, and it was found to be approximately 99 %. The cells were viewed using an EVOS XL Core Imaging system. The selection was based on GFP positive cells.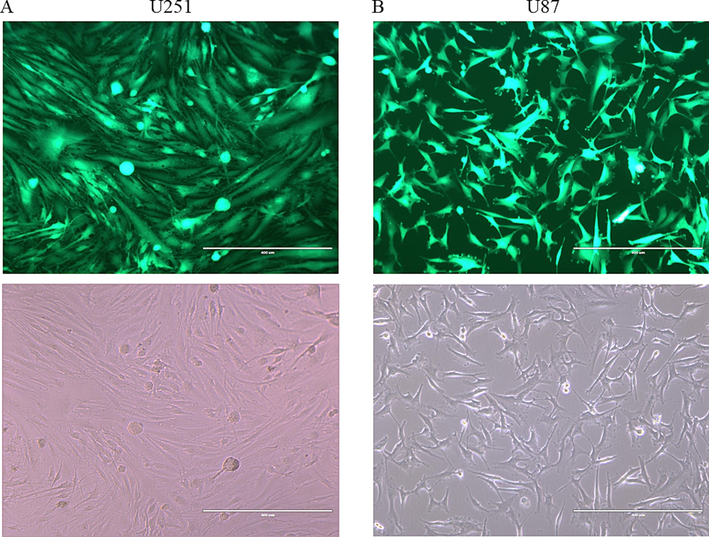
Estimation of Transduction efficiency by using GFP expression as indicator of successful transduction. A- Shows U251 transfected cells (Green). B- Shows U87 transfected cells (Green). The bottom images represent light microscope showing the same areas of the Fluorescent micrograph (A) on top (×10 magnification).
2.2 Validation of OC-2 down-regulation in GBM cells
The results, depicted in both Fig. 2A and Fig. 2B, revealed a significant decrease in OC-2 expression in both the U251 cells (with a remarkable 98.93 % decrease; P < 0.0001) and the U87 cells (with a 17.17 % decrease; P = 0.0207) when compared to the control group consisting of wild-type cells. These findings provide strong evidence for the successful manipulation of OC-2 expression levels in the U251 and U87 cells, validating the researchers' efforts in constructing cells with reduced OC-2 expression.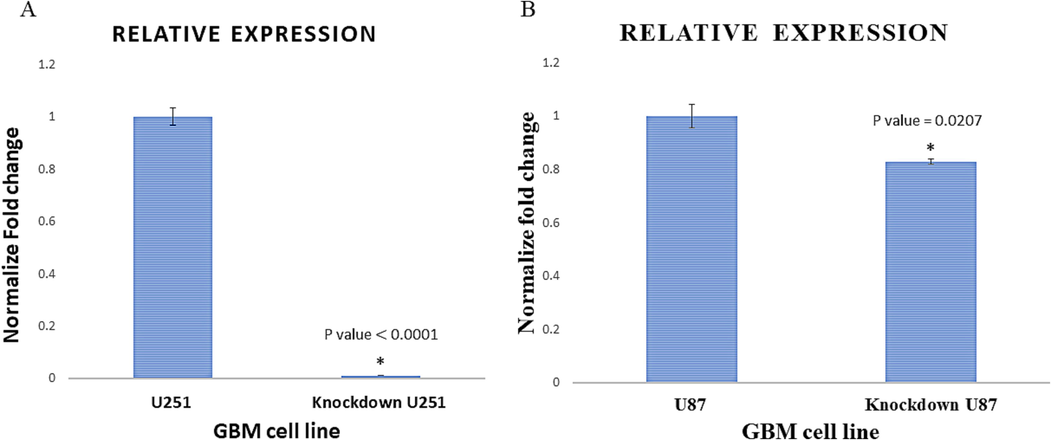
Confirmed inhibition of OC-2. A and B- show qRT-PCR validation of the OC-2 inhibition in comparison to the expression in the mock transfected (WT) cells. Knockdown of OC-2 was shown as 98.93% inhibition for U251 and 17.17% for U87.
2.3 Effect of OC-2 on GBM cell viability
To assess the impact of OC-2 on the viability (MTT) of GBM cells, we conducted experiments involving the downregulation and upregulation of OC-2 in U251 and U87 cells. The baseline control was established by measuring the levels of OC-2 expression in wild-type U251 and U87 cells. We observed a significant decrease in cell viability when OC-2 was downregulated, with a 47 % decrease in U251 cells (P = 0.0056) and a 36.4 % decrease in U87 cells (P = 0.0003). These findings suggest that downregulating OC-2 may effectively inhibit the viability of GBM cells (Fig 3A and 3B). Conversely, upregulating OC-2 led to a significant increase in cell viability, with a 94 % increase in U251 cells (P = 0.0067) and a 58 % increase in U87 cells (P = 0.0028). These results indicate that upregulating OC-2 significantly enhances both OC-2 expression and cellular activity (Fig 3C and 3D).
2.4 Proliferation assay
The downregulation of OC-2 caused a significant decrease in cell proliferation, with a 65.5 % reduction in U251 cells (P ≤ 0.0001) and a 71.7 % reduction in U87 cells (P ≤ 0.0001) when compared to wild-type (WT) cells, as illustrated in Fig. 4 (A and A1). Conversely, upregulating OC-2 resulted in a substantial increase in cell proliferation, with a 183.2 % increase in U251 cells (P ≤ 0.0001) and a 123.5 % increase in U87 cells (P ≤ 0.0001) when compared to WT cells (Fig 4B and 4B1).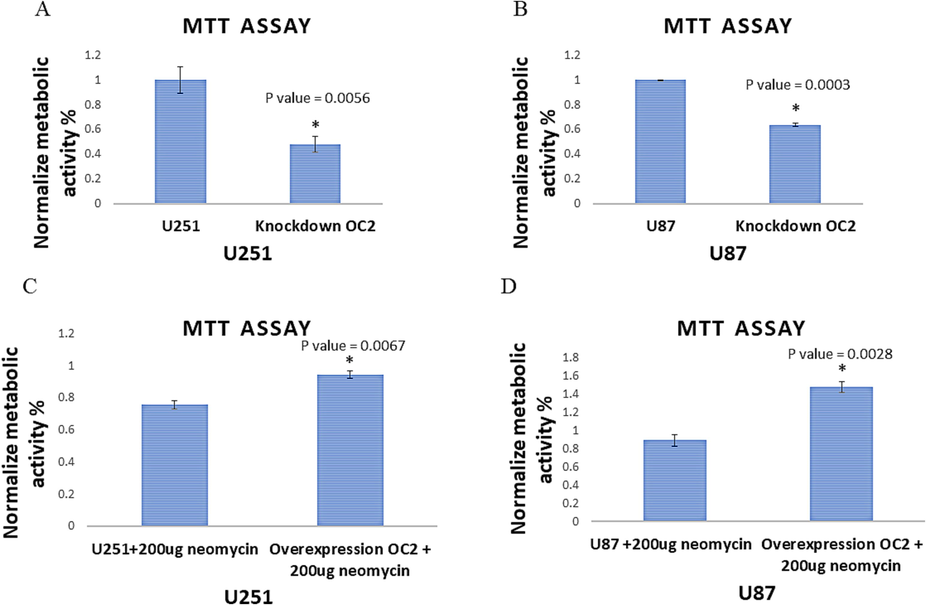
Metabolic activities of OC-2 modified cells. A- and B- show OC-2 inhibitor reduction of MTT (activities) within U251 (50%) and U87 (40%) cells compared to the controls. C- and D- show OC-2 overexpression increases MTT (activity) within U251 (21%) and U87 (40%) compared to the controls. The overexpression of OC-2 in U251 and U87 was done at background of 200ug of neomycin to maintain the plasmid with stable OC-2 expression in the cell lines.
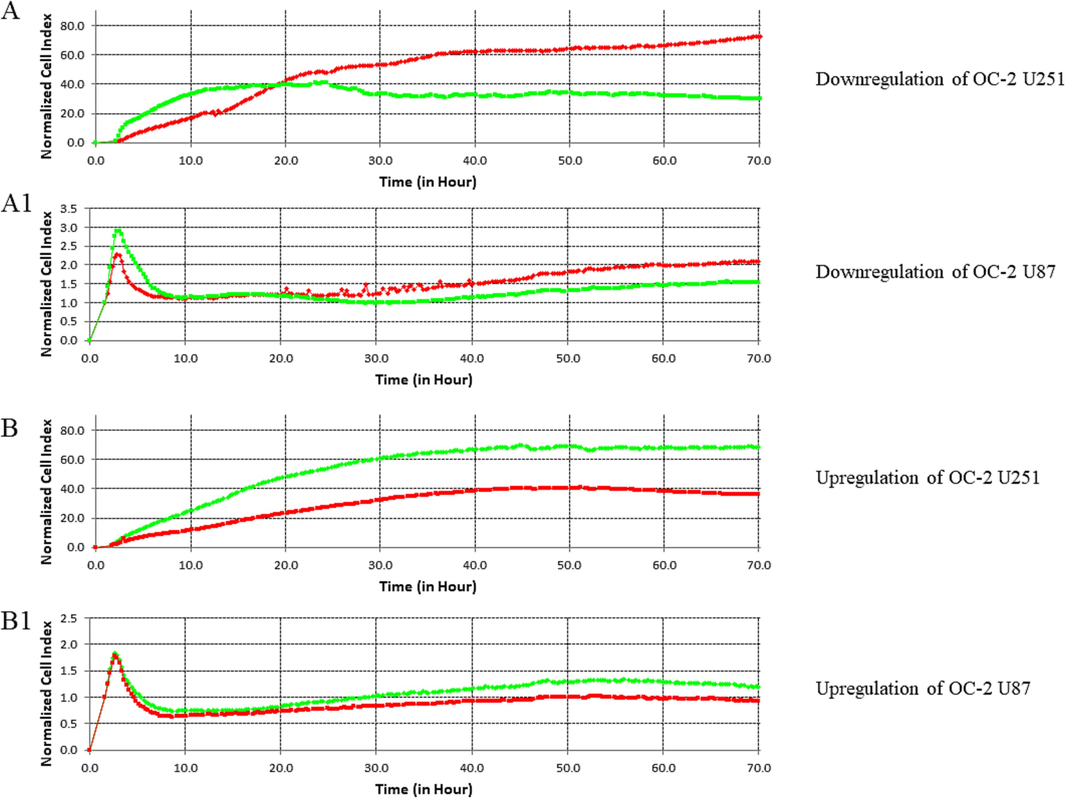
Proliferation analysis by a real-time cell analyzer (RTCA; xCELLigence, E-Plate 16). A- show U251 cells (Green) with OC-2 down-regulation compared with the WT (Red). A1- show U87 cells (Green) with OC-2 down-regulation compared with the WT (Red). B- show U251 cells (Green) with OC-2 up-regulation compared with the WT (Red). B1- show U87 cells (Green) with OC-2 up-regulation compared with the WT (Red).
2.5 Flow cytometry analysis
2.5.1 Effect of OC-2 on cell cycle of GBM cell
To examine the impact of decreasing OC-2 expression on apoptosis in GBM cells, a cell cycle analysis was conducted with flow cytometry. The Flowing software program generated DNA histograms, which enabled determining the distribution of cells across the various stages of the cell cycle. The histograms presented in Fig. 5 illustrates the impact of knocking down OC-2 in U251 and U87 cells. The cells distributed across different phases of cell cycle. In the U251 cells, reducing OC-2 resulted in a decrease in the proportion of cells in the G1 phase (13.6 % compared to control cells), as well as a reduction in the number of cells in the S phase (43.99 % compared to control cells) and the G2/M phase (52.52 % compared to control cells). Similarly, knocking down OC-2 in U87 cells led to a decrease in the proportion of cells in the G1 phase (90.5 % compared to control cells). while the fraction of cells in the G2/M phase increased (76.61 % compared to control cells), and the proportion of cells in the S phase remained unchanged compared to control cells, as shown in Fig. 5. These results indicate that reducing OC-2 expression can obstruct the progression of cells at the S/G2 phase of the cell cycle.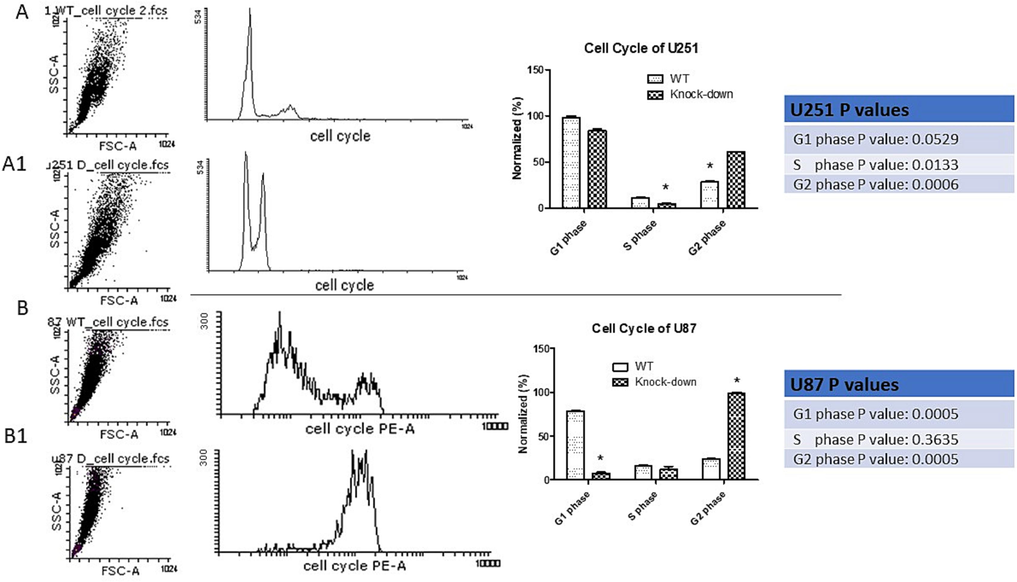
Cell cycle distribution analysis. A- Control (U251 mock treated cells) shows cell cycle analysis. A1- Cell cycle analysis of cells possess OC-2 down-regulation and showing less G1, S phase and arrest in G2, P value: 0.0006. B- Control (U87 mock treated cells) shows cell cycle analysis. B1- Cells have OC-2 down-regulated was analyzed for cell cycle and showed decrease in G1, S phase and arrest in G2, P value: 0.0005.
2.5.2 Effect of OC-2 on apoptosis of GBM cell
To evaluate the effect of OC-2 downregulation on apoptosis in GBM cells, we analyzed the levels of annexin V-FITC/PI dual staining using the Flowing software program v.2.5.1. Annexin V-FITC staining was performed to detect early-stage apoptosis, and its relationship to OC-2 downregulation was examined. The proportion of pre-apoptotic cells in the population was determined, and the resulting histograms are presented in Fig. 6. Our findings revealed that OC-2 downregulation led to a significant increase in apoptotic cells (with degraded DNA), with 95.46 % more apoptotic cells in OC-2-downregulated U251 cells (P = 0.0005) and 19.65 % more apoptotic cells in OC-2-downregulated U87 cells (P = 0.0004) compared to WT cells (Fig. 6A–B). These results strongly indicate that OC-2 has an apoptotic effect on GBM cells.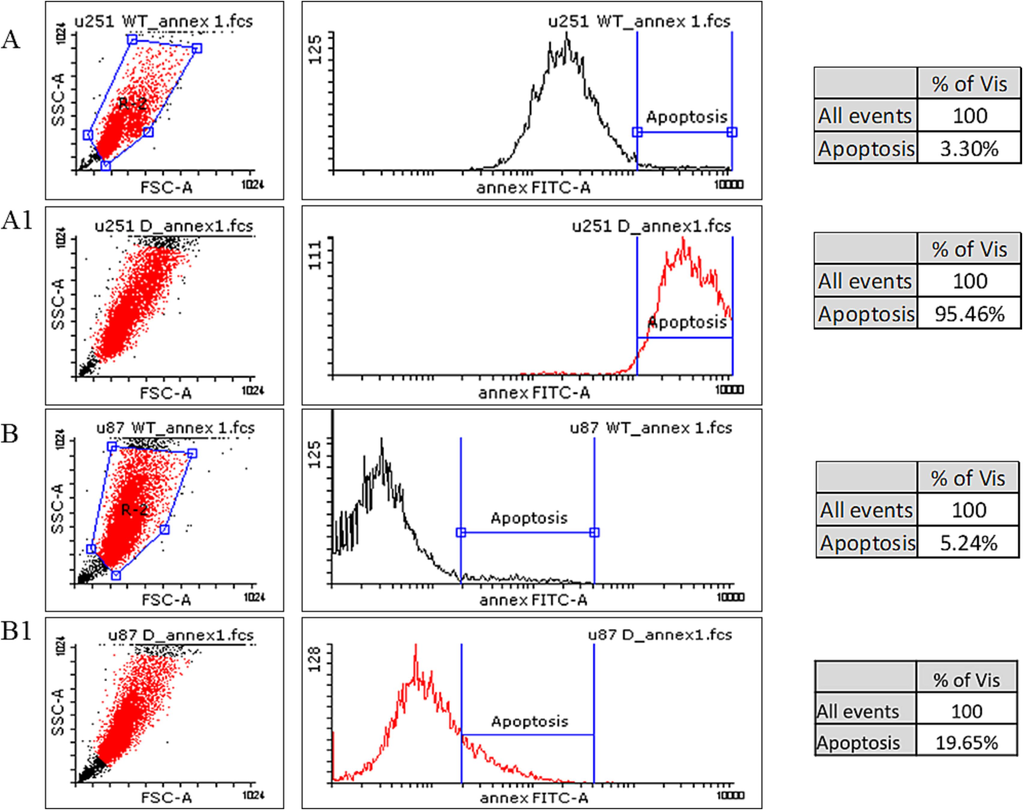
Pre-apoptosis analysis of OC-2 modified cells. A- Represent U251 WT showing minimal pre-apoptotic effect. A1- Represent U251 cells down regulated with OC-2 inhibitor showing high (95.46%) pre-apoptotic effect. B- Represent U87 WT showing minimal pre-apoptotic effect. B1- Represent U87 cells down regulated with OC-2 inhibitor showing high (19.65%) pre-apoptotic effect.
3 Discussion
Hepatic nuclear factor 6 (Hnf6) is a member of the OCs family of transcription factors. It has been shown to be involved in organogenesis, cell fate, and tumorigenesis (Kropp and Gannon, 2016, Choi et al., 2022). Another OCs family member, OC-2, has been shown to be elevated in several different cancers, such as hepatocellular carcinoma, NETs, lung adenocarcinoma, and gastric, colorectal, prostate, and ovarian cancer (Zhang et al., 2015, Lu et al., 2018, Guo et al., 2019, Ma et al., 2019, Chen et al., 2020, Sun et al., 2021, Choi et al., 2022).
In this research study, our primary focus was to examine the impact of OC-2 function, whether gained or lost, on GBM cells. To achieve this, we employed a range of assays to thoroughly investigate this phenomenon. Noteworthy, we firstly explore the influence of OC-2 on the progression of GBM. To begin our investigation, we utilized qPCR techniques to validate the upregulation and downregulation of OC-2 in both transfected and transduced U251 and U87 cells. The results of the validation process were highly significant, providing compelling evidence that OC-2 expression was downregulated in U251 cells by an impressive 99 % (P < 0.0001), as well as in U87 cells by 18 % (P = 0.0207). Interestingly, despite multiple attempts, we encountered challenges in achieving a 50 % downregulation of OC-2 in U87 cells, the average reduction amounting was just 19 %. This resistance to OC-2 inhibition can likely be attributed to the presence of PTEN deletion in the U87 cells, resulting in diminished effectiveness of OC-2 downregulation. Similarly, in the literature PTEN deletion has been shown to derive resistance against MEK inhibitors (Smith et al., 2019).
In our study, we also investigated the impact of knocking down OC-2 on the metabolic activity of U251 and U87 cells. The results were striking, with a significant decrease of 47 % (P = 0.0056) in U251 cells and 36.4 % (P = 0.0003) in U87 cells (3A and 3B). These findings suggest that OC-2 plays a crucial role in GBM cells, potentially influencing cell survival beyond its effect on metabolic activity. Conversely, when OC-2 was overexpressed in U251 and U87 cells, a noteworthy increase in metabolic activity was observed compared to wild-type cells. Specifically, there was a 94 % (P = 0.0067) increase in U251 cells and a 58 % (P = 0.0028) increase in U87 cells (Fig. 3C and 3D). This indicates that OC-2 plays a significant role in promoting cell proliferation. Interestingly, previous studies have indicated that OC-2 is overexpressed in various cancers such as liver, colon, prostate, and lung cancers, which are known to exhibit increased cell proliferation (Sun et al., 2014, Zhang et al., 2015, Lu et al., 2018, Ma et al., 2019). The fact that similar findings have been reported in different types of cancer suggests that OC-2 likely performs similar functions across different organs.
To further understand the impact of downregulating OC-2 on cell proliferation, we conducted real-time assessments using U251 and U87 cells, with wild-type (WT) cells serving as controls. The results revealed a significant reduction of 65.5 % (P < 0.0001) in U251 cells and 71.7 % (P < 0.0001) in U87 cells (Fig. 4A and 4A1). These findings suggest that OC-2 may play a role in limiting the propagation of GBM cells in vitro. In line with our results, similar studies have reported reduced cell proliferation in gastric cancer and ovarian cancer upon the downregulation of OC-2 (Lu et al., 2018, Chen et al., 2020). In ovarian cancer, the Akt/Erk signaling pathway, which is associated with cell proliferation, migration, and angiogenesis, has been investigated for its relationship with ONECUT2 expression (Lu et al., 2018). Additionally, in neuroendocrine prostate cancer, ONECUT2 was found to regulate cell proliferation and tumor growth (Choi et al., 2022). Extra, ONECUT2 has been shown to control the expression of specific genes involved in cell proliferation. In gastric cancer, ONECUT2 was found to control the expression of ROCK1, a gene associated with tumor proliferation (Chen et al., 2020). This data supports the notion that OC-2 may have a broader influence on cell proliferation across different cancer types. Conversely, when OC-2 was overexpressed in U251 and U87 cells, a significant increase in proliferation was observed compared to WT cells. Specifically, there was a 183.2 % (P < 0.0001) increase in U251 cells and a 123.5 % (P < 0.0001) increase in U87 cells (Fig. 4B and 4B1). Similarly, ONECUT2 was shown by other groups to promote tumor proliferation in gastric and ovarian cancer (Lu et al., 2018, Chen et al., 2020). These findings suggest that OC-2 may stimulate cell proliferation pathways. Interestingly, our proliferation data indicated an initial spike in proliferation during the first 10 h, where the population of OC-2 inhibited cells temporarily outgrew the control. This could be attributed to cellular stress, as the modified cells attempted to compensate by increasing their rate of proliferation. Consequently, we conducted cell cycle assays to further investigate this phenomenon.
In order to gain further insights into the effects of downregulating OC-2 on cell cycle progression, we performed cell cycle analysis on U251 and U87 cells. The results revealed that U251 cells with downregulated OC-2 showed that the cells arrested at G2 phase 52.5 %. Also, downregulation of OC-2 in U87 cells was found to arrest cells at the G2 76.61 % and failed to initiate G1 phase 90.5 %. Furthermore, S phase was significantly low 43.99 % in U251 modified cells only. We concluded that the two type of cell lines probably use two different mechanisms when responding to OC-2 inhibition. Cellular arrest at the S/G2 phase is often associated with the initiation of apoptosis, a programmed cell death process. In light of this, we decided to perform an apoptosis assay to investigate the potential involvement of apoptosis in the observed effects of OC-2 downregulation. By analyzing the cell cycle and apoptosis responses, we aimed to uncover the underlying mechanisms through which OC-2 influences cell cycle progression and cell fate decisions in U251 and U87 cells.
Apoptosis analysis of U251 cells with downregulated OC-2 revealed a significant activation of the pre-apoptotic pathway by 95.46 % (P = 0.0005). This indicates that OC-2 plays a crucial role in promoting cell survival. On the other hand, downregulation of OC-2 in U87 cells resulted in a less pronounced activation of the pre-apoptotic pathway by 19.65 % (P = 0.0004). This suggests that OC-2 is important for the survival of U87 cells. It's worth noting that U87 cells have a PTEN mutation, which might contribute to the reduction of apoptotic initiation by inhibiting OC-2-associated apoptosis. Likewise, Yi et al. has shown OC2 down regulation stimulates apoptosis (Yi et al., 2022). Our apoptosis findings are consistent with the results of our proliferation assay. In the case of U251 cells, proliferation plateaued after 20 h when OC-2 was inhibited. Conversely, U87 cells did not plateau at 20 h but rather after 60 h of proliferation (Fig. 4A and 4B). This further confirms that both cell lines employ different mechanisms or routes to ensure their survival. Taken together, the apoptosis analysis and proliferation assay highlight the importance of OC-2 in promoting cell survival and provide evidence for distinct mechanisms employed by U251 and U87 cells in response to OC-2 downregulation.
These findings highlight the role of OC-2 in GBM and suggest its potential as a therapeutic target in GBM treatment. It is worth noting that this study is the first to demonstrate the impact of OC-2 on GBM cell lines. The involvement of OC-2 in tumor progression suggests its potential as a therapeutic target for GBM. To further understand the role of OC-2 in GBM, scientists should investigate its contribution to angiogenesis and metastasis. In addition, investigating a synergism by combining OC-2 and a new steroidal drug such as Stigmasterol (Ali et al., 2015, Aljarba et al., 2021) may open a new door for therapies. Moreover, preclinical studies including toxicity for assessing OC-2 inhibition are important for understanding GBM therapeutics.
4 Materials and methods
Ethical approval for this study is waived as per institutional regulations’ stating that commercial cell lines are exempt from mandatory IRB application.
4.1 Cell culture
The human GBM cell line U251 was obtained from Merck (Darmstadt, Germany), and the U87 cell line (characterized by a homozygous mutation in PTEN) was obtained from the American Type Culture Collection (ATCC, Manassas, VA, USA). Cells from both lines were cultured to form monolayers in Dulbecco’s Modified Eagle’s Medium (DMEM, Cat No. /ID: 11995–065) containing 10 % fetal bovine serum (FBS, Cat No. /ID: 10100147) and 1 % penicillin–streptomycin (Cat No. /ID: 15140122), obtained from Gibco (Carlsbad, CA, USA). Cells were incubated at 37 °C in a humidified atmosphere (95 % air and 5 % CO2). The cell culture conditions have been published previously (Akiel et al., 2022). The two cell lines used possess two different mutational background affecting which probably affect different pathways. This approach allows for a more comprehensive understanding of the molecular mechanisms involved in diseases or biological processes under investigation.
4.2 Transduction and transfection
4.2.1 In vitro transient transfection of OC-2
For DNA transfection, U251 and U87 cells were seeded (3,000 per well) onto 96-well tissue culture plates in culture medium and incubated overnight at 37 °C. The next day, the medium was replaced with starvation culture medium, and the cells were incubated for 30–60 min at 37 °C. Then, the cells were transfected with the OC-2 (NM_004852) Human Tagged ORF Clone expression plasmid (Cat No. /ID: RC211951, Origene, Rockville, MD, USA) using the GenMuteTM DNA Transfection Reagent (Cat No. /ID: SL100568, SignaGen Laboratories, Gaithersburg, MD, USA) according to the manufacturer’s instructions. The control possesses empty plasmid EMX1 (NM_004097) Human Tagged ORF Clone (Cat No. /ID: RG208006, Origene, Rockville, MD, USA). The delivery system was incubated with the cells for 5 h to mediate transfection. After the 5-h incubation, the medium was replaced with culture medium containing 10 % FBS, and the cells were incubated for 48 h. After this time, the medium was replaced with selection culture medium containing 200 µg of neomycin (Cat No. /ID: PHR1491, Sigma-Aldrich, Darmstadt, Germany). After two passages, the cells in the selection culture medium were ready for further experiments. Cell visualization was performed using the EVOS XL Core Imaging system (Cat No. /ID: AMEX1000, ThermoFisher Scientific, Waltham, MA, USA). The cells morphologies have no visible differences or changes after transfection.
4.2.2 In vitro permanent transduction of OC-2
To perform lentivirus transduction, U251 and U87 cells were seeded at a density of 3,000 cells per well in 96-well tissue culture plates with culture medium. The plates were then incubated overnight at 37 °C. The following day, the culture medium was replaced with starvation culture medium, and the cells were incubated for 30 min at 37 °C. Subsequently, the cells were transduced with the knockdown OC-2 Human shRNA Lentiviral Particle (Locus ID 9480; Cat No. /ID: TL311023V, Origene, Rockville, MD, USA) at a concentration of 9,000 lentivirus particles per well. The cells were then incubated overnight at 37 °C. The next day, the culture medium was replaced with culture medium containing 10 % FBS, and the cells were incubated for 48 h. After this period, the culture medium was replaced with selection culture medium containing 1 μg puromycin (Cat No. /ID: A1113803, ThermoFisher Scientific, Waltham, MA, USA) to eliminate untransduced cells. The efficiency of transduction was evaluated by observing the presence of GFP-positive cells. After undergoing two or three passages, the culture medium was replaced with regular culture medium, and the cells were prepared for further experiments. The cells morphologies have no visible differences or changes after transfection.
4.3 Quantitative real-time reverse transcription–Polymerase chain reaction (qRT-PCR)
4.3.1 RNA Isolation
To extract total RNA, the pellets of both transduced and untreated (mock control cells) U251 and U87 cells were processed using the MagNA Pure Compact RNA Isolation Kit (Cat No. /ID: 04802993001, Roche Life Sciences, Mannheim, Germany) following the manufacturer's instructions. The RNA concentration and purity were measured using a NanoDrop™ 8000 spectrophotometer (ThermoFisher Scientific, Waltham, MA, USA). The extracted RNA samples were then stored at −80 °C for future use.
4.3.2 Reverse transcription (RT) into cDNA
To generate complementary DNA (cDNA), the isolated RNA samples were subjected to reverse transcription using the High-Capacity cDNA Reverse Transcription Kit (Cat No. /ID: 00795574, ThermoFisher Scientific, Waltham, MA, USA) following the manufacturer's instructions. The RNA (1 μg) was converted into cDNA using a polymerase chain reaction (PCR) thermocycler (GeneAmp™ PCR System 9700, Cat No. /ID: 4413750, ThermoFisher Scientific, Waltham, MA, USA). The resulting cDNA samples were stored at 4 °C for further use.
4.3.3 Real-time (Quantitative) PCR
To confirm the successful reduction of OC-2 in the GBM cells, the researchers employed a technique called Reverse Transcription Polymerase Chain Reaction (RT-PCR). The quantitative real-time polymerase chain reactions (qRT-PCRs) were conducted using a 7900HT fast real-time PCR system (Cat No./ID: 4351405, ThermoFisher Scientific, Waltham, MA, USA). An IDT Prime time™ gene expression 2X master mix (Cat No. /ID: 1055771, Integrated DNA Technologies, Coralville, Iowa, USA) was used to identify and quantify OC-2 gene expression (amplification) in transduced and untreated U251 and U87 cells. Eukaryotic 18S rRNA Endogenous Control (FAM™/MGB probe, non-primer limited), 18S rRNA (DQ) oligo mix (20 × ) housekeeping gene (Cat No. /ID: 4352655, RefSeqNumber: X03205.1, Assay Name: Hs99999901_s1, Applied Biosystems, Foster City, California, USA) was employed. The 20ul reaction qRT-PCR was performed using PrimeTime Std qPCR Assay for ONECUT2. The primers obtained from Integrated DNA Technologies – IDT- (Cat No. /ID: NM_004852, Coralville, Iowa, USA), Reference#:233665301 RefSeqNumber: NM_004852, Exon location: 1–2, Assay Name: Hs.PT.58.3885784. The Probe 2.5 nmoles 5′-/56-FAM/CAGGCGTAA/ZEN/GGCGGACATGC/3IABkFQ/-3′; PRIMER1 (5′-CAGGATGTGGAAGTGGCTT-3′); PRIMER2 (5′-TTCTTGCTCTTTGCGTTTGC-3′). The relative expression was determined by subtracting the target cycle threshold (Ct) from the 18S Ct, and then subtracting the resulting value from the Ct of the control samples (untreated). The final values were calculated using the formula 2^(-delta delta Ct). The detailed calculation process has been previously described (Rao et al., 2013, Alrfaei et al., 2020). The RNA purities are mentioned in Table 1.
Name
Conc.
for RT-PCR (50ul)
Conc. of cDNA
for qPCR (20ul)
Purity 260/230
Purity 260/280
RNA extraction U251 Control
620.1 ng/ul
50 ng
2472 ng/ul
1 µg
2.26
1.85
RNA extraction U251 KD clone
330 ng/ul
50 ng
2918 ng/ul
1 µg
2.2
1.78
RNA extraction U87 Control
682 ng/ul
50 ng
2526 ng/ul
1 µg
2.24
1.80
RNA extraction U87 KD clone
687.5 ng/ul
50 ng
2516 ng/ul
1 µg
2.23
1.92
4.4 Metabolic activity assay
Cell viability was measured using the PrestoBlueTM Cell Viability Reagent (Cat No. /ID: A13262, Invitrogen, Carlsbad, CA, USA). Transfected U251 and U87 cells were plated onto 96-well plates at a density of 3,000 cells/well. Mock treated cells were included as controls. The cells were incubated in a 5 % CO2 incubator at 37 °C overnight. The next day, the culture medium was replaced with starvation culture medium, and the cells were incubated overnight. The next day, the starvation medium was removed, and the cells were washed with 1 × phosphate buffered saline (PBS; Cat No. /ID: 15374875, ThermoFisher Scientific, Waltham, MA, USA). According to the manufacturer’s protocol, fresh medium was added to each well, and the cells were incubated for 1 h. Then, the PrestoBlue Cell Viability Reagent was added to all wells, and the wells were completely covered to protect the cells from light. The cells were then incubated for 1 h. Fluorescence was measured using a SpectraMax M5 Multi-Mode Microplate Reader (Molecular Devices, LLC, San Jose, CA, USA); the excitation wavelength was 560 nm, and the emission wavelength was 590 nm. The cell viability was calculated as previously described (Alswailem et al., 2022).
4.5 Proliferation assay
To assess the proliferative capacity of the transduced U251 and U87 cells and control cells (mock transduction), real-time cell analysis (RTCA) was performed using a real-time cell analyzer (xCELLigence, ACEA Biosciences, Inc, CA, USA). Impedance measurements of the cell index (CI) were conducted following the manufacturer's protocol. The cells were suspended in culture media and adjusted to a density of 10,000 cells per well. Subsequently, 100 μL of the cell suspension was added to each well (8 wells per group) of 16-well E-plates (Cat No. /ID: 20180618, Agilent Technologies, ACEA Biosciences Inc., San Diego, USA). The RTCA system monitored the cells every 15 min for a duration of 70 h. This cell proliferation experiment was repeated two times to ensure reproducibility of the results.
4.6 Flow cytometry analysis
4.6.1 Cell cycle
The cell-cycle protocol has been previously described (Asiri et al., 2021). After being cultured for 72 h, the cells (U251 and U87 cells that were either transduced with OC-2 or treated with mock transduction (control cells)) were subjected to trypsinization. Following trypsinization, the cells were washed twice with ice-cold 1 × PBS and then fixed in ice-cold methanol for a duration of 20 min. To further analyze the cells, the samples were treated with RNase/ribonuclease obtained from Worthington (Cat No. /ID: 52B13247, USA). Subsequently, the cells were exposed to 100ug/ml propidium iodide (PI) obtained from ThermoFisher Scientific (Cat No. /ID: R37108, Waltham, MA, USA). Finally, the cells were analyzed using a BD FACs Canto II instrument. FACs analysis through Forward scatter and side scatter are used to define population size and shape. Next, the correct population is gated and selected for PE 575/26 nm analysis. Ten thousand cells were analysed. Cell cycle analysis was done on linear data using flowing 2 version 2.5.1.
4.6.2 Apoptosis assay
The extent of apoptosis was assessed using the Alexa FluorTM 488 Annexin V/Dead Cell Apoptosis Kit from Invitrogen (Cat No. /ID: 2127457, Carlsbad, CA, USA), following the manufacturer’s protocol. After 72 h of culture, the transduced U251 and U87 cells, as well as the untreated cells (mock control cells), The cells were then resuspended at a density of 30,000 cells/mL. For the transduced cells, annexin V and propidium iodide (PI) staining was performed in the dark for 15 min. Next, the cells were fixed by adding cold methanol in the dark for 15 min. The fixed cells were subsequently analyzed using a BD FACs canto II instrument, according to (Alghamdi et al., 2020). FACs analysis require stained and unstained cells to define baseline. Forward scatter and side scatter are used to define population size and shape. Next, the correct population is gated and selected for FITC 530/30 nm analysis. Ten thousand cells were analysed. Apoptosis analysis was done on log data using Flowing software 2 version 2.5.1.
4.7 Statistical analysis
Each experiment was conducted a minimum of three independent times to ensure validation. The apoptosis and cell cycle assays were performed twice, unless specified otherwise. For statistical analyses, the GraphPad Prism (GraphPad Software v.5.03, Inc., San Diego, California) was utilized. The mean Ct values of the treated samples (knockdown and overexpressed) and the control samples (WT) were compared using an unpaired two-tailed t-test, assuming the data followed a normal distribution. Similarly, the mean relative proliferation values of the WT, OC-2 knockdown, and overexpressed OC-2 samples were compared using an unpaired two-tailed t-test. In the results, asterisks (*) were used to indicate statistical significance, with P ≤ 0.05 being the threshold for significance. It worth noting that “untreated”, “control”, “mock control”, and “wild type” are the same. Empty plasmid transfection or transduction are the controls.
Funding
This research was funded by Ministry of Education (MOE), Saudi Arabia, RC20/046/R, and supported by the King Abdullah International Medical Research Center (KAIMRC), Saudi Arabia, RC20/046/R.
6 Institutional review board statement
King Abdullah International Medical Research Center (KAIMRC) Institution Review Board (IRB) Ministry of National Guard – Health Affairs in Riyadh, Saudi Arabia under protocol number RC20/046/R.
Acknowledgments
We thank all colleagues from King Abdullah International Medical Research Center (KAMRC).
Declaration of competing interest
The authors declare that they have no known competing financial interests or personal relationships that could have appeared to influence the work reported in this paper.
References
- Viridiflorol induces anti-neoplastic effects on breast, lung, and brain cancer cells through apoptosis. Saudi J. Biol. Sci.. 2022;29(2):816-821.
- [CrossRef] [Google Scholar]
- The loss of microglia activities facilitates glaucoma progression in association with Cyp1b1 gene mutation (P Gly61glu) Plos One. 2020;15(11):e0241902.
- [CrossRef] [Google Scholar]
- Isolation and evaluation of anticancer efficacy of stigmasterol in a mouse model of Dmba-induced skin carcinoma. Drug Des. Devel. Ther. 2015:2793-2800.
- [CrossRef] [Google Scholar]
- Synergistic dose permutation of isolated alkaloid and sterol for anticancer effect on Young Swiss Albino Mice. Drug Des. Devel. Ther. 2021:4043-4052.
- [CrossRef] [Google Scholar]
- Al-Rawaji, A., Z. Al-Shahrani, W. Alzahrani, F. Alomran and A. Almadouj, 2018. Kingdom of Saudi Arabia Saudi Health Council National Health Information Center Saudi Cancer Registry: Cancer Incidence Report Saudi Arabia 2015, September.
- Microrna Mir-100 decreases glioblastoma growth by targeting Smarca5 and Erbb3 in tumor-initiating cells. Technol. Cancer Res. Treat.. 2020;19
- [CrossRef] [Google Scholar]
- Microrna-219 loaded chitosan nanoparticles for treatment of glioblastoma. Artif. Cells Nanomed. Biotechnol.. 2022;50(1):198-207.
- [CrossRef] [Google Scholar]
- Pancytopenia, recurrent infection, poor wound healing, heterotopia of the brain probably associated with a candidate Novel De Novo Cdc42 gene defect: Expanding the molecular and phenotypic spectrum. Genes. 2021;12(2):294.
- [CrossRef] [Google Scholar]
- Onecut2 accelerates tumor proliferation through activating Rock1 expression in gastric cancer. Cancer Manag. Res.. 2020;12:6113.
- [CrossRef] [Google Scholar]
- Onecut2 as a key mediator of androgen receptor-independent cell growth and neuroendocrine differentiation in castration-resistant prostate cancer. Cancer Drug Resist.. 2022;5(1):165.
- [CrossRef] [Google Scholar]
- Onecut transcription factors are required for the second phase of development of the A13 dopaminergic nucleus in the mouse. J. Comp. Neurol.. 2012;520(7):1424-1441.
- [CrossRef] [Google Scholar]
- Dynamic expression of the onecut transcription factors Hnf-6, Oc-2 and Oc-3 during spinal motor neuron development. Neuroscience. 2010;165(1):116-129.
- [CrossRef] [Google Scholar]
- Onecut2 is a driver of neuroendocrine prostate cancer. Nat. Commun.. 2019;10(1):1-13.
- [CrossRef] [Google Scholar]
- Retrograde Bmp signaling regulates trigeminal sensory neuron identities and the formation of precise face maps. Neuron. 2007;55(4):572-586.
- [CrossRef] [Google Scholar]
- Oc-2, a novel mammalian member of the onecut class of homeodomain transcription factors whose function in liver partially overlaps with that of hepatocyte nuclear factor-6. J. Biol. Chem.. 1999;274(5):2665-2671.
- [CrossRef] [Google Scholar]
- The onecut transcription factors regulate differentiation and distribution of dorsal interneurons during spinal cord development. Front. Mol. Neurosci.. 2017;10:157.
- [CrossRef] [Google Scholar]
- Astrocytoma: Insights into risk factors, pathogenesis, diagnosis and management. J. Cancer Res. Treat.. 2018;6:70-73.
- [CrossRef] [Google Scholar]
- Onecut transcription factors in development and disease. Trends Develop. Biol.. 2016;9:43-57.
- [Google Scholar]
- The Cbtrus story: Providing accurate population-based statistics on brain and other central nervous system tumors for everyone. Neuro Oncol.. 2018;20:295-298.
- [Google Scholar]
- Blockade of Onecut 2 expression in ovarian cancer inhibited tumor cell proliferation, migration, invasion and angiogenesis. Cancer Sci.. 2018;109(7):2221-2234.
- [CrossRef] [Google Scholar]
- Onecut2 overexpression promotes ras-driven lung adenocarcinoma progression. Sci. Rep.. 2019;9(1):1-12.
- [CrossRef] [Google Scholar]
- Current status of brain tumor in the Kingdom of Saudi Arabia and application of nanobiotechnology for its treatment: A comprehensive review. Life. 2021;11(5):421.
- [CrossRef] [Google Scholar]
- A new method for quantitative real-time polymerase chain reaction data analysis. J. Comput. Biol.. 2013;20(9):703-711.
- [CrossRef] [Google Scholar]
- Pten deletion drives acute myeloid leukemia resistance to Mek inhibitors. Oncotarget. 2019;10(56):5755.
- [CrossRef] [Google Scholar]
- Mir-429 inhibits cells growth and invasion and regulates Emt-related marker genes by targeting Onecut2 in colorectal carcinoma. Mol. Cell. Biochem.. 2014;390(1):19-30.
- [CrossRef] [Google Scholar]
- Correction to: Mir-429 inhibits cells growth and invasion and regulates Emt-related marker genes by targeting Onecut2 in colorectal carcinoma. Mol. Cell. Biochem.. 2021;476(8):3215.
- [CrossRef] [Google Scholar]
- Mir-218 is essential to establish motor neuron fate as a downstream effector of Isl1–Lhx3. Nat. Commun.. 2015;6(1):7718.
- [CrossRef] [Google Scholar]
- Exciting new advances in neuro-oncology: The avenue to a cure for malignant glioma. CA Cancer J. Clin.. 2010;60(3):166-193.
- [CrossRef] [Google Scholar]
- Role of the onecut transcription factors in pancreas morphogenesis and in pancreatic and enteric endocrine differentiation. Dev. Biol.. 2007;305(2):685-694.
- [CrossRef] [Google Scholar]
- Glioblastoma multiforme (Gbm): An overview of current therapies and mechanisms of resistance. Pharmacol. Res.. 2021;171:105780
- [CrossRef] [Google Scholar]
- Onecut 1 and onecut 2 are potential regulators of mouse retinal development. J. Comp. Neurol.. 2012;520(5):952-969.
- [CrossRef] [Google Scholar]
- Lncrna Tm1-3p regulates proliferation, apoptosis and inflammation of fibroblasts in osteoarthritis through Mir-144-3p/Onecut2 axis. Orthop. Surg.. 2022;14(11):3078-3091.
- [CrossRef] [Google Scholar]
- Comprehensive profiling of novel Microrna-9 targets and a tumor suppressor role of Microrna-9 via targeting Igf2bp1 in hepatocellular carcinoma. Oncotarget. 2015;6(39):42040.
- [CrossRef] [Google Scholar]
- Zhang, P. G., J. Yeung, I. Gupta, M. Ramirez, T. Ha, D. J. Swanson, S. Nagao-Sato, M. Itoh, H. Kawaji, T. Lassmann, C. O. Daub, E. Arner, M. de Hoon, t. F. consortium, P. Carninci, A. R. Forrest, Y. Hayashizaki and D. Goldowitz, 2018. Discovery of Transcription Factors Novel to Mouse Cerebellar Granule Cell Development through Laser-Capture Microdissection. The Cerebellum. 17 (3) 308-325. https://doi.org/10.1007/s12311-017-0912-3.
Appendix A
Supplementary material
Supplementary data to this article can be found online at https://doi.org/10.1016/j.jksus.2023.103057.
Appendix A
Supplementary material
The following are the Supplementary data to this article:


