

Translate this page into:
Landslide susceptibility assessment in the Himalayan range based along Kasauli – Parwanoo road corridor using weight of evidence, information value, and frequency ratio
⁎Corresponding author. kanwarpreet.e9570@cumail.in (Kanwarpreet Singh),
-
Received: ,
Accepted: ,
This article was originally published by Elsevier and was migrated to Scientific Scholar after the change of Publisher.
Peer review under responsibility of King Saud University.
Abstract
The Himalayan region is prone to landslides. Rainfall-induced slope failure activities in the Indian Himalaya cause considerable damage, posing a serious risk to life and property. This study attributes information regarding landslide triggering parameters to further delineate landslide susceptibility maps of Himachal Pradesh in the Himalayan region. The landslide inventory map was created using information from field visits, Linear Imaging Self-Scanning Sensor (LISS III), and Google Earth. Thereafter, eight landslide causative factors, viz. slope, aspect, curvature, elevation, Landuse Landcover (LULC), soil, lithology, and drainage density were performed by employing the weight of evidence (WOE), information value method (IVM) and the frequency ratio (FR) methods. Using the ArcGIS reclassification tool, the final landslide susceptibility zonation (LSZ) maps were categorized into five susceptibility zones: “very low, low, medium, high, and very high.” The success rate for WOE, FR, and IVM models was determined as 76.27%, 78.20%, and 76.09% respectively, depicting that the FR model based LSZ map is more accurate. According to the FR model based LSZ map, the highly susceptible classes in the case of aspect, curvature, and lithology are southeast, concave, and TBS, respectively. The sparsely vegetated areas are more prone to landslides than the other LULC areas. The higher elevations, ranging from 1191 to 1434, 1434–1655, and 1655–1876 m, are more vulnerable to landslide activities as compared to low elevations. The slope classes 30–45 and 45–60, medium drainage density class and fine loamy class of soils are more likely to landslides. The prepared susceptibility zone map can be used for future mitigation planning in the high and very high susceptibility zones in order to reduce landslide-related human and economic losses.
Keywords
Disaster
Anthropogenic
GIS
Susceptibility
Hazard

- LISS
-
Linear Imaging Self-Scanning Sensor
- WOE
-
Weight of evidence
- FR
-
Frequency ratio
- LSZ
-
Landslide susceptibility zonation
- LCF
-
Landslide causative factor
- GIS
-
Geographical information system
- (LULC)
-
Landuse Landcover
Abbreviations
1 Introduction
The natural phenomenon like floods, tornados, volcanic eruptions, tectonic activities, tsunamis, landslides, droughts etc. often create disastrous situations in the form of natural disaster. Although occurrence of natures’ fury is global however, in case of USA, China, and India, relatively greater number of natural disasters took place during the years 1995–2005 as per United Nations disaster monitoring data. The overall rate of landslide disaster in case of developing countries is 95% (Hansen, 1984; Abu et al., 2021). Landslide is known as the movement of the slope material in the form of rock, earth, debris in the downward direction because of gravity action (Cruden and Varnes, 1996) which has been classified into various classes of landslide movements (Varnes, 1978). As compared to the other natural disasters, it is difficult to develop the information about landslides in the form of landslide inventories; the monitoring of the impact of landslides on humans is also a difficult task (Kirschbaum et al, 2009). Froude and Petley (2018) which further discovered that India possesses the highest rate of human caused landslides where 28% are constructional activities triggered landslides during the above-mentioned period, followed by China (9%), Pakistan (6%), Philippines (5%), Nepal (5%) and Malaysia (5%). The Himalyan belt in North-West India is occupied by complex geological terrain along with youngest chain of mountains. The reason behind the occurrence of landslides in the region is unfavorable geological conditions, drainage patterns eroding hydraulic regime, groundwater conditions, deforestation, melting of glaciers (Anbalagan, 1992; Alexander, 1992; Negi et al., 2020; Batar and Watanabe, 2021). The state of Jammu and Kashmir, Uttarakhand, and Himachal Pradesh (HP) are also well known for slope failure activities in North India. Every year, roads in the Himalayan region of India suffer huge damages because of major and minor landslides (Joshi et al., 2001).
The remote sensing-based datasets are a useful source for developing landslide inventories to identify the spatial occurrence of landslides (Sengupta et al., 2010; Dikshit et al., 2020). In past several techniques have been developed by various researchers that can broadly be classified into inventory-based approaches (Mengistu et al., 2019), expert evaluation (Raghuvanshi et al., 2014;), statistical (Girma et al., 2015; Kanungo et al., 2006; Dai and Lee, 2002; Mengistu et al., 2019; Bappaditya et al., 2020; Abdo, 2021; Abu et al., 2021), deterministic, probabilistic and distribution free approaches (Kanungo et al., 2006). Various researchers have adopted machine learning and artificial intelligence-based approaches for landslide susceptibility zonation (Lei et al., 2020a,b; Li et al., 2021; Chen et al., 2021c; Lei et al., 2021; Chen et al., 2021a; Chen et al., 2021b). The use of the methods like weight of evidence (WOE) (Chen et al., 2019), information value method (IVM) (Balsubramani and Kumaraswamy, 2013), and frequency ratio (FR) (Sharma et al., 2012) has become more popular because of the increased availability of low-cost, and high resolution satellite data at different scales. The Parwanoo-Kasauli highway is a shortest stretch in comparison to the already existing highway road corridor (NH-5) via Dharampur. Hence, importance to this road section has been given in the present study for landslide susceptibility assessment. The landslide susceptibility zonation map will help various stake holders like administration, geologists, civil engineers, designers, and local public for future developmental and constructional activities along the stretch.
2 Study area
The study area lies in sub-Himalayan arc from Parwanoo (30°50′19.23″N, 76°57′31.23″E) and Kasauli (30°54′4.84″N, 76°57′53.56″E) towns of district Solan in Himachal Pradesh, India (Fig. 1).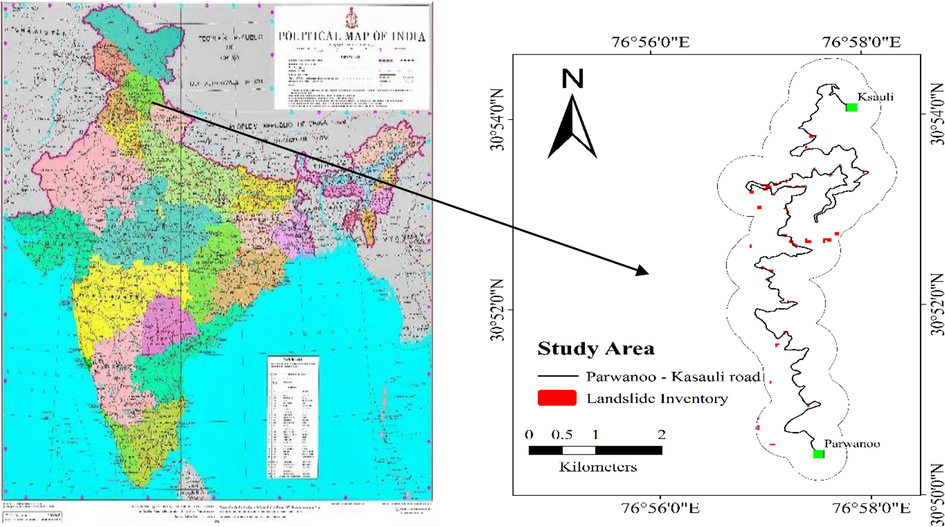
Location map of study area (a) Map of India and Himachal Pradesh, (b) Parwanoo –Kasauli road buffer and landslide inventory.
A buffer zone of 250 m along both sides of the road stretch was created to develop landslide susceptibility zonation maps. Parwanoo is a municipal council in district Solan in Himachal Pradesh. Railway line joining Kalka – Shimla (Capital of Himachal Pradesh state) passes through this town. Kasauli's climate is classified as warm and temperate. When compared with winter, the summers have much more rainfall. The average annual temperature in Kasauli is 18.6 °C | 65.5 °F. Precipitation here is about 1262 mm | 49.7 in. per year. From seismicity point of view, the state of Himachal Pradesh which forms a part of NW Himalayas is very sensitive. The most damaging earthquake in the state of HP, occurred in Kangra area in 1905. Kasauli is a cantonment and tourist spot which is located at a distance of 77 km from Shimla and 65 km from Chandigarh.
3 Geological settings
The study area lies in sub-Himalayan region where, Sirmour series are present which is further categorized into upper (Kasauli formation), Middle (Dagshai formation), Lower (Subathu formation) (Medlicott, 1879). In Kasauli Formation, sandstones with subordinate shales are present. Thickly bedded sandstones of Sirmour group (Dagshai formation) are also there in the study area. Grey, purple, red sandstone, shale, limestone of Kasauli Formation belonging to the Sirmour Group is present in the study area. Olive green shale and argillaceous limestone of Subathu formation from Sirmour Group is also present. Gritty clay and purple sandstone from sub group lower Siwalik also exists in the study area nearby Parwanoo town.
4 Methodology
The study area has been selected in sub-Himalayan region of Himachal Pradesh state of India to delineate LSZ maps using WOE, IVM, and FR approaches. Landslide inventory map (Fig. 1b) was developed based on the extensive field visits, LISS III (Resources at-1 Linear Imaging Self-Scanning Sensor (LISS-III) satellite data), and google earth. Field photographs of the critical slopes along the selected stretch are shown in Fig. 2. Thereafter, eight landslide causative factors viz. slope, aspect, curvature, elevation, LULC, soil, lithology, and drainage density were selected for LSZ mapping at scale 1:50,000. A grid cell size of 30 m × 30 m has been used for analysis.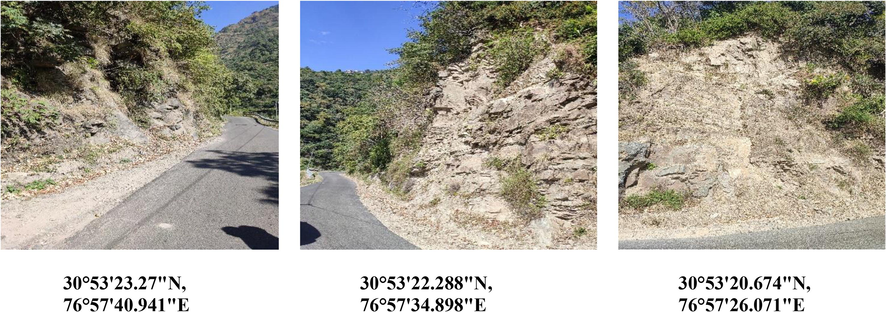
Field photographs of critical slopes along Parwanoo – Kasauli road stretch.
5 Landslide causative factors
The landslide causative factors may be inherent, external, and anthropogenic because of human interference (Anbalagan et al., 2007). The selection of the appropriate LCF’s is very challenging for their role in triggering landslides. On geomorphological basis, topography of a region controls slope stability, runoff, soil moisture. As per the previous literature (Varnes, 1984), the LCF’s like slope, aspect, curvature, elevation, soil, LULC, lithology, and drainage density have been chosen in the present study for LSZ assessment (Figs. 3, 4). However, the limited causative factors were selected for modelling as a preliminary investigation, a few more like rainfall and earthquake will be considered in future research.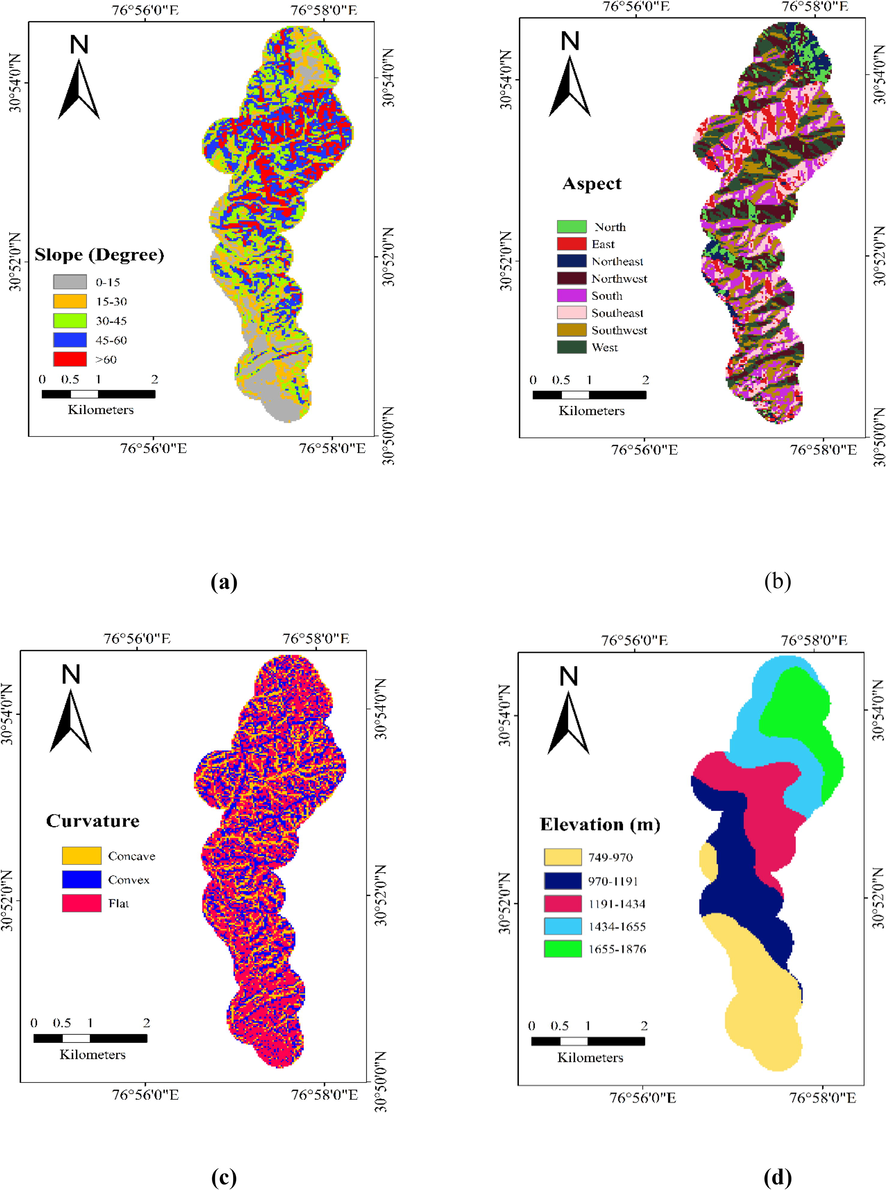
Landslide causative factors, a) slope, b) aspect, c) curvature, d) elevation.
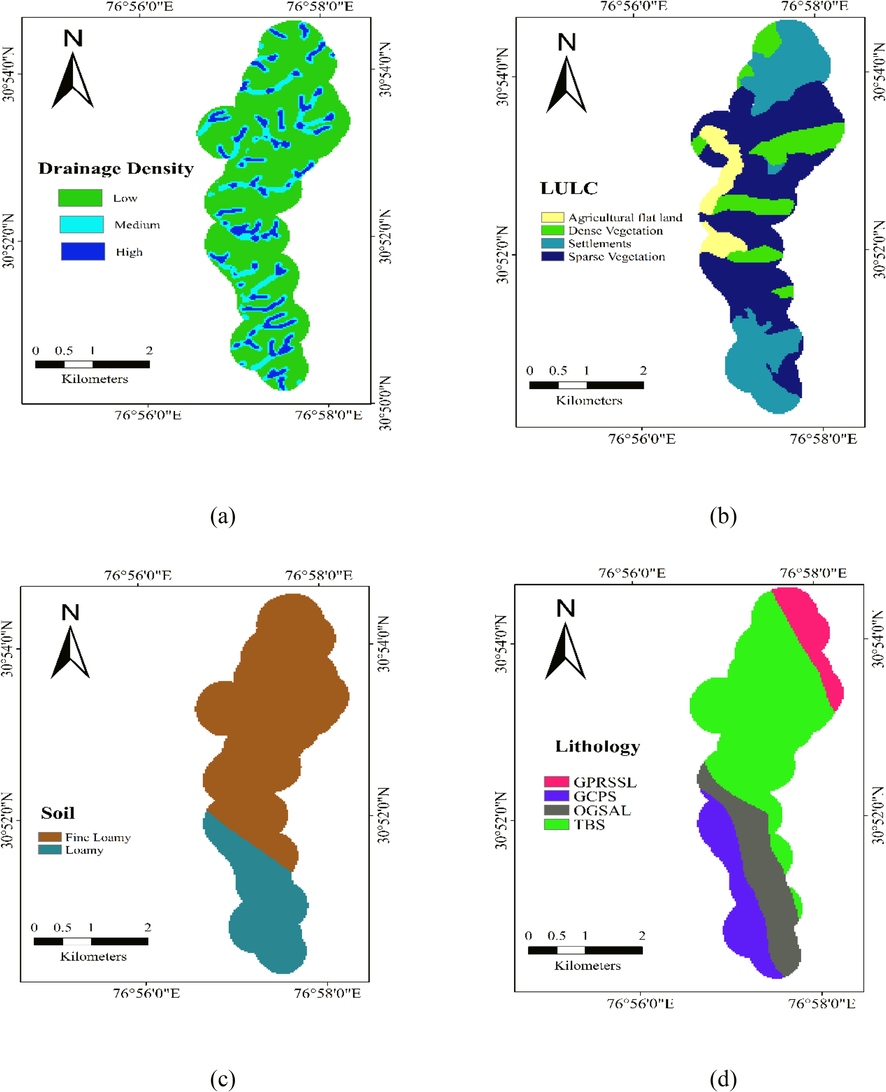
Landslide causative factors, a) drainage density, b) LULC, c) soil, d) lithology.
5.1 Slope
Slope angle controls its stability as well as the shear forces (Lee and Min, 2001). The slope map has been reclassified into 5 classes viz. 0–15°, 15°–30°, 30°–45°, 45°–60°, and >60° as shown in Fig. 3a.
5.2 Aspect
The slope facets orientation with respect to the North is known as aspect of the slope or slope aspect on which the effect of solar heat and air dryness depends which may affect moisture in the slope forming materials (Yalcin, 2008). The slope aspect is classified into nine classes as mentioned in Fig. 3b.
5.3 Curvature
The shape of the surface due to intersection of random planes is known as curvature (Ramesh and Anbazhagan, 2015). The shear forces depend upon the shape of the surface of slope. Drainage (inflow and outflow) on the slope surface is also under the control of the slope surface. Hence, the curvature map was classified into three classes as shown in Fig. 3c.
5.4 Elevation
Elevation map of the study area has been delineated from DEM using 30 m contour interval which has been categorized into five classes’ viz. 749–970, 970–1191, 1191–1434, 1434–1655, 1655–1876 m above sea level as shown in Fig. 3d. Create fishnet tool has been adopted to generate elevation map in ArcGIS. Elevation of a terrain is a major landslide causative factor which has to be considered for LSZ mapping (Kamp et al., 2008).
5.5 Drainage density
Drainage density is another major factor which controls weathering and erosion of the slope and the drainage pattern of the region follows the orientation of discontinuities. Ground water conditions of the area affect the drainage density. The drainage density map has been developed using Eq. (1) and categorized into three classes as shown in Fig. 4a.
5.6 LULc
The LULC map has been considered by many researchers as a landslide causative factor (Lee et al., 2013). The activities like construction of (road, house, bridge, and dam), deforestation, expansion of agriculture lands are various evidences which can make any region landslide prone. The LULC map has been categorized into four classes as shown in Fig. 4b viz. agricultural flat land, dense vegetation, settlements, and sparse vegetation.
5.7 Soil
Two types of soils are identified in the study area viz. fine loamy and loamy soil as shown in Fig. 5c. Fine loamy soil covers maximum area 73.78% while loamy soil occupies 26.21% selected region. The fine loamy soil area is more affected due to landslides in present area.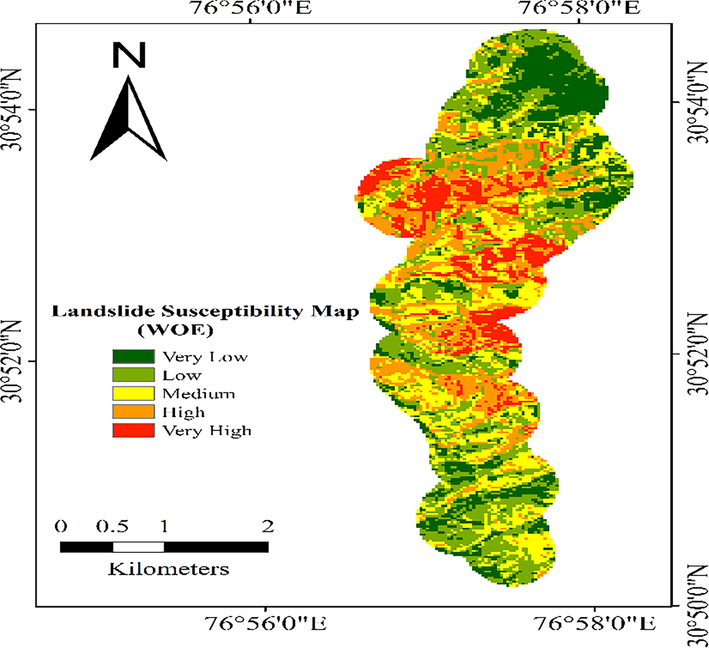
Landslide susceptibility zonation map based on WOE.
5.8 Lithology
The erosion and weathering of the slopes is mainly dependent on its lithology depicting about the rock types present in any region. Lithology map has been extracted from the geological database available from Geological Survey of India (GSI) by NRSC at scale 1:50,000. The lithology map has been classified as grey, purple, red, sandstone, shale, limestone (GPRSSL), gritty clay and purple sandstone (GCPS), olive green shale and argillaceous limestone (OGSAL), and thickly bedded sandstones (TBS).
The short forms of the lithology classes were assigned to each class to easily represent them on a thematic map as shown in Fig. 4d.
6 Landslide susceptibility zonation analysis
The percentages of landslides have been determined in each LCF’s class to calculate weights for each factor class to from statistical analysis using WOE, IVM, and FR. The present study pertains to developing of landslide susceptibility zonation (LSZ) map using WOE, IVM, and FR statistical techniques to compare impact of individual landslide causative factor class for triggering landslides.
6.1 Weight of evidence
Primarily, the WOE method has been developed for the mineral potential assessment and the former is generally governed by the Bayesian probability approach (Bonham-Carter, 1994). This method of analysis is usually simple and comparatively consumes less time, thus making it highly suitable to be applied in GIS packages. The calculations for the weight for each landslide predictive factor (Z) have been made based on the presence or absence of landslides (R) within an area.
The overall spatial association between the landslides and the predictable variable is generally presented through the magnitude of the contrast. The calculated weights as per Eq. (4) were attributed to each class of LCF in the form of a thematic maps which were then summed up (Eq. (5)) in Arc GIS to delineate LSZ map.
6.2 Information value method
The causative factors for landslides occurrence in the past will initiate landslides in future in that region. By following the above given assumption, weight of each factor class can be determined based on landslide densities in each class of a LCF. The weight value is dependent on the landslide density in each class of LCF (Lin and Tung, 2004). Van Westen (1993) modified the current approach proposed by Yin and Yan (1988). This method aims to find the probability of slope failure occurrence based on the relationship between landslide and LCF by using Eq. (6).
6.3 Frequency ratio
The relationship between landslide and LCF is known as FR. Based on the landslide density in each LCF class, FR value has been evaluated. The percentages of landslides and each LCF class in which landslides are present were considered to determine FR values (Poudyal et al., 2010).
SR is the landslide ratio; CR is the class ratio.where,
The principal of conditional probability is working behind the FR method. Two possibilities were considered like FR > 1 and FR < 1showing strong and weak correlation respectively. The finalized FR weights were attributed to each thematic map of LCF through lookup tool. Then, Summation of all thematic maps having FR values was performed to evaluate LSI value using Eq. (11).
7 Results and discussions
The increase in the landslide intensity along Parwanoo – Kasauli stretch of the selected area because of human interference and natural factors is affecting lives and infrastructure. An initiative has been taken for focusing on delineation of the area in terms of landslide susceptibility zonation by employing most advanced methodologies. The WOE, IVM, and FR methods have been utilized for LSZ mapping in the current study (Table 1).
S. No.
Factors
Class
Causative factor pixel count
Landslide pixel count
W+
W-
Wf
Slide ratio
Class ratio
FR
Ki
Qi
Ki/Qi
l(Ldi)
1
Aspect
North
716
0
0.000
0.051
−0.051
0
0.05
0
0.000
0.008
0.000
0.000
Northeast
613
0
0.000
0.044
−0.044
0
0.04
0
0.000
0.009
0.000
0.000
East
1147
18
0.603
−0.075
0.678
0.15
0.08
1.83
0.016
0.009
1.828
0.262
Southeast
2092
43
0.873
−0.272
1.145
0.35
0.15
2.39
0.021
0.009
2.394
0.379
South
2555
37
0.523
−0.161
0.684
0.3
0.18
1.69
0.014
0.009
1.687
0.227
Southwest
2446
22
0.047
−0.010
0.056
0.18
0.17
1.05
0.009
0.009
1.048
0.020
West
2628
3
−2.018
0.178
−2.196
0.02
0.18
0.13
0.001
0.009
0.133
−0.876
Northwest
2131
0
0.000
0.000
0.000
0
0.15
0
0.000
0.009
0.000
0.000
2
Curvature
Concave
2907
39
0.446
−0.155
0.601
0.32
0.2
1.56
0.013
0.009
1.563
0.194
Flat
7299
49
−0.246
0.204
−0.450
0.4
0.51
0.78
0.007
0.009
0.782
−0.107
Convex
4122
35
−0.011
0.004
−0.015
0.28
0.29
0.99
0.008
0.009
0.989
−0.005
3
Lithology
OGSAL
2225
8
−0.870
0.102
−0.972
0.07
0.16
0.42
0.004
0.009
0.419
−0.378
GCPS
3400
11
−0.976
0.177
−1.153
0.09
0.24
0.38
0.003
0.009
0.377
−0.424
TBS
4031
104
1.100
−1.537
2.638
0.85
0.28
3.01
0.026
0.009
3.005
0.478
GPRSSL
4672
0
0.000
0.395
−0.395
0
0.33
0
0.000
0.009
0.000
0.000
4
LULC
Dense Vegetation
2600
0
0.000
0.200
−0.200
0
0.18
0
0.000
0.009
0.000
0.000
Agricultural flat land
2300
8
−0.903
0.108
−1.011
0.07
0.16
0.41
0.003
0.009
0.405
−0.392
Sparse Vegetation
5500
96
0.710
−1.032
1.742
0.78
0.38
2.03
0.017
0.009
2.033
0.308
Settlements
3928
19
−0.574
0.153
−0.726
0.15
0.27
0.56
0.005
0.009
0.563
−0.249
5
Elevation (m)
749–970
3500
13
−0.838
−0.581
−0.257
0.11
0.24
0.43
0.004
0.009
0.433
−0.364
970–1191
3120
20
−0.292
−0.185
−0.108
0.16
0.22
0.75
0.006
0.009
0.747
−0.127
1191–1434
2700
77
1.201
1.127
0.074
0.63
0.19
3.32
0.029
0.009
3.322
0.521
1434–1655
2533
6
−1.288
−1.440
0.152
0.05
0.18
0.28
0.002
0.009
0.276
−0.559
1655–1876
2475
7
−1.110
−1.290
0.180
0.06
0.17
0.33
0.003
0.009
0.329
−0.482
6
Slope
0–15
2222
10
−0.646
0.084
−0.730
0.08
0.16
0.52
0.005
0.009
0.524
−0.280
15–30
2837
16
−0.420
0.081
−0.501
0.13
0.2
0.66
0.006
0.009
0.657
−0.182
30–45
3306
41
0.368
−0.143
0.511
0.33
0.23
1.44
0.012
0.009
1.445
0.160
45–60
3770
39
0.187
−0.076
0.263
0.32
0.26
1.21
0.010
0.009
1.205
0.081
>60
2193
17
−0.102
0.017
−0.119
0.14
0.15
0.9
0.008
0.009
0.903
−0.044
7
Drainage density
Low
9764
57
−0.386
0.521
−0.907
0.46
0.68
0.68
0.006
0.009
0.680
−0.167
Medium
2332
49
0.895
−0.330
1.226
0.4
0.16
2.45
0.021
0.009
2.448
0.389
High
2232
17
−0.120
0.021
−0.140
0.14
0.16
0.89
0.008
0.009
0.887
−0.052
8
Soil
Fine Loamy
9912
109
0.248
−0.996
1.244
0.89
0.69
1.28
0.011
0.009
1.281
0.108
Loamy
4416
14
−0.996
0.248
−1.244
0.11
0.31
0.37
0.003
0.009
0.369
−0.433
7.1 Weight of evidence
The aspect classes of east, southeast, south, and southwest showed more susceptibility to landslides having positive weights as compared to the other classes which all are having negative weights as given in Table 1. The concave class of curvature is having positive weight of 0.601 depicting that it is more susceptible than flat and convex class, both of which are having negative weights. In the concave class, landslide material converges into the narrow region at the base of the slope. The convergence combined with the cohesive nature of fine-grained soils creates a buttressing effect that slows soil movement and increases the stability of the hillside within the hollow. In the TBS class of lithology, the presence of landslides is more effective (2.6377) because of more bedding planes as compared to other lithology classes in the study area. The sparse vegetation class of LULC is more susceptible to landslides as compared to the Dense Vegetation, Settlements, and Agriculture flat land classes which all are having negative weights −0.200, −1.011, and −0.72628 respectively. Positive and greater weights 0.073, 0.151, and 0.180 for elevation classes 1191–1434, 1434–1655, and 1655–1876 respectively revealed that influence of landslide activities is more at higher elevation as compared to the low elevation in the study area. The slopes degrees ranging between 30 and 45 and 45–60 are more landslide prone having 0.262 and 0.511 weights respectively as compared to other slope classes which all are having negative weights. Maximum weight has been evaluated for medium class of drainage density showing that landslides are much prone to this class as compared to other classes. The fine loamy class of soil has been observed as more susceptible to landslides than loamy soil in the study area. The WOE based LSZ map has been classified into five classes as shown in Fig. 5.
7.2 Frequency ratio
The FR value for each class of LCF has been evaluated to further prepare final LSZ map by summing up these values. In case of aspect, the southeast class is highly susceptible (2.39) than all other classes. In case of curvature, the most critical class causing landslides is concave which have 0.013 wt which is greater than flat and convex class having 0.006 and 0.008 FR values respectively. TBS class of lithology is also more prone to slope failure activities having 0.258 FR values which is greater than other three classes. The sparse vegetated class of land use land cover is having higher FR weight of 0.017 as compared to dense vegetation, agriculture flat land, and settlements. Elevation classes ranging from 1191 to 1434, 1434–1655, and 1655–1876 m are having greater FR values i.e., 0.0285, 0.0023, and 0.002828 respectively than other classes. The slope classes ranging from 30 to 45 and 45–60 are more susceptible to landslides having greater FR values of 0.012 and 0.010 respectively as compared to other classes. In case of drainage density map of study area, medium class 0.021 was observed as more landslide prone as compared to the low 0.0058 and high 0.0076 drainage density class. The fine loamy class of soil in the study area has more FR value of 0.010 which is greater in comparison to the loamy class 0.003. The FR based LSZ map has been classified into five classes as shown in Fig. 6.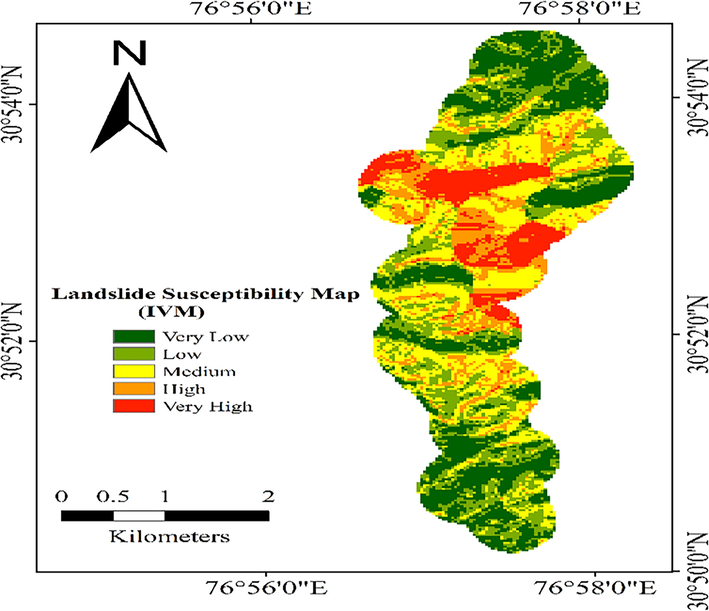
Landslide susceptibility zonation map based on FR.
7.3 Information value method
Slope aspect in the study area in west direction is less susceptible to landslides as compared to the other classes like east, southeast, south, and southwest which are having positive weights viz. (0.26199, 0.379187, 0.227091, and 0.020247). Further, it has been observed from the analysis that the concave shaped slope surface is more susceptible to slope failure activities as compared to flat and convex class of curvature having negative weights of −0.10679 and −0.00476 respectively. It has been observed that, the Thickly Bedded Sandstone (TBS) class of lithology is more susceptible to landslides as compared to other classes as it is having positive information weight of 0.477. The LULC class of sparse vegetation is more susceptible to landslides having information weight of 0.308. The elevation class of 1191–1434 m is more prone to landslides having positive information weight 0.521 while the other elevation classes have negative information weights. The slope degrees’ classes ranging from 30 to 45 and 45–60 are having positive information weights of 0.159 and 0.081 respectively while the remaining classes have negative information values. The medium class of drainage density is more susceptible to the slope failure activities as compared to the other classes of low and high drainage density having −0.167 and −0.051 respectively. The fine loamy class of soil (0.107) in the study area is more susceptible to landslides as compared to the loamy soil (−0.432) (see Fig. 7).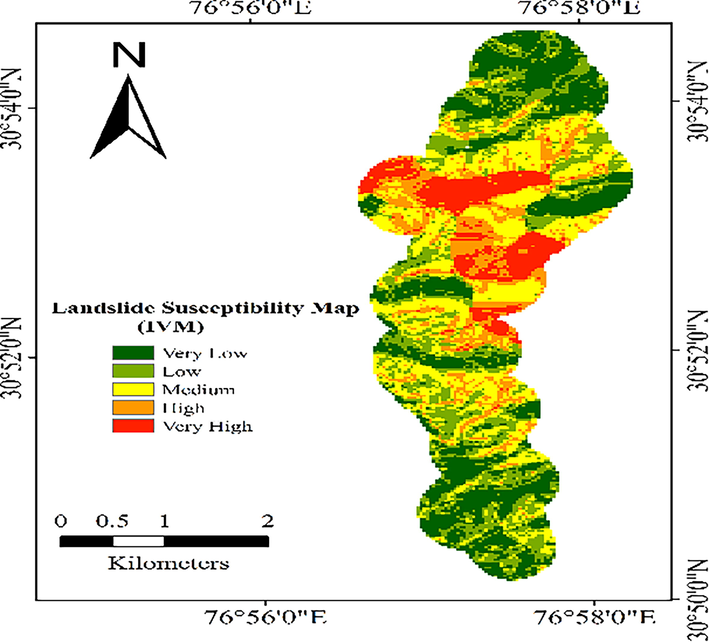
Landslide susceptibility zonation map based on IVM.
Minimal research work has been done in the current study area to identify various critical zones having slope failure potential using GIS based landslide susceptibility zonation techniques (Patra and Devi, 2015; Lakshmanan et al., 2017). But, the study presented in this paper has not been done by the previous researchers in the best knowledge of authors. However, the Bi-variate techniques like WOE, FR, and IVM consider the landslide as a dependent variable and causative factor as independent variable which is the drawback of the bi-variate methods due to independent nature of the maps of the landslide causative factors delineated in accordance to predict the landslide occurrence probability. The bivariate methods serve as the initial step to proceed for multivariate analysis while the multivariate approaches serve to evaluate the actual and potential landslide susceptibility (Kaur et al., 2017).
8 Validation of the model
The validation of LSZ map is essential to evaluate the effectiveness of the model applied for delineating LSZ map. Generally, two basic assumptions are there to validate LSZ maps viz. 1) High susceptible zone should have more slope failure occurrences, 2) Small area should be occupied by a high susceptible zone. This can be clearly seen in Fig. 8a and b.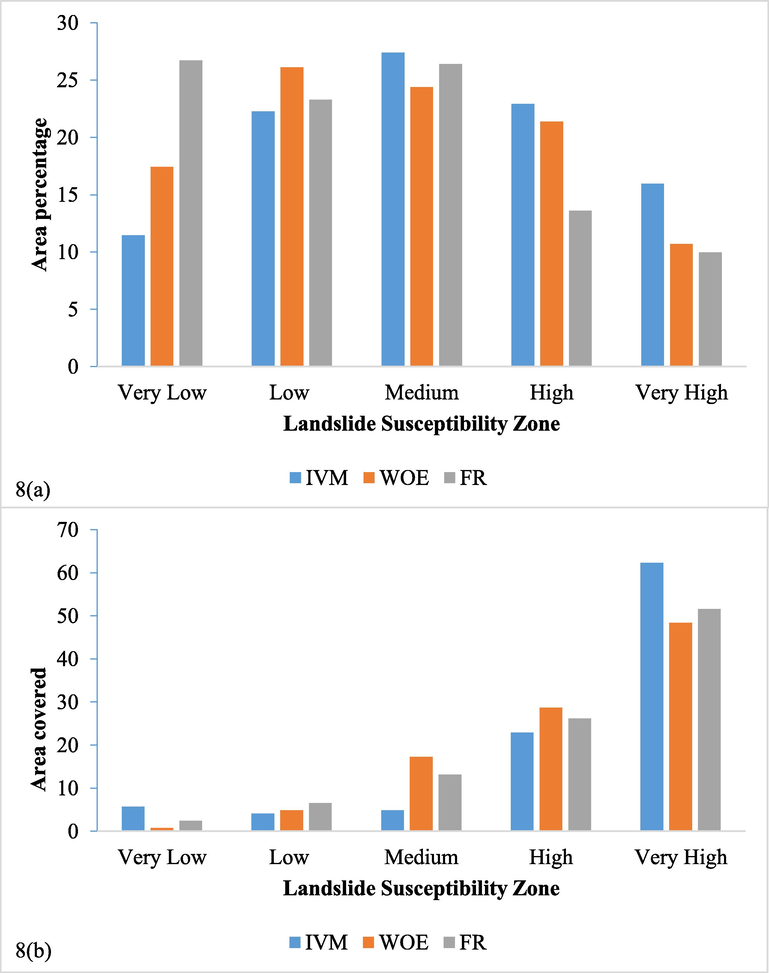
(a) Percentage of area occupied by susceptibility Zones (b) Area covered by landslides in each susceptible zone.
The validated map should justify the applied validation methods (Chung and Fabbri, 1999; Van Westen et al., 2003; Kayastha et al., 2013). The high and very high susceptibility zones of the study area have been verified through field visits based on the LSZ maps by matching identified landslides in landslide inventory. The signs of slope failure activities were found more in high and very high susceptibility zones.
In the scientific world, a landslide susceptibility map without validation makes little sense (Irimuș et al., 2017; Lei et al., 2020a,b). As a result, validation of the landslide susceptibility model is critical in determining the degree of modelling accuracy utilizing various validation methodologies (Saaty, 2008). The area under curve method was applied to validate the LSZ maps by evaluating their accuracy, where the success rate curve revealed about either the model is good fitted which can be adopted by tabulating the landslide inventory with the LSZ map in ArcGIS (Chung and Fabbri, 1999). According to Chen et al. (2016), if the Area Under Curve value is obtain 0.5 and 1, the model is considered well-fit. The AUC approach is proven to produce better outcomes in prediction analysis (Prasath et al., 2019). The trapezium method was used to calculate the AUC values (Mezughi et al., 2011; Achour et al., 2018). The reclassification of the LSZ maps has been done into 100 equal classes which were then combined with the landslide inventory. The cumulative percentage of landslides in the cumulative area was determined and plotted against each other using MS excel tool. The success rates of the applied models are as 76.27, 78.20, and 76.09 for WOE, FR, and IVM models respectively showing that FR model is more accurate as mentioned in Fig. 9.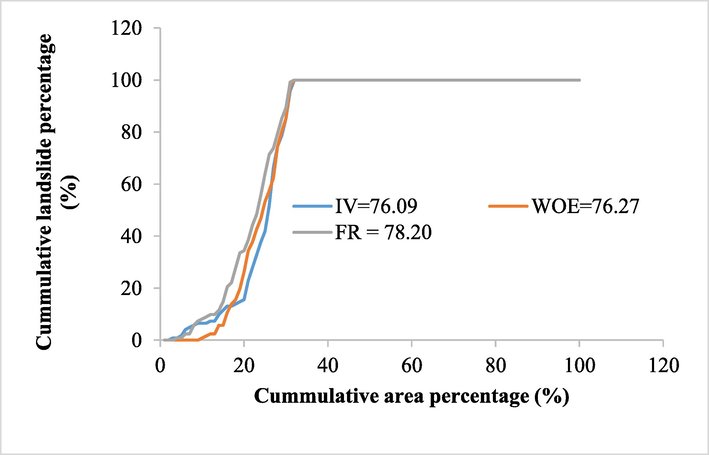
Success rate curve based on WOE, FR, and IVM.
9 Conclusion
The landslide susceptibility analysis demands consideration of the landslide causative factors in an area. The eight major LCF’s viz. “slope, aspect, curvature, elevation, lithology, LULC, drainage density, and soil” have been selected for LSZ mapping using WOE, FR, and IVM techniques. The final LSZ maps were classified into five susceptibility zones: “very low, low, medium, high, and very high” in ArcGIS using reclassification tool. The success rate for WOE, FR, and IVM models were determined as 76.27, 78.20, and 76.09 respectively depicting that FR model based LSZ map is more accurate. These techniques adopted for evaluating landslide susceptibility index are the usual practice to check their feasibility in the untouched study area. In future, a few more multivariate approaches can be implemented based on which micro zonation of the study area will be considered. As the Kasauli-Parwanoo road stretch is the shortest route than the existing National Highway −5 via Dharampur. An importance should be given to this route regarding its widening for which, presently generated LSZ will help for constructional and developmental activities in the study area.
Acknowledgement
“The authors would like to extend their sincere appreciation to the Deanship of Scientific Research at King Saud University for its funding this Research Group No. (RG-1441-371)”’.
Declaration of Competing Interest
The authors declare that they have no known competing financial interests or personal relationships that could have appeared to influence the work reported in this paper.
References
- Assessment of landslide susceptibility zonation using frequency ratio and statistical index: a case study of Al-Fawar basin, Tartous, Syria. Int. J. Environ. Sci. Technol. 2021:1-20.
- [Google Scholar]
- Spatial modeling and susceptibility zonation of landslides using random forest, naïve bayes and K-nearest neighbor in a complicated terrain. Earth Sci. Inf.. 2021;14(3):1227-1243.
- [Google Scholar]
- GIS-based spatial prediction of debris flows using LR and FR models for Zezere River basin and its surrounding area, Northwest Covilha, Portugal. Arab. J. Geosci. 2018
- [Google Scholar]
- On the causes of landslides: Human activities, perceptions and natural processes. Environ. Geol. Water Sci.. 1992;20(3):165-179.
- [Google Scholar]
- Landslide hazard evaluation and zonation mapping in mountainous terrain. Eng. Geol. 1992;32:69-277.
- [Google Scholar]
- A Filed Manual for Landslide Investigations. New Delhi, India: Department of Science and Technology; 2007.
- Application of geospatial technology and information value technique in landslide hazard zonation mapping: a case study of Giri Valley, Himachal Pradesh. Disaster Adv.. 2013;6:38-47.
- [Google Scholar]
- GIS based Landslide Hazard Zonation Mapping by Weighted Overlay Method on the Road Corridor of North Sikkim Himalayas. India Res. Square 2020
- [Google Scholar]
- Landslide Susceptibility Mapping and Assessment Using Geospatial Platforms and Weights of Evidence (WoE) Method in the Indian Himalayan Region: Recent Developments, Gaps, and Future Directions. ISPRS Int. J. Geo-Inf.. 2021;10:114.
- [Google Scholar]
- A comparison of information value and logistic regression models in landslide susceptibility mapping by using GIS. J. Environ. Earth Sci. 2016
- [CrossRef] [Google Scholar]
- Evaluation of different boosting ensemble machine learning models and novel deep learning and boosting framework for head-cut gully erosion susceptibility. J. Environ. Manage. 2021
- [CrossRef] [Google Scholar]
- Landslide susceptibility modeling using integrated ensemble weights of evidence with logistic regression and random forest models. Appl. Sci.. 2019;9:171.
- [Google Scholar]
- Deep learning and boosting framework for piping erosion susceptibility modeling: spatial evaluation of agricultural areas in the semi-arid region. Geocarto Int. 2021
- [CrossRef] [Google Scholar]
- Evaluation efficiency of hybrid deep learning algorithms with neural network decision tree and boosting methods for predicting groundwater potential. Geocarto Int. 2021
- [CrossRef] [Google Scholar]
- Probabilistic prediction models for landslide hazard mapping. Photogram. Rems. 1999;65(12):1389-1399.
- [Google Scholar]
- Landslide types and processes, special report. Transp. Res. Board, Natl. Acad. Sci.. 1996;247:36-75.
- [Google Scholar]
- Landslide characteristics and slope instability modelling using GIS, Lantau Island, Hong Kong. Geomorphology. 2002;42:213-228.
- [Google Scholar]
- Estimating rainfall threshold and temporal probability for landslide occurrences in Darjeeling Himalayas. Geosciences 2020
- [CrossRef] [Google Scholar]
- Global fatal landslide occurrence from 2004–2016. Nat. Hazards Earth Syst. Sci.. 2018;18(8):2161-2181.
- [Google Scholar]
- Girma, F.; Raghuvanshi, T.K.; Ayenew, T.; Hailemariam, T. Landslide hazard zonation in Ada Berga district, Central Ethiopia – a GIS based statistical approach. J Geom. 2015. 9 (i):25–38.
- Hansen, A. Landslide hazard analysis. In: Brunsden & Prior (Editor), Slope Instability, John Wiley & Sons, New York, 1984, 523-602.
- Landslide susceptibility assessment in Almas basin by means of the frequency rate and GIS techniques. Geograp. Tech.. 2017;12(2)
- [Google Scholar]
- Study of landslides in Mandakini river valley, Garhwal Himalaya, India. GAIA. 2001;16:87-95.
- [Google Scholar]
- GIS-based landslide susceptibility mapping for the 2005 Kashmir earthquake region. Geomorphology. 2008;101(4):631-642.
- [Google Scholar]
- A comparative study of conventional, ANN black box, fuzzy and combined neural and fuzzy weighting procedures for landslide susceptibility zonation in Darjeeling Himalayas. Eng. Geol.. 2006;85:347-366.
- [Google Scholar]
- Comparative evaluation of various approaches for landslide hazard zoning: a critical review in Indian perspectives. Spat. Inf. Res.. 2017;25:389.
- [Google Scholar]
- Application of the analytical hierarchy process (AHP) for landslide susceptibility mapping: a case study from the Tinau watershed, west Nepal. Comput Geosci.. 2013;52:398-408.
- [Google Scholar]
- Evaluation of a preliminary satellite-based landslide hazard algorithm using global landslide inventories. Nat. Hazards Earth Syst. Sci. 2009;9:673-686.
- [Google Scholar]
- Lakshmanan, K.; Jina. M.; Jayabalan, K; Kumar, M. Macro scale (1:50,000) landslide susceptibility mapping in parts of Kullu and Mandi districts, Himachal Pradesh. Journal of Engineering Geology. 2017. Volume XLII, Nos. 1 & 2.
- Application of data-driven evidential belief functions to landslide susceptibility mapping in Jinbu, Korea. Catena. 2013;100:15-30.
- [Google Scholar]
- Statistical analysis of landslide susceptibility at Yongin, Korea. Environ. Geol.. 2001;40(9):1095-1113.
- [Google Scholar]
- Lei, X.; Chen, W.; Mohammadtaghi. A.; and Saeid. J.; Narges. K.;Hejar S.; Romulus. C.; Himan, S.; Ataollah. S.; Amir, M. GIS-Based Machine Learning Algorithms for Gully Erosion Susceptibility Mapping in a Semi-Arid Region of Iran, Remote Sensing, 2020a 12:15, https://www.mdpi.com/2072-4292/12/15/2478, 2072-4292.
- Performance Evaluation of GIS-Based Artificial Intelligence Approaches for Landslide Susceptibility Modeling and Spatial Patterns Analysis. ISPRS Int. J. Geo-Inf. 2020
- [CrossRef] [Google Scholar]
- Urban flood modeling using deep-learning approaches in Seoul, South Korea. J. Hydrol. 2021
- [CrossRef] [Google Scholar]
- Debris flows modeling using geo-environmental factors: developing hybridized deep-learning algorithms. Geocarto Int. 2021
- [CrossRef] [Google Scholar]
- A GIS-based potential analysis of the landslides induced by the Chi-Chi earthquake. Eng. Geol.. 2004;71:63-77.
- [Google Scholar]
- Medlicott, H. B. In: Manual of the Geology of India. (HB Medlicott and WT Blanford) (1879-1887). Government of India, Calcutta, 1879, 524.
- Landslide Hazard zonation and slope instability assessment using optical and InSAR data: a case study from Gidole town and its surrounding areas, southern Ethiopia. Remote Sensing Land. 2019;3(1):1-14.
- [Google Scholar]
- Landslide Susceptibility Assessment using Frequency Ratio Model Applied to an Area along the E-W Highway. Am. J. Environ. Sci.. 2011;1:43-50.
- [Google Scholar]
- Susceptibility assessment of rainfall induced debris flow zones in Ladakh-Nubra region, Indian Himalaya. J. Earth Syst. Sci.. 2020;129:30.
- [Google Scholar]
- Patra, P.; Devi. R. Landslide Hazard and Mitigation Strategy in the Himachal Pradesh. Trans. Institute. Indian Geographers. 2015. ISNN 0970-9851
- Landslide susceptibility maps comparing frequency ratio and artificial neural networks: a case study from the Nepal Himalaya. Environ Earth Sci.. 2010;61:1049-1064.
- [Google Scholar]
- Frequency ratio modelling using geospatial data to predict Kimberlite Clan of rock emplacement zones in Dharwar Craton, India. Int. J. Appl. Earth Observ. Geoinf. 2019
- [CrossRef] [Google Scholar]
- Slope stability susceptibility evaluation parameter (SSEP) rating scheme—an approach for landslide hazard zonation. J. Afr. Earth Sci.. 2014;99:595-612.
- [Google Scholar]
- Landslide susceptibility assessment along Kohli hills Ghat road section India using frequency ratio, relative effect and fuzzy logic models. Environ. Earth Sci.. 2015;73(12):8009-8021.
- [Google Scholar]
- Decision making with the analytical hierarchy process. Int. J. Serv. Sci.. 2008;1(1):83-98.
- [Google Scholar]
- Rainfall thresholds for the initiation of landslide at Lanta Khola in north Sikkim, India. Nat Hazards. 2010;52:31-42.
- [Google Scholar]
- Influence of Shannon’s entropy on landslide-causing parameters for vulnerability study and zonation—A case study in Sikkim, India. Arab J Geosci.. 2012;5:421-431.
- [Google Scholar]
- Application of geographic information systems to landslide hazard zonation. ITC Publication, Int. Inst. Aerospace Earth Resources Survey, Enschede. 1993;15:245.
- [Google Scholar]
- Use of geomorphological information in indirect landslide susceptibility assessment. Nat. hazards. 2003;30(3):399-419.
- [Google Scholar]
- Landslide hazard zonation: A review of principles and practice. Natural hazard: United Nations Educational, Scientific and Cultural Organization; 1984. p. :63.
- Varnes, D. J. Slope movement types and processes. In: Schuster RL, Krizek RJ (eds) Special report 176: Landslides: analysis and control. Transportation and Road Research Board, National Academy of Science, Washington D. C, 1978, 11–33.
- GIS-based landslide susceptibility mapping using analytical hierarchy process and bivariate statistics in Ardesen (Turkey): comparisons of results and confirmations. Catena. 2008;72:1-12.
- [Google Scholar]
- Yin, K. L.; Yan, T. Z. Statistical prediction model for slope instability of metamorphosed rocks. In: Bonnard C (ed.) Proc., fifth international symposium in landslides, Lausanne, A. A. Balkema, Rotterdam, 1988, 2, 1269-1272.


