

Translate this page into:
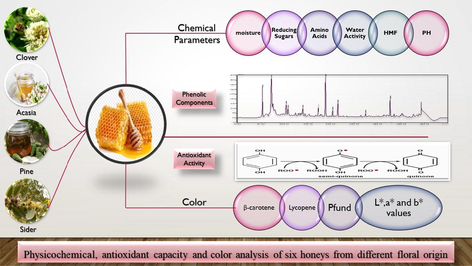
Physicochemical, antioxidant capacity and color analysis of six honeys from different origin
⁎Corresponding author. kas00@fayoum.edu.eg (Khaled A. Selim)
-
Received: ,
Accepted: ,
This article was originally published by Elsevier and was migrated to Scientific Scholar after the change of Publisher.
Peer review under responsibility of King Saud University.
Abstract
Abstract
Six honey samples from different origin were examined and compared for their physicochemical proprieties (pH, moisture content, TSS, water activity, amino acid and refractive index), antioxidant activity (total phenolic and total flavonoids) and antioxidant content. In addition, colore intensity ABS635, Hunter color values, lycopene, β – carotene and HMF were also studed. (Clover honey, Egypt) was the most acidic (pH 3.26). (Sider honey, Yemen) and (Sider, Saudi) showed the lowest moisture content (16.81 and 16.91) respectively. Among all the samples, acacia honey showed the lowest HMF content (3.6 mg/kg) while sider honey-Saudi recorded the highest HMF content (22.47 mg/kg). All the tested samples showed high content of phenolic and flavonoid compounds. Out of the six tested honey, Sider-Saudi honey recorded the highest phenolic and flavonoid content and color intensity flowed by pine honey, Germany). The results of the antioxidant proprieties of the different honey samples as assed by DPPH method showed strong positive correlation between the antioxidant activity, the polyphenolic content and the color of the honey. The darker honeys (sider honey, Saudi and pine honey, Germany) recorded higher antioxidant activity.
Keywords
Honey
Phenolic content
Antioxidant activity
Color intensity

1 Introduction
Honey is a natural supersaturated sugar solution produced by honeybees. the major constituents in honey are carbohydrates (glucose, fructose and sucrose). In addition, honey also contains different minor compounds such as pigments (carotenoids and anthocyanins), polyphenolic compounds (phenolic acids, flavonoids), amino acids, vitamins (C and E), enzymes, and organic acids and minerals. These components give honey the functional properties in the human body minor constituents gives the honey (Saxena et al., 2010; Djebli et al., 2020).
Man has used honey since ancient times in traditional medicine (skin ulcers, asthma and infected wounds). as for food and in preserving food from spoilage delaying deterioration and preserving the color demolishing of foods by light (National honey board, 2003; Kücük et al., 2011; Meda et al., 2005). Honey could be used as a functional food because of its biological properties (Kolayli et al., 2020, Gomes et al., 2010).
There has been an interest in adding natural antioxidants to food for the role it played in resisting oxidative damage of fat and preventing free radicals forming inside the body which protecting the body from the risk of numerous disease (The National Honey Board, 2003).
It was shown in several studies that honey contains a wide range of constituents which had antioxidant activity, such as carotenoids, flavonoids, phenolic acids, vitamins and enzymes which have encouraging effect in the curing of some chronic illness. The presence and quantity of these ingredients in honey depends on many factors, which include the geographical location, floral source, climate, entomological source, season and processing of honey (Pauliuc et al., 2020; Baltrusaityte et al., 2007). A positive relationship between the honey color, which is mainly refer to the presence of different pigments and its antioxidant potential. It was reported that the darker colored honey had higher total phenolic content than the light one and consequently provide higher antioxidant capacities (Bertoncelj et al., 2007; Alves et al., 2014).
Interest in investigating the antioxidant potentials of honeys and analysing their phenolic and flavonoids compounds was increased (Gül and pehlivan, 2018; Can et al., 2015). The honeys produced from mountains with dry and hot climate (sider honey) usually darker and have lower moisture content than the other honeys. The purpose of the current study is to investigate the physical and chemical properties and antioxidant activities six different honey types collected from different botanical origin and also to study their possible interdependence.
2 Experiments
2.1 Honey samples and classification
Six different types of floral honey samples (about 300 g for each) were selected for the present investigation. The honey samples were collected and ported to Troisdorf University, Germany. The information concerning local name, location of collection, botanical data were presented in Table 1. Botanical classification was achieved when the pollen spectrum contained > 455 of the corresponding dominant pollen according to Louveaux et al. (1978). The pollen was studied a Motic microscope (Motic, Xiamen, China).
Samples
Local name
Dominant pollen
Production aria
Sample 1
Acacia, Germany
Robinia pseudoacacia L.
Nurnberg, Germany
Sample 2
El-sider, Libya
Ziziphus Lotus L.
Cyrene, Libya
Sample 3
Clover, Egypt
Trifolium alexandrinum L.
Fayoum, Egypt
Sample 4
Sider, Yemen
Ziziphus Spina-christi L.
Hadramout, Yemen
Sample 5
Pine Germany
Pinus halepensis L. Pinus brutia
Munchin, Germany
Sample 6
Sider Saudi Arabia (KSA)
Ziziphus Spina-christi L.
South, Saudi Arabia
2.2 Chemicals and reagents
Ascorbic acid, catechin, 2,2- diphenyl-1-picrylhydrazyl (DPPH), Folin–Ciocalteu’s reagent, standard phenoilc acids and amino acids were purchased from Sigma-Aldrich (St. Louis, Mo., U.S.A.). Methanol, ethanol, hexane and acetone were purchased from Merck (Darmstadt, Germany). Aluminum chloride, Sodium carbonate, sodium hydroxide and sodium nitrite (NaNO2) were purchased from Merck (Darmstadt, Germany). All chemicals used were of analytical grade.
2.3 Water activity
The water activity of the samples was determined using aw meter (Novasina Lab Touch-aw meter, Novasina AG, Neuheimstrasse 12, CH 8853 Lachen, Switzerland) according to (Chirife, et al., 2006).
2.4 Moisture, sugar and Hydroxymethyl furfural content (HMF)
The moisture content, Sugar content (fructose, glucose and sucrose and refractive indices of honey samples were measured according to (AOAC, 1990).
Hydroxymethyl furfural (HMF) was determined using UV spectrometric method described by White (1984) and calculated using the following equation:
HMF = [ (A284-A336) / (sample wight)] × 74.87
The pH value was measured using a pH meter (Toledo AL20, Mettler Toledo Group, 8603 Schwezenboch, Switzerland) for a 10% (w/v) solution of honey prepared in milli Q water.
2.5 Total phenolic and flavonoids content
Total phenolic content of the investigated samples was measured by Folin–Ciocalteu method as described by (Singleton, et al., 1999). The total phenolic content was calculated using gallic acid standard curve (0–200 mg/l; Y = 0, 0014X + 0.0338; R2 = 0.9935). Flavonoids content was determined using AlCl3 method (Barros et al., 2007) The concentration was calculated as mg of (+)-catechin equivalents (CEs) /kg honey using (+)-Catechin was used to calculate the standard curve (20–100 µg/ml).
2.6 Carotenoids determination
Total Carotenoids and Lycopene was determined according to Boussaid et al. (2018) using Beta-carotene for the calibration curve.
2.6.1 Color intensity: ABS635nm
Five grams of each honey sample was diluted with distilled water to 50% (w/v) and homogenized. The solution was centrifuged at 3200 rpm for five minutes and the absorbance was measured at 635 nm. The color intensity was determined using the Pfund scale (Pfund HI, Hanna Instruments, USA) after conversion of the absorbance values: mm Pfund = −38.70 + 371.39 × Abs (White, 1984; Ferreira et al., 2009). The pfund scale is ranged from < 9 for water white color to > 114 for dark Amber color. The color value of the honeys (CIE L*a*b*) were determined using a hunter spectrometer (CR-400, Konica Minolta, Tokyo, Japan).
2.7 Determination and identification of free amino acids
The determination and identification of FAA in the investigated honey samples was done by High Performance Liquid Chromatography according to the procedure of Pawlowska and Armstrong (1994).
2.8 Recommended procedures for analysis of of phenolic compounds
Extraction was carried out as described previously (Yao et al., 2004). Honey samples (25–50 g) were dissolved in 250 ml of distilled water and the pH of the solution was adjusted to pH 2.0. sugars and other polar compounds of honey solution were removed by filtration through the column with Amberlite XAD- 2 resin (Supelco, Bellefonte, PA, USA). The phenolic compounds were eluted from the sorbent with methanol and the methanol extracts were dried under reduced pressure at 35 °C in a Speed Vac Concentrator, SPD111V 230 (Thermo scientific, USA) The residue was re-dissolved in methanol to a known final concentration and stored at-80 °C until further analysis.
2.8.1 HPLC analysis of phenolic compounds
HPLC analysis of the phenolic extracts was carried out as described by (Baltrusaityte et al., 2007): L C 10 AD HPLC eluent pump (Shimadzo, Kyoto, Japan), DAD SPDM10 AVP, UV–Vis SPD 10AVP detectors (Shimadzo, Kyoto, Japan) and LCMS 2010 EV Mass spectrometer. The time of HPLC run was over 45 min. UV–Vis detector was operating at 254 nm /280 nm wavelength. Mass spectra of phenolic compounds were scanned with ion trap MS after electrospray ionization (ESI) in negative and positive mode (Yao et al., 2004).
2.8.2 Determination of antioxidant content
The antioxidant content calculated as ascorbic acid equivalent antioxidant content (AEAC) was determined using the method of Meda et al. (2005) using DPPH solution and the absorbance was measured at 517 nm using a spectrophotometer. the mean value of absorbance (triplicate) was expressed as mg of (AEAC) /100 g of honey.
2.8.3 Determination DPPH radical scavenging of the tested honey samples
The free radical scavenging activity (RSA) was evaluated according to the method of Brand-Williams et al. (1995) using Jenway Genova UV/vis Spectrophotometer (HS service GmbH, Switzerland). The absorbency of the remaining DPPH was determined at 515 nm. The extract concentration providing 50% of radicals scavenging activity (SC50) was calculated by interpolation from the graph of RSA percentage against extract concentration.
3 Results and discussion
3.1 pH value of honey samples
The results in Table 2 summarized the physiochemical analysis of the investigated honey samples. All of the honey samples analyzed were found to be acidic in character. Their pH values ranged from 3.26 to 4.01. The pH of the honeys is correlated with its storage stability and microorganism’s growth (Alves et al., 2014). The highest pH values were observed for sider honey from KSA (4.91). The high acidity of honey could be attributed to the fermentation of sugar into organic acids, in addition to the presence of inorganic ions such as phosphate and chloride ions which are responsible for the stability of honey’s against microbial spoilage (Ahmida et al., 2013). Our results were within the limit that indicated the freshness of the honey samples and comparable with those previously reported by other researchers (Feás et al., 2010; Alves et al., 2014). The low pH value of the honey could reflect its ability to inhibit the microorganism’s growths. The pH values of Algerian, Brazilian, Spanish, Malaysian, Indian and Turkish honeys have been found to vary between, 3.10 to 5.01, respectively (Saxena et al., 2010; Moniruzzaman et al., 2013). The variation in the pH among the honey samples could be returned to the plant floral types. * Rrefractive index, ** Total soluble solids
CharacteristicsSamples
Water activity
Moisture Content
pH
R.I.*
Total reducing sugars (%)
Sucrose (g/100 g)
HMF (mg/kg)
TSS**
Acacia, Germany
0.561 ± 0.01a
18.83 ± 1.02a
4.10 ± 0.02b
1.4863
67.57 ± 1.98c
3.82 ± 0.61b
3.69 ± 0.21d
81.06 ± 1.52a
EL-Sider Libya
0.504 ± 0.01b
17.52 ± 0.85b
4.87 ± 0.04a
1.4935
69.29 ± 2.45b
2.07 ± 0.08c
11.28 ± 0.53b
80.27 ± 2.05ab
Clover Egypt
0.559 ± 0.02a
19.1 ± 0.94a
3.26 ± 0.02c
1.4908
66.81 ± 2.11c
6.38 ± 0.57a
10.94 ± 0.94bc
78.57 ± 1.61b
Sider Yemen,
0.554 ± 0.00a
16.81 ± 0.75b
4.66 ± 0.05ab
1.4995
71.245 ± 2.81a
2.15 ± 0.44c
12.82 ± 1.03b
81.64 ± 1.92a
Pine, Germany
0.565 ± 0.01a
19.30 ± 0.87a
4.05 ± 0.03b
1.4930
66.57 ± 2.03c
2.17 ± 0.42c
9.37 ± 0.58c
78.71 ± 2.17b
Sider, Saudi Arabia
0.543 ± 0.02a
16.91 ± 0.72b
4.91 ± 0.06a
1.4990
70.95 ± 2.47a
2.43 ± 0.37c
22.47 ± 1.78a
81.41 ± 2.35a
3.2 Water activity
The water activity is an important factor, which governs the food stability by preventing or limiting microbial growth. The osmotolerant yeasts are able to grow at a minimal water activity of 0.6 (Chirife et al., 2006). The water activity of the investigated honey samples varied from 0.504 to 0.565 (Table 2). El-sider Haney from Libya recorded the lowest aw value while, pine honey found to have the highest aw value among the investigated samples. Our results are in agreement with those found for Greek honey (aw 0.53 to 0.67) and lower than the Indian and Brazilian honeys for which the aw values ranged from 0.57 to 0.70 and 0.67 to 0.77 respectively, (Saxena et al., 2010; Silva et al., 2013).
3.3 Moisture content
The moisture content of honey is very important factor, controlling its storage stability and granulation during storage. The high moisture content may lead to fermentation of honey during storage which gives the honey sour taste (Kucuk et al., 2007 and Ahmida et al., 2013). Moisture content (%) in the investigated samples ranged from 16.81 to 19.3. The highest moisture contents were recorded for Pine honey (Pinus halepensis L.) from Germany and Clover honey (Trifolium alexandrinum L) from Egypt which recorded moisture contents (%) of 19.10 and 19.30 respectively. Moisture content (%) of Sider honey from Yemen was 16.81 ± 0.75 which was the lowest among all the investigated samples which gives it longer shelf life during storage. The results also showed that all tested honeys recorded moisture contents <20%, which is the maximum limit for the moisture content according to the Codex standard for honey quality (Codex Alimentarius, 2001). The results showed varietal differences in moisture contents among the analysed samples. These differences could be due to various factors such as degree of maturity in hive, harvesting season, environmental condition and manipulation by beekeepers during harvest period (Alvarez-Suarez et al., 2010). The moisture levels of the analyzed samples were similar to those reported by other workers for different honey types including Malaysian honey 12.79% to 22.32% (Moniruzzaman et al., 2013), Indian honeys 18.7% to 21.8% and Turkish honeys (Kucuk et al., 2007) and Romanian honeys 14.3 to 20.2% (Marghitas et al., 2010).
3.4 HMF content of honey samples
HMF is important indicator in evaluating the freshness and the purity of the honey (Khalil et al., 2012). It is usually found in a very small amounts in honeys and increases during the storage or by heating process (Can et al., 2015)). Results showed significant difference between the HMF contents of the tested honeys. HMF levels of the investigated honeys varied from 3.69 to 22.47 (Table 2). Acacia honey recorded the lowest HMF content (3,6mg/kg while, sider honeys from KSA and Yemen had the highest HMF contents of 22.47 and 12.82 mg/kg honey respectively. However, all values were within the recommended level according to the codex Alimentarius (<80 mg/Kg). The higher HFM recorded for KSA and Yemen honeys could be attributed to the tropical climate of these countries which led to increase the HMF in hives. HMF found to be affected by many factors such as sucrose content, type of sugars, temperature, pH, age of the honey, floral source and fructose /glycose ratio (Islam et al., 2012; Can et al., 2015). Our results are similar to those previously reported for honeys originating from other tropical countries such as Malaysian honeys (6.07 to 67.94 mg/kg), Morocco honeys (0.09 to 53.38 mg/kg) ant that for Bangladeshi honeys (3.06 to 43.81). (Moniruzzaman et al., 2013; Islam et al., 2012).
3.5 Sugar content
The results showed that the total reducing sugar in the honey samples ranged from 71.245 to 66.57% and represented the largest portion of the honey composition. Data indicated that sucrose content in the investigated honeys ranged from 6.38 to 2.15%. All samples had sucrose levels below the maximum allowable limit of 5% presented by codex standard except for clover honey sample (6.38). The higher sucrose content of the clover honey could be attributed to over feeding of honey bee with sucrose syrup or the early harvest of honey (Azeredo et al., 2003; Saxena et al., 2010). On the other hand, the higher total sugar content in Sider Yemen and Sider Saudi Arabia could be because of the low levels of their moisture content (Can et al., 2015). Our results are inconstant with those reported by Khalil et al. (2012) for Algerian honeys (68.80 to 70.0%) and higher than that founded for Malaysian honeys (63.33 to 68.40) (Moniruzzaman et al., 2013).
3.6 Amino acid content of analyzed honey
The amino acid profile of the studied honey samples is summarized in Fig. 1 A-B. RP- HPLC ensured the separation and evaluation of 18 amino acid in the analyzed hones and the concentration of each amino acid is shown in Table 3. The obtained data showed that the most common essential amino acids found in these honeys were lysine, histidine, leucine and threonine in all the investigated honeys. Lysine found to be the highest essential amino acid in all samples and ranged from 2.29 to 17.12 mg/100 g. The results showed significant difference between clover from Egypt and sider honey from KSA and the other honeys in the lysine content. El-sider honeys from Libya and pine and acacia honey from Germany recorded similar lysine content with no significant difference. Libyan El-Sider honey and KSA honey recorded threonine content higher than the other honey types. The results also revealed no significant differences between all samples in the histidine content. This is agreement with the results reported by Sun et al. (2017) for Chinese unifloral honey and Kowalski et al. (2017) for polish and Slovak honeys. Phenylalanine found in pine honey with quantity higher than that in all the other honey types. Isoleusine, valine and arginine are also found in small and similar quantities in all the analyzed honeys. Our results are similar to that reported by Kowalski et al. (2017) for Polish honeys.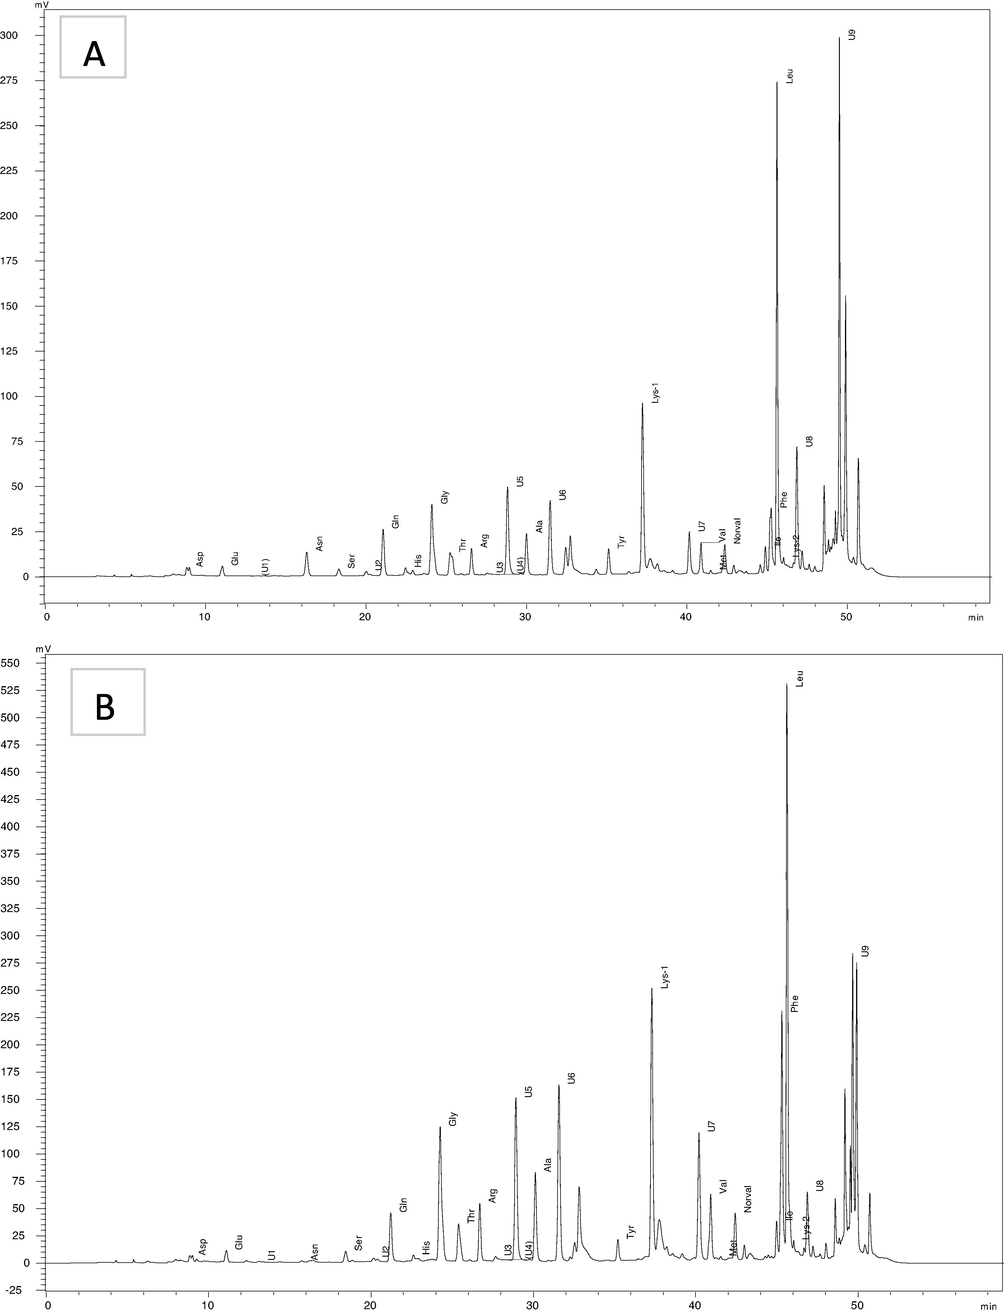
HPLC chromatogram for amino acid analysis (A) acacia honey from Germany and (B) sider honey from KSA.
Name
Acacia, G.
El-sider, L.
Clover, EG.
Sider, Y.
Pine, G.
Sider, KSA
Average
Average
Average
Average
Average
Average
Asp
1.17 ± 0.03
1.13 ± 0.01
1.21 ± 0.03
1.17 ± 0.01
1.25 ± 0.01
1.29 ± 0.04
Glu
1.21 ± 0.00
1.38 ± 0.06
1.32 ± 0.06
1.36 ± 0.02
1.69 ± 0.03
1.40 ± 0.08
Asn
0.49 ± 0.00
0.54 ± 0.02
0.47 ± 0.01
0.47 ± 0.00
0.65 ± 0.01
0.46 ± 0.01
Ser
0.88 ± 0.01
0.90 ± 0.02
0.89 ± 0.00
0.85 ± 0.01
0.91 ± 0.01
0.97 ± 0.03
Gln
0.62 ± 0.00
0.68 ± 0.07
0.62 ± 0.07±
0.17 ± 0.24
1.01 ± 0.03
1.06 ± 0.27
His
2.70 ± 0.04
2.51 ± 0.08
2.70 ± 0.03
2.53 ± 0.00
2.64 ± 0.18
2.92 ± 0.01
Gly
0.59 ± 0.03
0.83 ± 0.08
0.74 ± 0.01
0.52 ± 0.01
0.77 ± 0.01
1.08 ± 0.18
Thr
0.75 ± 0.01
1.03 ± 0.06
0.92 ± 0.05
0.69 ± 0.01
0.82 ± 0.01
1.11 ± 0.14
Arg
0.29 ± 0.00
0.33 ± 0.02
0.39 ± 0.03
0.23 ± 0.01
0.48 ± 0.01
0.52 ± 0.07
Ala
0.30 ± 0.01
0.50 ± 0.03
0.40 ± 0.03
0.36 ± 0.01
0.48 ± 0.01
0.53 ± 0.08
Tyr
0.32 ± 0.01
0.35 ± 0.01
0.32 ± 0.03
0.41 ± 0.02
0.60 ± 0.01
0.40 ± 0.05
Lys
7.51 ± 0.15
6.27 ± 0.19
12.03 ± 0.40
12.29 ± 0.01
6.44 ± 0.03
17.12 ± 0.54
Val
0.47 ± 0.00
0.55 ± 0.03
0.54 ± 0.01
0.46 ± 0.00
0.48 ± 0.00
0.70 ± 0.05
Met
0.00 ± 0.00
0.00 ± 0.04
0.00 ± 0.00
0.00
0.00
0.00 ± 0.00
Ile
0.39 ± 0.00
0.43 ± 0.02
0.41 ± 0.01
0.36 ± 0.00
0.41 ± 0.00
0.50 ± 0.04
Phe
0.31 ± 0.01
0.47 ± 0.04
0.49 ± 0.12
0.39 ± 0.02
1.78 ± 0.06
1.24 ± 0.39
Leu
0.61 ± 0.03
0.52 ± 0.08
0.74 ± 0.00
0.51 ± 0.05
0.65 ± 0.03
2.28 ± 0.63
Pro
31.96 ± 1.97
31.15 ± 4.80
48.32 ± 2.39
27.78 ± 1.87
32.77 ± 2.46
34.59 ± 6.99
Samples
β-carotene (mg/kg)
Lycopene (mg/kg)
Color (mm Pfund)
color
Acacia, Germany
18.015
10.227
26.508
White
El-Sider Libya
13,070
7.394
49.905
Extra light Amber
Clover Egypt
26.604
9.702
20.281
White
Sider, Yemen
12.199
6.216
51.019
Light Amber
Pine, Germany
9.104
11.899
94.843
Amber
Sider, Saudi Arabia
11.255
4.752
92.588
Amber
The dominant non-essential amino acids in the investigated honeys were proline ranged from (48.32 to 31.15 mg/100 g) glutamic acid from (1.69 to 1.21 mg/100 g) and aspartic acid from (1.29 to 1.13 mg/100 g), glycine from 1.08 to 0.52 and serine from 0.97 to 0.87 mg/100 g) honey. Lower but also important quantities of tyrosine, glutamine and alanine were present in all the honey types. Proline which produced from bee salivary secretion is an important amino acid used as assign for honey ripeness and the adulteration of honey with sugar (Bogdanov et al., 2004 and Kowalski et al., 2017). The results showed that proline was the highest amino acid in all the honey types and ranged from 48.32 to 27.78 mg/100 honey. Clover honey from Egypt recorded the highest proline content while Yemeni sider honey recorded the lowest content. Likewise, pine honey showed higher glutamic acid content higher than the other samples. The proline contents recorded in our study are similar to those founded for rosemary, lavender and thyme honeys from Span and that reported by Moniruzzaman et al. (2013) for Gelam and Sourwood honeys from Malaysia. Kowalski et al (2017) reported proline content of Slovakian acacia honey of 331.42 mg /kg which is very close to our finding. The results showed that the proline contents recorded in our samples were higher than those reported for Indonesian, some Indian and Algerian honeys (Noor et al., 2019; Khalil et al., 2012). Methionine and cysteine which are sulfur containing amino acids were not detected in all the analyzed honey samples. Similar finding was reported by Sun et al. (2017).
3.7 B- carotene, lycopene and color characteristics
The honey color analysis and color characteristic are presented in (Table 4). Β- carotene and lycopene content of the investigated samples were noticeably different and varied from 9.10 to 26.604 and from 4.75 to 11.89 mg/kg respectivly. The higest Β- carotene concentration was recorded for the clover honey from Egypt followed by acacia honey from Germany while sider honey KSA and pine honey from Germany had the lowest B- carotene among all the tested samples. Pine honey from Germany had the highest lycopene content comparing with the other samples. Our results are similar to that reported by Ferreira et al. (2009) for Portuguese honeys and higher than those reported by Alvarez-Suarez et al. (2010) for Cuban honeys (5.57 to 1.17 mg B-carotene E/kg honey). The color of the honey is usually affected by many factors such as its pigments content (carotenoids and flavonoid), total phenolic content, age, botanical origins, contacts with metals and the way of handling (Moniruzzaman et al., 2013).
According to USDA approved color stander, the honey had Pfund value ranged from 8 to 16 is classified as extra white honey. With increasing the Pfund value the honey gets more dark color and classified as amber honey when its Pfund value was between 86 and 114. In the present work, clover and acacia honeys were the brightest with the lowest Pfund values of (20.281 and 26.508 mm) and classified as white honey meanwhile, pine honey and Sider KSA honey recorded the highest Pfund values 94.843 and 92.588 respectively and classified as amber honeys.
Parameters L*, a* and b* recorded for the different types of honey are presented in Fig. 2. The results summarized that clover and acacia honey had the highest L* values of 64.43 and 61.83 respectively, which exhibits lightness. There were significant differences between these two honeys and the other tested honeys. Sider honey KSA pine honey from Germany recorded the lowest L* average values of (22.03 and 20.67) with no significant difference between them and classified as amber honey. The results showed negative correlation between the L* values and the found values of the tested honeys samples which mean darker honeys had lower L* values because of their high contents of total flavonoids and polyphenolic compounds. The results also showed that parameter a* and b* were varied among the different honey samples and ranged from 0.69 to 11.32 and from 3.08 to 10.13 respectively. The L values of the samples ranged from 20.57 to 63.91 with lower L value indicating a darker honey color. Our findings are similar to those reported by Can et al. (2015) for acacia and clover Turkish honeys and by (Bertoncelj et al., 2007) for Lithuanian honeys. The dark-colored honeys could be because of the high levels of pigment, pollen, phenolic compounds, minerals and Maillard reaction products (Bertoncelj et al., 2007; Pauliuc et al., 2020).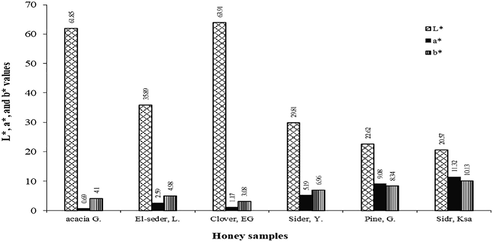
L*, a* and b* parameters for investigated honey samples G. = Germany, EG = Egypt, Y = Yamen, L = Libya, KSA = Saudi Arabia.
3.8 Extraction yield, total flavonoids and total phenolic content of honey samples
The extraction yields of different honey samples with methanol: (80:20 v/v) were ranged from 115 ± 4.28 to 211 ± 4.33 mg/100 g honey. Pine honey recorded the highest yield followed by acacia and clover hones. On the other hand, the lowest extraction yield was observed for the Yemeni sider honey of 115 mg/100 g honey.
3.8.1 Total phenolic content (TP)
The polyphenol compounds are considered as very important components in honey because of their influence in the honey color and its functional properties. The main total phenolic content (mg gallic acid equivalent GAE/kg) determined by using Folin-Ciocalteau method for the studied mono floral honey samples are specified in table (5). It was varied from 18.574 mg GAE/100 g in clover honey to 53.314 mg/100 g in sider honey from KSA. Among the tested honey samples, sider honey from KSA exhibited the highest TP content (53.314 mg/100 g) followed by pine honey which recorded TP content of (44.828 mg GAE /100 g). On the contrary, the clover honey found to have the lowest TP content (18.574 mg GAE/ kg of honey). The results showed significant differences between all the investigated samples. This difference could be due to the difference in the geographical origin and the floral sources. our results are compatible with that reported by Kowalski et al. (2017); Can et al., 2015 for Turkish honey which ranged from 24.20 to 124.05 mg/ 100 g . Likewise, Bertoncelj et al. (2007) obtained TP content ranged from 44.8 to 233.9 mg kg−1 for Slovenian honey. Silici et al. (2010) indicated that rhododendron honeys from turkey had phenolic content ranged from 0.24 to 141.83 mg/100 g honey. The obtained results elucidate positive correlation between the honey color and its phenolic content in which the darker honey contain more phenolic than the lighter one. Our results are agreed with that presented by Ferreira et al., 2009).
3.8.2 Flavonoid content
The main total flavonoids of the investigated honeys varied from 41. 704 to 120.857 mg catechin/kg honey Table (5). The total flavonoids content of the tested honey exhibited the order: KSA sider honey > pine honey > sider, Yemen > El-sider, Libya > acacia, Germany > clover, Egypt. As with phenolic content, sider honey from KSA recorded the highest flavonoid content among all the samples. The results showed no significant differences between acacia honey and clover honey and between El-sider honey and pine honey. Our results are considerably higher than that reported for Malaysian honey, Indian honey, and Cuban honey (Moniruzzaman et al., 2013; Alvarez-Suarez et al., 2010). However similar results were observed for sunflower honey, Geren honey, and manuka honey (Das et al., 2013). In study by Meda et al. (2005) for Burkina Fasan honey, the flavonoid content found to be varied from 17 to 83.5 mg of quercetin / kg−1 of honey.
3.8.3 Analysis of phenolic compounds in the honey extracts
The HPLC analysis of the studied honey samples presented in Table 6 and Fig. 3 indicated that chlorogenic acid, caffeic acid, p-coumaric acid, the main plenolic acids in most of honey extracts while kaempferol, Chrysin were the main flavonoids in all the tested samples. chlorogenic acid found to be the predominate phenolic acid in all the studied samples except that for Libyan El-sider honey. The results showed no significant differences between clover, pine and KSA sider honey in the content of chlorogenic acid. Among all the honey samples, acacia honey recorded the lowest content of chlorogenic acid. Chlorogenic acid was detected in many honey types such as Serbian honey (keckes et al., 2013), Lithuanian honey (Baltrusaityte et al., 2007). and northeast Portugal honeys (Feás et al., 2010). Similar results were also reported by Trautvetter et al. (2009) for clover honey. The chromatogram of the phenolic compounds in our samples indicated that cinnamic acid and ferulic acid were not detected in acacia, clove and pine honeys while p-coumaric acid was absent only in Libyan El-sider honey. These results are agreed with that reported by Yao et al. (2004) for the Australian honey. These phenolic acids were detected in different types of honeys by some authors (Kassim et al., 2010).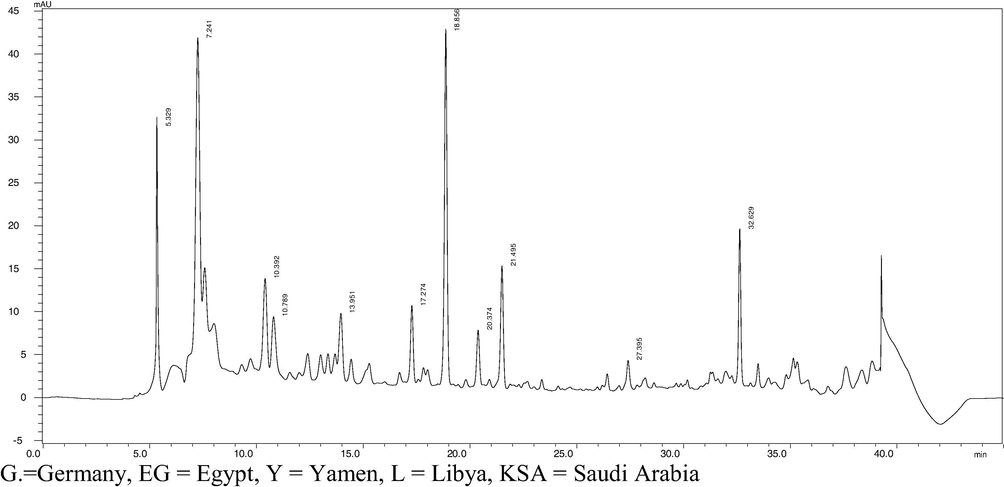
Results of HPLC chromatogram of phenolic acids and flavonoids detected in acacia honey (290 nm): (1) chlorogenic acid = 5.32 min, (2) caffeic acid = 10.39 min, (3) p-coumaric acid = 13.95 min, (4). Kaempferol = 18.85 min, (5). Chrysin = 27.39, and binocambrin = 32.62 min.
P-coumaric acid represented about 34.93 and 20.42% of the total phenolic compounds in clover and pine honey respectively. According to the results in Table 6, kaempferol and chrysin was detected in all tested honey samples. Acacia honey was superior to all of other investigated samples in its kaempferol and chrysin content while EL-sider honey recorded the lowest kaempferol and chrysin content. The differences between the honey types in their phenolic compounds profile could be related to the floral sources and the geographical origin.
3.9 Antioxidant activity of honeys methanolic extracts
The antioxidant activity of the phenolic extracts of the different honey samples measured using DPPH assy. From the results in Fig. 4, it could conclude that all the tested samples exhibited good antioxidant activity however, different honey revealed varying degrees of antioxidant capacity.
Six different concentrations of each honey extract were used in this assay from 2.83 to 18.87 mg/ml solution and the results showed that the scavenging activity was increased with increasing the phenolic content in the solution. From the results in Table 5 and Fig. 4, the amount of antioxidant required to decrease the concentration of DPPH by 50% (EC50) values varied from 4.17 to 55.31 mg/ml. a.u. = arbitrary units, G = Germany, EG = Egypt, L = Libya, Y = Yemen, KSA = Saudia Arabia, nd = not identified.
Parameters samples
Yield of methanolic extract (mg/100 g)
AEAC (mg/100 g)
Total Flavonoids (mg Catechin /kg)
Total phenolic (mg GAE/100 g)
SC50 mg/ml
Acacia, Germany
203 ± 5.02b
12.368 ± 1.30d
45.714 ± 2.03d
21.457 ± 5.10
35.35
El-sider Libya
167 ± 3.58c
16.375 ± 2.08c
97.429 ± 2.85c
29.252 ± 5.68d
18.22
Clover Egypt
201 ± 8.71b
11.001 ± 1.07d
41.704 ± 1.58d
18.574 ± 4.37f
55.31
Sider, Yemen
115 ± 2.61c
21.013 ± 1.15b
103.143 ± 4.61b
33.885 ± 5.25c
10.61
Pine, Germany
211 ± 4.33a
20.192 ± 1.24b
106.002 ± 4.59b
44.828 ± 6.89b
9.94
Sider, Saudi Arabia
175 ± 3.62c
27.983 ± 1.82a
120.857 ± 5.25a
53.314 ± 6.90a
4.17
Honey Compounds
Acacia, G.
El-sider L.
Clover, EG
Sider, Y.
Pine, G.
Sider, KSA
Chlorogenic acid
11.328
6.625
32.817
28.123
34.069
33.995
p-coumaric acid
4.772
nd
34.939
8.936
20.422
14.448
Caffeic acid
7.878
20.929
11.994
25.021
10.956
21.431
Ferulic acid
nd
24.158
nd
7.438
nd
9.272
Cinnamic acid
nd
18.298
nd
6.074
nd
nd
Chrysin
4.165
1.431
1.579
3.114
1.956
3.189
Kaempferol
17.986
2.205
3.057
11.312
6.329
5.284
Sinapic acid
nd
nd
nd
nd
nd
6.868
Binocembrin
6.849
nd
nd
nd
nd
nd
Beta-phenyl acetic
nd
nd
nd
4.269
nd
nd
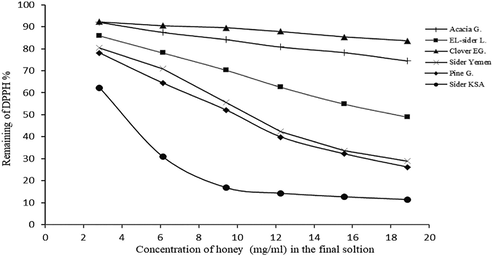
Antioxidant activity of different concentration of phenolic extracts from the honey samples.
KSA Sider honey showed the highest antioxidant activity and lowest EC50 (4.17 mg/ml) followed by pine honey with EC50 of (9.94 mg/ml) while clover honey exhibited the lowest antioxidant activity with the highest EC50 of (55.31 mg/ml). The high radical scavenging activity of KSA sider honey and pine honey could be due to their high phenolic and flavonoid contends.
All of our honey samples showed EC50 lower that those reported by other authors for different honey types including Indian honey, Malaysian honey and Portuguese honey (Das et al., 2013; Moniruzzaman et al., 2013; Ferreira et al., 2009).
Our results for acacia honey agreed wit that reported by Bertoncelj et al. (2007) for the Slovenian acacia honey and lime honey. The results indicated that there was a significant positive correlation between the color of the honey and its antioxidant capacity in which the darker honey had the higher antioxidant activity. It could be summarized that the antioxidant activity of the honeys is not only consequent to the phenolic and flavonoids content but also their content of carotenoids and vitamin E and C.
4 Conclusion
Our results proved that there is a positive correlation between the color of honey and its phenolic, flavonoids, carotenoids and HMF content. All the investigated samples showed high antioxidant activity. Saudi honey was superior to all other honey in its content of total polyphenols and flavonoids. This difference could be due to the difference in the geographical origin and the floral sources.
Acknowledgment
This work was financial supported by Cultural Affairs and Missions Sector, Egypt and Taif University Researchers Supporting Project number (TURSP-2020/90), Taif University, Taif, Saudi Arabia. Our thank also for the beekeepers for providing the honey samples used in this study.
Declaration of Competing Interest
The authors declare that they have no known competing financial interests or personal relationships that could have appeared to influence the work reported in this paper.
References
- Physicochemical, Heavy Metals and Phenolic Compounds Analysis of Libyan Honey Samples Collected from Benghazi during 2009–2010. Food Nutr. Sci.. 2013;4:33-40.
- [Google Scholar]
- Antioxidant Characterization of Native Monofloral Cuban Honeys. J Agric Food Chem. 2010;58:9817-9824.
- [Google Scholar]
- Alves, J.P.; Alves da, LAMC; Reis da, SSJ., Adriana, F., 2014. Color, phenolic and flavonoid content, and antioxidant activity of honey from Roraima, Brazil. Food Sci. Technol, vol.34, n.1, pp.69-73.
- Official methods of analysis ((15th ed.).). Arlington, VA, USA: Association of official Analytical Chemists Inc.; 1990.
- Protein content and physicochemical properties in honey samples of Apis Mellifera of different floral origins. Food Chem.. 2003;80:249-254.
- [Google Scholar]
- Radical scavenging activity of different floral origin honey and beebread phenolic extracts. Food Chem.. 2007;101:502-514.
- [Google Scholar]
- Effect of Lactarius piperatus fruiting body maturity stage on antioxidant activity measured by several biochemical assays. Food and Chemical Toxicology. 2007;45:1731-1737.
- [CrossRef] [Google Scholar]
- Evaluation of the phenolic content, antioxidant activity and colour of Slovenian honey. Food Chem. 2007;105:822-828.
- [Google Scholar]
- Physicochemical and bioactive properties of six honey samples from various floral origins from Tunisia. Arabian J. Chem.. 2018;11:265-274.
- [Google Scholar]
- Use of a free radical method to evaluate antioxidant activity. LWT –. Food Science and Technology. 1995;28(1):25-30.
- [Google Scholar]
- An investigation of Turkish honeys: their physico-chemical properties, antioxidant capacities and phenolic profiles. Food Chem.. 2015;180:133-141.
- [Google Scholar]
- Chirife, J., Zamora, M. C., Motto, A., 2006. The correlation between water activity and % moisture in honey: Fundamental aspects and application to Argentine honeys. Journal of Food Engineering, 72, 287–292
- Codex Alimentarius Commission Standards, 2001. CODEX STAN 12-1981, Rev.1 (1987), Rev.2
- Characterization of Antioxidants and Antioxidative Properties of Various Unifloral Honeys Procured From West Bengal, India. J. Environ. Sci., Toxicol. Food Technol.. 2013;7(3):56-63.
- [Google Scholar]
- Anti Ulcerogenic and Cytoprotective Effects of Saharian (Sidr) Honey from Algeria. Comb. Chem. High Throughput Screening 2020
- [Google Scholar]
- Characterization of artisanal honey produced on the Northwest of Portugal by melissopalynological and physico-chemical data. Food Chem. Toxicol.. 2010;48:3462-3470.
- [Google Scholar]
- Antioxidant activity of Portuguese honey samples: Different contributions of the entire honey and phenolic extract. Food Chem.. 2009;114(4):1438-1443.
- [Google Scholar]
- Physicochemical, microbiological and antimicrobial properties of commercial honeys from Portugal. Food Chem. Toxicol.. 2010;48:544-548.
- [Google Scholar]
- Antioxidant activities of some monofloral honey types produced across Turkey. Saudi J. Biol. Sci.. 2018;25:1056-1065.
- [Google Scholar]
- Islam, A.1, Khalil I., Islam N., Moniruzzaman M., Mottalib, A., Sulaiman, S. A., and Gan, S.H., 2012. Physicochemical and antioxidant properties of Bangladeshi honeys stored for more than one year. BMC Complementary and Alternative Medicine 12:177.
- Ellagic acid, phenolic acids, and flavonoids in Malaysian honey extracts demonstrate in vitro antiinflammatory ctivity. Nutr. Res.. 2010;30:650-659.
- [Google Scholar]
- The determination of phenolic profiles of Serbian unifloralhoneys using ultra‐high‐performance liquid chromatography/high resolutionaccurate mass spectrometry. Food Chem.. 2013;138:32-40.
- [Google Scholar]
- Physicochemical and Antioxidant Properties of Algerian Honey. Molecules. 2012;17(9):11199-11215.
- [Google Scholar]
- Comparison of Antibacterial and Antifungal Effects of Different Varieties of Honey and Propolis Samples. Acta Alimentaria. 2020;49(4):515-523.
- [Google Scholar]
- Free amino acids profile of Polish and Slovak honeys based on LC–MS/MS method without the prior derivatization. J. Food Sci Technol.. 2017;54(11):3716-3723.
- [Google Scholar]
- Biological activities and chemical composition of three honeys of different types from Anatolia. Food Chemistry. 2007;100:526-534.
- [Google Scholar]
- Biological activities and chemical composition of three honeys of different types from Anatolia. Food Chem.. 2011;100:526-534.
- [Google Scholar]
- The development of a biochemical profile of acacia honey by identifying biochemical determinants of its quality. Not Bot Hort Agrobot Cluj. 2010;38(2):84-90.
- [Google Scholar]
- Determination of the total phenolic, flavonoid and proline contents in Burkina Fasan honey, as well as their radical scavenging activity. Food Chem. 2005;91:571-577.
- [Google Scholar]
- Evaluation of physicochemical and antioxidant properties of sourwood and other Malaysian honeys: a comparison with manuka honey. Chem. Cent. J.. 2013;7:138.
- [Google Scholar]
- Noor, A., Mahmud, M., Ahmad, A., Arfah, R.A., 2019. Amino acids characterization of forest honeys from some area of South Sulawesi. The 3rd International Conference on Science, Journal of Physics: Conference Series, 1341, 1-8.
- Pauliuc, D.; Dranca, F., and Oroian, M., 2020. Antioxidant Activity, Total Phenolic Content, Individual Phenolics and Physicochemical Parameters Suitability for Romanian Honey Authentication Foods 2020, 9, 306;
- National Honey Board: Honey and Bees; 2003. http://www.nhb.org.
- Evaluation of enantiomeric purity of selected amino acids in honey. Chirality. 1994;6:270-276.
- [Google Scholar]
- Physical, biochemical and antioxidant properties of some Indian honeys. Food Chem.. 2010;118(2):391-397.
- [Google Scholar]
- Total phenolic content, antiradical, antioxidant and antimicrobial activities of Rhododendron honeys. Food Chem.. 2010;121:238-243.
- [Google Scholar]
- Phenolic compounds, melissopalynological, physicochemical analysis and antioxidant activity of jandaıra (Melipona subnitida) honey. J. Food Compos. Anal.. 2013;29:10-18.
- [Google Scholar]
- Singleton, V.L., Orthofer, R., Lamuela-Raventos, R.M., 1999. Analysis of total phenols and other oxidation substrates and antioxidants by means of Folin–Ciocalteu reagent. Methods in Enzymology 299, 152–178
- Identification of botanical origin of Chinese unifloral honeys by free amino acid profiles and hemometric methods. J. Pharm. Anal.. 2017;7:317-323.
- [Google Scholar]
- Confirmation of phenolic acids and flavonoids in honeys by UPLC-MS. Apidologie. 2009;40:140-150.
- [Google Scholar]
- Instrumental color classification of honey: collaborative study. J. Assoc. Off. Anal. Chem.. 1984;67:1129-1131.
- [Google Scholar]
- Flavonoid in Australian Malaleuca, Guioa, Lophostemon, Banksia and Helianthus honeys and their potential for floral authentication. Food Res. Int.. 2004;37(2):166-174.
- [Google Scholar]


