

Translate this page into:
Eco-friendly synthesis of reduced graphene oxide as sustainable photocatalyst for removal of hazardous organic dyes
⁎Corresponding author. abdaalghamdi@ksu.edu.sa (Abdullah Ahmed Al-Ghamdi)
-
Received: ,
Accepted: ,
This article was originally published by Elsevier and was migrated to Scientific Scholar after the change of Publisher.
Peer review under responsibility of King Saud University.
Abstract
Abstract
Synthetic dyes are widely used as coloring agents in the textile, food, paper, leather, and printing industries. Sustainable removal of these dye molecules is a challenging task due to their toxic nature to the environment as well as for living organisms. In the present study, a simple hydrothermal method is carried out to synthesize reduced graphene oxide (rGO) using the leaves extract of Murraya koenigii. Further, different characterization techniques such as X-ray diffraction, Raman spectroscopy, UV–vis spectroscopy, and Fourier transform infrared spectroscopy (FT-IR) are used to confirm the physicochemical properties of synthesized rGO. Raman analysis confirms the reduction of graphene oxide by the increase in ID/IG ratio significantly. Field emission scanning electron microscopy (FE-SEM) and Transmission electron microscopy (TEM) analysis show well-exploited rGO morphology. Further, newly synthesized rGO is used as a photocatalyst for the removal of methylene blue (MB) and methyl orange (MO) dyes. UV–vis spectrophotometer is used for monitoring the degradation efficiency. Catalyst MKrGO shows 80% of MO and 77% of MB degradation within 120 min of sunlight exposure. The sustainability of this catalyst is checked by recyclability in five subsequent degradation cycles and noticed a stable and significant degradation activity.
Keywords
Reduced graphene oxide
Green synthesis
Murraya koenigii
Photocatalytic activity
Dye removal

1 Introduction
In the present day, water and soil pollutions due to organic and inorganic contaminants are a major environmental issue that is affecting the lives of both fauna and flora of the environment (Rahman et al., 2020). The developments in the industrial sectors and globalization are important causes of this pollution. Among the pollutant’s different types of dyes are considered the most common and highly toxic contaminants in water bodies. Synthetic dyes are widely used as coloring agents in the textile, food, paper, leather, and printing industries (Zeleke and Kuo, 2019). Raw effluents are discharged into the soil and water sources which are reported as mutagenic, carcinogenic, and also persistent for a prolonged period in the environment and make a huge impact on living matters. Nearly 1 million tons of dyes are produced per annum around the world and a major portion of the used dyes are discharged without processing (Zeleke and Kuo, 2019).
Many methods/approaches are used to treat dye contaminations such as membrane processes, adsorption, biodegradation using microorganisms, ultrafiltration, advanced oxidation, and photocatalytic degradation (Kang et al., 2020). Among these methods, the photocatalytic approach gained great attention among the scientific and industrial communities since, which use solar energy for the removal of the dyes. Hence, it is a very promising and sustainable technology and can be implemented with low-cost catalysis. Many nanomaterials and nanocomposites are being used as catalysts for the removal of various dyes such as ZnO (Dhandapani et al., 2020), V2O5-CeO2 (Zeleke and Kuo, 2019), silver nanoparticles (Wang et al., 2018), gold nanoparticles (Singh et al., 2020), graphene (He et al., 2018) and many others. Graphene and its composite materials are used for the photodegradation of different dyes such as methyl orange, methylene blue, rhodamine B and etc (Moztahida and Lee, 2020). Graphene alone (without any composite) is rarely explored for photocatalytic application especially for the removal of toxic dyes.
In recent years, graphene and its composite materials are gained great attention due to their physicochemical properties such as mechanical strength, conductivity, large surface area, optoelectronic nature, etc (Tavakoli et al., 2015). These features make a way to use in different applications such as sensors, solar cells, hydrogen generation, photocatalysis, etc (Nayak et al., 2020). Graphene oxide (GO) can be exploited from natural graphite using different approaches, among them modified hummer’s (chemical oxidation) methods are the most adapted techniques for the bulk and easy synthesis of GO, which contain oxygen-containing groups including carboxyl, hydroxyl, and carboxide (Liu et al., 2019). These functional groups can be removed from the surface of GO by reducing them. Reduced graphene oxide (rGO) has great properties and extensively used in many applications as an alternative to pure graphene because rGO can be synthesized with minimum production cost and an easy reduction process (Tarcan et al., 2020a). The limitation or drawbacks associated with GO use is the toxic, corrosive, and explosive nature of the reducing agents such as hydrazine and sodium borohydride (Chu et al., 2016). This problem can be overcome either by developing synthetic routes to obtain rGO without reducing agents (Tarcan et al., 2020b) or by using eco-friendly reducing agents such as plant extracts, biologically active natural sources, glucose, etc.
Few plant materials and natural products are being used for the reduction of GO such as grape seed (Yaragalla et al., 2016), Peltophorum pterocarpum (Rahman et al., 2014), pomegranate juice (Tavakoli et al., 2015), Artemisia herba-alba (Khenfouch et al., 2016), rose water (Haghighi and Tabrizi, 2013), black soybeans extract (Chu et al., 2016), Aloe vera (Bhattacharya et al., 2017), Eucalyptus leaf extract (Jin et al., 2018), etc. Secondary metabolites including polyphenols, proteins, sugar molecules, alkaloid’s and flavonoids present in the plant extracts are playing key roles in the removal of oxygen functional groups over the surface of GO. It is well recorded the key roles of polyphenols in the reduction of nanomaterials. Still, there are so many plants being easily available with enriched polyphenols contents along with other active secondary metabolites, which are needed to be investigated to find out more potential green reducing agents for the reduction of GO for multiple applications.
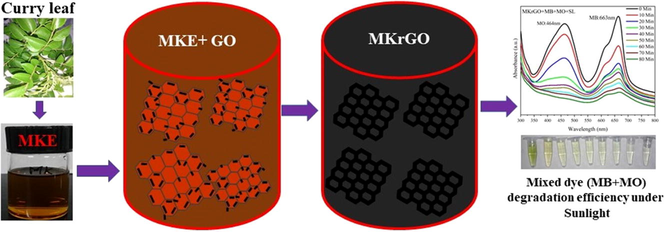
In the present investigation, rGO is synthesized by the green reduction method using polyphenol-rich Murraya koenigii aqueous leaf extract. This plant is commonly available around the world and very cheap material. Synthesized rGO is subjected to various characterization techniques including X-ray diffraction (XRD), Raman analysis, Fourier transform infrared spectroscopy (FT-IR), field emission scanning electron microscopy (FE-SEM), Transmission electron microscopy observations. Further, synthesized rGO is applied as potential catalyst materials for the removal of organic dye molecules including methylene blue and methyl orange by UV-irradiation and sun light-driven photocatalytic method.
2 Materials and methods
Graphite powder, sodium chloride, potassium chloride, disodium hydrogen phosphate, ethylene diamine tetraacetic acid (EDTA), potassium dihydrogen phosphate, methyl orange, and methylene blue were purchased from Hi-media. Methanol, sulphuric acid, hydrochloric acid, sodium nitrate, and dimethylsulfoxide (DMSO) were obtained from Merck. Hydrogen peroxide, potassium permanganate, and ethanol were purchased from Sigma-Aldrich. All the obtained chemicals were used without any purification. For this study, curry leaves (Murraya koenigii (MK)) were purchased from the local market near Kalapet, Puducherry.
2.1 Synthesis of graphene oxide
GO was synthesized by a modified Hummers method (Hummers and Offeman, 1958). Briefly, 1 g of graphite flake was taken as the starting material and 50 g of sodium chloride was added with graphite and ground well. Further, sodium chloride was separated using deionized water by filtration, and then 23 mL of sulphuric acid (98%) was added with residual graphite flake and then mixed for 8 h. Further, 3 g of potassium permanganate was gradually added and the reaction temperature was sustained at below 20 °C. This reaction temperature was improved to 35–40 °C and stirred for 30 min. Then reaction temperature was increased to 65–80 °C with the stirring condition for 45 min. Afterward, 46 mL of deionized water was added to the above mixture and stirred for 30 min at 98–105 °C. This reaction was terminated by the addition of 140 mL of distilled water along with 30% sulphuric acid solution (10 mL). In the end, obtained GO was washed several times with 5% of hydrochloric acid followed by deionized water and dried at room temperature using a vacuum oven.
2.2 Preparation of plant extracts
A healthy and fresh leaf of Murraya koenigii was purchased from the local market and matured leaves are picked and surface cleaned with the running tap water. Further, washed with deionized water 2–3 times. These surface cleaned leaves were dried at 50 °C for 5 h. These dried leaves were ground well into a fine powder using mortar and pestle. 5 g of this powder was taken in 50 mL of deionized water and refluxed for 1 h at 80 °C. After cool down, the leaf extract was filtered by using No. 1 Whatman filter paper.
2.3 Green reduction of GO
A simple and most reliable hydrothermal approach was adapted for the reduction of GO. For this purpose, 1 mg/mL of GO was dispersed in MK extract by using sonication for ten minutes. Further, the above-prepared solution was subjected to 30 min of sonication. This mixture is transferred into a sterile Teflon-lined autoclave and kept at 100 °C for 12 h. At the end of the hydrothermal reaction, reduced GO was obtained by centrifuging the above mixture at 8000 rpm for 15 min. Further, separated rGO was washed several times using deionized water followed by a final wash with absolute ethanol. Finally, the obtained rGO was vacuum dried at 60 °C for 12 h and named as MKrGO.
2.4 Characterizations
After the reduction of GO, different analytical and characterization techniques are used to confirm their physicochemical properties. Optical properties were emphasized using UV–vis spectrophotometer (Model: Varian-5000). FTIR analysis was carried out to confirm the functional molecules present in both GO and MKrGO as well as in the plant extracts, using the JASCO-460 model. The phase information was confirmed by Raman spectroscopy with a confocal micro-Raman spectrometer (Renishaw RM 2000) under a 20 mW Innova Ar + ion laser at 785 nm. Powder XRD (Model: Rigaku-Ultima IV) was used for the analysis of the crystalline nature of the GO and MKrGO using nickel filtered Cu- Kα radiation (λ = 0.154 nm). FE-SEM (Model: Carl Zeiss-SUPRA-55) and transmission electron microscopy (TEM, Model: Technai G2-F30STwin) were used for the analysis’s arrangement and morphology of both GO and MKrGO.
2.5 Photocatalytic degradation studies
For the photocatalytic degradation experiments, two dyes were selected such as methylene blue (MB) and methyl orange (MO). For photodegradation purposes, both dye solutions were prepared using deionized water at a concentration of 10 mg/L. Further, 20 mg/L of MKrGO is added to the prepared each dye solution. After the addition of catalyst (MKrGO) into each dye solution, these mixtures were kept in a shaking incubator for 30 min at the dark condition for the adsorption and desorption of dye molecules over the surface of the catalyst. At the end of the dark exposure period, each solution mixture was subjected to UV–vis Spectrophotometer analysis (Shimadzu-1800) and noted as the initial concentration (C0) of the solutions before photodegradation. For the effective degradation of dyes, two conditions are applied such as direct sunlight exposure and UV-light C (365 nm) irradiation. Dye degradation was carried out sequentially by individual dye solutions and a combination of both dyes (mixed equal concentration of MB and MO). Photodegradation solution was retrieved at regular intervals for the continuous monitoring of the degradation study. The obtained solutions are centrifuged to separate catalysis from the solution and used for UV–vis Spectrophotometer analysis and noted as Ct (concentration of dye at specific irradiation/exposure time). Entire dye degradation experiments were repeated three times. Dye degradation could be calculated from the absorbance values using the following formula;
3 Results and discussion
3.1 Physicochemical characterization of GO and MKrGO
The solvent-free aqueous extraction procedure was adapted for the preparation of a green reducing agent. A polyphenol-rich Murraya koenigii was selected for the successful reduction of GO. A simple hydrothermal approach was used for the reduction reaction. Initially, dispersed GO solution was appeared as greenish-brown in color, after the hydrothermal reaction over, this brownish color was transformed as dark black color. Transformation of color indicates successful removal of oxygen moieties from the surface of GO it implies the rebuilding of sp2 hybridization carbon atoms with increasing the electron concentration.
3.2 XRD analysis
The crystalline nature of as-synthesized GO and MKrGO are confirmed using powder X-ray diffraction analysis as shown in Fig. 1a. Besides, d-spacing values are calculated using Bragg’s equation as follows, d = nλ/2 sin θ, where d is defined as interplanar spacing or d-spacing, λ = 1.5406 Å (wavelength of incident X-ray), θ is peak position (in Radians), n = 1 (order of diffraction). Pristine graphite having a high-intensity peak at 2θ = 26.60°, which was completely decreased in the GO with an intense carbon peak (0 0 1) at 2θ = 10.0° with the d-space value of 0.93 nm. While GO undergoes reduction by the MK extract, the peak at 2θ = 10.0 was disappeared in MKrGO. A broad and less intensity reflection peak (0 0 2) was observed at 2θ = 26.25° for MKrGO with the d-space value of 0.33 nm. The higher d-space value in GO sheets revealed that, intercalation of water moieties along with the formation of O2 functional groups between the graphite layers. Declining in the d-spacing values of MKrGO confirms that exfoliation has been happened to a greater extent by the elimination of oxygen functional groups over the surface of GO (Manchala et al., 2019). The obtained 2θ pattern of MKrGO was found very similar to the previously reported pattern of graphene (Kumbhakar et al., 2018; Lingaraju et al., 2019, Mahmudzadeh et al., 2019).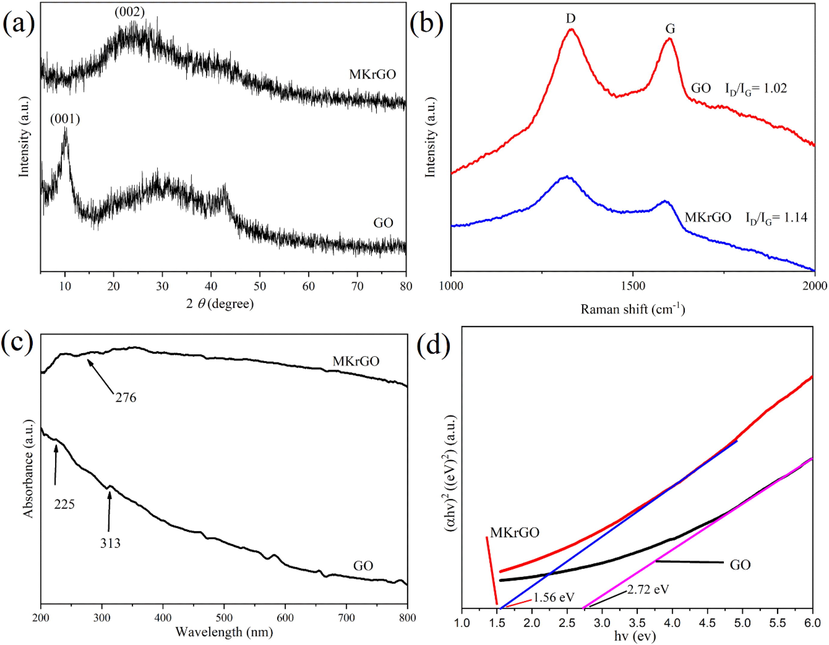
(a) XRD, (b) Raman analysis, (c) UV–vis absorption spectra, (d) bandgap of GO, MKrGO (straight lines are fitted to obtain the exact bandgap values and the values).
3.3 Raman analysis
Structural changes in the synthesized GO and MKrGO are monitored using Raman spectroscopy as illustrated in Fig. 1b. Raman analysis of graphene-based material is one of the most promising and reliable method to confirm their exact structural changes. Graphite flakes clearly show a prominent peak at 1578 cm−1, it was noted as G band, which resembles the 1st order scattering of E2g. At the same time, when graphite undergoes oxidation in presence of various chemical components it has two major peaks at 1600 cm−1 and 1330 cm−1 which confirm the well-known G and D bands of GO. This G band is connected with graphitic hexagon-pinch mode, whereas the D band resembles the defect in GO (Kumar et al., 2014). This G and D bands of MKrGO were shifted to 1588 and 1317. Further, Raman analysis of MKrGO confirms an increase in the intensity ratio of both G and D bands than as-synthesized GO. The ID/IG ratio was recorded as 1.02 which was increased to 1.14 for MKrGO, which confirms the presence of unrepaired defects after the removal of negatively charged O2 moieties from the surface of GO. This analysis confirms the successful reduction of GO by the MK extract. We found a higher ID/IG ratio than previously reported natural/synthetic reducing agents (Huang et al., 2015; Khenfouch et al., 2016; Mahata et al., 2018).
3.4 UV vis spectroscopy studies
The bioreduction of GO was confirmed by using the UV–vis spectrophotometer as presented in Fig. 1c. The GO shows an absorption peak at 225 nm and a shoulder at 313 nm, which implies the π-π* transition of the C⚌C bond and the n-π* transition of C⚌O functional groups, respectively. Further reduction of GO was confirmed by the disappearance of the shoulder peaks around 313 in MKrGO. A maximum absorbance peak for MKrGO was noticed at 276 nm. A similar observation was observed for other green reducing agents as well (Xu et al., 2018; Manchala et al., 2019, Mahmudzadeh et al., 2019). This observation revealed that this plant extract can be used as a reducing agent for the reduction of GO into the MKrGO.
Further, the bandgap of the GO and MKrGO are calculated by using Tauc plot with the help of UV absorbance values by applying of the following formula (Gaurav et al., 2019), (αhv)2 = A(hv-Eg)n; Where, α is absorption coefficient of the material, hν denotes photon energy, Eg -optical bandgap, n = 1 defined as a direct transition (constant). Values obtained from bandgap calculation are presented in Fig. 1d. Chemically synthesized GO shows a bandgap of about 2.72 eV. At the same time GO reduced using the MK plant extract shows bandgap of about 1.56 eV. The decrease in the bang gap value in the MKrGO indicates that successful exfoliation of the graphene with good semiconducting properties (Velasco-Soto et al., 2015).
3.5 FT-IR analysis
The functional groups present in the GO and MKrGO were confirmed by using FT-IR analysis as shown in Fig. 2. In GO, a broad peak at 3426 cm−1 confirms the presence of the hydroxyl group. The less intense peaks at 2926 and 2855 cm−1 represent the symmetric and asymmetric stretching of the CH group, respectively. A sharp peak at 1630 cm−1 was due to the aromatic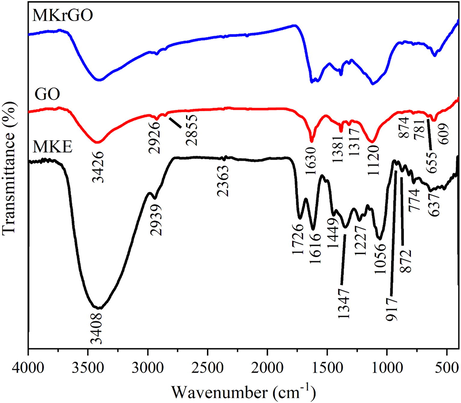
FT-IR spectra of exfoliated GO, MKrGO and Murraya koenigii extract.
C⚌C stretching and another peak at 1381 cm−1 revealed the presence of O—H bending of the carboxyl functional group over the GO surface. A peak at 1120 cm−1 confirms the presence of C—O stretching. At the same time, intensity of the oxygen-containing functional group in the MKrGO was decreased, which confirms the removal of the oxygen functional group from the surface of GO (Haghighi et al., 2013; Singh et al., 2016; Gan et al., 2018).
Further, a FTIR spectrum of an aqueous extract of M. koenigii (MKE) is also illustrated in Fig. 2. A broad peak at 3408 confirms the presence of a hydroxyl group of alcohols and phenolic molecules. Very weak peaks noticed at 2939 represent a C—H stretching of alkanes. A sharp peak at 1616 confirms the presence of N—H bends of primary amines. The less intense peak found at 1449 was due to the C—C stretching of aromatic groups. The narrow peak present at 1056 confirms the presence of the C—N stretch of aliphatic amines (Elumalai et al., 2015; Kumar et al., 2019). From previous studies, advanced analytical methods revealed that curry leaf was enriched with alkaloids (Mahanine, Mahanimbine, Isomahanine, etc), Flavonoids (Kaempferol, Catechin, etc), polyphenols including Selin-11-en-4α-ol and etc (Balakrishnan et al., 2020).
3.6 FESEM and TEM studies
Morphology and microstructure of GO and MKrGO are observed using FE-SEM and presented in Fig. 3. From Fig. 3a it is very clear that GO synthesized by modified hummer’s method looked like bundles and not exfoliated that much. Also, GO was apparent like very thicker due to the existence of carbonyl, hydroxyl, epoxy, and carboxyl group over the surface of GO (Rahman et al., 2014). Similarly, the microstructure of MKrGO appeared as crumpled and curved sheets. Fig. 3b clearly shows that MKrGO was exploited greatly with less thickness (Gan et al., 2018).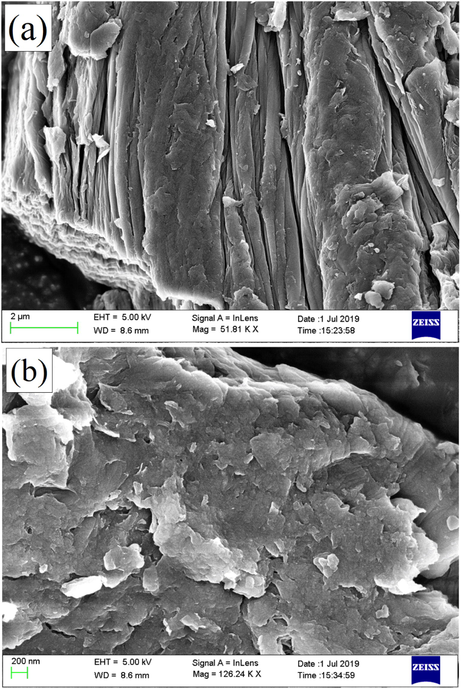
FESEM images of (a) exfoliated GO, and (b) MKrGO.
Similarly, both GO and MKrGO are subjected to the transmission electron microscopy, Fig. 4a, and b show TEM and selected area electron diffraction (SAED) pattern of MKrGO. From the bright field microscopic image, it was clear that the MKrGO was exploited significantly with few-layered graphene sheets wrinkled and transparent appearance. SAED pattern of MKrGO confirms that graphitic plane (0 0 2) with crystalline nature. The outcome of SAED was supported by the diffraction pattern obtained from the XRD analysis (Manchala et al., 2019).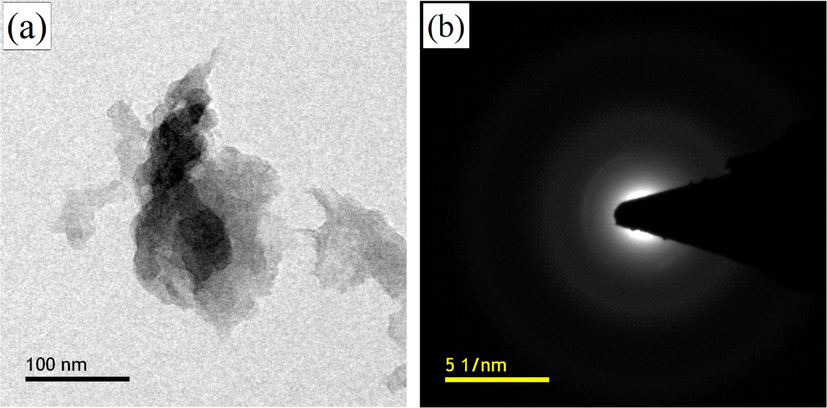
(a) TEM and (b) SAED pattern of MKrGO.
3.7 Photocatalytic degradation studies
For the photocatalytic degradation study, we have selected two dyes such as methylene blue and methyl orange. Two approaches such as direct sunlight exposure and UV-light exposure are applied to find out the suitable as well as effective way to eliminate the maximum level of dye. Sunlight exposure experiments are carried out on a bright sunny day between 11 am and 3 pm, which is the perfect time for the sunlight-driven photocatalytic experiment, since the maximum level of intensity could be available. Before the initiation of the experiment, MKrGO and the prepared dye solution were kept in a dark condition in a shaking incubator and mixed at 150 rpm for 30 min for the adsorption and desorption of dye molecules over the surface of MKrGO. Further, this mixture was exposed to sunlight and UV-C light for photocatalytic degradation.
3.8 Methylene blue (MB) degradation
After the exposure of MB along with the MKrGO in the sunlight and UV-light, the solution mixture was retrieved at a certain time interval and then the catalyst was separated from the dye solution by centrifugation. Then, UV–vis absorbance was measured at 663 nm as shown in Fig. 5. The degradation efficiency (%) and concentration–time profile (C/C0) are calculated from the absorbance values obtained for the initial dye concentration (C0) with the absorbance value obtained at specific time intervals (Ct) and presented in Fig. 5. Interestingly, MKrGO with MB while exposure to the sunlight shows steady decreases in the absorbance values (Fig. 5a) with increasing the time of exposure. At the 120th minute of exposure almost flat line of absorbance was noticed. At the same time for the UV-light exposure, a flat line was obtained within 90 min of the exposure (Fig. 5b). In terms of degradation efficiency, MKrGO with MB exposed to the sunlight gives 77% of the degradation in 120 min. Among this much degradation, 30% was achieved within the 15 min of the exposure time (Fig. 5c). Similarly, UV light exposure of the MKrGO with MB shows 68% of the degradation within the 90 min of the exposure time, among this about 46% of the degradation was attained within 15 min of the time (Fig. 5c). These observations are evident from the concentration with time profile as shown in Fig. 5d.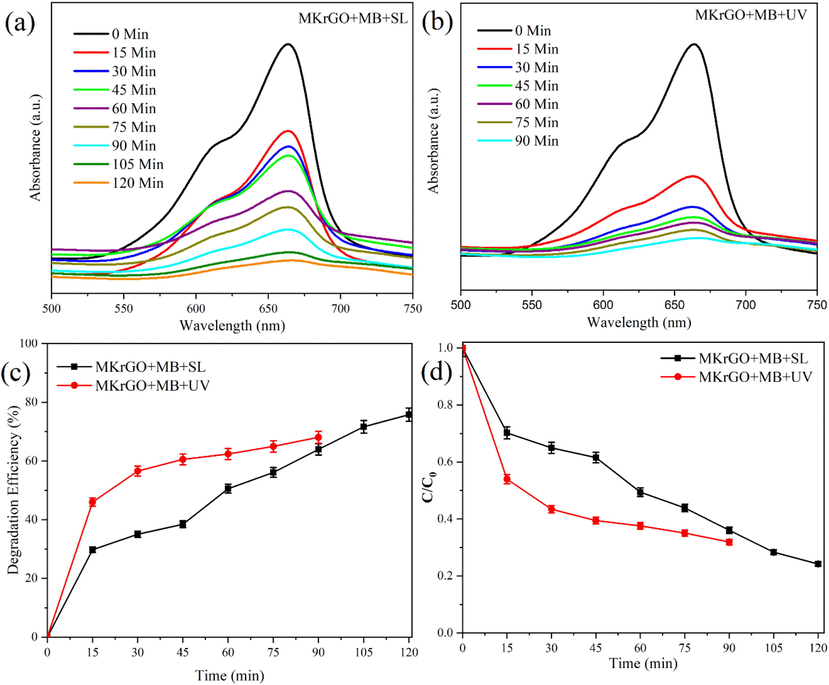
UV–vis absorption spectra of MB dye solution at different time intervals in the presence of MKrGO under sunlight and UV light exposure (a) MKrGO exposed under sunlight, (b) MKrGO exposed under UV light, (c) Degradation efficiency (%), and (d) Concentration versus time profile of photo degraded MB by catalyst MKrGO.
3.9 Methyl orange (MO) degradation
Similar to the MB degradation, methyl orange an azo dye also subjected to photocatalytic degradation using catalyst MKrGO. After degradation study, the solution was prepared as stated earlier. The separated solutions are used for the UV–vis absorbance at 464 nm and presented in Fig. 6. From this figure, it was very clear that MKrGO was effective against the MO dye. Absorbance values are decreased by increasing the exposure time (Fig. 6a and b). Degradation efficiency (%) and concentration–time profile (C/C0) were presented in Fig. 6c and d. From this figure, specific degradation percentage and decreases in the concentration versus time are mentioned, more specifically MKrGO was shown 80% of the MO degradation when exposed to the sunlight within 120 mins. The same catalyst shows only 69% of the MO degradation for the UV light exposure in 160 min of the exposure, which revealed that UV light is not that effective for the MO degradation. In both cases, a very gradual and linear degradation rate was observed. These observations are strongly confirming that the sunlight-driven photocatalytic degradation approach is a much better option for more effective removal of MO.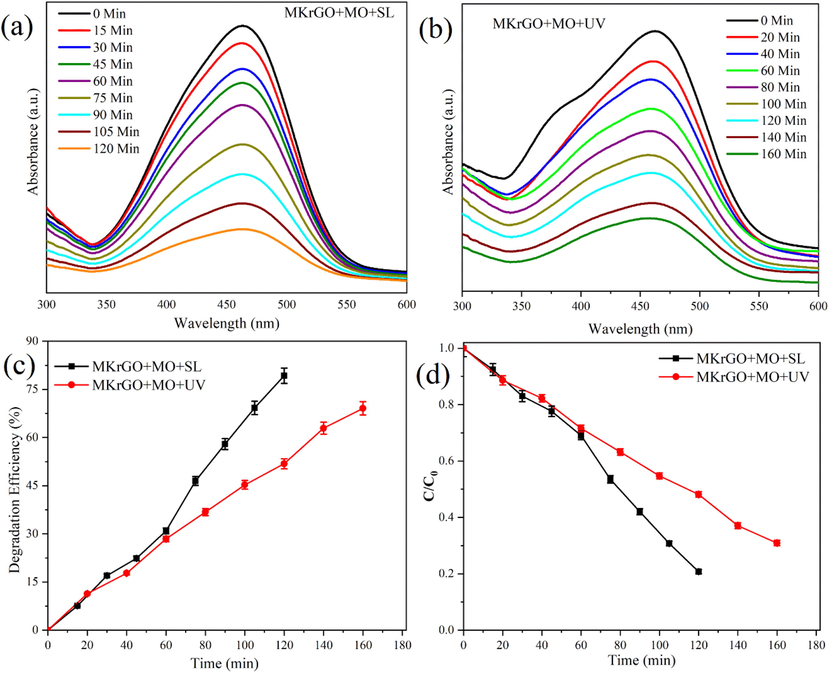
UV–vis absorption spectra of MO dye solution at different time intervals in the presence of MKrGO under sunlight and UV light exposure (a) MKrGO exposed under sunlight, (b) MKrGO exposed under UV light, (c) Degradation efficiency (%), and (d) Concentration versus time profile of photo degraded MB by catalyst MKrGO.
3.10 Mixed dye (MB and MO) degradation
The mixed dye solution was prepared by mixing both dyes in equal concentration and the prepared solution was stirred well to make sure complete dilution. These two dyes are most commonly used in many industrial sectors. Mixing of these two dye molecules may mimic the industrial dye solutions. Further, degradation was carried out with MKrGO as a catalyst. As done for the individual dye molecules, both sunlight and UV lights are exposed for a certain time and absorbance was measured at regular intervals as presented in Fig. 7. Degradation efficiency and concentration vs. time profile were calculated from the absorbance values obtained at different time intervals as shown in Fig. 7a and b. Absorbance obtained for the mixed dye solution with catalyst MKrGO at sunlight exposure (Fig. 7a) shows gradual decreases in both dye molecules (MO and MB) and almost a flat line was obtained within 80 min of the exposure. Degradation efficiency was calculated as 78% and 75% for MO and MB respectively (Fig. 7c and d). This degradation efficiency confirms that there is no much difference in the degradation level while carried out in the mixed conditions. Similarly, absorbance obtained for the UV light exposure shows that MB dye was degraded much faster than the MO solution (Fig. 7b). More specifically, MB was removed by 75% in the 210 min of the exposure, about 41% was degradation was obtained within the 30 min of the UV light exposure. At the same time, MO shows only 32% of the degradation in the 210 min of the exposure. From this observation, it is so clear that mixed dye solution is effectively degraded in the sunlight exposure in a very short time than UV light exposure.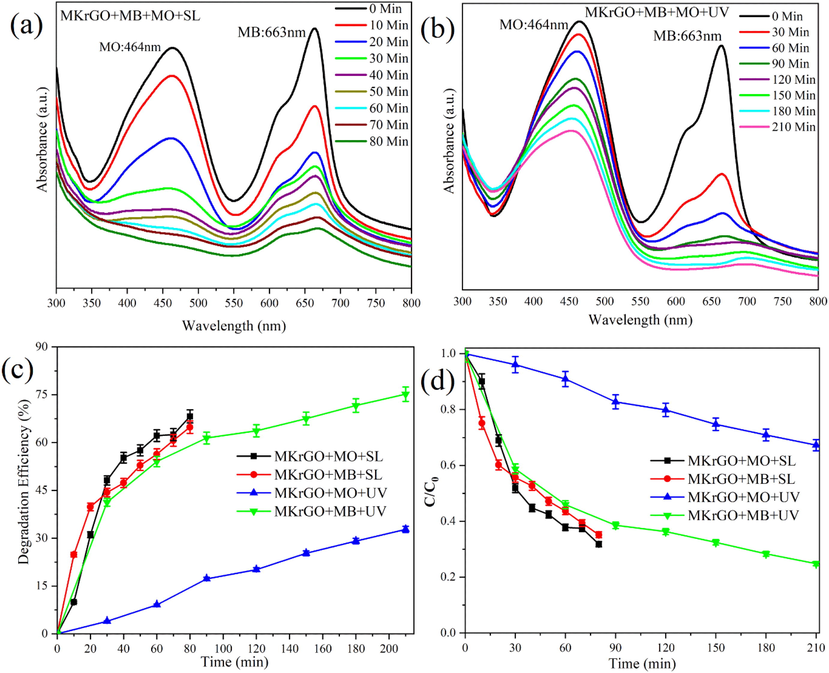
UV–vis absorption spectra of mixed (MB and MO) dye solution at different time intervals in the presence of MKrGO under sunlight and UV light exposure (a) MKrGO exposed under sunlight, (b) MKrGO exposed under UV light, (c) Degradation efficiency (%), and (d) Concentration versus time profile of photo degraded MB by catalyst MKrGO.
Many of the previously studied graphene and their composite materials are compared with their photocatalytic performance against the MB and MO dye removal in the presence of different light sources. Comparison have been presented in Table 1. Many of the researchers are evaluated GO with some known photocatalyst materials as a composite material for the improvement of the photocatalytic activity. For instance, Sarkar and Kumbhakar (2018) performed with ZnO and Zarrin and Heshmatpour (2010) carried out GO composite with TiO2 and obtained only 82% and 78% of MB and MO respective degradation efficiency even after 240 mins of visible light exposure. Many GO composite materials are showed about 90% of the degradation efficiency with longer exposure time (i.e. 180–360 min). But, MKrGO shows remarkable photocatalytic activity within a short time (i.e. 80–90 min). The degradation efficiency further can be improved by extending exposure time. Note: VL- Visible light; SL- Sunlight; UV- Ultraviolet light.
S.No
Catalyst
Dye
% of Degradation
Light/Condition
Time (mins)
Reference
1
TiO2/Nb2O5/RGO
MO
93
VL
240
(Zarrin and Heshmatpour, 2010)
2
TiO2/RGO
MO
78
VL
240
(Zarrin and Heshmatpour, 2010)
3
rGO-ZnO
MB
91
UV
60
(Sarkar and Kumbhakar, 2018)
4
TiO2/RGO
MB
82
VL
240
(Zarrin and Heshmatpour, 2010)
5
BaTiO3/GO
MB
95
UV
180
(Mengting et al., 2019)
6
TiO2/Nb2O5/RGO
MB
97
VL
240
(Zarrin and Heshmatpour, 2010)
7
ZnO-Graphene
MO
89.3
UV
360
(Beura and Thangadurai, 2018)
8
ZnO-Graphene
MO
99.1
SL
180
(Beura and Thangadurai, 2018)
9
Cu doped ZnO-Graphene
MO
89.1
SL
180
(Beura et al., 2019)
10
Cu doped ZnO-Graphene
MO
85.7
UV
360
(Beura et al., 2019)
11
GO–Clay nanocomposite
MB
87.35
UV
30
(Gogoi et al., 2019)
12
MKrGO
MO
80
SL
120
This work
13
MKrGO
MB
77
SL
120
This work
3.11 Photocatalytic degradation mechanism of MKrGO
The photocatalytic removal of organic dyes occurs through numerous phases. Initially, rGO a semiconductor material is illuminated by the light energy present in the natural sunlight, electron existing in the valence band engrosses energy and transfers to the conduction band (CB), which will generate the charge carriers. Further, charge carriers generated from previous steps might act either interact directly with organic molecules to decrease them or passage to the surface of rGO where it undergoes further reactions, which will lead to the formation of free radicals including —OH, HO2, O2–. In turn, formed free radicals might react with organic dyes and convert them to non-toxic molecules. Also, less bandgap value of MKrGO has major advantages, lower bandgap can simplify electron excitation with relatively low energy, which will assist to utilize a greater number of electrons are accessible in the CB, which enhances the photocatalytic removal of organic dyes (Beura and Thangadurai, 2017).
3.12 Recyclability of the catalyst
From the series of photocatalytic experiments, catalyst MKrGO was proven as an efficient material for the degradation of both dye molecules. Hence this graphene material was subjected to its capability towards the degradation of dye molecules over the subsequent cycles of the degradation. For this purpose’s catalyst was separated from each photocatalytic experiment and the same catalyst materials were used for the next cycle of degradation study. Before introducing to the catalytic reaction, MKrGO collected from each cycle was washed several times with deionized water to remove any dye molecules. Interestingly its stability was maintained with very slight changes over the 5 cycles of the degradation (Fig. 8a). Degradation efficiency was observed as 80% and 77% for MO and MB respectively for the 1st cycle and it was slightly decreased to 76% and 73% for MO and MB respectively at the 5th cycle of degradation. Also, at the end of the 5th cycle catalyst was washed and subjected for the XRD analysis as shown in Fig. 8b. From this analysis, it was evident that MKrGO was the same as before introducing into the photocatalysis study. This confirms the structural stability of the catalyst even after the 5 cycles of the degradation experiments. It can be used as the potential catalyst material for the degradation of the MB and MO dyes solution under direct sunlight exposure.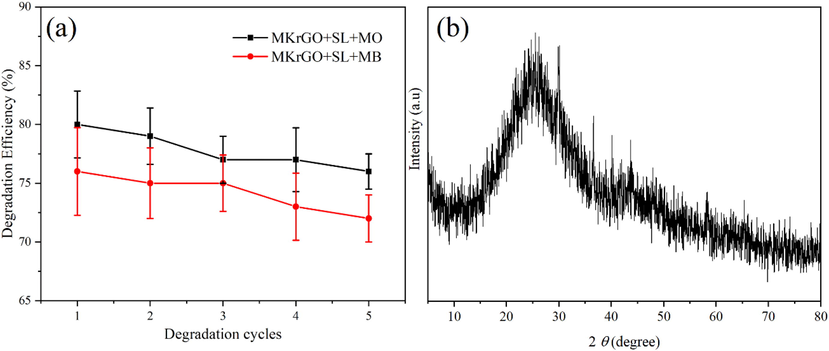
Reusability performance of MKrGO towards photodegradation of dye molecules. (a) degradation efficiency of different cycle (b) XRD analysis of MKrGO after 5th cycle of degradation.
4 Conclusions
In summary, easily available low-cost plant leaves of Murraya koenigii (curry leaf) was used for the green synthesis of reduced graphene oxide using a simple hydrothermal method. XRD, FT-IR, Raman spectroscopy, and UV–vis spectroscopy confirm that oxygen functional groups are completely removed from the GO surface. Besides, Raman analysis confirm the increase in the ID/IG ratio in MKrGO compared to GO. FESEM and TEM analysis confirm that reduced graphene oxides are exploited efficiently. Further, MKrGO was used as the single catalyst for the photocatalytic degradation of methylene blue and methyl orange dyes. The catalyst MKrGO degraded about 80% and 77% of MO and MB dye respectively while exposed to natural sunlight. Also, nearly 50% of the degradation was obtained within 20–30 min of sunlight exposure. Overall, catalyst MKrGO has identified as potential material for sunlight-driven photodegradation of MB and MO dye molecules effectively. This sustainable eco-friendly material can be used as a potential candidate to treat industrial dye solutions.
Acknowledgments
The authors extend their appreciation to the Deanship of Scientific Research at King Saud University for funding the work through the research group project No RG-1440-054.
Declaration of Competing Interest
The authors declare that they have no known competing financial interests or personal relationships that could have appeared to influence the work reported in this paper.
References
- Medicinal profile, phytochemistry, and pharmacological activities of Murraya koenigii and its primary bioactive compounds. Antioxidants. 2020;9:101.
- [Google Scholar]
- Enhanced photo-induced catalytic activity of Cu ion doped ZnO – graphene ternary nanocomposite for degrading organic dyes. J. Water Process Eng.. 2019;32:100966
- [Google Scholar]
- Structural, optical and photocatalytic properties of graphene-ZNO nanocomposites for varied compositions. J. Phys. Chem. Solids. 2017;102:168-177.
- [Google Scholar]
- Effect of Sn doping in ZnO on the photocatalytic activity of ZnO-Graphene nanocomposite with improved activity. J. Environ. Chem. Eng.. 2018;6:5087-5100.
- [Google Scholar]
- Aloe vera assisted facile green synthesis of reduced graphene oxide for electrochemical and dye removal applications. RSC Adv.. 2017;7:26680.
- [Google Scholar]
- Green preparation using black soybeans extract for graphene-based porous electrodes and their applications in supercapacitors. J. Power Sources. 2016;322:31-39.
- [Google Scholar]
- Ureolytic bacteria mediated synthesis of hairy ZnO nanostructure as photocatalyst for decolorization of dyes. Mater. Chem. Phys.. 2020;243:122619
- [Google Scholar]
- Elumalai, K., Velmurugan, S., Ravi, S., Kathiravan, V., Ashokkumar, S., 2015. Bio-fabrication of zinc oxide nanoparticles using leaf extract of curry leaf (Murraya koenigii) and its antimicrobial activities. Mater. Sci. Semiconductor Proces. 34,365–372.
- Gaurav, A., Beura, R., Kumar, J.S., Thangadurai, P., 2019. Study on the effect of copper ion doping in zinc oxide nanomaterials for photocatalytic applications. Mater. Chem. Phys. 230, 162–171.
- Graphene oxide clay nanocomposite as an efficient photo-catalyst for degradation of cationic dye. Mater. Chem. Phys.. 2019;232:438-445.
- [Google Scholar]
- Green-synthesis of reduced graphene oxide nanosheets using rose water and a survey on their characteristics and applications. RSC Adv.. 2013;3:13365-13371.
- [Google Scholar]
- Three-dimensional graphene supported catalysts for organic dyes degradation. Appl. Catal. B: Environ.. 2018;228:19-28.
- [Google Scholar]
- A facile and green method for synthesis of reduced graphene oxide/Ag hybrids as efficient surface enhanced Raman scattering platforms. J. Hazard. Mater.. 2015;283:123-130.
- [Google Scholar]
- Green reduction of graphene oxide using Eucalyptus leaf extract and its application to remove dye. Chemosphere. 2018;208:417-424.
- [Google Scholar]
- Enhanced removal of methyl orange on exfoliated montmorillonite/chitosan gel in presence of methylene blue. Chemosphere. 2020;238:124693
- [Google Scholar]
- Artemisia herba-alba asso eco-friendly reduced few-layered graphene oxide nanosheets: structural investigations and physical properties. Green Chem. Lett. Rev.. 2016;9:122-131.
- [Google Scholar]
- Kumar, R.C.D., Dubey., Maheshwari, D.K., 2019. Bio-efficacy of acetonic leaf extract of Murraya koenigii with reference to its antibacterial spectrum against food-borne bacteria. Biosci. Biotech. Res. Comm. 12(3): 658-664.
- Graphene as a transparent conducting and surface field layer in planar Si solar cells. Nanoscale Res. Lett.. 2014;2014(9):349.
- [Google Scholar]
- In-situ synthesis of rGO-ZnO nanocomposite for demonstration of sunlight driven enhanced photocatalytic and self-cleaning of organic dyes and tea stains of cotton fabrics. J. Hazard. Mater.. 2018;360:193-203.
- [Google Scholar]
- Biocompatible synthesis of reduced graphene oxide from Euphorbia heterophylla (L.) and their in-vitro cytotoxicity against human cancer cell lines. Biotechnol. Rep.. 2019;24:00376.
- [Google Scholar]
- Partly reduced graphene oxide aerogels induced by proanthocyanidins for efficient dye removal. Bioresour. Technol.. 2019;282:148-155.
- [Google Scholar]
- The novel and efficient reduction of graphene oxide using Ocimum sanctum L. leaf extract as an alternative renewable bio-resource. New J. Chem.. 2018;42:19945.
- [Google Scholar]
- Highly potent radical scavenging-anti-oxidant activity of biologically reduced graphene oxide using Nettle extract as a green bio-genic amines based reductants source instead of hazardous hydrazine hydrate. J. Hazard. Mater.. 2019;371:609-624.
- [Google Scholar]
- Novel and highly efficient strategy for the green synthesis of soluble graphene by aqueous polyphenol extracts of Eucalyptus bark and its applications in high-performance supercapacitors. ACS Sustainable Chem. Eng.. 2019;7:11612-11620.
- [Google Scholar]
- Applicability of BaTiO3/graphene oxide (GO) composite for enhanced photodegradation of methylene blue (MB) in synthetic wastewater under UV-vis irradiation. Environ. Pollut.. 2019;255:113182
- [Google Scholar]
- Moztahida, M., Lee, D.S., 2020. Photocatalytic degradation of methylene blue with P25/graphene/polyacrylamide hydrogels: Optimization using response surface methodology. J. Hazard. Mater. 400, 123314.
- Green synthesis of silver nanoparticles decorated reduced graphene oxide nanocomposite as an electrocatalytic platform for the simultaneous detection of dopamine and uric acid. Mater. Chem. Phys.. 2020;252:123302
- [Google Scholar]
- A facile green synthesis of reduced graphene oxide by using pollen grains of Peltophorum pterocarpum and study of its electrochemical behavior. RSC Adv.. 2014;4:56910.
- [Google Scholar]
- Fabrication of Ce3+ substituted nickel ferrite-reduced graphene oxide heterojunction with high photocatalytic activity under visible light irradiation. J. Hazard. Mater.. 2020;394:122593
- [Google Scholar]
- Biosynthesized gold nanoparticles as photocatalysts for selective degradation of cationic dye and their antimicrobial activity. J. Photochem. Photobiol. A: Chem.. 2020;400:112704
- [Google Scholar]
- A new, fast and facile synthesis method for reduced graphene oxide in N,N-dimethylformamide. Synthe. Met.. 2020;269:116576
- [Google Scholar]
- Green synthesis and characterization of graphene nanosheets. Mater. Res. Bull.. 2015;63:51-57.
- [Google Scholar]
- Selective band gap manipulation of graphene oxide by its reduction with mild reagents. Carbon. 2015;93:967-973.
- [Google Scholar]
- Photocatalytic degradation of organic dyes and antimicrobial activity of silver nanoparticles fast synthesized by flavonoids fraction of Psidium guajava L. leaves. J. Mol. Liq.. 2018;263:187-192.
- [Google Scholar]
- Vancomycin-assisted green synthesis of reduced graphene oxide for antimicrobial applications. J. Colloid Interface Sci.. 2018;514:733-739.
- [Google Scholar]
- Preparation and characterization of green graphene using grape seed extract for bioapplications. Mater. Sci. Eng. C. 2016;65:345-353.
- [Google Scholar]
- Photocatalytic activity of TiO2/Nb2O5/PANI and TiO2/Nb2O5/RGO as new nanocomposites for degradation of organic pollutants. J. Hazard. Mater.. 2010;351:147-159.
- [Google Scholar]
- Synthesis and application of V2O5-CeO2 nanocomposite catalyst for enhanced degradation of methylene blue under visible light illumination. Chemosphere. 2019;235:935-944.
- [Google Scholar]


