

Translate this page into:
Effects of temperature on the oxygen consumption rate and gill fine structure of hybrid grouper, Epinephelus fuscoguttatus ♀ × E. Lanceolatus ♂
⁎Corresponding author at: Department of Earth Sciences and Environment, Faculty of Science and Technology, Universiti Kebangsaan Malaysia, 43600 UKM, Bangi, Selangor D.E., Malaysia. simon@ukm.edu.my (Simon Kumar Das)
-
Received: ,
Accepted: ,
This article was originally published by Elsevier and was migrated to Scientific Scholar after the change of Publisher.
Peer review under responsibility of King Saud University.
Abstract
Elevated ocean water temperature influences the physiological properties of fishes. This study is expected to characterize the oxygen consumption rate (OCR) and gill morphology in different temperature in hybrid grouper, tiger grouper × giant grouper (TGGGH). TGGGH specimens were distributed into four temperature groups starting from 22, 26, 30 and 34 °C within a recirculatory system under controlled conditions for 30 days in triplicates. Intermittent flow respirometry was directed to distinguish the impact of temperature on the OCR, and scanning electron microscopy was conducted to observe the gill morphology. Results indicated that the OCR of TGGGH increased significantly from 22.98 ± 1.16 mg O2 h−1 to 37.08 ± 1.56 mg O2 h−1 when temperature increased from 22 to 34 °C. Values of respired energy (RE) increased from 456.35 ± 11.41 Jh−1 at 22 °C to 737.88 ± 3.79 Jh−1 at 34 °C. Meanwhile, values of temperature quotients (Q10) were maximum at 22 °C–26 °C and minimum at 26 °C–30 °C. The favored temperature assessed from Q10 was between 26 °C and 30 °C. Gill lesions were significantly observed at 22 °C and 34 °C. The outcomes proposed that this fish species may neglect to maintain sufficient O2 uptake in future atmospheric situations. Thus, optimum oxygen consumption is required for maintaining the TGGGH in aquaculture environment.
Keywords
Gill morphology
Grouper
Oxygen consumption
Physiology
Temperature

1 Introduction
Grouper mariculture is a promising industry in Asian markets due to its high marketable price. Among the marketable grouper species are giant grouper or scientifically known as Epinephelus lanceolatus and tiger grouper or scientifically known as Epinephelus fuscoguttatus). However, these demanding species are facing slow growth rate problem (Senoo, 2006). Therefore, a new tiger grouper–giant grouper hybrid (TGGGH) was developed to overcome this issue where TGGGH was cultured under controlled conditions in the research hatchery (Ch’ng and Senoo, 2008).
Significant research is needed in culturing TGGGH and one of it is by determining the oxygen consumption rate or short termed as OCR. OCR is an important metabolic factor and indicator of various physiological processes to increase the growth of TGGGH (Mazumder et al., 2019). OCR examines environmental conditions that are favorable for maximizing the energy of fish growth (Brougher et al., 2005; Shi et al., 2011). This parameter influenced by various factors, including fish developmental stage, physiological state, and environmental parameters (Mazumder et al., 2019). Maximal oxygen uptake after the fish has been exposed to desire temperature for a certain time has been proposed as critical factors during climate change (Pörtner and Knust, 2007) for example, elevated temperature. The maximize capacity for oxygen uptake in elevated temperature can no longer keep pace with the rise in resting metabolism, triggering a reduction in processes like feeding and reproduction, finally the growth development (Nelson, 2016). Among the approach used to quantify the oxygen uptake (MO2) of fish were swim tunnel respirometry and static respirometry (Chabot et al., 2016a). However, according to research by Svendsen et al. (2016a), the intermittent flow (or static) respirometry propose the most benefit and commonly used.
A rise in temperature of 10 °C may cause a twofold increase in the physiological rate and functions of fishes (Schmid-Nielsen, 1997). However, temperatures exceeding the optimal upper limit of a fish species negatively affect its wellbeing by escalating its metabolic rate and successive oxygen demand (Zheng et al., 2008). The temperature coefficient (Q10) denotes the degree of an organism’s sensitivity to temperature (Díaz et al., 2007). Q10 of ectotherms from aquatic habitats can be calculated by evaluating oxygen consumption at different temperatures.
Furthermore, the gill in fishes is considered an essential site for oxygen uptake and key organ where alterations are made to maintain oxygen uptake and the extent of high-impact metabolic execution at high temperatures (Evans et al., 2005). At the point when metabolic prerequisites increase due to temperature and when accessible O2 becomes constrained, the useful surface zone of gills can be expanded through gill redesign; in this manner, maintenance of O2 uptake is important to help digestion as example in Crucian carp, Carassius carassius (Sollid and Nilsson, 2006) and goldfish, Carassius auratus (Mitrovic and Perry, 2009). In any case, the impacts of temperature towards gill formation in marine fish (e.g., grouper) have been rarely investigated. Thus, in this study, the effects of temperature changes in term of OCR and gill morphology of a newly developed TGGGH was to be determined.
2 Materials and methods
2.1 Fish experimental framework
Sixty TGGGH (weight of 145 ± 3 g; length of 17 ± 2 cm) were acquired from an incubation center in Banting, Selangor, Malaysia (2°49′0″ N, 105°30′0″ E), and shipped to the research facility in Universiti Kebangsaan Malaysia. TGGGH were scattered arbitrarily between two stocking tanks, where it can hold to 1200 L in total volume. Supply of ocean water (30 PSU) and temperature (26 °C) was kept uphold at each tank with 30 TGGGH, fed with commercial pellets utilized in the incubation center (De et al., 2016a). When the fishes began feeding and defecating, they were arbitrarily designated to 12 exploratory tanks (five fish for each tank) with equivalent sizes (62 cm × 31 cm × 23 cm, 175 L) for 30 days. During the trial, TGGGH were administered a similar pellet diet (commercial pellet with 50% protein, 8% lipid, and 7% sugar, CP Group, Malaysia) twice a day during morning and evening (De et al., 2016b). Three replicates were utilized for each change in exploratory temperature (22, 26, 30 and 34 °C). A radiator (ADA warmer 200 W, Malaysia) and chiller (TECO TK-500 aquarium chiller, Malaysia) were used in order to adjust the temperature to the exploratory temperature by a pace of 1 °C everyday. A total of 12 h light and 12 h dark were provided during experimental framework. Total length, TL and volume, Ww of TGGGH were estimated before the OCR analysis started.
2.2 Oxygen consumption rate (OCR)
The OCR was determined through computerized and intermittent flow-through respirometry (Chabot et al., 2016b). A respiratory chamber (cylindrical Plexiglas length 25.5 cm, volume, 4.3 L diameter 15 cm) was drenched in a water bath inside a glass aquarium (Fig. 1). The closed respirometer functions when the chamber is closed, water is flushed and replaced to prevent hypoxia and the build-up of metabolites. The respirometer consists of a chamber linked to two submersible pumps, which to recirculate water past the oxygen sensor during metabolic rate measurements, while the other one flushed water out of the chamber after measurement has been done (Chabot et al., 2016b). The oxygen sensor and pumps were connected to a central control unit and computer for oxygen logging while the measurement was done. A radiometer oxygen cathode (Perimed E5250) was connected to evaluate the oxygen partial pressure (pO2) which then employed respirometry software from Loligo Systems (www.loligosystems.com). Respirometry tests included a progression of 20 min cycles, and each cycle started when the respirometer was closed (Mazumder et al., 2019).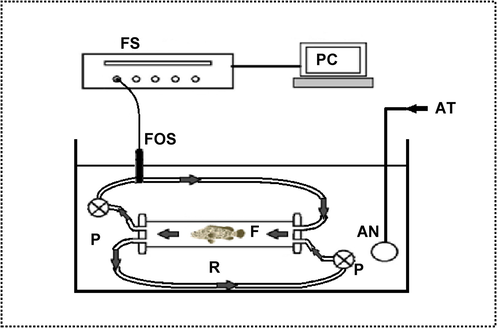
Experimental set up for measurement of oxygen consumption in TGGGH. F: fish, R: respirometer, P: Pump, AN: airstone, AT: aerator, FOS: fiberoptic oxygen meter sensor, FS: firesting oxygen analyser, PC: computer.
Measurement of oxygen consumption was evaluated at the end of 30 days to ensure sufficient acclimatization of fishes in all targeted temperatures (22, 26, 30, 34 °C). Fish has not been fed in 24 h prior to oxygen consumption, thus confirming that feeding did not interrupt the measurement (Donelson et al., 2011). The OCR during each measurement phase is derived from MO2 = 20[C(t0 − t1)][(Vr − Va)/(t1 − t0)]M, where t0 and t1 are the instances at which the measurement period starts and ends (min), respectively; C (t0 − t1) is the oxygen consumed in water (mg O2 h−1) at time t; Vr is the volume of the respirometer; Va is the volume of fish and M is the fish mass (kg) (Svendsen et al., 2016b). The results are analyzed in data collection software, showing one MO2 value for each TGGGH (in every 5 min). Oxygen solubility tables were utilized to change over pO2 to oxygen concentrations in milligrams of O2 per 20 min.
Several oxygen consumptions inside the respirometer might be caused by the microbial respiration such as background respiration. This can be done by evaluating the OCR of fish absence in the respirometer. Background respiration is quantified prior to the first session of OCR measurements among the fish. One full respirometry cycle with no fish presence was adjusted to 5 min flush, 1 min wait, and 5 min measurement was run to quantify the background respiration.
Respired energy (RE) was determined by duplicating the OCR (MO2) with the conversion factor 19.9 J mg−1 O2 (Elliott and Davison, 1975). Moreover, Q10 was estimated for TGGGH by Q10 = (MO2t1/MO2t0)10/(t1− t0), (Schmidt-Nielsen, 1997), where MO2t1 and MO2t0 were OCRs at t1 and t0; t0 is the lower temperature while t1 is the higher temperature from two temperatures for OCR.
2.3 Gill morphology
After 30 days of exposure to the experimental temperatures and measuring OCR, TGGGH were euthanized by means of a cranial blackout concussion, and their second gills were expelled. The excised gills were rinsed with physiological saline (0.9% NaCl solution) for 10 mins. It was replaced with 100% ethanol (EtOH) for dehydration (Murdy and Takita, 1999). The specimens were dried using CO2, mounted on metal stubs with colloidal silver paste, and sputter coated with a thin conductive gold film. Each specimen was micrographed at different magnifications via a scanning electron microscope (SEM, JSM-IT800, USA) at the Center for Research and Instrumentation, UKM, Malaysia, to obtain a clear image of the morphological characteristics of primary and secondary lamellae.
2.4 Statistical analysis
Quadrative regressions were used for the variances in OCR and RE, oxygen consumed and oxygen demand. Data were initially run for normality and homogeneity of variance between the different temperature groups using a Kolmogorov-Smirnov (K-S) test on residuals and Bartlett’s test for homogeneity of variance (Sokal and Rohlf, 1995). Statistical comparisons among all groups were achieved by an analysis of variance (ANOVA). A pairwise post-hoc Tukey test was run if the ANOVA described significant differences in order to identify specifically the groups that were different (Zar, 1984). Data expressed in the text, figures as well as table are mean ± standard error, S.E. while level of statistical significance was set at P < 0.05. Polynomial and logistic regressions were performed where necessary to describe the relationships among the variables. R-square (r2) values were used to assess the fit of the regression models. For polynomial regression, linearity of the regression coefficients implies the assumptions of linear equation would hold. Although r2 is rarely used for logistic regression nevertheless the values were also reported. All statistical analyses were performed by MINITAB Version 20 (StatSoft Inc., Tulsa, OK, USA) and Microcal Origin Version 12 (OriginLab, Northampton) computer software (Das et al., 2014; Mazumder et al., 2019).
3 Results
3.1 Oxygen consumption rate (OCR)
The oxygen concentrations indicated significant differences at the given experimental temperatures for every 5 min interval (Fig. 2). This result suggested that the OCR was significantly affected in different experimental temperatures (P < 0.05; Fig. 3), with the values increased as temperature increased and differed significantly at various temperatures. In particular, the OCR increased from 22.93 to 37.08 when temperature increased from 22 °C to 34 °C (Fig. 3).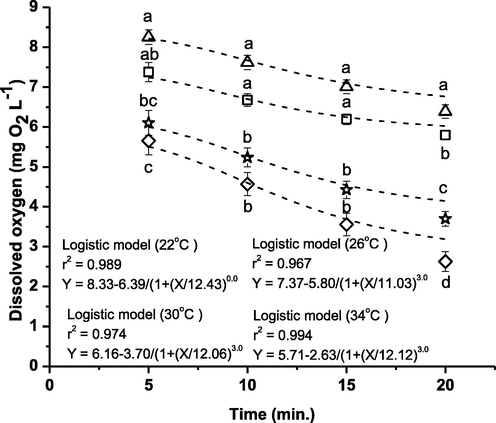
Relationships between temperature and dissolved oxygen concentration in TGGGH at different time interval in closed respirometry. The open triangle represents 22 °C, open square represents 26 °C, open star represents 30 °C and open diamond represents 34 °C. Data shown are mean ± SE (n = 15). Means among treatments with different letters at a particular time indicate significance (P < 0.05).
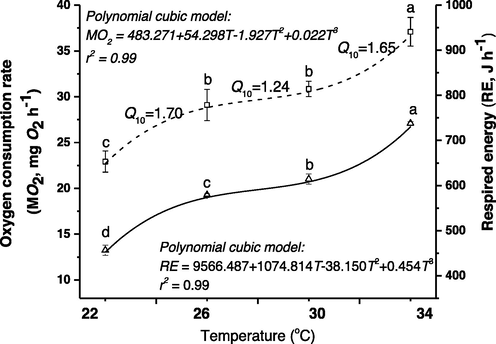
Relationship between temperature and OCR and respired energy in closed respirometer. Values of Q10s are presented between 22 and 26 °C, 26 to 30 °C and 30 to 34 °C. Values are expressed as mean ± SE (n = 15). Trends with different letter vary significantly (P < 0.05).
As presented in the polynomial cubic model (MO2 = − 483.271 + 54.298 T − 1.927 T2 + 0.022 T3), OCR showed a highly significant relationship with temperature (r2 = 0.99). The corresponding RE rate increased significantly from 22 to 34 °C (Fig. 3). RE data that was measured adapted well with the polynomial cubic model (RE = 9566.487 + 1074.814 T − 38.150 T2 + 0.454 T3; r2 = 0.99). The relationships between OCR and RE differed from each other (Fig. 3).
Q10, was the highest among 22 and 26 °C (1.70) while the lowest was in between 26 and 30 °C (1.24). A moderate Q10 value was observed between 30 °C and 34 °C (1.65). These data indicated that the final desired temperature of TGGGH ranged between 26 °C and 30 °C (Fig. 3). The relationship between OC and OD displayed opposite trends (Fig. 4) and was precisely described with a logistic model (r2 = 0.988–0.996).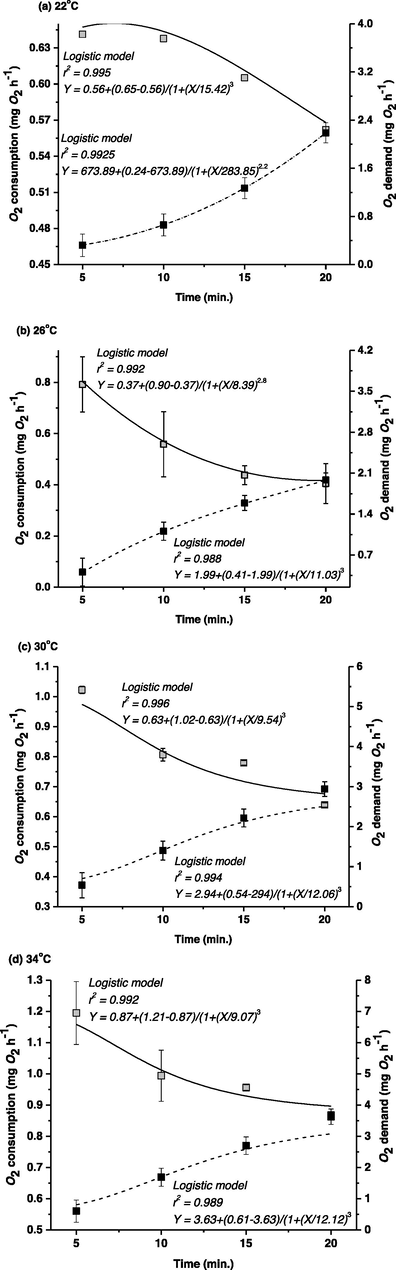
Link among O2 consumption and O2 demand in different experimental temperatures exposed. Grey squares represent data for O2 consumption and black squares represent data for O2 demand. Values are mean ± SE (n = 15) recorded at different time interval (min.) at a particular temperature. The mean data are fitted to the logistic regression and are expressed by the solid and dashed lines indicating O2 consumption and O2 demand, respectively.
3.2 Gill morphology
The changes of gill morphology in TGGGH were observed through SEM (Fig. 5). Normal secondary lamella in the gill sections could be found at 26 °C and 30 °C. However, significant lesions were observed in secondary lamella in the gill sections of TGGH in 22 °C and 34 °C. Thickness of the secondary lamella was measured to support the SEM images (Fig. 6).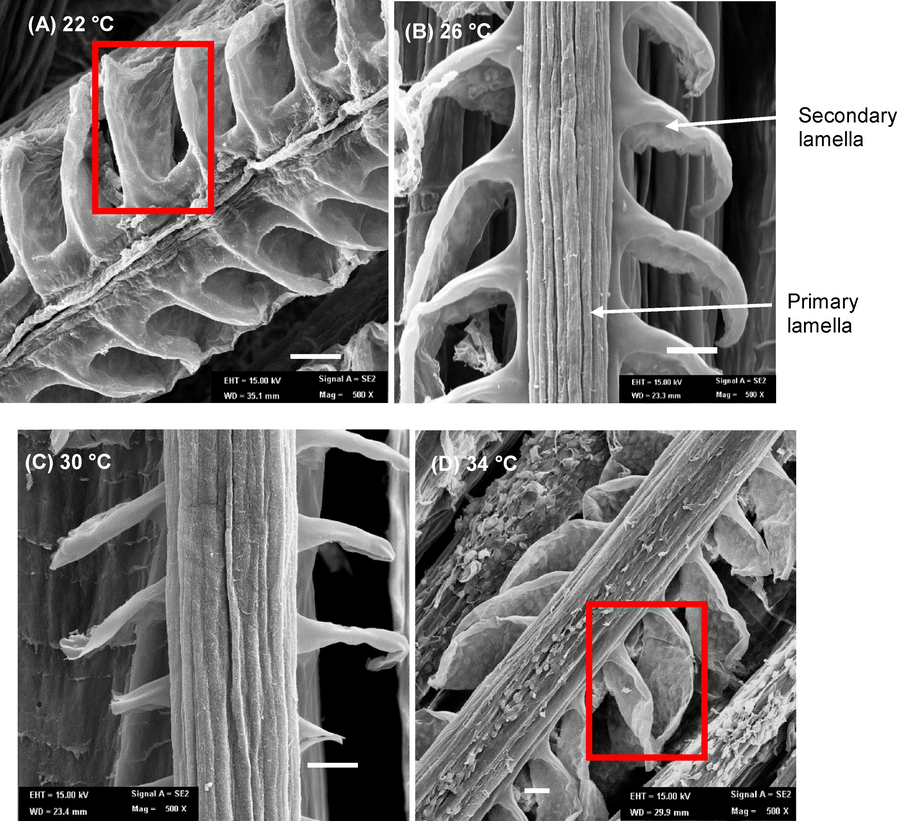
SEM of TGGGH’s gill (magnification 1000 × ) of diferent temperature group: (A) 22 °C, (B) 26 °C, (C) 30 °C and (D) 34 °C. Arrow indicates primary lamella and secondary lamella. Gill lesion on secondary lamella are marked in red box for image A and D although no lesion are to be seen in image B and C.
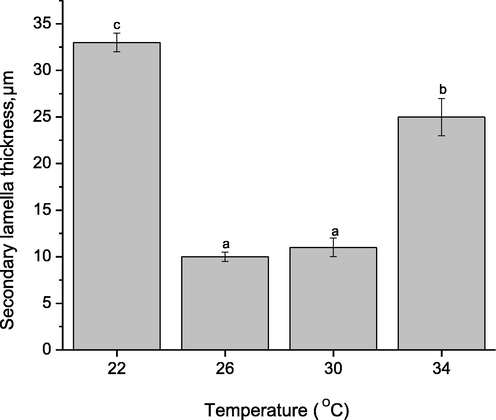
Secondary lamella thickness after being expose to diferent experimental temperature groups. Data are presented as mean ± SE (n = 15). Bars bearing different letters are significantly different (P < 0.05) among treatments.
4 Discussion
Oxygen (O2) uptake rate of a fish is dependent on various abiotic and biotic factors. For example, it is affected by temperature, which is an abiotic factor; that is, a normal increase in O2 uptake is associated with an increase in water temperature (Das et al., 2004; Mazumder et al., 2018). Current study showed that the OCR consistently rise as temperature elevated, supported the finding of previous results observed in other teleost (Das et al., 2018; Noor et al., 2019). Moreover, relationship between temperature with OCR was precisely fitted with the polynomial cubic model (r2 = 0.996).
Each fish species has a unique threshold temperature, and fishes cannot survive well beyond this range. Although TGGGH are cultured in marine cages and captive water, their threshold limits are similar to those of their parents (22 °C–34 °C) (Cheng et al., 2013). Our results showed that TGGGH specimens experienced stress in the laboratory when they were exposed to temperatures exceeding 26 °C and 30 °C. The OCR of the TGGGH specimens increased as water temperature increased. However, more energy was proportionately consumed for their metabolism when they were under stress at 22 °C and 34 °C. Thus, TGGGH may acclimate to water temperature to some extent as some resilient species do (Neer et al., 2006; Mazumder et al., 2019).
Q10 is the proportion of aquatic organisms’ metabolic ability to adapt to temperature changes. The most noteworthy Q10 was found between 22 °C and 26 °C, and the least Q10 was observed between 26 °C and 30 °C in TGGGH. Q10 at 30 °C and 34 °C was 1.65, proposing that TGGGH experienced slight changes in their digestion from 30 °C to 34 °C. The lower Q10 at 30 and 34 °C compared to 22 and 26 °C may relate to expanded vitality use for growth development. This supported our previous study which uncovered that the best growth performance was observed in 26 °C (De et al., 2016b). A perfect temperature can be evaluated based on the Q10 of OCR (Das et al., 2004). TGGGH displayed a low Q10 likely because fishes have chemical frameworks with explicit ideal temperatures. In this study, in view of the most minimal Q10, the most favored temperature of TGGGH was observed between 26 °C and 30 °C.
The SEM pictures of the gills of TGGGH presented observable morphological contrasts among the four distinct temperatures. Comparable outcomes were accounted for in other aquaculture species, such as C. auratus and C. carassius (Sollid et al., 2005; Bowden et al., 2014). The progressions observed in SEM pictures were reliable with the morphological gill redesign observed in temperate species to help in processing trade of gas when temperature changes (Evans et al. 2005). The varieties in gill measurements could be clarified by physiological changes, such as changes in perfusion designs. To improve O2 uptake, fishes normally carry out cutaneous gas trade. This result indicated that TGGGH might not succeed for keeping enough oxygen in when sea surface temperatures elevating as impact of global warming.
5 Conclusion
Our study demonstrated that the temperature range of 26 and 30 °C showed the best results in OCR. Additionally, no lesions were observed on gill morphology at this temperature range. This work provides a basis for conducting future research on a suitable temperature for the culture of this newly developed TGGGH species.
Acknowledgments
This research was supported by UKM-Sime Darby Foundation Chair in Climate Change grant (project No: ZF-2019-003), Universiti Kebangsaan Malaysia through the research grant (project no: GUP-2017-023), and Ministry of Higher Education Malaysia (project no: FRGS/1/2017/STG03/UKM/02/5, Long Term Research Grant Scheme (LRGS), Vot # 56040, and Strategic Research grant UMT, Vot # 55196). A preliminary review of this manuscript was provided by Prof. Atsushi Ishimatsu, Nagasaki University, Japan. We are thankful to Omar Al-Dossary (Editor in Chief Journal of King Saud University-Science) and anonymous reviewers for their valuable comments that considerably improved the earlier version of this manuscript.
Declaration of Competing Interest
The authors declare that they have no known competing financial interests or personal relationships that could have appeared to influence the work reported in this paper.
References
- Alterations in gill structure in tropical reef fishes as a result of elevated temperatures. Comp. Biochem. Physiol. Part A: Molecul. Integr. Physiol.. 2014;175:64-71.
- [Google Scholar]
- Comparative Oxygen Consumption and Metabolism of Striped Bass Morone saxatilis and its Hybrid M. chrysops♀ × M. saxatilis♂. J. World Aquacult. Soc.. 2005;36:521-529.
- [Google Scholar]
- Ch’ng, C. L., Senoo, S., 2008. Egg and larval development of a new hybrid grouper, tiger grouper Epinephelus fuscoguttatus × giant grouper E. lanceolatus. Aquacult. Sci. 56(4), 505-512.
- Metabolic rate in fishes: definitions, methods and significance for conservation physiology. J. Fish Biol.. 2016;88(1):1-9.
- [Google Scholar]
- The determination of standard metabolic rate in fishes. J. Fish Biol.. 2016;88(1):81-121.
- [Google Scholar]
- Salinity and temperature tolerance of brown-marbled grouper Epinephelus fuscoguttatus. Fish Physiol. Biochem.. 2013;39(2):277-286.
- [Google Scholar]
- X-radigraphic observations of food passage and nutrient absorption along the alimentary tract of archerfish, Toxotes jaculatrix. Bull. Mar. Sci.. 2014;90:903-919.
- [Google Scholar]
- Thermal tolerance and oxygen consumption of Indian Major Carps acclimated to four temperatures. J. Therm. Biol.. 2004;29:157-163.
- [Google Scholar]
- Effects of temperature on the growth, gastric emptying time, and oxygen consumption rate of mahseer (Tor tambroides) under laboratory conditions. Aqucult. Rep.. 2018;12:20-24.
- [Google Scholar]
- Optimum Temperature for the Growth Form of Tiger Grouper (Epinephelus fuscoguttatus ♀) × Giant Grouper (E. lanceolatus ♂) Hybrid. Sains Malaysiana. 2016;45(4):541-549.
- [Google Scholar]
- Effect of temperature and diet on growth and gastric emptying time of the hybrid, Epinephelus fuscoguttatus ♀ × E. lanceolatus ♂. Aquacult. Rep.. 2016;4:118-124.
- [Google Scholar]
- Temperature preference and oxygen consumption of the largemouth bass Micropterus salmoides (Lacepede) acclimated to different temperatures. Aquacult. Res.. 2007;38:1387-1394.
- [Google Scholar]
- Acclimation to predicted ocean warming through developmental plasticity in a tropical reef fish. Glob. Chang. Biol.. 2011;17:1712-1719.
- [Google Scholar]
- Energy equivalents of oxygen consumption in animal energetics. Oecologia.. 1975;19:195-201.
- [Google Scholar]
- The multifunctional fish gill: dominant site of gas exchange, osmoregulation, acid-base regulation, and excretion of nitrogenous waste. Physiolog. Rev.. 2005;85:97-177.
- [Google Scholar]
- Temperature and diet effect on the pepsin enzyme activities, digestive somatic index and relative gut length of Malabar blood snapper (Lutjanus malabaricus Bloch & Schneider, 1801) Aquacult. Rep.. 2018;9:1-9.
- [Google Scholar]
- Effects of acclimation temperatures on the respiration physiology and thermal coefficient of Malabar blood snapper. Resp. physiol. Neurobiol.. 2019;268:103253
- [Google Scholar]
- The effects of thermally induced gill remodeling on ionocyte distribution and branchial chloride fluxes in goldfish (Carassius auratus) J. Exp. Biol.. 2009;212:843-852.
- [Google Scholar]
- Periophthalmus spilotus, a new species of mudskipper from Sumatra (Gobiidae: Oxudercinae) Ichthyol. Res.. 1999;46:367-370.
- [Google Scholar]
- Standard oxygen consumption of seasonally acclimatized cownose rays, Rhinoptera bonasus (Mitchill 1815), in the northern Gulf of Mexico. Fish Physiol. Biochem.. 2006;32:67-71.
- [Google Scholar]
- Oxygen consumption rate v. rate of energy utilization of fishes: a comparison and brief history of the two measurements. J. Fish Biol.. 2016;88(1):10-25.
- [Google Scholar]
- An Evaluation of the Effect of Salinities on Oxygen Consumption and Wellbeing in the Hybrid Grouper Epinephelus fuscoguttatus × E. lanceolatus. Turkish. J. Fish. Aquat. Sci.. 2019;19(12):1017-1023.
- [Google Scholar]
- Climate change affects marine fishes through the oxygen limitation of thermal tolerance. Science. 2007;315:95-97.
- [Google Scholar]
- Animal physiology: adaptation and environment. Cambridge University Press; 1997.
- Hybrid production between tiger grouper Epinephelus fuscoguttatus× giant grouper Epinephelus lanceolatus (fish culture in Southeast Asia 64) Aquanet Magazine. 2006;12:58-63.
- [Google Scholar]
- Effects of temperature and salinity on oxygen consumption of tawny puffer Takifugu flavidus juvenile. Aquacul. Res.. 2011;42:301-307.
- [Google Scholar]
- Biometry: the principles andpractice of statistics in biological research. New York: WH. Freeman & Co.; 1995.
- Plasticity of respiratory structures-adaptive remodeling of fish gills induced by ambient oxygen and temperature. Resp. Physiol. Neurobiol.. 2006;154:241-251.
- [Google Scholar]
- Temperature alters the respiratory surface area of crucian carp Carassius carassius and goldfish Carassius auratus. J. Exp. Biol.. 2005;208:1109-1116.
- [Google Scholar]
- Sources of variation in oxygen consumption of aquatic animals demonstrated by simulated constant oxygen consumption and respirometers of different sizes. J. Fish Biol.. 2016;88(1):51-64.
- [Google Scholar]
- Design and setup of an intermittent-flow respirometry system for aquatic organisms. J. Fish Biol.. 2016;88:26-50.
- [Google Scholar]
- Biostatistical analysis (2nd.). Prentice Hall USA; 1984.
- Effects of temperature and salinity on oxygen consumption and ammonia excretion of juvenile miiuy croaker, Miichthys miiuy (Basilewsky) Aquacult. Intern.. 2008;16:581-589.
- [Google Scholar]


