

Translate this page into:
Landslide hazard assessment of the Neom promising city, northwestern Saudi Arabia: An integrated approach
⁎Corresponding author. akahal@ksu.edu.sa (Ali Y. Kahal)
-
Received: ,
Accepted: ,
This article was originally published by Elsevier and was migrated to Scientific Scholar after the change of Publisher.
Peer review under responsibility of King Saud University.
Abstract
Landslides hazard as one of the major environmental threats of the Neom promising city in northwestern Saudi Arabia has been assessed through data integration of several sources including topographic, geologic, and seismologic data sets. Moreover, Landsat imagery and historical landslide data are introduced in assessing landslide susceptibility of the study area. All these data oriented to generate eight thematic layers representing eight landslide conditioning factors. These factors arranged according to their relative importance for landslide susceptibility mapping as follows: slope angle, elevation, curvature, aspect, earthquake density, fault density, drainage density, and lineaments density. These factors were assessed using GIS through a numerical rating scheme for thematic layers. The ranks and weights were given in association with intensive field studies and authors’ experiences. The estimated values of Landslide Potential Index (LPI) varies from 32 up to 107. Then, the resultant landslide susceptibility map classifies the landslide hazards into three relative classes of susceptibility: high, moderate, and low. Furthermore, this map was tested through several field checks and the extracted historical landslides within Neom area as well. This landslide susceptibility map will boost decision-making authority while executing the developing projects throughout the Neom promising area either avoiding strategic facilities or applying corrective geotechnical procedures to minimize the landslide hazardous impact for Neom city.
Keywords
Landslide
Susceptibility
GIS
Thematic layers
Neom
Saudi Arabia

1 Introduction
There are several environmental threats for Neom city (Fig. 1) as landslides phenomena that are common in this city due several factors so, this research aims to reduce the environmental threats this city that will be one of the major, important and strategic projects tin Saudi Arabia. The Neom project is a centerpiece of the 2030 vision plan of Saudi Arabia to grow and diversify the Saudi economy and position the country to play a leading role in global development. The Government of Saudi Arabia aims to complete the first section of Neom by 2025. The strategic project will be powered totally by renewable energy sources, and the estimated cost of this project is approximately $500 billion. While Neom is being driven and initially funded by Saudi Arabia, it is an international project that will be led, populated, and funded by people globally.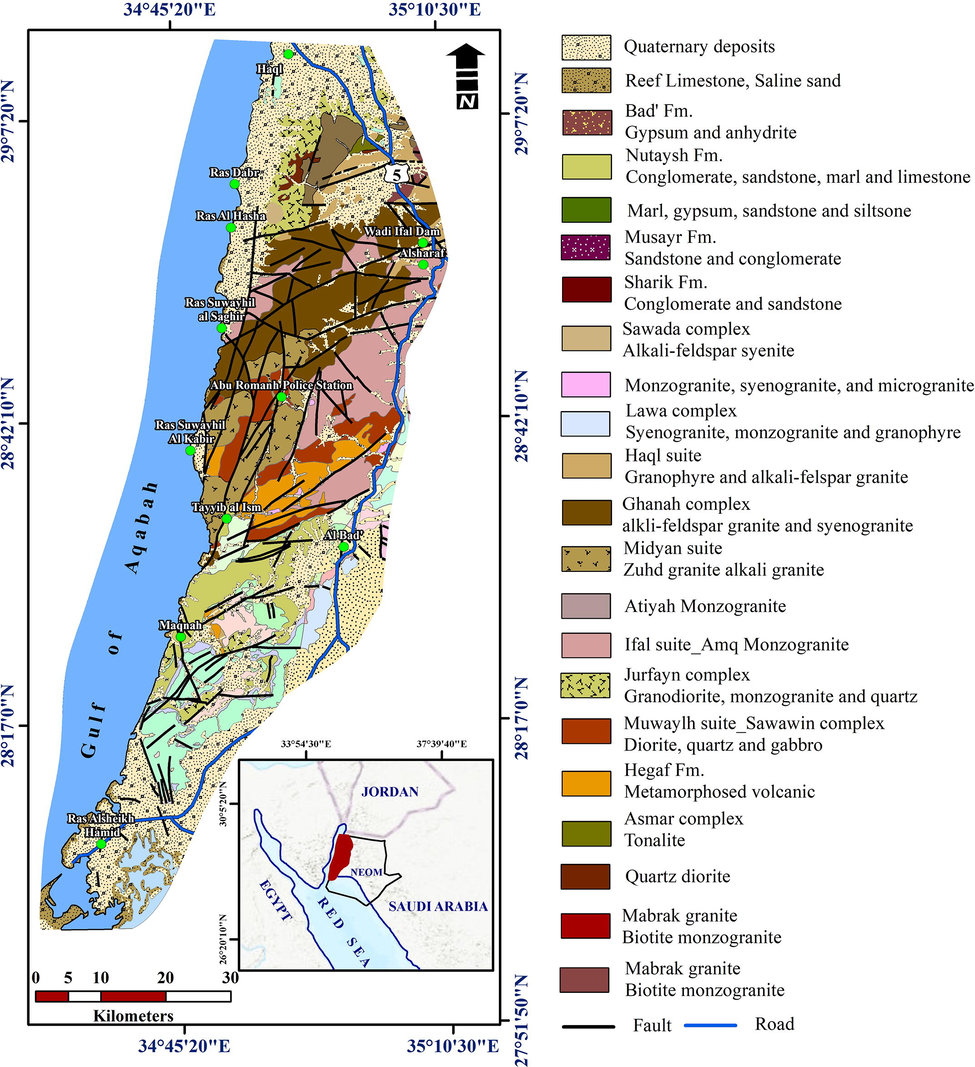
Location and geologic map of the Neom studied area.
Several studies have used different techniques to assess earthquake-induced landslides worldwide (Wang et al., 2000; Akgun et al., 2008; Miles and Keefer, 2009; Yin et al., 2010; Miles, 2011; Xu et al., 2012; Li et al., 2013; Dikshit et al., 2020a, 2020b). Kamp et al. (2008) used satellite imagery and GIS package to act as a spatial database to analyze 2252 landslides caused by 2005 Kashmir earthquake. The GIS framework provides a suitable environment in which to spatially integrate several layers that contribute to susceptibility to landslides ( Dhakal et al., 2000; Sameen et al., 2019). In addition, other studies have applied different methodologies to delineate landslides hazards zones. Researchers have geotechnically monitored unstable slopes, soil behavior, and rainfall (Abraham et al., 2020a; Dikshit et al., 2020c). The accessibility of used data, and the vitality of the hazardous impact all have a critical influence on these methodologies (Anabalagan, 1992; Sarkar et al., 1995).
2 Regional geological setting
The geologic setting of Neom area includes Proterozoic stratiform, the Paleozoic sandstones, and the Mesozoic-Cenozoic sedimentary successions. These geologic variations have different response levels to landslide according to their lithological characteristics and textures (Dai et al., 2001; Duman et al., 2005; Yalcin, 2005). These rock units consist of the Hegaf Formation, Sawawin Complex, Ifal suite, Zuhd alkali granite, Sharik Formation, Musayr Formation, and Nutaysh Formation (Fig. 1). The Hegaf Formation consists of a variety of highly folded volcanic, volcaniclastic, and subordinate epiclastic rocks. The metavolcanic rocks of the area are mainly andesitic in composition (Clark, 1986), including the metamorphosed mafic and felsic tuffs, meta-andesite, metabasalt, amphibolites, hornfels, mica schist and metamorphosed siltstone . The Sawawin complex composed of heterogeneous mixture of metadiorites (granodiorite to gabbro) that intruded the Hegaf Formation. Medium-grained diorite and fine- to medium-grained quartz diorite, in which amphibole and biotite are partly altered to chlorite, are the most common rock types. Many of these mafic bodies are later intruded by granitic rocks of the Ifal suite as well as by numerous younger mafic dikes.
The Ifal suite in the Neom project area is characterized by large, irregular-shaped plutons of monzogranitic and granodioritic compositions that generally form the low-relief areas traversed by numerous mafic and felsic dikes. The monzogranites are coarse to very coarse grained in size and highly porphyritic. Because of its relatively younger age, the plutons of Ifal suite intruded both the Sawawin complex and the Hegaf Formation. The Zuhd alkali granite is characterized by predominantly equigranular and coarse-grained plutons. This group of granites is dissected by a series of faulted blocks from the Gulf of Aqaba fault system, which to great extent destroyed the original form of intrusions.
3 Material and methods
The methodology used in this study (Fig. 2) involved a selection of key factors: generation of data layers in the GIS; numerical rating assignments to factors; calculation of the landslide potential index (LPI); suitable classification of landslide susceptibility; and validation of the resulting map. These factors include slope angle, elevation, curvature, aspect, earthquake density, fault density, drainage density, and lineaments density. Through the GIS technique, the spatial variability and manipulation of information associating the different terrain factors as distinct layers were provided. Indicated that a different model for each land system is required to reflect the specific operating conditions. Thus, the technique adopted in the current study may be appropriate in the Neom project study area, which has its own geologic, topographic, geomorphologic, and seismologic characteristics.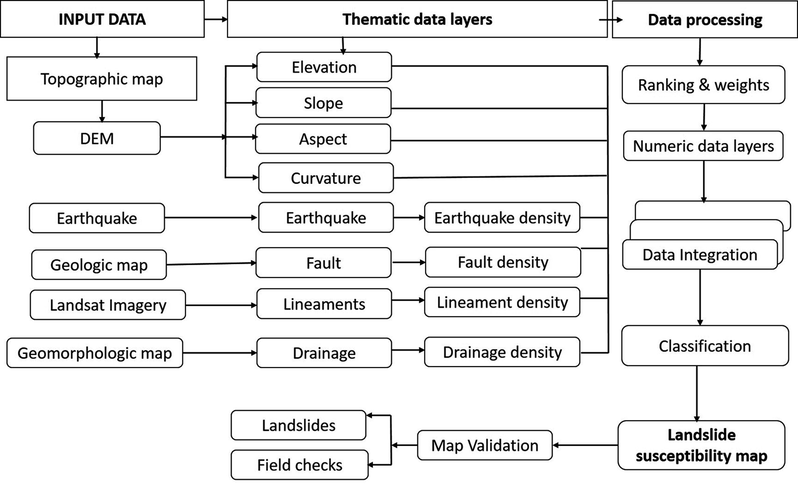
Flow chart summarize the materials and methods used in this study.
4 Thematic data layers
4.1 Drainage pattern
Neom area receives 20 mm of precipitation where temperature reaches 47° C within summer season. Rainfall generally occurs during the winter months; however, no rainfall in some years, versus other years in which the rainfall is heavy. The DEM of Neom area has been drawn. The Arc GIS hydrology tool was used for delineating the drainage network through ArcGIS 10.2. The elevation ranges from 1858 m above mean sea level (amsl) to 4 m below mean sea level (bmsl). The highest elevations cover the dominant part of the area. The drainage network is dendritic in nature and is influenced by the topography. All the elements have been measured and extracted. In order to describe each basin, certain features have been used: linear drainage basin characteristics and two aerial drainage basin characteristics. The linear physiognomies include stream ordering (Strahler, 1952), the mean of the branching ratio, the total drainage length, the drainage frequency, and drainage density as well.
The stream delineation using Strahler’s method indicates that Neom area is drained by a fourth-order stream that flows in the north-to-south direction. The entire region under investigation has 5406 km2 while the length of streams is 1396 km. The stream density (Fig. 3) is 0.258 km/km2 and is very coarse. The coarse drainage network is an indication of the permeable lithological units and sediments. Drainage density influences the surface runoff with risk of floods increasing as drainage density increased.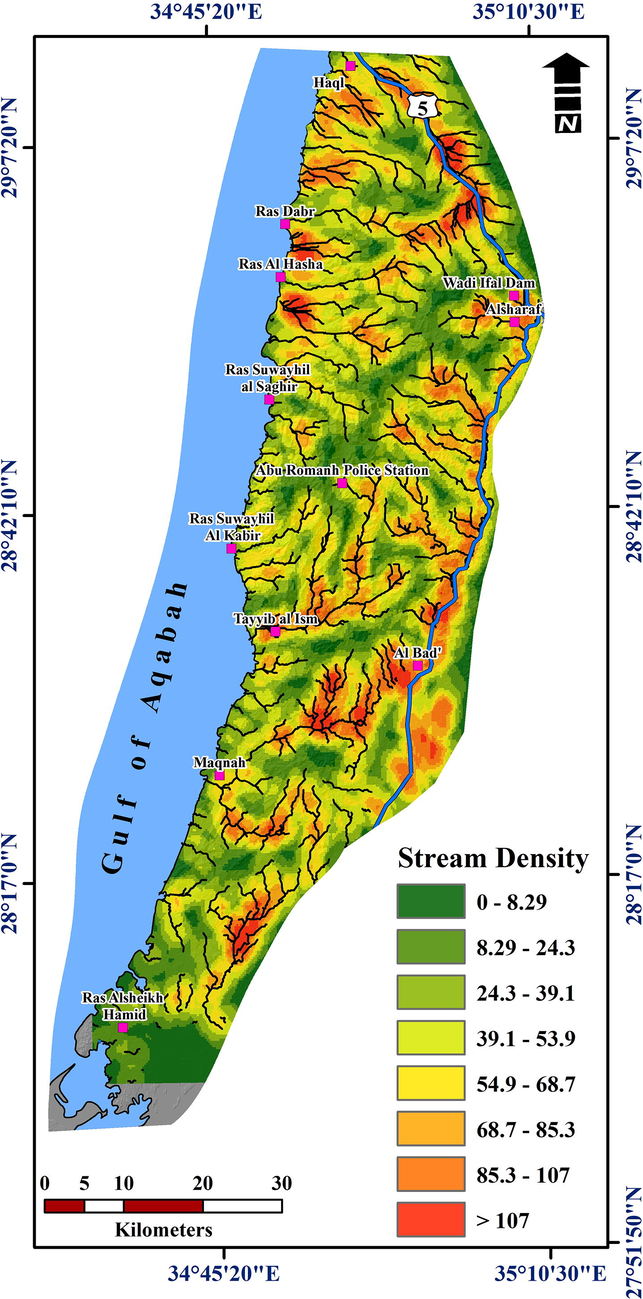
The stream density map for the studied area.
4.2 Topographic layers
To predict model of landslide susceptibility, a DEM plays a significant role to derive the elevation, slope aspect, slope angle, and drainage thematic layers. Based on the DEM, the elevations of Neom area were identified where they range from 0.0 to 1858 m amsl. A model developed by Gao and Lo (1995) produced a nonlinear regression graph showing the relationship between elevations and landslide. In the current study, the elevation map was generated based on Gao and Lo model using the map algebra in ArcMap 10.2 to evaluate the possibilities of landslides.
Slope angle is vital factor in landslide stability assessment where the slope gradient is one of the effective factors for slope stability. Gentle slopes have less landslide probability because of their lower shear stresses (Dai et al., 2001), whereas a higher slope degree increases these stresses. Various authors use slope angle factor for landslide susceptibility mapping (Cevik and Topal, 2003; Lee et al., 2004; Yalcin, 2005; Pourghasemi et al., 2013a, 2013b; Regmi et al., 2014). The slope angle map for Neom area has been calculated (Fig. 4). The slope values extend from 0° to >45°. The slope classes of 0° to <45° cover the maximum area, whereas the steep slopes, defined as slopes > 45°, cover the west–central zone of Neom area.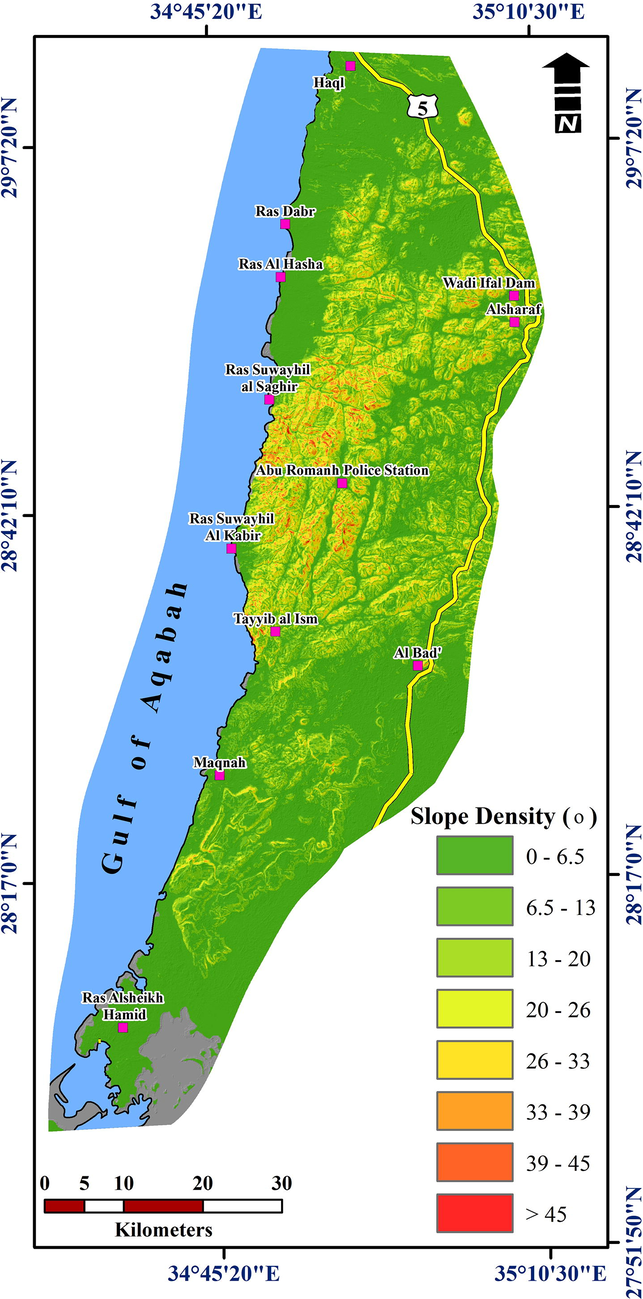
The slope angle distribution within the area of study.
A slope aspect, which refers to the horizontal direction of mountain slope faces, was extracted as well from the DEM with a 10-m spatial resolution. Several studies considered slope aspect as a contributing factor in landslide (Saha et al., 2005; Lee et al., 2004; Yalcin, 2005). This layer has impact on meteorologic and morphologic properties of the site. Based on the field survey and literature review, the most common landslides are located on north (N), northwest (NW), and northeast (NE) facing slopes. Landslides were particularly few in number on south (S) and southwest (SW) facing slopes. Accordingly, the aspect slope was classified according to the directions susceptible for landslides into very high (N and NE), high (NW and SW), moderate (S and SE), low (W and E) and very low (flat surface).
Curvature is the curvature of a line formed by a random plane intersection with the terrain surface. The value for curvature may be either positive or negative. A positive curvature characterizes an upwardly convex surface, while an upwardly concave surface on one point denotes a negative curvature. If its value is close to zero, the curvature may have a flat shape. Curvature plays a crucial role in landslide modelling and in modifying the characteristics of the landforms. A convex surface absorbs moisture completely, while a concave surface retains moisture for a long period. In this study, a curvature map was used after reclassifying it into eight classes.
4.3 Structural layers
The surface lineaments were derived from Landsat imagery and were verified through several field investigations (Kahal, 2020). These lineaments include faults, fractures, joints, dike discontinuities, and shear zones. In general, lineaments represent linear topographic features of regional extent that reflect crustal structure. Lineaments can reflect subsurface structures as well although, they are surficial topographic features. The lineament density was computed using Saraf (1999) approach of line density analyst extension through ArcMap 10.2 and was classified into low (<0.73 m/m2), moderate (0.73 – 1.5 m/m2), high ((≥1.5 m/m2) (Fig. 5).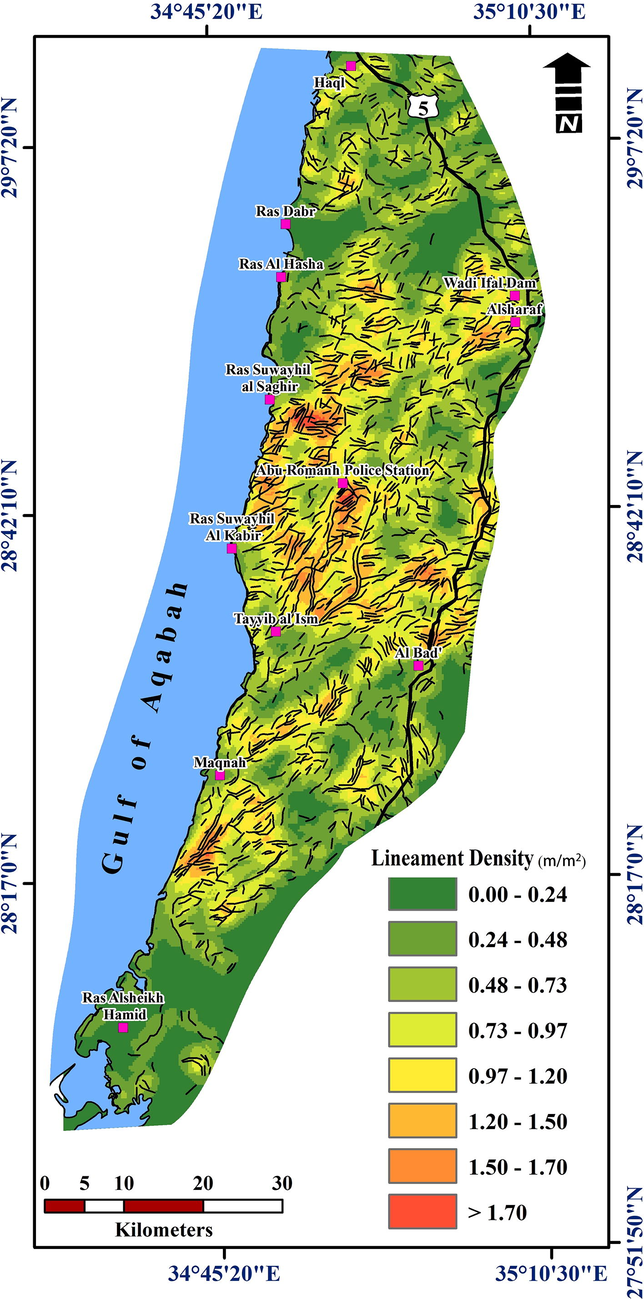
The lineament density distribution inside the area of study.
The fault lines were detected using Sobel filter to calculate gradients for edge detection and the directional nature . The Sobel kernel has been executed along all directions to define linear features in their directions. The fault zones have been verified at several locations through the field checks (Kahal, 2020). The four dominate directions of faults affect the study area including NE/SW, NNE/SSW, WNW/SSE and E/W directions. The NE-SW faults characterized by short lengths are parallel to the main direction of dikes intruding into the Precambrian basement rocks. Moreover, a set of fractures composed of E/W trending strike slip faults is considered subordinate in abundance relative to the other sets. These sets of faults cut up the basement rocks into NNE/SSW trending elongate blocks tilted toward the Gulf of Aqaba. A fault buffer zone map was generated using polygon mode in the ARC/INFO environment. The fault buffer zone map was converted to raster in order to consider it as thematic layer. Therefore, the fault density was derived using the kernel density function to also consider as important thematic layer (Fig. 6).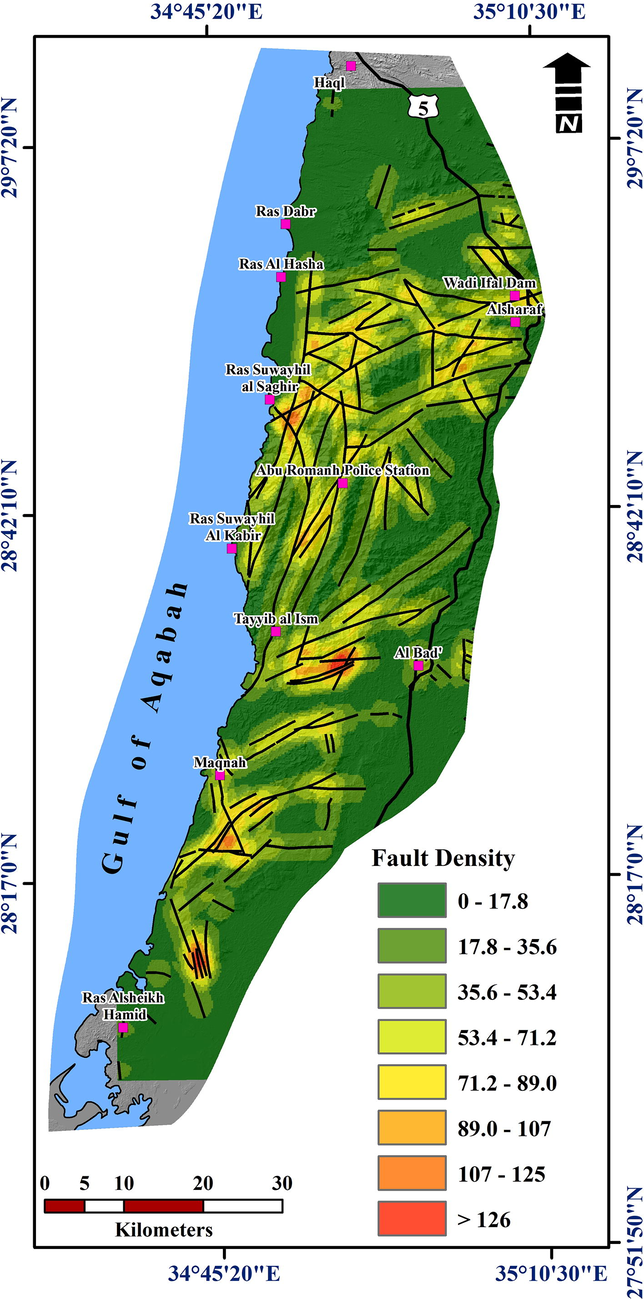
The fault density distribution throughout the Neom investigated area.
4.4 Earthquakes layer
The earthquake events can help researchers to understand the landslide triggering processes and their hazardous impact in Neom area. These earthquake data have been compiled from several seismologic data centers around the area of interest. It is indicated that the epicentral distribution of earthquakes extending between latitudes 28.5° and 29.0°. Seismicity of the Gulf of Aqabah occurs as isolated sequences, and four distinctive sequences were prominent in the years 1983, 1990, 1993, and 1995. Despite most of these sequences being characterized by moderate-sized earthquakes, the 1995 earthquake sequence had a main-shock magnitude of Mw 7.2 with maximum intensity of IX (Modified Mercali Intensity, MMI, scale) in the epicentral area, including the Neom project city location. This earthquake caused severe landslides in the epicentral area including Neom region, in which at least 11 people were killed and 47 injured. Furthermore, damage happened in many parts of the Sinai Peninsula, including these injuries and fatalities: one person was killed and two were slightly injured at Haql; one person died of a heart attack and several people were injured at Eilat, in addition to the substantial damage that occurred with the power breakdowns and liquefaction experienced. Moreover, this earthquake was felt from Sudan in the south to Lebanon and Syria in the north. These earthquake activities have a significant impact and consequently could threaten human lives and strategic projects in the Neom area.
To address these significant issues, an earthquake density map was created by ArcGIS through the spatial distribution of the epicenters to define the anomalous zones of Neom area. The earthquake density was computed using the kernel density analyst extension of ArcMap 10.2 to evaluate the magnitude per unit area. The earthquake density map was classified into low (<3.770), moderate (from 3.780 to 14.7) and high (≥14.7) density. The earthquake density map of Neom area was derived considering the earthquake events from 1900 to 2019 (Fig. 7).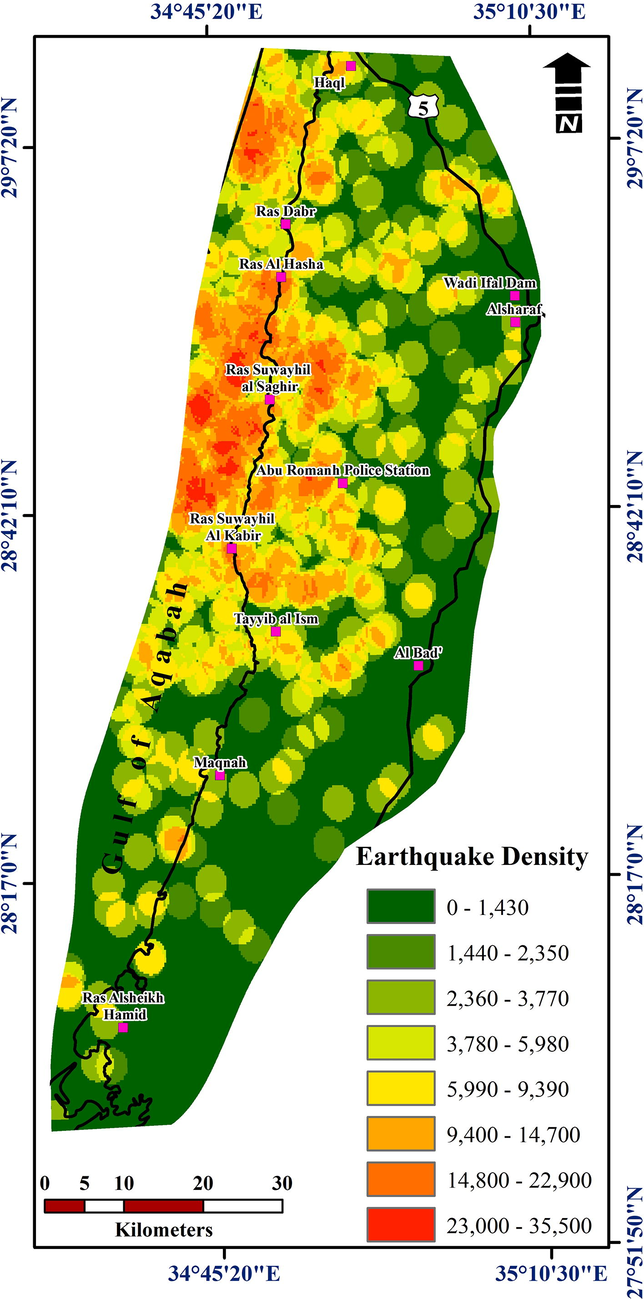
The earthquake density variation for Neom studied area.
5 Landslides inventory map
The application of historical information for landslide susceptibility mapping has been addressed by many authors (Sarkar et al., 1995; Guzzetti, 2000; De La Ville et al., 2002; Honda et al., 2002; Yamaguchi et al., 2003; van Westen et al., 2006; Petley, 2008; Abuzied et al., 2016). The current study extracted the location of landslides using high-resolution Landsat imagery. The collected data were assembled to create the final inventory map (Fig. 8). Field observation was carried out for verifying the extracted landslides through Neom projected area based on several aspects including: contrast, shape, size, bare soil, and geomorphologic features (De La Ville et al., 2002; Youssef et al., 2009; Abuzied et al., 2016). Based on field inventories and historical data, 1402 landslides in Neom area have been extracted.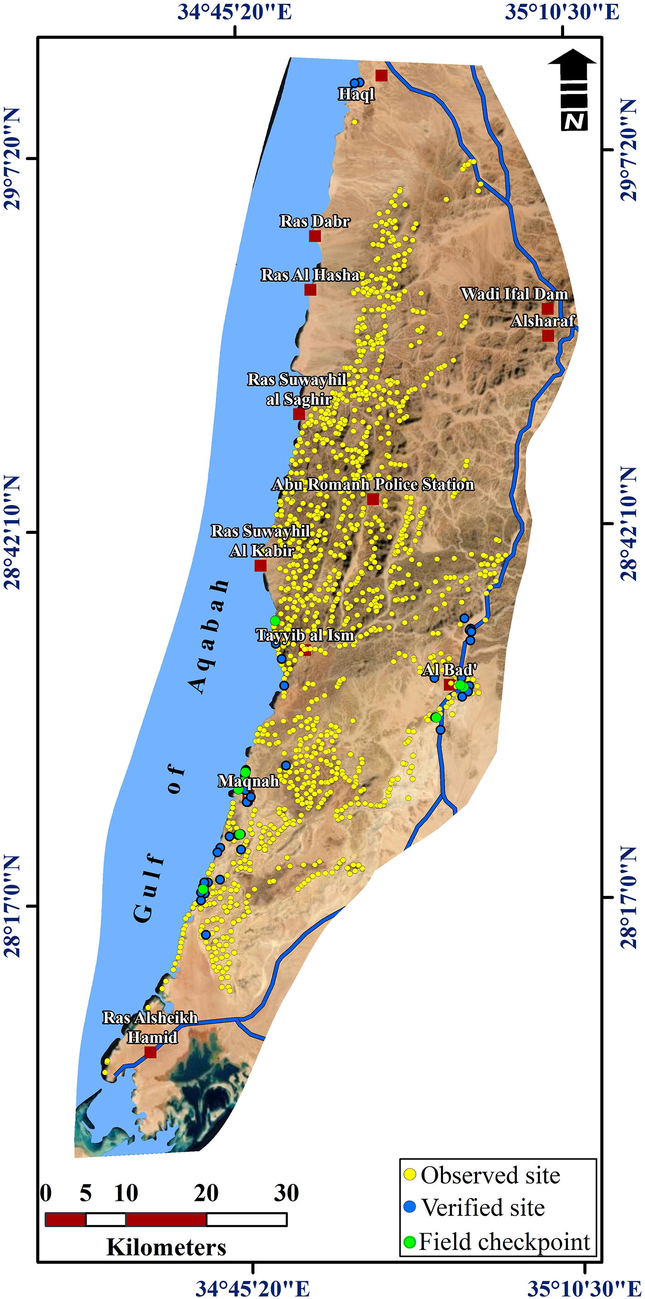
The detected old landslide sites within the studied area.
6 Landslide susceptibility mapping
For landslide susceptibility mapping, the geologic, topographic and seismologic factors were combined in accordance with their relative impacts to landslide occurrence (Fig. 9). Moreover, high-resolution Landsat imagery and field investigations were integrated to map the susceptibility to landslides in the Neom project area. There are three main steps were considered including; numerical rating of conditioning factors, data integration, and calculation of LPI. The topographic conditioning factors play a significant role for landslide susceptibility mapping of Neom projected area. The slope angle has assigned as the highest conditioning factor where the steeper slopes have the maximum weights on landslides and then slope classes were assigned weights in descending order. This factor followed by the elevation conditioning factor where the maximum weights were given to the highest elevations and then the elevation classes were assigned in decreasing order. Curvature has a prominent role in assessing landslides, and therefore weights of its classes were assigned.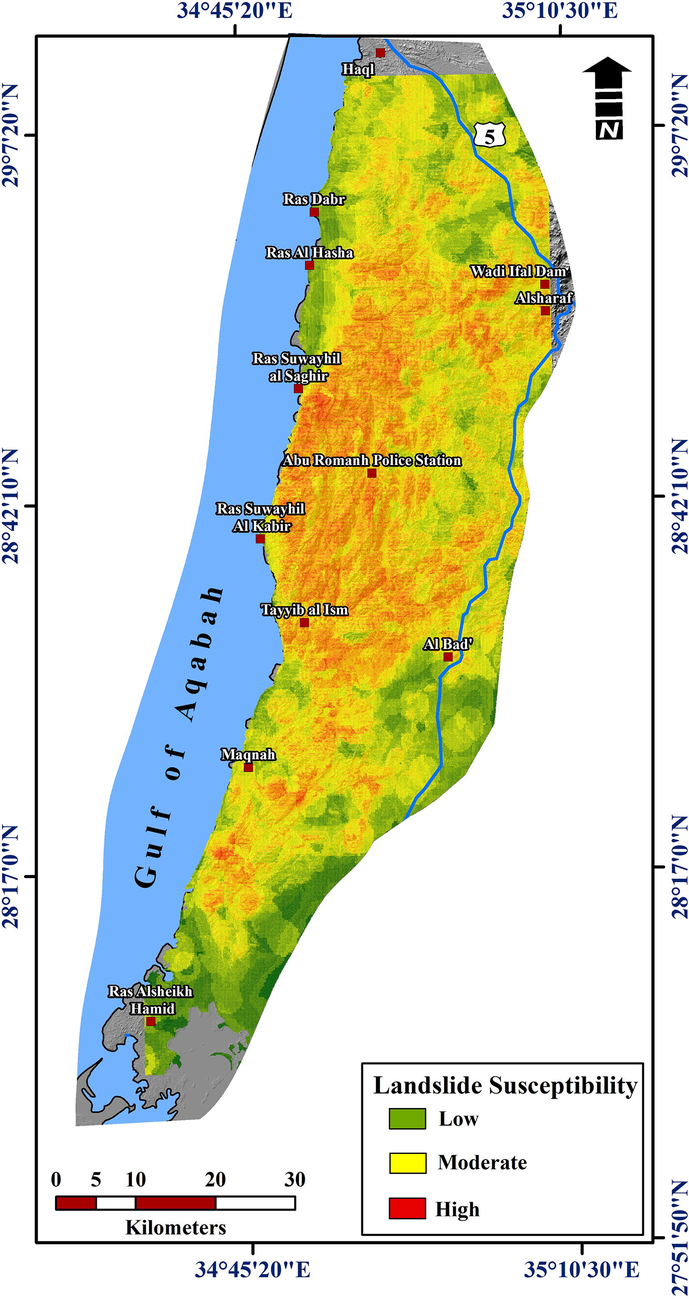
Landslide susceptibility map for the investigated area.
Slope aspect has an indirect influence on slope instability. Considering these facts and field observations, slope aspects classes were given weights accordingly. The earthquake density has a great importance for landslide mapping, the weights of earthquake classes was assigned decreasing order. The fault density was considered as the third factor in importance owing to the landslides occurrences and resulting damage have been observed at zones of fault density was less than that related to the locations of earthquake. The maximum weight was given to the high fault density zones, and the lowest weight was allocated to the low fault density areas. It is noticed that, the slope instability influenced, to great extent, by erosion action of major streams. The drainage density was considered through the rating system where some landslides were related to drainage channels. The importance of the lineament density factor more potential for landslides especially in the highly fractured and jointed zones. Hence, the higher lineament density zones, the maximum weight were given. In the rating scheme, these factors were assigned a numerical ranking from 1 to 8 according to the importance order. In addition, each factor was given different weights from 0 to 8 ordinal scale in which higher weight designates more effect for landslide occurrence. The ranks of contributing factors and weights of their classes are recorded (Table 1).
Thematic layer
Classes
Ranks
Weights
Earthquake density
0–1430
4
0
1440–2350
2
2360–3770
3
3780–5980
4
5990–9390
5
9400–14,700
6
14800–22900
7
23000–35500
8
Lineaments density
0.0–0.24
1
0
0.24–0.48
2
0.48–0.73
3
0.73–0.97
4
0.97–1.20
5
1.20–1.50
6
1.50–1.70
7
>1.70
8
Fault density
0.0–17.8
3
0
17.8–35.6
2
35.6–53.4
3
53.4–71.2
4
71.2–89.0
5
89.0–107
6
107–126
7
>126
8
Drainage density
0.0–8.29
2
0
8.29–24.3
2
24.3–39.1
3
39.1–53.9
4
54.9–68.7
5
68.7–85.3
6
85.5–107
7
> 107
8
Slope
0.0–6.5
8
0
6.5–13
2
13–20
3
20–26
4
26–33
5
33–39
6
39–45
7
> 45
8
Curvature
−56.6–(−11.8)
6
0
−11.7–(−6.8)
2
6.8–(−3.47)
3
−3.47–(−0.98)
4
0.98–1.10
5
1.10–4.42
6
4.42–9.4
7
>9.4
8
Slope aspect
Flat (−1)
5
0
NNE (0–22.5)
8
NE (22.5–76.5)
7
E (67.5–112.5)
2
SE (112.5–157.5)
4
S (157.5–202.5)
5
SW (202.5–247.5)
6
W (247.5–292.5)
3
NW (292.5–337.5)
7
NNW (337.5–360)
8
Elevation
0.0–135
7
0
135–292
2
292–457
3
457–638
4
638–815
5
815–1010
6
1010–1250
7
>1250
8
The generated numerical layers demonstrating weight values of the factor classes have been achieved using the GIS where weights were multiplied by their corresponding ranks. Finally, the results were added to get the LPI for cell dimensions of each 25- by 25-m as follows:
The arithmetic overlay approach constructed into ArcView Model Builder was accepted for this approach. The obtained LPI values (Fig. 9) ranged from 32 to 107, which allowed classification into three classes of landslide susceptibility as low, moderate and high with 26.03%, 45.37% and 28.60% of the study area, respectively. The resultant map for landslide susceptibility was verified through several field observations from January–December 2019 to check and analyze the types and sources of the landslides. Majority of the reported landslides in Neom study area are in the form of debris flows and rock falls, translational sliding.
7 Discussion and conclusions
It is indicated that the topographic variations, including slope angle, elevation, curvature, slope aspect and drainage density, having the greatest impact on landslide susceptibility mapping of Neom area. The slope values in Neom area range from 0° to 68.7°, in which the highest landslide frequency was > 45° and the lowest frequency ranges from 0° to 5.36°. In addition, the slope aspect played a direct or an indirect role for landslide occurrences. The aspect directly affects the amount of water absorbed by soil or evaporated because the slope areas facing the afternoon sun have a higher temperature and lower soil moisture, which created the conditions in which more erosion can probably occur. The landslide occurrences depend indirectly on aspect because of the primary relationship between slope aspect and geologic structures. Based on the field investigation, the landslide occurrences were recorded frequently in the N-, NE-, and NW-facing slopes, whereas the frequency of the landsides was recorded as the lowest value in the E/W- and SE-facing slopes.
Earthquake activities were considered as one the essential factor that triggering landslide hazards and thereby caused significant damage to settlements, infrastructure, and human life in the newly developed area for the Neom project. Based on a geologic map (Clark, 1986), the majority of fault trends matched well the earthquakes epicenters inducing a high density of earthquakes. According to earthquake data, great number of earthquakes having magnitudes >4.0 and are concentrated around the central zone of Gulf of Aqaba. This explains, to great extent, the landslide occurrences in the higher earthquake density zones causing severe damage to the infrastructure and human life along both flanks of Gulf of Aqaba (Dahab-Nuweiba–Taba coastal cities of the Sinai Peninsula, Magna-Tayeb Al-Ism- Haql shoreline urban areas of Saudi Arabia, and Aqaba city in Jordon). For example, On November 22, 1995, one of the strongest earthquakes over the past few centuries happened in the Gulf of Aqaba with M 7.3.
The structural analysis provides important parameters (e.g., faults and lineaments) to delineate landslides areas in association with earthquake activities. According to the Landsat images and field studies, the lineament plays a significance role for landslide occurrences in Neom area. In general, high fragmentation in the rock units facilitates water infiltration, causing a buildup of hydrostatic pressure. Moreover, the lithologic units play a considerable role for landslide activity mapping. For Neom projected area, the main lithologic units were classified simply into two lithologic groups including the Precambrian basement rocks and Phanerozoic succession as well. The Precambrian rocks constituted by variety of highly folded volcanic, volcaniclastic, and subordinate epiclastic rocks. The metavolcanic rocks of the area are mainly andesitic in composition (Clark, 1986), including the metamorphosed mafic and felsic tuffs, meta-andesite, metabasalt, amphibolites, hornfels, mica schist, and metamorphosed siltstone (Davies and Grainger, 1985). Whereas, Phanerozoic succession consists of sandstones and reef limestone with saline sand, and Quaternary deposits. All the exposed rocks are folded, faulted, and sheared to varying degrees, leading to different potentials for landslides.
The landslide susceptibility map indicates that the inland urban and strategic structures areas of the Neom area (Al Bad’, Al Sharaf and Wadi Ifal dam) lies within the high landslide susceptibility zone. In addition, most of high susceptible landslide zones are distributed at the coastal road along Gulf of Aqaba where the main urban sites and infrastructures are located (Midyan, Tayeb El-Ism, Haql area). The Precambrian rocks represent the most susceptible rocks contributing to landslides. While the low landslide susceptible zones cover the areas of low topographic relief and Phanerozoic sequences of Neom area as well.
It can be concluded that the outcomes of Neom project area provide the predictive model for earthquake-induced landslide susceptibility. The generated landslides hazard map clarifies most of urban and populated areas are located within high susceptible zones for landslides. These zones cover the central area including the coastal road (Magnah-Midyan-Tayeb El-Ism Haql) and Al Bed’ area. Therefore, these zones more hazardous and should be treated in terms of rugged topographic relief before being used in development and reconstruction operations, whether in the existing populated or planned areas for the future. Based on the great importance of Neom promising area, it is highly recommended that, the landslide hazards have to be quantified. The results of this study will greatly support decision-makers, urban planners through avoiding the highly susceptible landslide zones or minimizing the landslide hazards through conducting corrective geotechnical procedures in advance.
Acknowledgments
The authors extend their appreciation to the Deputyship for Research & Innovation, “Ministry of Education “in Saudi Arabia for funding this research work through the project number IFKSURG-1438-059.
Declaration of Competing Interest
The authors declare that they have no known competing financial interests or personal relationships that could have appeared to influence the work reported in this paper.
References
- Abraham, M., Satyam, N., Pradhan, B. Alamri, A., 2020a. Forecasting of landslides using rainfall severity and soil wetness: A probabilistic approach for Darjeeling Himalayas. Water, 2020, 12, 804; doi:10.3390/w12030804
- Geospatial susceptibility mapping of earthquake-induced landslides in Neweiba area, Gulf of Aqaba, Egypt. J. Mountain Sci.. 2016;13(7):1286-1303.
- [Google Scholar]
- Landslide susceptibility mapping for a landslide-prone area (Findikli, NE of Turkey) by likelihood-frequency ratio and weighted linear combination models. Environ. Geol.. 2008;54(6):1127-1143.
- [CrossRef] [Google Scholar]
- Landslide hazard evaluation and zonation mapping in mountainous terrain. Eng. Geol.. 1992;32:269-277.
- [CrossRef] [Google Scholar]
- GIS-based landslide susceptibility mapping for a problematic segment of the natural gas pipeline, Hendek (Turkey) Environ. Geol.. 2003;44:949-962.
- [Google Scholar]
- Clark, M., 1986. Explanatory notes to the geologic map of the Al Bad’quadrangle, sheet 28A, Kingdom of Saudi Arabia. Saudi Arabian Deputy Ministry for Mineral Resources Geoscience Map Series GM- 81A, C, scale 1:250,000, with text, 46 p.
- Landslide hazard mapping and its evaluation using GIS: an investigation of sampling schemes for a grid-cell based quantitative method. Photogramm. Eng. Remote Sens.. 2000;66(8):981-989.
- [Google Scholar]
- Assessment of landslide susceptibility on the natural terrain of Lantau Island, Hong Kong. Environ. Geol.. 2001;40:381-391.
- [Google Scholar]
- Remote sensing and GIS technologies as tools to support sustainable management of areas devastated by landslides. Environ. Dev. Sustain.. 2002;4:221-229.
- [Google Scholar]
- Temporal probability assessment and its use in landslide susceptibility mapping for eastern Bhutan. Water. 2020;12:267.
- [CrossRef] [Google Scholar]
- Rainfall induced landslide studies in Indian Himalayan region: a critical review. Appl. Sci.. 2020;10:2466.
- [CrossRef] [Google Scholar]
- Spatial Landslide Risk Assessment at Phuentsholing, Bhutan. Geosciences. 2020;10:131.
- [CrossRef] [Google Scholar]
- Micro-scale modeling of terrain susceptibility to landsliding from a DEM: a GIS approach. Geocarto Int.. 1995;10(4):15-30.
- [CrossRef] [Google Scholar]
- Landslide fatalities and the evaluation of landslide risk in Italy. Eng. Geol.. 2000;58:89-107.
- [Google Scholar]
- Honda, K., Phillipps, G., Yokoyama, G., 2002. Identifying the threat of debris flow to major arterial roads using Landsat ETM+ imagery and GIS modeling-an example from Catanduanes island, Republic of the Philippines. Proceedings of the 23rd Asian Conference on Remote Sensing, Nepal, Nov. 25–29. http://www.gisdevelopment.net/aars/acrs/2002
- Geological assessment of the Neom mega-project area, northwestern Saudi Arabia: an integrated approach. Arabian J. Geosci.. 2020;13:345.
- [CrossRef] [Google Scholar]
- GIS-based landslide susceptibility mapping for the 2005 Kashmir earthquake region. Geomorphology. 2008;101(4):631-642.
- [CrossRef] [Google Scholar]
- Co-seismic landslide inventory and susceptibility mapping in the 2008 Wenchuan earthquake disaster area, China. J. Mountain Sci.. 2013;10(3):339-354.
- [CrossRef] [Google Scholar]
- Determination and application of the weights for landslide susceptibility mapping using an artificial neural network. Eng. Geol.. 2004;71(3):289-302.
- [CrossRef] [Google Scholar]
- Participatory model assessment of earthquake-induced landslide hazard models. Nat. Hazards. 2011;56(3):749-766.
- [CrossRef] [Google Scholar]
- Evaluation of CAMEL comprehensive areal model of earthquake-induced landslides. Eng. Geol.. 2009;104(1):1-15.
- [CrossRef] [Google Scholar]
- Petley, D., 2008. The global occurrence of fatal landslides in 2007. 5th EGU General Assembly (Abstract), Vienna, Apr. 13–18, SRef-ID: 1607-7962/gra/EGU2008-A-10487.
- Regmi, A., Devkota, K., Yoshida, K., Pradhan, B., Pourghasemi, H., Kumamoto, T., Akgun, A., 2014. Application of frequency ratio, statistical index, and weights-of-evidence models and their comparison in landslide susceptibility mapping in Central Nepal Himalaya. Arab. J. Geosci., 7, 725–742.
- an approach for GIS-based statistical landslide susceptibility zonation with a case study in the Himalayas. Landslides. 2005;2:61-69.
- [Google Scholar]
- Landslide spatial modelling using unsupervised factor optimisation and regularised greedy forests. Comput. Geosci.. 2019;134(2020):104336
- [Google Scholar]
- IRS-1C-LISS-III and PAN data fusion: an approach to improve remote sensing-based mapping techniques. Int. J. Remote Sens.. 1999;20(10):1929-1934.
- [CrossRef] [Google Scholar]
- Landslide hazard zonation: a case study in Garhwal Himalaya, India. Mountain Res. Develop.. 1995;15(4):301-309.
- [CrossRef] [Google Scholar]
- Hypsometric (area-altitude) analysis of erosional topography. Geol. Soc. Am. Bull.. 1952;63(11):1117-1142.
- [Google Scholar]
- Landslide hazard and risk zonation-why is it still so difficult? Bull. Eng. Geol. Environ.. 2006;65:167-184.
- [Google Scholar]
- Wang, W., Nakamura, H., Kamai, T., Lee, M., 2000. A photogeologic study on the earthquake-induced slope failure in central Taiwan on September 21, 1999, Kobe. Proceeding 39th Conference of Japan Landslide Society. pp. 417–420.
- Comparison of different models for susceptibility mapping of earthquake triggered landslides related with the 2008 Wenchuan earthquake in China. Comput. Geosci.. 2012;46:317-329.
- [CrossRef] [Google Scholar]
- Detection of a landslide movement as geometric misregistration in image matching of SPOT HRV data of two different dates. Int. J. Remote Sens.. 2003;24:3523-3534.
- [Google Scholar]
- The characteristics of the landslides triggered by the Ms 8.0 earthquake from Anxian to Beichuan. J. Asian Earth Sci.. 2010;37(5):452-459.
- [CrossRef] [Google Scholar]
- Yalcin, A., 2005. An investigation on Ardesen (Rize) region on the basis of landslide susceptibility (Ph.D. thesis), Karadeniz Technical University, Trabzon. (in Turkish).
- Geomorphological hazard analysis along the Egyptian red sea coast between Safaga and Quseir. Nat. Hazards Earth Syst. Sci.. 2009;9:751-766.
- [Google Scholar]


