Translate this page into:
Microring resonator made by ion-exchange technique for detecting the CO2, H2O, and NaCl as cladding layer
⁎Corresponding author. irajsadeghamiri@tdt.edu.vn (Iraj S. Amiri)
-
Received: ,
Accepted: ,
This article was originally published by Elsevier and was migrated to Scientific Scholar after the change of Publisher.
Peer review under responsibility of King Saud University.
Abstract
A system of Microring Resonator (MRR) based the comb-like sensor devices has been simulated. We present a Silicon-On-Insulator (SOI) ring resonator based on refractive index sensor. The novelty of the architecture lies in the capability to sense the shifts of multiple peaks simultaneously with an MRR waveguide. The behavior of optical MRRs, especially when functioning as refractive index sensors, is studied. Resonant wavelength, i.e. the wavelength at which the transmission spectrum exhibits a dip (peak) depends on the geometrical characteristics of the circular waveguide and the effective refractive index of the propagating mode. The previous studies have shown that the depth and vertical symmetry of buried waveguides are noticeably affected by the field perturbation. One of cost effective and low loss methods can be the technology known as ion-exchange which uses the glass substrates and the AgNO3/NaNO3 salt-melt at different temperatures and duration can be deposited on the glass substrates. Afterward, an MRR was designed on the glass substrates, where the effect of the carbon dioxide (CO2), Dihydrogen oxide (H2O), and sodium chloride (NaCl) as the cladding on the ion-exchange waveguide studied. Within the compare of the resonance in drop port and throughput port, it can understand that they roughly have the same distance of wavelength in the resonance. H2O is one of the materials showing higher Qfactor and FSR while it was in drop port also in throughput CO2 was the highest in these parameters.
Keywords
Microring Resonator (MRR)
Sensor
Ion-exchange
1 Introduction
Generally, the refractive index (RI) sensitivity of an ion-exchange waveguide channel is primary determined by the cladding mode due to its sensitiveness to the surrounding medium (Chen, 1983; West, 2005). Therefore, to comprehensively investigate the response of the modal interferometers to the external medium, the stimulation of cladding modes as much as possible in the ion-exchange waveguide can be useful (Tou, 2014; Stegeman and Stolen, 1989). It is difficult to obtain sufficient lower order and higher order cladding modes simultaneously. Therefore, ion-exchanged optical microring resonator (MRR) waveguide can be considered as the sensing head (Brandenburg et al., 1992; Sharma et al., 2015). Sodium Chloride (NaCl), as Rock salt is uniformly transparent from 0.2 μm in the ultraviolet to 12 μm in the infrared (Pisareva et al., 2004; Coblentz, 1920). In the region of 15 μm the absorption increases rapidly. Rock salt in moderately thin pieces expected to transmit several percents of the light up to wavelengths as long as 26.0 μm. However, a plate 1 cm in thickness is completely opaque to radiation of wavelengths greater than 20 μm (Miles and Wallace, 2006). Rock salt has long been a favorite material for infrared spectroscopy (Chen et al., 2016). It polishes easily and, although hygroscopic, protected by evaporated plastic coatings. It shows excellent dispersion over its entire transmission range (Pfund, 1930). However, it is difficult to obtain natural rock salt crystals of sufficient size and purity for making optical components (Levy, 1983). Measurement of the refractive index of NaCl dates back to 1871 when Stefan (Stefan, 1871) determined the refractive indices. Since then, a large amount of data in the transparent region has been contributed by a number of investigators, among them are Martens (Martens, 1901), and Langley (Langley and Abbot, 1900). They used either the deviation method or interferometry in their experiments. It was not until 1929 that measurements carried out beyond the transparent region.
Measurements the refractive indices of carbon dioxide (CO2) are relatively old especially in the visible spectrum range (Sengers et al., 1971; Watson, 1954; Tempelmeyer and Mills, 1968). The fabry-pérot interferometry is a most efficient device to measure the refractive index of CO2 (Wilson et al., 2007; Georgieva et al., 2008). It has more accurate and reliable results when compared to other used methods such as extrapolation of dispersion formulae (Bideau-Mehu et al., 1973; Medenbach et al., 2001; Ramaswamy, 1936). Variety applications of optical properties of water have attracted many researchers, where the applications of computing radiation transport, development of optical remote sensing instruments, computing the optical properties of plant leaves, and optical properties of aqueous are performed (Hale and Querry, 1973; Djurišić and Stanić, 1999; Querry, 1972; Silva et al., 2012). The literature on the optical properties of water in the wavelength region of 0.2–200-μm is presented in Irvine and Pollack (1968). Currently, the optical interference filter is used to determination the complex refractive index of thin films (Turner-Valle, 1998; Gao et al., 2012). These devices are very sensitive and accurate because very minor changes in the refractive index cause significant changes in the filter spectral response. The deposition process of the thin films will affect and vary the refractive indices. Estimations of the refractive indices of single-layer materials with aid of simple analysis of the optical dispersion and optical transmittance can be performed easily (Denton et al., 1972; Paulick, 1986; Chambouleyron et al., 1997).
Material science and technology has been the key technology been and involved in various applications, especially, in nanotechnology, where the new technique and material have used for many types of research and applications. One of the techniques is the ion-exchange method that has been widely used for nano material improvement. Generally, the refractive index (RI) sensitivity of an ion-exchange waveguide channel can be detected by the cladding modes. A comprehensive study of the response of a modal interferometer to the external medium can be performed using cladding modes in the waveguide fabricated by the ion-exchange techniques. It is difficult to obtain sufficient lower order and higher order cladding modes simultaneously. Therefore, ion-exchange optical MRR waveguide can be the sensing head. The searching of new suitable devices is continued; we have found that the use of MRRs can offer this requirement. Apparently, MRR has shown the very interesting aspects of applications, where there are many forms of them can be available for the embedded devices within the large system, where finally, the large system can be redundant, while the transmission ability is increased. The aesthetic properties of ion-exchange glass were known to Egyptians of the 6th century, who used the process to color glazed earthenware (Righini, 1994), and the technique is also known to have been applied to the staining of window glass in the middle ages. The ion-exchange as an engineering process originally used to improve the surface mechanical properties of structural glass (Schulze, 1913; Kistler, 1962; Zijlstra and Burggraaf, 1968).
An excellent derivation of the diffusion equation for binary ion-exchange is provided in Albert and Lit (1990), using silver as the in-diffusing ion and sodium as the out-diffusing ion. An additional application of ion-exchange in the glass is the production of diffractive optical elements. Such structures are becoming increasingly important in the fields of optical interconnection and switching, and beam shaping and focusing. Due to the lateral diffusion that occurs during ion-exchange, continuously varying refractive index profiles can be obtained using a binary mask (Saarikoski et al., 1997). An optical sensor within the constructor of MRR by the ion-exchange technique presented for sensing applications. Three types of material CO2, Dihydrogen oxide (H2O) and NaCl were used for the characterization of the sensor in MRR with the ion-exchange Method. Sensors based on ion-exchange MRRs show a high grade of flexibility to operate in different wavelength windows. The MRRs featuring high-quality factors (Q factor) are particularly attractive for RI sensing (Teeka et al., 2011; Amiri et al., 2015a). In the RI sensing systems, the RI change is typically quantified by the transmission spectrum shift of the transducer as presented in various photonics applications including MRRs (Jin et al., 2011; Kim and Yu, 2016; Alavi et al., 2014a,b), waveguide Bragg gratings (Klimov et al., 2015; Zou et al., 2016), and Mach–Zehnder interferometer (Jiang et al., 2014; Chalyan et al., 2016). A High-Q MRRs result in very narrow resonance peaks thus comes with small detection limit, where the sensitivity of an MRR is immune to the light-matter interaction length (Jiang et al., 2013). The sensitivity measurement range is limited by the free spectral range (FSR) of the sensing MRR. Reducing the MRR radius causes an increase of the FSR. However, this could result in a lower Qfactor due to the higher radiation loss.
2 Principle and design
Fig. 1 shows the system of an add-drop MRR system.The optical transfer function at through port and drop port of the add-drop resonating filter for lossless coupling (
) can be expressed as (Alavi et al., 2014c; Amiri et al., 2014, 2015b),
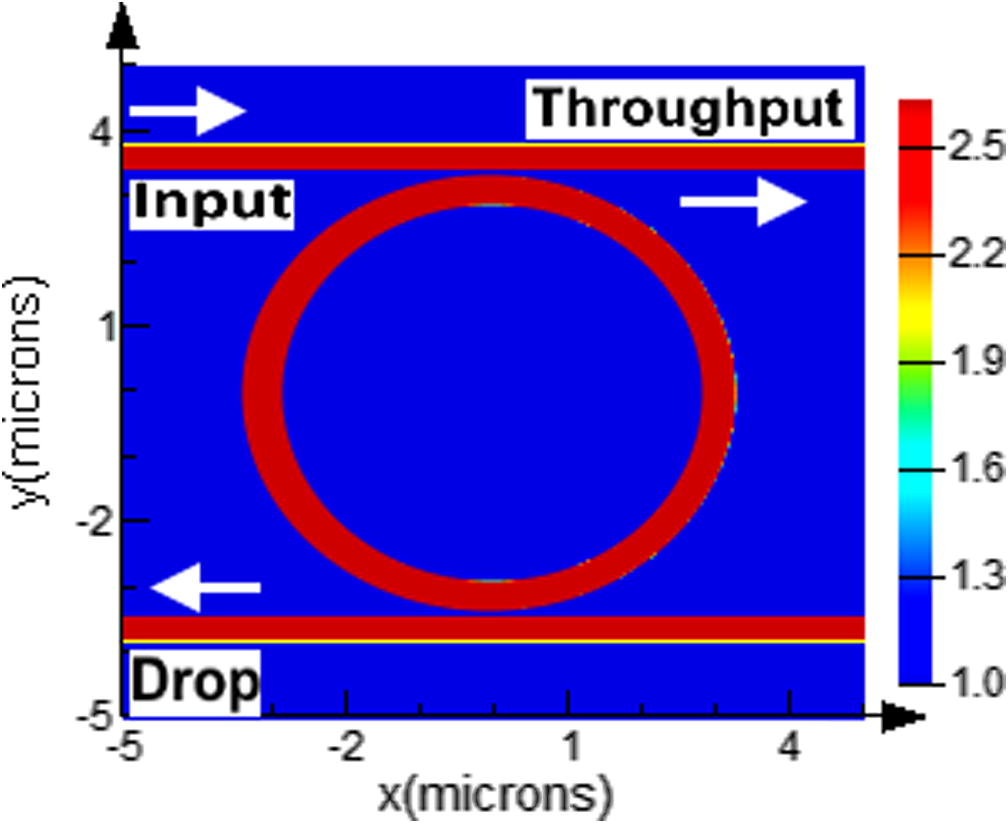
Schematic of MRR.
The iterative method was used in order to achieve resonating results for MRR. The optical path for the add-drop system was fixed to 25 μm. The simulation parameters of the MRR is presented in Table 1.
Parameters
Value (μm)
Channel width
0.4
Gap
0.1
Height
0.18
Total Length
25
Radius
3.1
As illustrated in Fig. 2, molten Ag+ salt is exchanged with Na+ ions in glass in a thermal environment ion-exchange process can be done in some steps, which is Aluminium masked glass substrate is submersed into the molten salt to perform the ion-exchange between the ions of Ag+ and Na+ (Fig. 2). The channel can be formed in the substrate by the diffusion of the ions so that the residue salt on the substrate can be removed in case of cleaning. At the end, by using wet etching process the Aluminium mask can be cleaned. The schematic of the MRR waveguide which is simulated by ion- exchange illustrated in Fig. 3. Within the consideration of different cladding layer, the waveguide can sense the changes in the refractive indexes of a different material which is CO2, H2O, and NaCl as a cladding material. A numerical method is used to simulate the ion-exchange waveguide. The Finite Difference Method (FDM) is used to simulate the ion-exchange process. The parameters of the glass substrate and Ions are used in the simulation and listed in Table 2. Using a glass substrate, and exposing the AgNO3/NaNO3 salt-melt in 313k for 30 min, the process can be completed.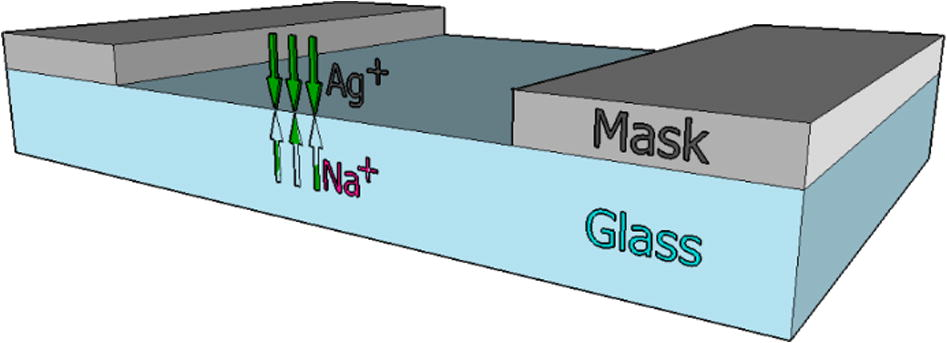
The configurations of ion-exchange.
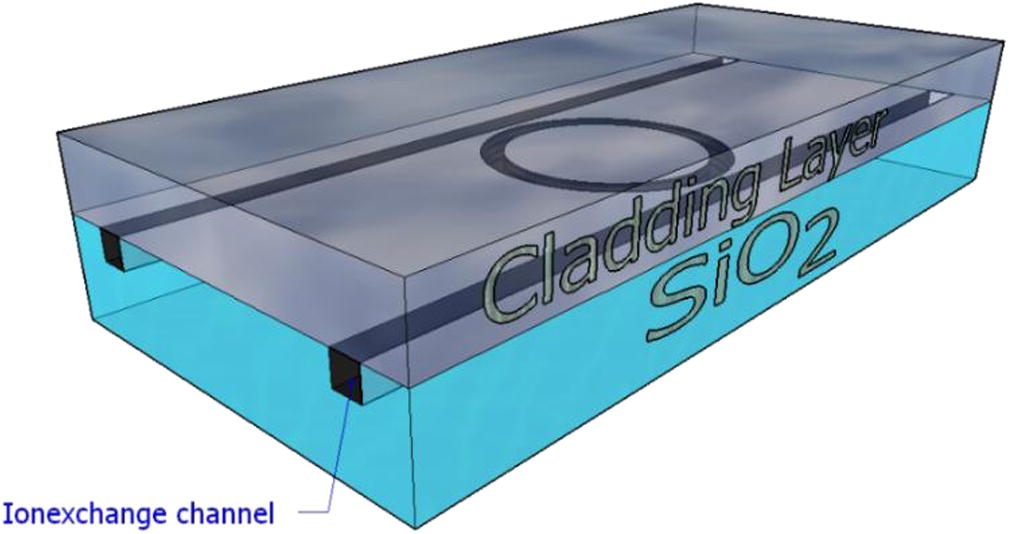
MRR structure that is simulated, the cladding layer can be varying between CO2, H2O and NaCl.
Glass properties
Na concentration (moles/m3)
500
Ag diffusion coefficient (m2/s)
2E−16
Ratio of diffusion coefficient of Ag/Na
0.186
Correlation factor
0.51
Substrate thickness (mm)
0.0005
Process parameters
Temperature (K)
313
Step duration (s)
1800
Ag surface concentration from melt
1
Calculations
Grid period (m)
1.333333E−07
Time interval (s)
5
Fig. 4 shows the junction depth for different ionic concentrations, where the Ag+ surface concentration varies from 0.2 until 0.8 moles/m3. The junction became shallower and shorter with respect to increase of Ag+ ionic concentration. If the Ag+ surface concentration is 0.8 moles/m3, the waveguide has a dimension of 0.18 μm deep and 0.4 μm wide. The channel depth of 0.18 μm was obtained and used in numerical method simulation.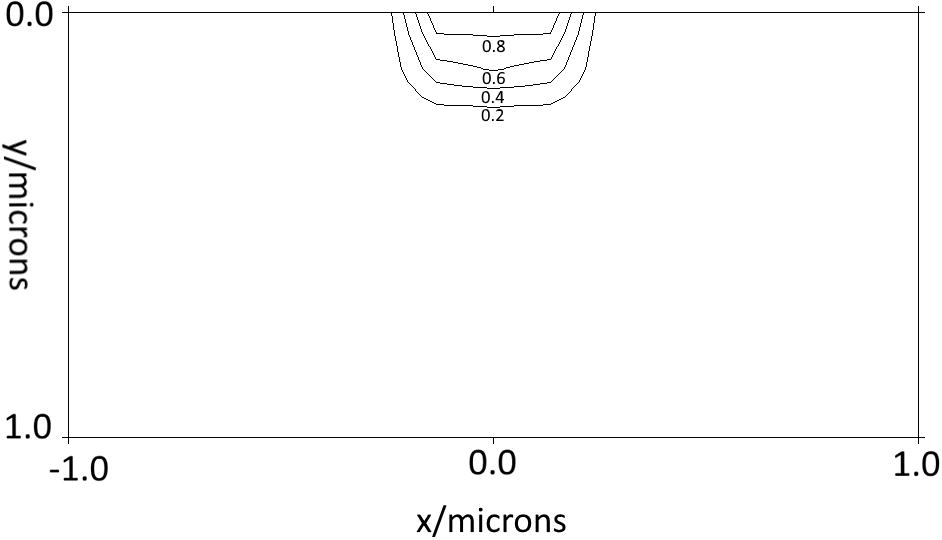
Calculation of silver ion concentration distribution using FDM.
The ion-exchange process was performed by using a SiO2 as substrate by melting down the AgNO3 and NaNO3 salt in 350 K temperature that caused different concentration from 0.2 till 0.8 moles/m which in this work we consider using of 0.8 models/m3 of the Ag to fulfill the 0.18 μm of the channel’s height. Different cladding on the ion-exchange waveguide can make a lot of differences in shifting the optical spectrum in the MRR. This can be a good sense to make this waveguide as a sensor for such a material, NaCl, CO2, and water have been chosen for this simulation to study the effect of them on the buried waveguide.
3 Results and discussion
The refractive indices that have been used in this simulation have been listed in Table 3. By the consideration of cladding material, it has been observed that the effect of loss power would be different, in drop port CO2 has less power in compare with other material though in throughput it has been shown that this material has the highest power. In NaCl has shown the different trend that in drop port it was higher than the other material though in throughput it had less power. The power for H2O was almost in the middle of other two materials. Fig. 5 illustrated the power in drop port and throughput port within different cladding materials. Within changing the material as upper cladding and interact with the light that is passing through the waveguide the cladding can cause the change of the parameters of the light spectrum within the construction of MRR as the optical waveguide. In the drop port optical spectrum has been illustrated in Fig. 6, by considering H2O as a reference the NaCl has a left shift within 8.68 nm also CO2 has red shift within 21.23 nm that can cause different resonance which can be useful in case of refractive index sensor. In the through port, optical spectrum has been illustrated in Fig. 7, by considering H2O as a reference as before in drop port, the NaCl has a left shift within 8.62 nm also CO2 has red shift within 21.17 nm that can cause different resonance which can be useful in case of refractive index sensor. Within the compare of the resonance in drop port and throughput port, it can understand that they roughly have the same distance of wavelength in the resonance. Throughput port transmission within center wavelength is 1.55 μm that used in this simulation. The higher Q-factor was the CO2, 0.6 × 10³ and the lower one was NaCl. The higher frequency in THz is generated was belong to the NaCl, also CO2 has higher Finesse though NaCl has less finesse as it shown in Table 4. Drop port transmission within center wavelength is 1.55 μm that used in this simulation. Within the understanding of good applications for higher Qfactor, in drop port H2O showing higher though NaCl has lower Qfactor and finesse. FSR also is a key in communication applications and in here again H2O has higher FSR although CO2 has the low value in this case. The high Q-factor in different cladding material simulated can be beneficial for channel drop filters, lasers, sensors, and other applications.
Material
n
K
References
NaCl (Sodium chloride)
1.5280
–
Li (1976)
Water (H2O) at 25 °C
1.3180
0.000098625
Hale and Querry (1973)
CO2 (Carbon dioxide)
1.0004382
–
Bideau-Mehu et al. (1973)
SiO2
1.4657
–
Gao et al. (2012)
Ion-exchange channel Refractive index
3.444
–
Ariannejad et al. (2014)
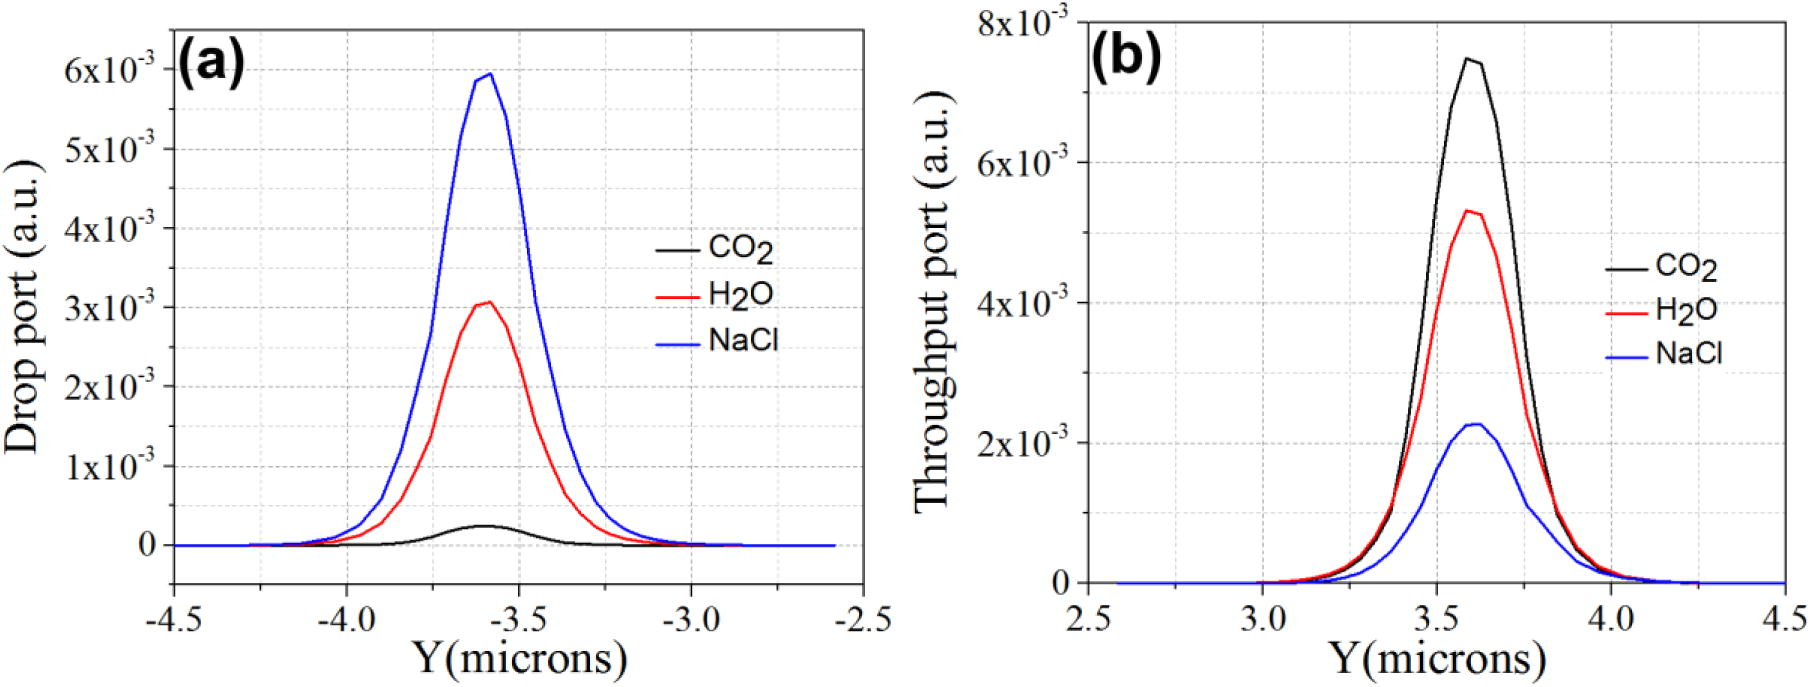
(a) Drop port power in CO2, H2O, and NaCl, (b) Throughput port power in CO2, H2O, and NaCl.
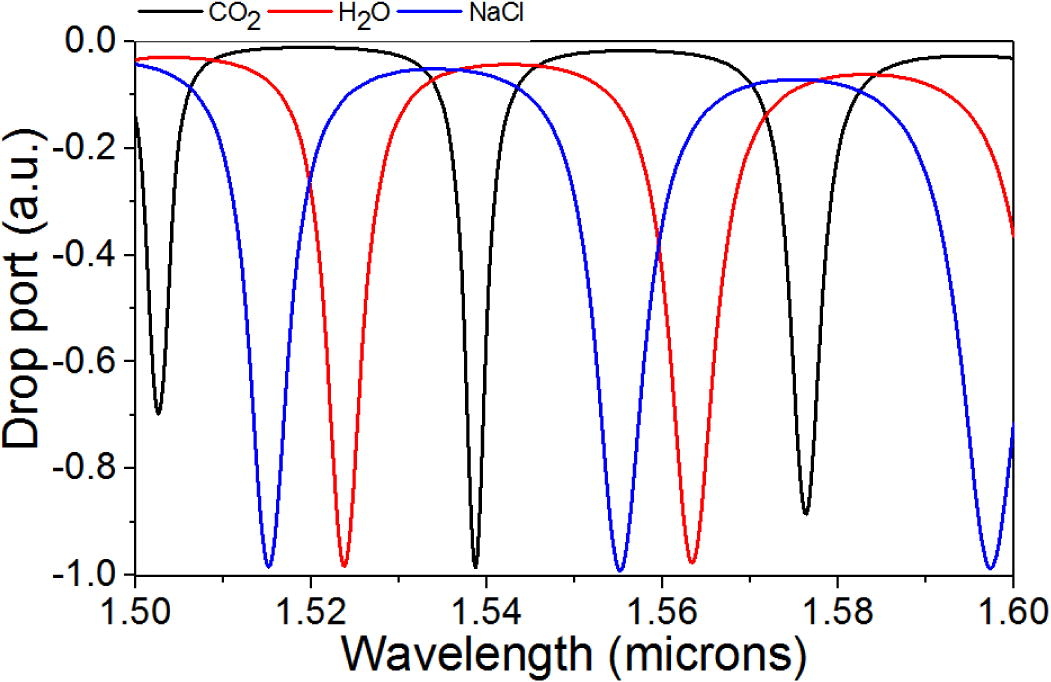
Drop port power transmission in 3 different materials.
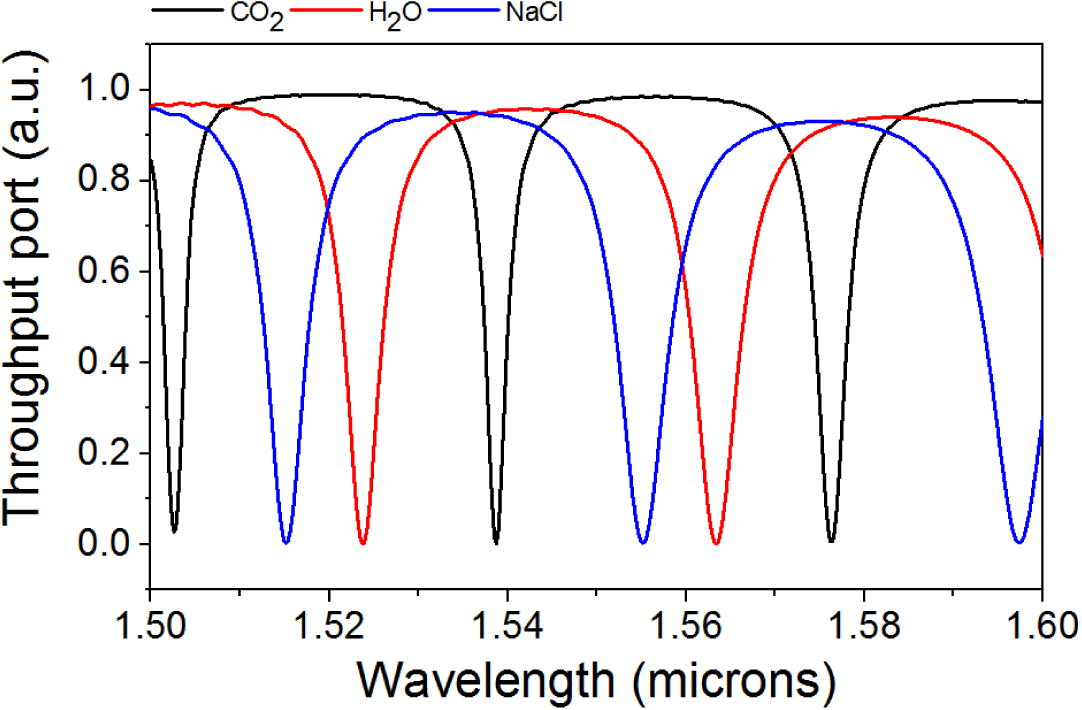
Throughput port transmission in 3 different materials as cladding.
Cladding material
FSR (nm)
FWHM (nm)
Qfactor
Finesse
Δf (THZ)
H2O
39
5.92
0.262 × 10³
6.58
4.87
CO2
38
2.57
0.6 × 10³
14.78
4.74
NaCl
40
6.26
0.25 × 10³
6.39
5
Tables 4 and 5 show the detail of the throughput and drop port transmission spectrum.
Cladding material
FSR (nm)
FWHM (nm)
Qfactor
Finesse
Δf (THZ)
H2O
39
1.43
1.08 × 10³
27.27
4.87
CO2
38
2.91
0.53 × 10³
13.05
4.74
NaCl
40
6.06
0.256 × 10³
6.6
5
4 Conclusion
MRR has been widely investigated and used in many applications, where there are many forms of MRR can be adapted and employed (Tanaram et al., 2011; Amiri et al., 2014, 2015e). MRR can be fabricated and formed the small-scale devices that can replace the large scale fiber optic system, while the channel capacity is increased, moreover, the capacity expansion can also available (Alavi et al., 2016, 2015). Using the Finite Difference Method (FDM), the ion-exchange process in an optical waveguide was simulated to design an MRR. In the simulation, different Ag+ ionic concentrations were deposited on glass substrates. Subsequently, an MRR waveguide based on glass substrates was designed, where the effect of different cladding material has been studied. Our subsequent work will be on the fabrication and characterization of the ion-exchange based MRR on glass substrates. In the cladding, CO2 and NaCl show the different powers due to the drop port and throughput power. Within the compare of the resonance in drop port and throughput port it can be understanding that they roughly have the same distance of wavelength in the resonance. The MRR waveguide can be tunable within different materials, compact THz emitters, on-chip integrated spectrometers, which inspire a broader use of THz sources and motivate many important potential THz applications in different fields. H2O is one of the materials showing higher Qfactor and FSR at the drop port resonance wavelengths, where at the throughput, CO2 is dominant. Within the compare of the resonance in drop port and throughput port, it can understand that they roughly have the same distance of wavelength in the resonance. H2O is one of the materials showing higher Qfactor and FSR while it was in drop port also in throughput CO2 was the highest in these parameters.
References
- All-optical OFDM generation for IEEE802. 11a based on soliton carriers using microring resonators. IEEE Photonics J.. 2014;6(1):1-9.
- [Google Scholar]
- W-band OFDM for radio-over-fiber direct-detection link enabled by frequency nonupling optical up-conversion. IEEE Photonics J.. 2014;6(6):1-7.
- [Google Scholar]
- Generation and transmission of 3× 3 w-band multi-input multi-output orthogonal frequency division multiplexing-radio-over-fiber signals using micro-ring resonators. Appl. Opt.. 2014;53(34):8049-8054.
- [Google Scholar]
- Generation and wired/wireless transmission of IEEE802. 16m signal using solitons generated by microring resonator. Opt. Quant. Electron.. 2015;47(5):975-984.
- [Google Scholar]
- Multiwavelength generation using an add-drop microring resonator integrated with an InGaAsP/InP sampled grating distributed feedback. Chinese Optics Letters. 2016;14(2):021301.
- [Google Scholar]
- Full modeling of field-assisted ion exchange for graded index buried channel optical waveguides. Appl. Opt.. 1990;29(18):2798-2804.
- [Google Scholar]
- Generating highly dark–bright solitons by Gaussian beam propagation in a PANDA ring resonator. J. Comput. Theor. Nanosci.. 2014;11(4):1092-1099.
- [Google Scholar]
- Optical quantum generation and transmission of 57–61 GHz frequency band using an optical fiber optics. J. Comput. Theor. Nanosci.. 2014;11(10):2130-2135.
- [Google Scholar]
- Review and theory of optical soliton generation used to improve the security and high capacity of MRR and NRR passive systems. J. Comput. Theor. Nanosci.. 2014;11(9):1875-1886.
- [Google Scholar]
- Transmission of data with orthogonal frequency division multiplexing technique for communication networks using GHz frequency band soliton carrier. IET Commun.. 2014;8(8):1364-1373.
- [Google Scholar]
- All-Optical Generation of Two IEEE802.11n Signals for 2 × 2 MIMO-RoF via MRR System. IEEE Photonics J.. 2014;6(6):1-11.
- [Google Scholar]
- GHz frequency band soliton generation using integrated ring resonator for WiMAX optical communication. Opt. Quant. Electron.. 2014;46(9):1165-1177.
- [Google Scholar]
- High-capacity soliton transmission for indoor and outdoor communications using integrated ring resonators. Int. J. Commun Syst. 2015;28(1):147-160.
- [Google Scholar]
- Multi wavelength mode-lock soliton generation using fiber laser loop coupled to an add-drop ring resonator. Opt. Quant. Electron.. 2015;47(8):2455-2464.
- [Google Scholar]
- Experimental measurement of fiber-wireless transmission via multimode-locked solitons from a ring laser EDF cavity. IEEE Photonics J.. 2015;7(2):1-9.
- [Google Scholar]
- Increment of access points in integrated system of wavelength division multiplexed passive optical network radio over fiber. Scientific reports. 2015;5:11897.
- [Google Scholar]
- Numerical computation of solitonic pulse generation for terabit/sec data transmission. Opt. Quant. Electron.. 2015;47(7):1765-1777.
- [Google Scholar]
- Ariannejad, M.M., et al. Design of optical Mach-Zehnder interferometer using ion exchange method for biosensing. in 2014 IEEE 5th International Conference on Photonics (ICP). 2014. IEEE.
- Graphical Approach for Nonlinear Optical Switching by PANDA Vernier Filter. Photonics Technology Letters, IEEE. 2013;25(15):1470-1473.
- [Google Scholar]
- Ultrafast all-optical switching using signal flow graph for PANDA resonator. Appl. Opt.. 2013;52(12):2866-2873.
- [Google Scholar]
- Detection of Salmonella bacterium in drinking water using microring resonator. Artificial cells, nanomedicine, and biotechnology. 2016;44(1):315-321.
- [Google Scholar]
- Interferometric determination of the refractive index of carbon dioxide in the ultraviolet region. Optics Communications. 1973;9(4):432-434.
- [Google Scholar]
- Brandenburg, A., V. Hinkov, and W. Konz, Integrated optic sensors. Sensors Set: A Comprehensive Survey, 1992: p. 399-420.
- Asymmetric Mach-Zehnder interferometer based biosensors for aflatoxin M1 detection. Biosensors. 2016;6(1):1.
- [Google Scholar]
- Retrieval of optical constants and thickness of thin films from transmission spectra. Appl. Opt.. 1997;36(31):8238-8247.
- [Google Scholar]
- Chen, R.-U. Waveguide Materials And Fabrication Techniques For Integrated Optics. in 1983 Los Angeles Technical Symposium. 1983. International Society for Optics and Photonics.
- UV Raman spectroscopy of hydrocarbon-bearing inclusions in rock salt from the Dongying sag, eastern China. Org. Geochem.. 2016;101:63-71.
- [Google Scholar]
- Transmission and Refraction Data on Standard Lens and Prism Material with Special Reference to Infra-Red Spectroradiometry. JOSA. 1920;4(6):432-447.
- [Google Scholar]
- The determination of the optical constants of thin films from measurements of reflectance and transmittance at normal incidence. J. Phys. D Appl. Phys.. 1972;5(4):852.
- [Google Scholar]
- Modeling the temperature dependence of the index of refraction of liquid water in the visible and the near-ultraviolet ranges by a genetic algorithm. Appl. Opt.. 1999;38(1):11-17.
- [Google Scholar]
- Exploitation of multiple incidences spectrometric measurements for thin film reverse engineering. Opt. Express. 2012;20(14):15734-15751.
- [Google Scholar]
- Differential radiometers using Fabry-Perot interferometric technique for remote sensing of greenhouse gases. IEEE Trans. Geosci. Remote Sens.. 2008;46(10):3115-3122.
- [Google Scholar]
- Optical constants of water in the 200-nm to 200-μm wavelength region. Appl. Opt.. 1973;12(3):555-563.
- [Google Scholar]
- Cascaded silicon-on-insulator double-ring sensors operating in high-sensitivity transverse-magnetic mode. Opt. Lett.. 2013;38(8):1349-1351.
- [Google Scholar]
- High-sensitivity optical biosensor based on cascaded Mach-Zehnder interferometer and ring resonator using Vernier effect. Opt. Lett.. 2014;39(22):6363-6366.
- [Google Scholar]
- Optical waveguide double-ring sensor using intensity interrogation with a low-cost broadband source. Opt. Lett.. 2011;36(7):1128-1130.
- [Google Scholar]
- Cascaded ring resonator-based temperature sensor with simultaneously enhanced sensitivity and range. Opt. Express. 2016;24(9):9501-9510.
- [Google Scholar]
- Stresses in glass produced by nonuniform exchange of monovalent ions. J. Am. Ceram. Soc.. 1962;45(2):59-68.
- [Google Scholar]
- On-chip silicon waveguide Bragg grating photonic temperature sensor. Opt. Lett.. 2015;40(17):3934-3936.
- [Google Scholar]
- Dispersion of salt, fluorite. Annals of the Astrophysical Observatory of the Smithsonian Institution. 1900;1:219-237.
- [Google Scholar]
- Radiation Damage Studies on Natural Rock Salt from Various Geological Localities of Interest to the Radioactive Waste Disposal Program. Nucl. Technol.. 1983;60(2):231-243.
- [Google Scholar]
- Refractive index of alkali halides and its wavelength and temperature derivatives. J. Phys. Chem. Ref. Data. 1976;5(2):329-528.
- [Google Scholar]
- Refractive index and optical dispersion of rare earth oxides using a small-prism technique. J. Opt. A: Pure Appl. Opt.. 2001;3(3):174.
- [Google Scholar]
- Synchrotron radiation circular dichroism spectroscopy of proteins and applications in structural and functional genomics. Chem. Soc. Rev.. 2006;35(1):39-51.
- [Google Scholar]
- Inversion of normal-incidence (R, T) measurements to obtain n+ ik for thin films. Appl. Opt.. 1986;25(4):562-564.
- [Google Scholar]
- Filters for the preconcentration of elements from solutions. J. Anal. Chem.. 2004;59(10):912-929.
- [Google Scholar]
- Querry, M.R., Reflectance of aqueous solutions. 1972.
- Refractive indices and dispersions of gases and vapours. Proceedings Mathematical Sciences. 1936;4(6):675-686.
- [Google Scholar]
- Ion exchange process for glass waveguide fabrication. Crit. Rev. Opt. Sci. Technol. 1994
- [Google Scholar]
- Fast numerical solution of nonlinear diffusion equation for the simulation of ion-exchanged micro-optics components in glass. Optics communications. 1997;134(1):362-370.
- [Google Scholar]
- Coexistence Curves of CO2, N2O, and CClF3 in the Critical Region. J. Chem. Phys.. 1971;54(12):5034-5050.
- [Google Scholar]
- Sensitivity of grating coupled graded thin film planar waveguide sensors. Opt. Quant. Electron.. 2015;47(2):169-177.
- [Google Scholar]
- Effect of surface ligands on the optical properties of aqueous soluble CdTe quantum dots. Nanoscale Res. Lett.. 2012;7(1):536.
- [Google Scholar]
- All optical ultra-wideband signal generation and transmission using mode-locked laser incorporated with add-drop microring resonator. Laser Phys. Lett.. 2015;12(6):065105.
- [Google Scholar]
- Stefan, J., The Influence of Heat on the Light Refractionoi Solids. Sitzungsber. Akad. Wiss. Wien, 1871. 2: p. 63,223-45.
- ASK-to-PSK generation based on nonlinear microring resonators coupled to one MZI arm. Procedia Engineering. 2011;8:432-435.
- [Google Scholar]
- Teeka, C., et al. ASK‐to‐PSK Generation based on Nonlinear Microring Resonators Coupled to One MZI Arm. in AIP Conference Proceedings. 2011. AIP.
- Refractive index of carbon dioxide cryodeposit. J. Appl. Phys.. 1968;39(6):2968-2969.
- [Google Scholar]
- Tou, Z.Q., Fiber optics chemical sensors based on responsive polymers. 2014.
- Turner-Valle, J., Nonlinear multilayers as optical limiters. 1998.
- The refractive indices of aqueous solutions of H2O18 and CO2. J. Am. Chem. Soc.. 1954;76(22):5884-5886.
- [Google Scholar]
- West, B.R., Modeling and analysis of ion-exchanged photonic devices. 2005.
- Development of a Fabry-Perot interferometer for ultra-precise measurements of column CO2. Meas. Sci. Technol.. 2007;18(5):1495.
- [Google Scholar]
- Fracture phenomena and strength properties of chemically and physically strengthened glass: I. General survey of strength and fracture behaviour of strengthened glass. J. Non-Cryst. Solids. 1968;1(1):49-68.
- [Google Scholar]
- Tunable spiral Bragg gratings in 60-nm-thick silicon-on-insulator strip waveguides. Opt. Express. 2016;24(12):12831-12839.
- [Google Scholar]


