Translate this page into:
Urinary tract anti-infectious potential of DFT-experimental composite analyzed ruthenium nitrosyl complex of N-dehydroacetic acid-thiosemicarbazide
⁎Corresponding author. rcmaurya1@gmail.com (Ram C. Maurya)
-
Received: ,
Accepted: ,
This article was originally published by Elsevier and was migrated to Scientific Scholar after the change of Publisher.
Peer review under responsibility of King Saud University.
Abstract
Abstract
Urinary tract infections (UTIs) are counted among serious health problems affecting large number of people each year. UTIs are the second most common infections. This paper reports the synthesis of a novel nitrosyl complex of Ru(II) that has been found effective against some selected gram negative bacteria, E. coli and Pseudomonas. It has been found that the activity was pronounced more against Pseudomonas than E. coli. Hence, the complex may be seen effective agent against UTI. On characterizing the complex by virtue of combined experimental-DFT scope, a suitable octahedral structure has been suggested. Molecular specification under B3LYP functional, LanL2DZ basis set for Ru atom and 6–31g(d,p) for all other atoms were employed. Electron density plots and geometrical optimization were the main theoretical insights. Elemental analysis, mass spectrometry, NMR, FT-IR, UV-vis, cyclic voltammetry and TGA were the characterization techniques made comparable to computed data. From overall study it may be culminated that both the experimental and theoretical outcomes have been found in good agreement with each other.
Keywords
DFT
Ru(II)
NO
UTI
1 Introduction
Nitrosyl complexes are special class of metallic compounds having multifarious applications (Maurya and Mir, 2014; Yonemura et al., 2006; Yonemura, 2009). Depiction of NO-release (Franco et al., 2014) and their stability are among most recent interesting insights being explored (Truzzi and Franco, 2014). In some cases centering reduction on the nitrosyl ligand (Truzzi and Franco, 2014) or increase in number of metallic centres is helpful in this context (Carneiro et al., 2014). The retrograde messenger role of NO (Santos et al., 2014), cell penetrating ability and cytotoxicity has fascinated the related workers (Tfouni et al., 2013). Some concerns regarding the NO release with anti HIV and anti cancer activities have also been investigated.
Synthetic chemistry of ruthenium nitrosyl complexes have gained (Il’in et al., 2014; Truzzi and Franco, 2014) much attention because of the admirable facts of metal reactivity. In some cases of nitrosyl-bridged diruthenium complexes protonation of metal-metal bonds by the addition reaction of proton has been brought to light (Mayer and Böttcher, 2014) and the enhanced metal basicity and spontaneous reaction with a proton (from HBF4) in diethyl ether to afford the corresponding oxidative addition has been recorded. Some crystalline forms of the nitrosyl ruthenium complex have been worked out (Correa et al., 2013) showing volume of guest solvents, the unit cell parameters and the resulting iso-structural arrangement with small difference in the intermolecular interactions, with caged guest solvents, that interact with the complex by hydrogen bonds.
Pyrone derivatives like dehydroacetic acid form a large number of anti-fungal and anti-microbial agents (Cindric et al., 2004; Jednacak et al., 2011; Somogyi and Sohar, 1995). Thiosemicarbazones are referred to behave as an important class of biologically active ligands (Pradhan and Ramana Rao, 1977) reflecting pharmacological, antitubercular and antiviral properties (Mohan et al., 1985; Ferrari et al., 2001).
Various functionals and basis sets applied on nitrosyl complexes (Kathrin et al., 2013) help to sum up the chemical nature of NO (Caramori et al., 2013; Wu et al., 2013). The calculations using density functional theory (DFT) Perdew, 1986 is even useful in optimizing models of the enzyme active sites with the BP86 functional (Becke, 1986; Lehnert et al., 2006). Calculation scheme is generally specified when applied to such type of complexes (Heinrich and et al., 2011; Carneiro and et al., 2011; Schmidt et al., 1993; Hay and Wadt, 1985; Francl et al., 1982; Becke, 1993; Zerner et al., 1980). Molecular orbitals and the simulated electronic spectrum may also be determined by the semi-emperical ZINDO/S method (Zerner et al., 1980) as is implemented in the hyper chem program (Hyperchem for Windows; Formiga et al., 2008). Generally self consistent field calculations are accomplished, in order to obtain RHF wave functions with reliable criterion for convergence, using the Ruthenium and Cl parameters from the literature (Stewart, 1989; Bordini et al., 2002). Electronic structure and SCRF approximation in bulk solvent effects also provide core information related to a molecular structure (Lapes et al., 2005; Cossi and Borane, 2001; Cossi et al., 2003).
In a continuous interest towards DFT aspects of ruthenium complexes and eminent seek of diversified properties in terms of both experimental as well as theoretical asset of nitrosyls complexes, systematic density functionalized studies of newly synthesized Ru(II) nitrosyl complex of N-dehydroacetic acid thiosemicarbazide has been aimed. The study includes the geometric optimization, frequency calculation and the possible electronic excitations via TD-DFT formalism. The overall theme also tries to define the photolability of the desired complex computationally. The bioactivity against microbes of UTI origin reflects the instant application of the compound as antibiotic substance.
2 Experimental
2.1 Materials and methods
Ruthenium trichloride trihydrate (RuCl3·3H2O), thiosemicarbazide and dehydroacetic acid (dhaH) were products of Sigma Aldrich chemical Co., USA. All other chemicals used were of analytical reagent grade.
Elemental Vario ELIII Carlo Erna 1108 analyzer facilitated by SAIF CDRI, Lucknow fetched the percentage of elemental composition of the synthesized compounds. Infrared spectra were obtained using potassium bromide pellets with a Bruker-αT FT-IR Spectrophotometer. A BASI Epsilon Electrochemical Analyzer was used for cyclic voltammetric experiments in a dimethyl sulfoxide (DMSO) solution containing tetrabutylammonium perchlorate (TBAP) as the supporting electrolyte. Decomposition temperatures of compounds were recorded by an electrically operating melting point apparatus (Kumar Industries, Mumbai) of heating capacity up to 360 °C. Electronic spectra were recorded using Varian UV/Visible Spectrophotometer. The 1H NMR spectrum was recorded in DMSO with Bruker 400 MHz NMR instrument using TMS as an internal reference at the Central Drug Research Institute, Lucknow. Thermal behaviour of the complex was recorded using thermo gravimetric technique at the heating rate of 10 °C/min up to 1000 °C on a thermal analysis system Perkin Elmer USA, Diamond TG/DTA at SAIF (Formerly RSIC) Indian Institute of Technology, Bombay under inert atmosphere.
Molecular structure of the complex (in ground state and zero spin) was optimized employing DFT method using B3LYP functional, LanL2DZ basis set for Ru atom and 6-31g(d,p) for all other atoms. Calculations were carried out using Gaussian 09 (Frisch et al., 2010; Holloway et al., 2014) software. The vibrational frequencies of the Schiff base ligand (H2L) and its complex were visualized using GaussView05 animation programme. Molecular orbital analysis, electron density plots and computational DFT based global reactive descriptors were the main theoretical insights involved.
2.2 Synthesis of Schiff base
20 mL ethanolic solution (10 mmol, 1.68 g) of dehydroacetic acid was added to the 20 mL ethanolic solution of thiosemicarbazide (10 mmol, 0.91 g) in a round bottom flask and was allowed to reflux under constant stirring for 5–6 h at 50–60 °C. A cream coloured precipitate was found after refluxing for the required time. The resulting precipitate was washed with ethanol and water, dried in vacuo over anhydrous CaCl2 and re-crystallized from ethanol. The compound was found soluble in ethanol, methanol, dichloromethane (DCM) and dimethylsulfoxide (DMSO).
Analysis: Molecular Formula: C9H11N3O3S, Molecular Weight: 241, Decomposition Temperature: 120 °C. Elemental Analysis (%); Found: C, 44.70; H, 4.73; N, 17.34; O, 19.69; S, 13.30; Calculated: C, 44.80; H, 4.60; N, 17.42; O, 19.89; S, 13.29.
2.3 Synthesis of [RuII(NO)(dha-tsc)(Cl)(H2O)]complex
The complex was prepared by dissolving RuCl3·3H2O (1 mmol, 0.207 g) in 20 mL of 1:1 v/v HCl:H2O mixture. The solution was bubbled with NO gas (30 min) generated by allowing 30% of HNO3 to react with copper turnings. The solution turned to red from brown colour. The ethanolic solution of Schiff base (1 mmol, 0.241 g) was added and the resulting solution was refluxed for 3 h in which a whitish brown suspension was formed, followed by cooling down to room temperature a solid mass was obtained (Scheme 1). The desired product was filtered and washed with methanol and dried under vacuum. The complex was tested for its solubility and was found soluble in DMSO, DCM, chloroform and water.
A simple presentation of overall reaction of the complex formation.
Analysis: Molecular Formula: C9H11ClN4O5RuS, Molecular Weight: 424, Decomposition temperature: 180 °C. Elemental Analysis (%); Found: C, 25.19; H, 2.57%; N, 13.17; S, 7.60 Calculated: C, 25.51; H, 2.62; N, 13.22; S, 7.57.
3 Results and discussion
3.1 Spectroscopic and spectrometric studies
For the general quest to formulate composition of any unknown compound spectroscopic and spectrometric techniques serve as the first and foremost tools. The two compounds under present investigation, Schiff base and its complex were comparatively screened using different instruments. Both quantitative and qualitative analysis was carried out first to arrive at the proposed composition. Mass spectrometry, FT-IR, NMR, UV-vis, TGA and cyclic voltammetry were also performed to establish certainty among the results.
FTIR spectrum of the synthesized ligand was carried out using KBr pellets (Fig. 1). The vibrational frequencies of various functional groups present within the ligand shows that both, thione/thiol and keto/enol tautomeric forms are evident. Hence behaves as dibasic chelating motif. The stretching vibrations at 3259 (ν, OH) and 782 cm−1 (ν, SH) indicate the same. However, it may be noted that the thione/thiol tautomeric shift is very difficult to establish because of the feeble frequency attained there and recurrence of (νNH) mode at 3179 cm−1 creates ambiguity. Functional group vibrations (cm−1) at 1682 may be referred to the existence of carbonyl group of dha moiety and 3381 for -NH2 of tsc part. 1176–1251 (νC—O) and 1618 (νC⚌N) are also detectable by taking a look on the respective spectrum. Hence, approves the consistency of composition with the target ligand as given in Fig. 2.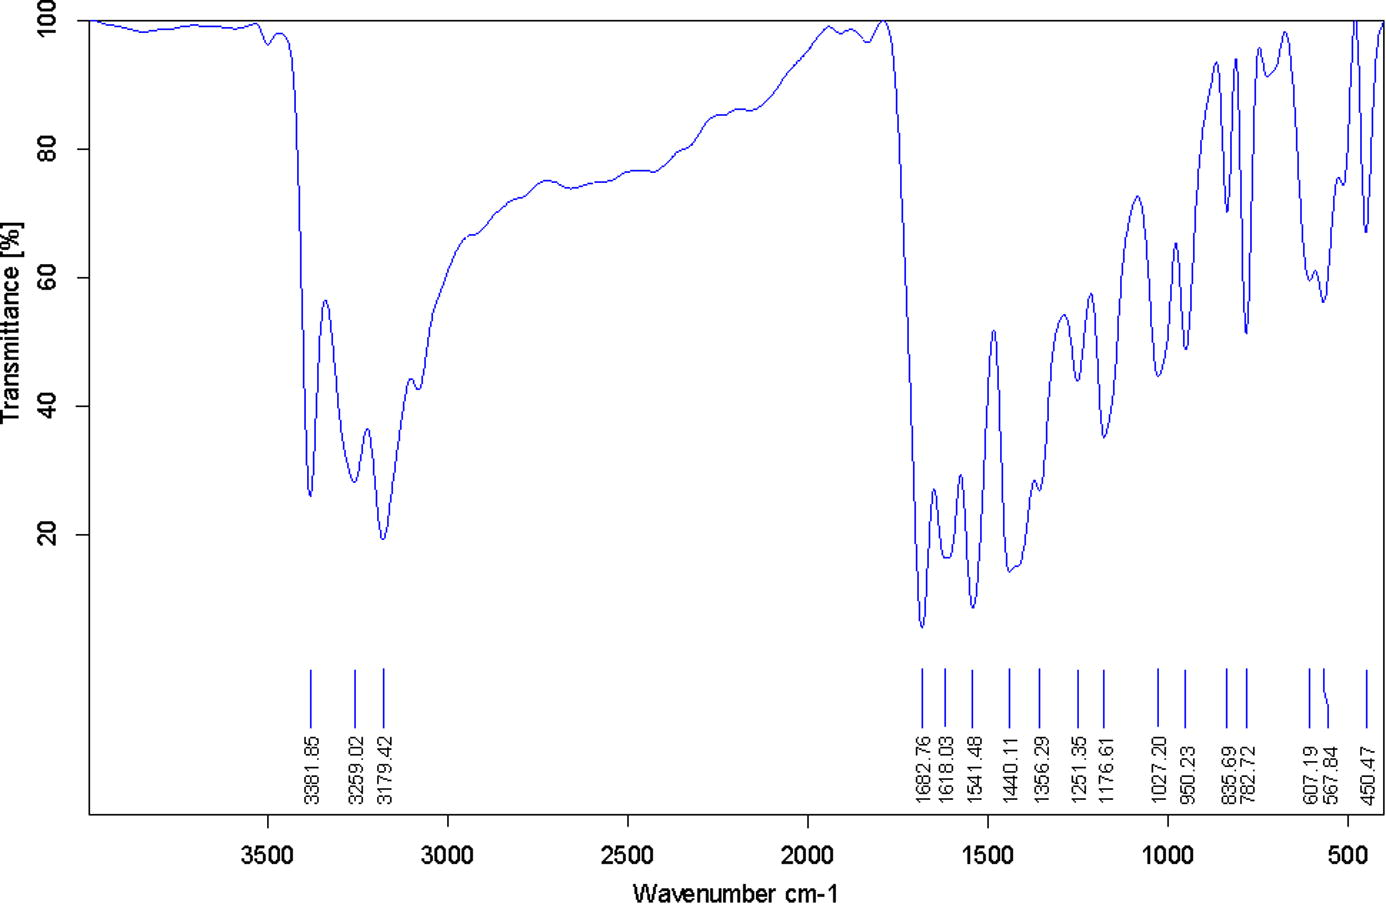
FT-IR spectrum of dha-tscH2.

Keto/enol and thione/thiol tautomerism in dha-tscH2.
From solid state FT-IR spectrum of the synthesized complex, [RuII(NO)(dha-tsc)(Cl)] shown in Fig. 3, the absence of —OH, —SH and —NH vibrational frequencies indicates deprotonation of the respective enolic and thiolic functionalities of the ligand. The appearance of remaining vibrational peaks at new wave numbers confirms the coordination of Ru(II) with the ligand. Since the complexation was carried out in solvent system, hence the behaviour of ligand functional groups would have been implicated by the nature of metal and solvation. The appearance of 3423 cm−1 and 1639 cm−1 affirms the uncoordinated —NH2 (coordinated water merged with this peak) and free —C⚌O (lactone), respectively. 1722 cm−1 may be attributed to the presence of NO+ in the complex. 1555 cm−1 may be indexed with azomethinic, C⚌N bond. The remaining assignments around 447 to 996 (cm−1) gives a clear indication of the coordination core of the complex.![Experimental FT-IR spectrum of [RuII(NO)(dha-tsc)(Cl)(H2O)]] complex.](/content/185/2019/31/1/img/10.1016_j.jksus.2017.06.006-fig5.png)
Experimental FT-IR spectrum of [RuII(NO)(dha-tsc)(Cl)(H2O)]] complex.
Fig. 4 displays the DFT based IR spectrum of the title complex. The animation programme of GaussView05 was used to enlighten the functional group assignments. The graphic view shows a remarkable resemblance with the experimental infra red data. The main vibrational peaks (cm−1) including 3602 (—NH2), 3661 (H2O), 1715 (—C⚌O), 1957 (—NO), 3000–3200 (—CH), etc confirms the coordination modes of model complex. The difference in the values of experimental and theoretical wave numbers might be due to the effect of state of system (gaseous state in calculation) and experimental conditions.![Theoretical FT-IR spectrum of [RuII(NO)(dha-tsc)(Cl) (H2O)] complex.](/content/185/2019/31/1/img/10.1016_j.jksus.2017.06.006-fig6.png)
Theoretical FT-IR spectrum of [RuII(NO)(dha-tsc)(Cl) (H2O)] complex.
Electronic spectroscopy is another means by which binding pattern of a compound can be traced. UV-vis spectrum of the complex is given in Fig. 5. From the spectrum coordinated heteroaromatic system is clear and the slight increase in absorption near visible range assigns the tendency of metallic central excitation toward antibonding orbital of NO ligand and may be attributed to photolability of NO ligand. Such a propensity towards red shift is significant. The significant band viz 200–370 nm may be attributed to intraligand transitions. While the prominent band near 390 nm gestures the Ru(II) to NO excitation probability. Since the target compound is non-salen nitrosyl complex, the discussion seems fruitful in depopulating HOMO and populating LUMO to bring forth a bonding M-NO character and an antibonding M-NO character, respectively, generating the release of NO. Time dependant density functional theory based electronic spectral data of the model complex is shown in Table 1. The numerical assignment of orbitals 91 is meant for HOMO and 92 for LUMO. The indication of photoinduced release of NO from the complex may be explained on the given data. λmax values range from 574–847 nm and the existence of non-zero oscillatory strengths (see Fig. 6).![Experimental UV-vis spectrum of [RuII(NO)(dha-tsc)(Cl) (H2O)] complex.](/content/185/2019/31/1/img/10.1016_j.jksus.2017.06.006-fig7.png)
Experimental UV-vis spectrum of [RuII(NO)(dha-tsc)(Cl) (H2O)] complex.
Orbital Assignment
Excitation coefficient
Excitation contribution
Energy of Excitation
λ
f (Oscillatory strength)
91–92
0.60219
72.53
1.4637 eV
847 nm
0.0011
91–93
0.36370
26.45
1.4637 eV
847 nm
0.0011
89–93
−0.10341
0.02
1.587 eV
781 nm
0.0058
91–92
−0.35633
25.39
1.587 eV
781 nm
0.0058
91–93
0.59465
70.72
1.587 eV
781 nm
0.0058
89–92
0.65082
84.71
2.1566 eV
574 nm
0.0012
90–92
−0.19907
7.92
2.1566 eV
574 nm
0.0012
![TD-DFT UV-vis spectrum of [RuII(NO)(dha-tsc)(Cl) (H2O)] complex.](/content/185/2019/31/1/img/10.1016_j.jksus.2017.06.006-fig8.png)
TD-DFT UV-vis spectrum of [RuII(NO)(dha-tsc)(Cl) (H2O)] complex.
On one hand UV-vis studies have supported the prevalence of feasible light induction electron exciting sensitivity of complex. On the other side, the redox potential in terms of Cyclic voltammetry (Fig. 7a) shows the ease of flexibility of oxidation state and hence an irreversible redox (100 scan rate) with Epc 0.93 V and Ipc 393 µA, that can be used to establish RuII/III component. Similarly, Epa, −3.74 V, Ipa, −806 µA was found along anodic side. The oxidation state changing capability of the complex renders the ease of NO+/NO0 feebly detectable near Epa 0.5 V. Increasing the scan rate in these cases enhances the peak potentials difference. Constancy of Er shows that in all the cases both peaks are complementary to each other. The peak current ratio Ipa/Ipc is less than unity showing that the electron transfer reaction is followed by a chemical reaction (EC mechanism).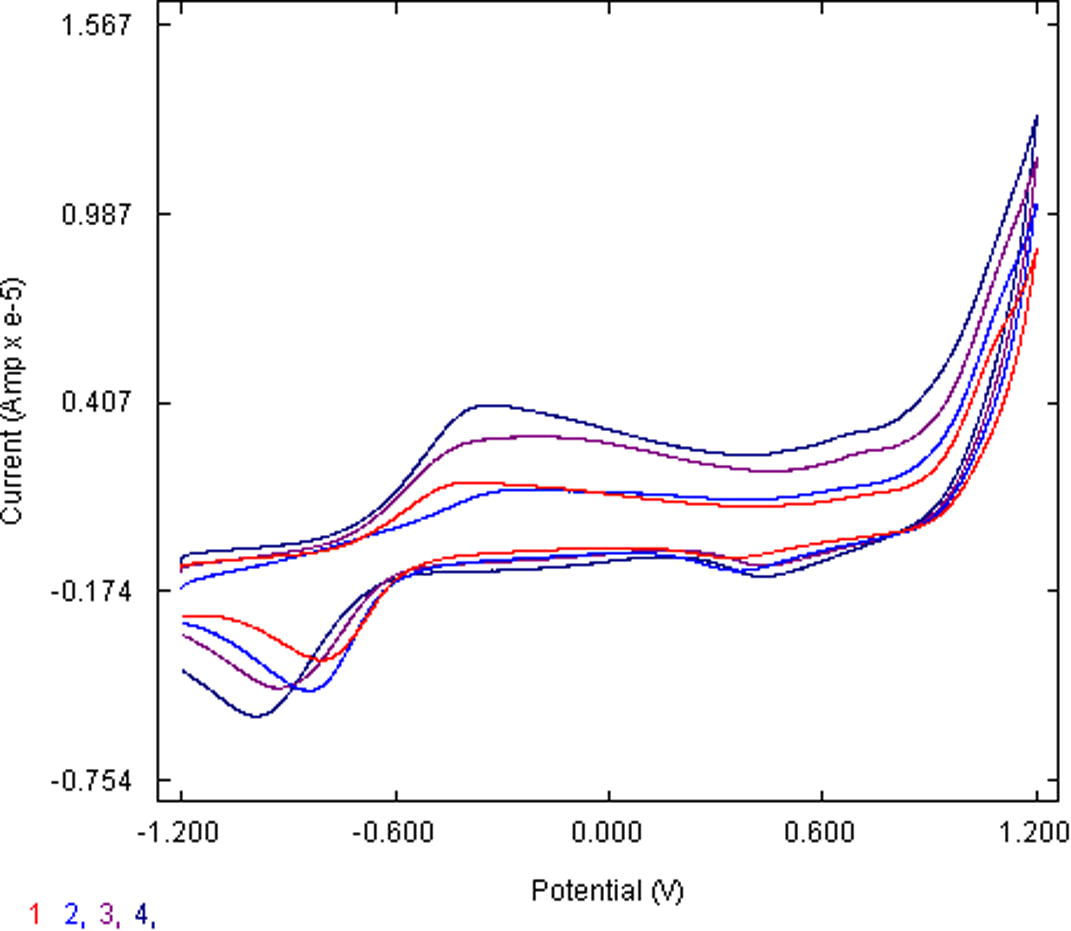
Cyclic voltammogram of the complex at 100, 200, 300 and 400 scan rates.
Such electronic shifting studies may also be linked with frontier orbital analyses that have major impact in formulating chemical descriptors (Shoba et al., 2012). One can determine the way the molecule interacts with other species. Hence, they are called the Frontier orbitals. The HOMO is the orbital that primarily acts as an electron donor and the LUMO is the orbital that largely acts as the electron acceptor, and the gap between HOMO and LUMO characterizes the molecular chemical stability (Fukui, 1982; Brabec et al., 2001; Ebenso et al., 2010). Four important molecular orbitals (MOs), namely, second highest [HOMO-1], and highest occupied MOs [HOMO], the lowest [LUMO] and second lowest unoccupied MOs [LUMO + 1] have been worked out for the ruthenium nitrosyl complex as shown in Fig. 7b. The band gap (ΔE) between HOMO to LUMO and [HOMO−1 to LUMO + 1, is 2.28 and 3.13 eV, respectively. Diamagnetic behaviour of the complex is verified by the electronic fillings of MO’s following auf bau principle.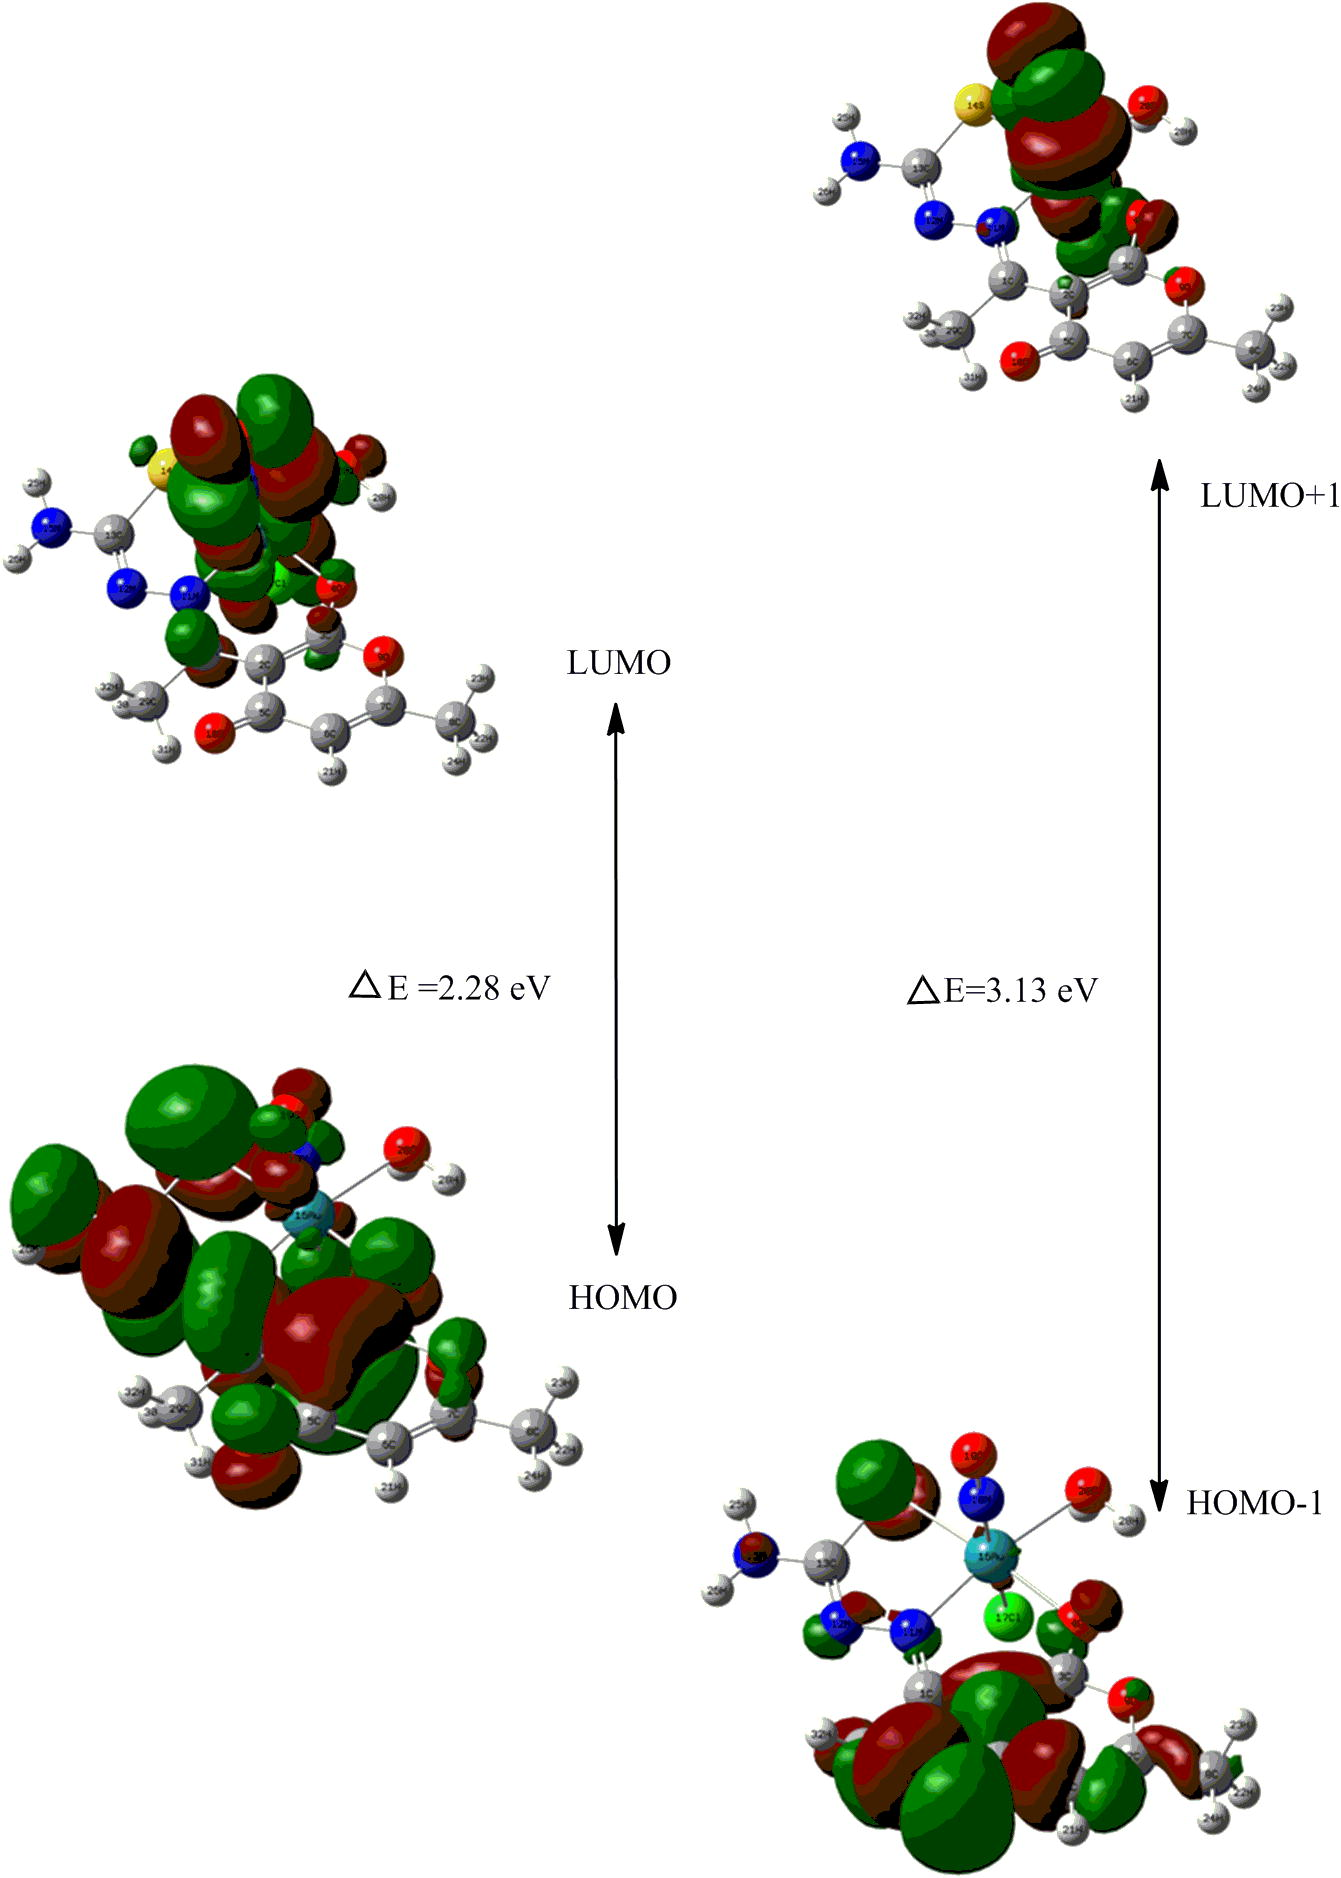
Schematic presentation of frontier orbitals of the complex.
1H NMR spectroscopy was also included to ascertain proposed formula of the complex. There are eleven hydrogens present within the molecular skeleton. The spectrum (Fig. 8) of the complex fits well with the composition described above. The 1H NMR spectrum was recorded in DMSO-d6. Absence of expected proton signals due to enolic and thiolic again stems the fact of enolic oxygen and thiolic sulphur coordination with metal after proton loss. FT-IR data as discussed above also explains the same assumption. A single heteroaromatic proton of DHA moiety is clear from the presence of a resonating signal at 6.54 ppm. Chemical Shift value of NH2 protons may be indexed near 3.3 ppm. The resonating signals of CH3C⚌N— and ring CH3 are well pronounced at 2.1 and 2.4 ppm, respectively, clarifying the difference in their deshielding environment. The peak at 4.2 ppm is indicative of coordinated water molecule. 2.5 ppm pentet signal may be attributed to the solvent (DMSO) used.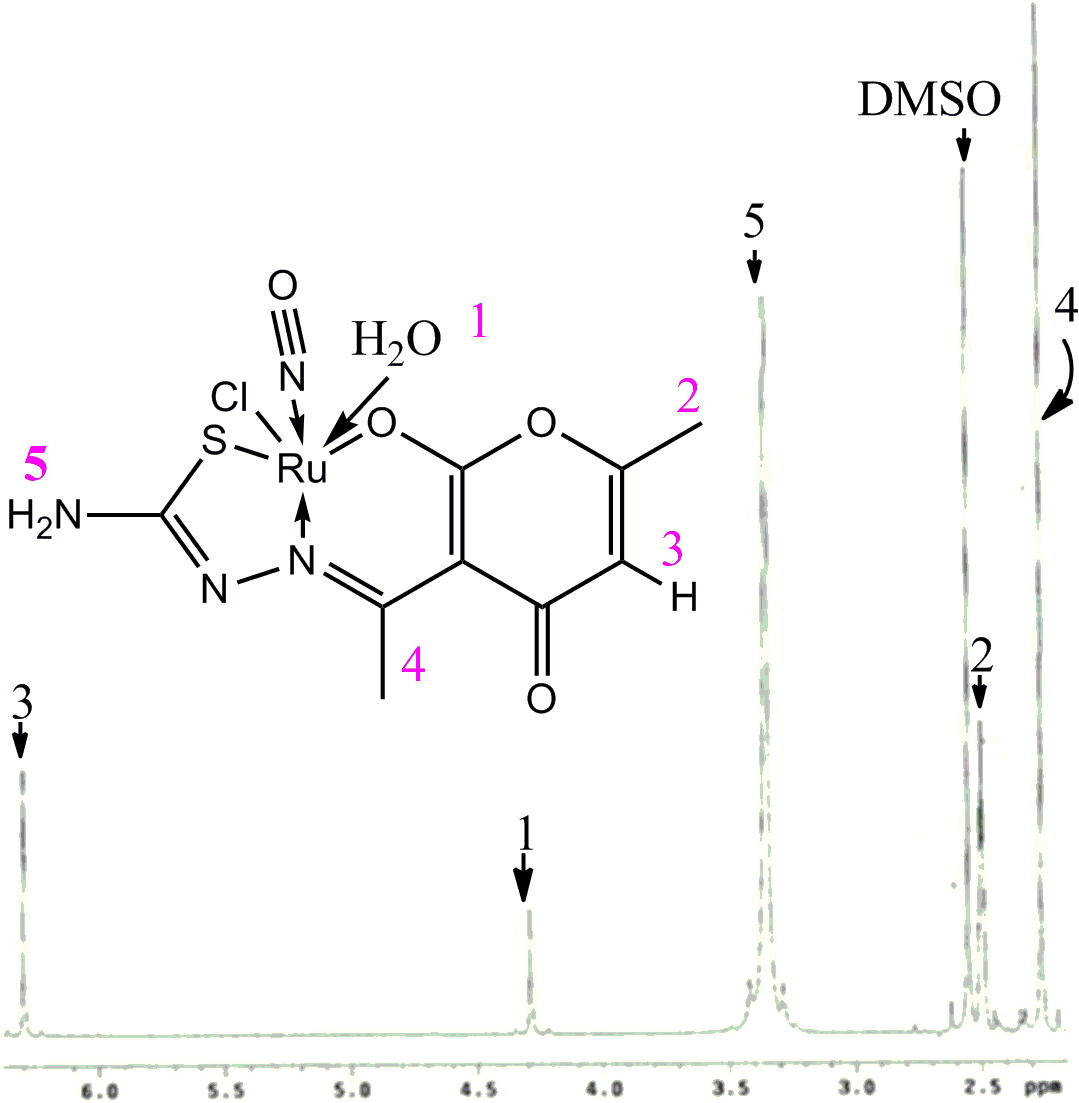
1H NMR spectrum of the complex.
ESI-Mass spectrometry of in association with other instrumental techniques provides ample proof of molecular composition. The spectrum was recorded on a THERMO Finnigan LCQ advantage max ion trap mass spectrometer at SAIF, CDRI Lucknow between a mass range of 100–700, (Fig. 9). The different mass fragments of the target complex show well distinguished m/z peaks of ruthenium isotopes ranging from 422–430, which indicates the formula weight of the compound. The difference in heights of the respective peaks is as a result of isotopic abundance of the metal. Further m/z peak near 240 denotes the mass of Schiff base ligand. It may be noted that all m/z peaks having less than 10% abundance were ignored.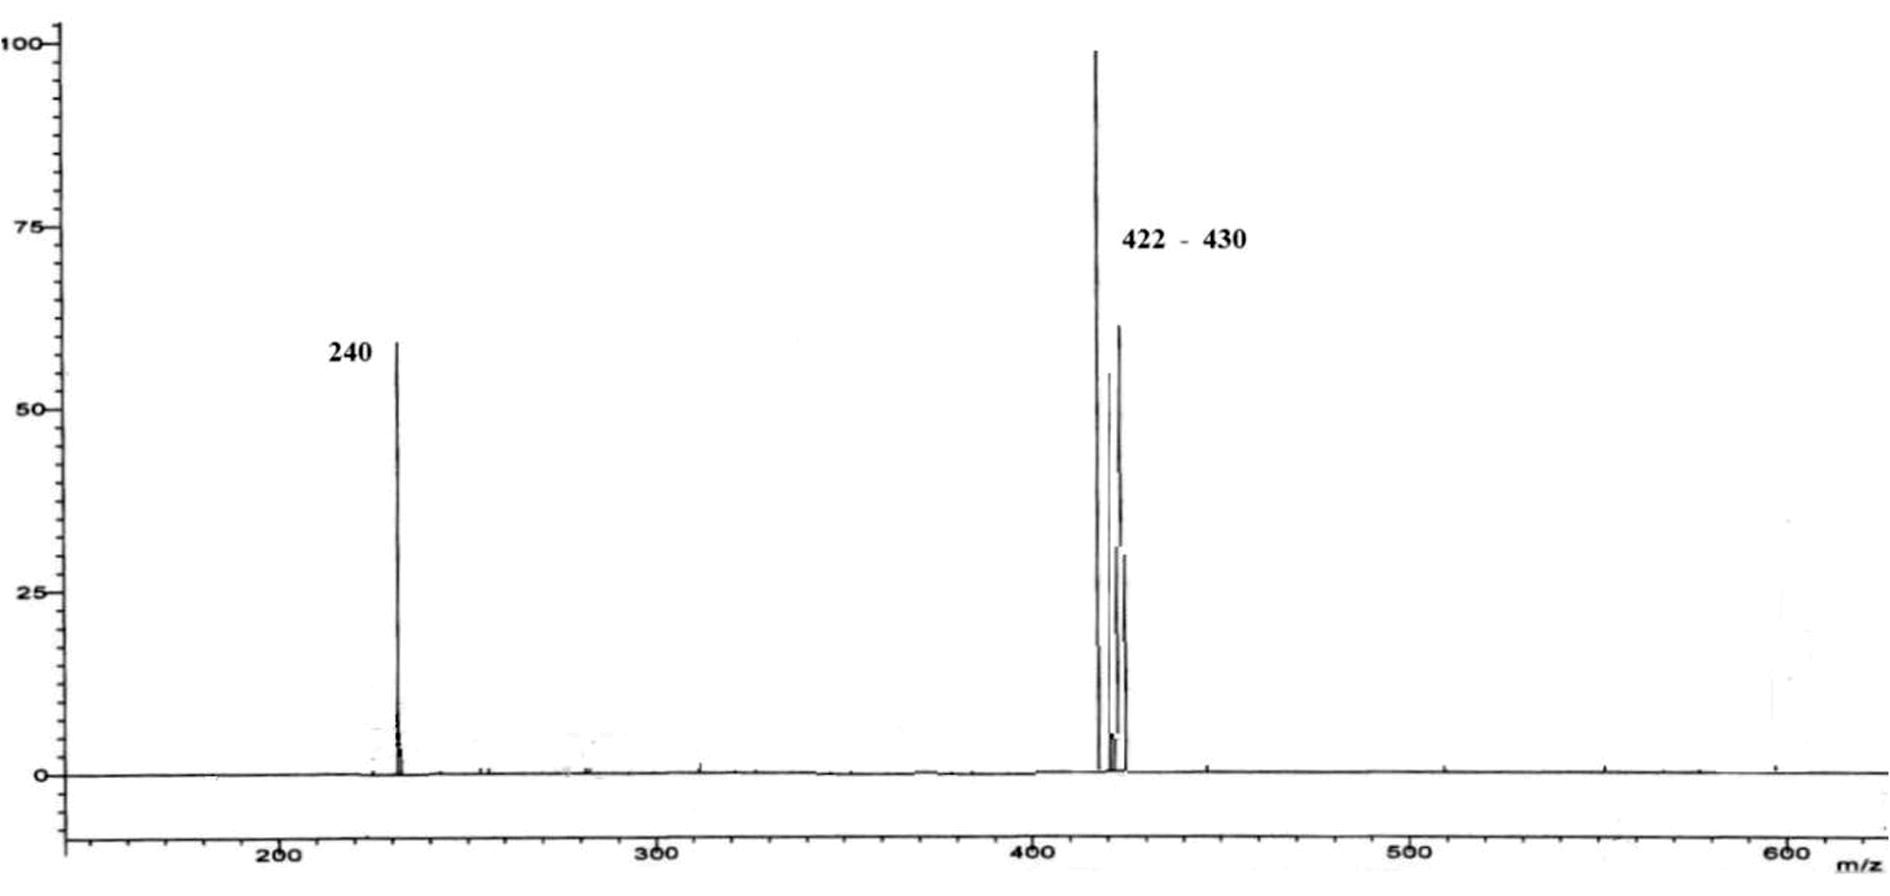
ESI-MS of the complex.
Thermogravimetric analysis is another means through which core information regarding a complex is obtained and hence, thermal stability of a compound can be brought to light. A stage of decomposition can furnish the number and stage of decomposition of water/hydroxyl or solvent molecules linked inside or outside the coordination zone. TG curve of the complex has been given in Fig. 10. The graphic view under 10 °C mean difference between successive temperature ranges was felt less ambiguous as compared to 5 °C gap. In most of the stages 1% decrease was unable to be co-related. However, in the respective cure the mass loss of 4.10% (4.25% calctd.) at 170–220 °C can be assigned to the loss of coordinated water molecule. In the second stage, at 230–270 °C, combined disintegration of NO and Cl with 14.71% loss (calctd. 15.33%) is quite evident. The third and fourth stages of decomposition may be enunciated with weight loss of ligand under two steps, showing a total 59.77% (61.10% calctd.) under the temperature range of 300–350 °C. The final residue obtained around 500 °C of 30.32% (calctd 31.37%) can be labeled as RuO2 with mass gain of 7%.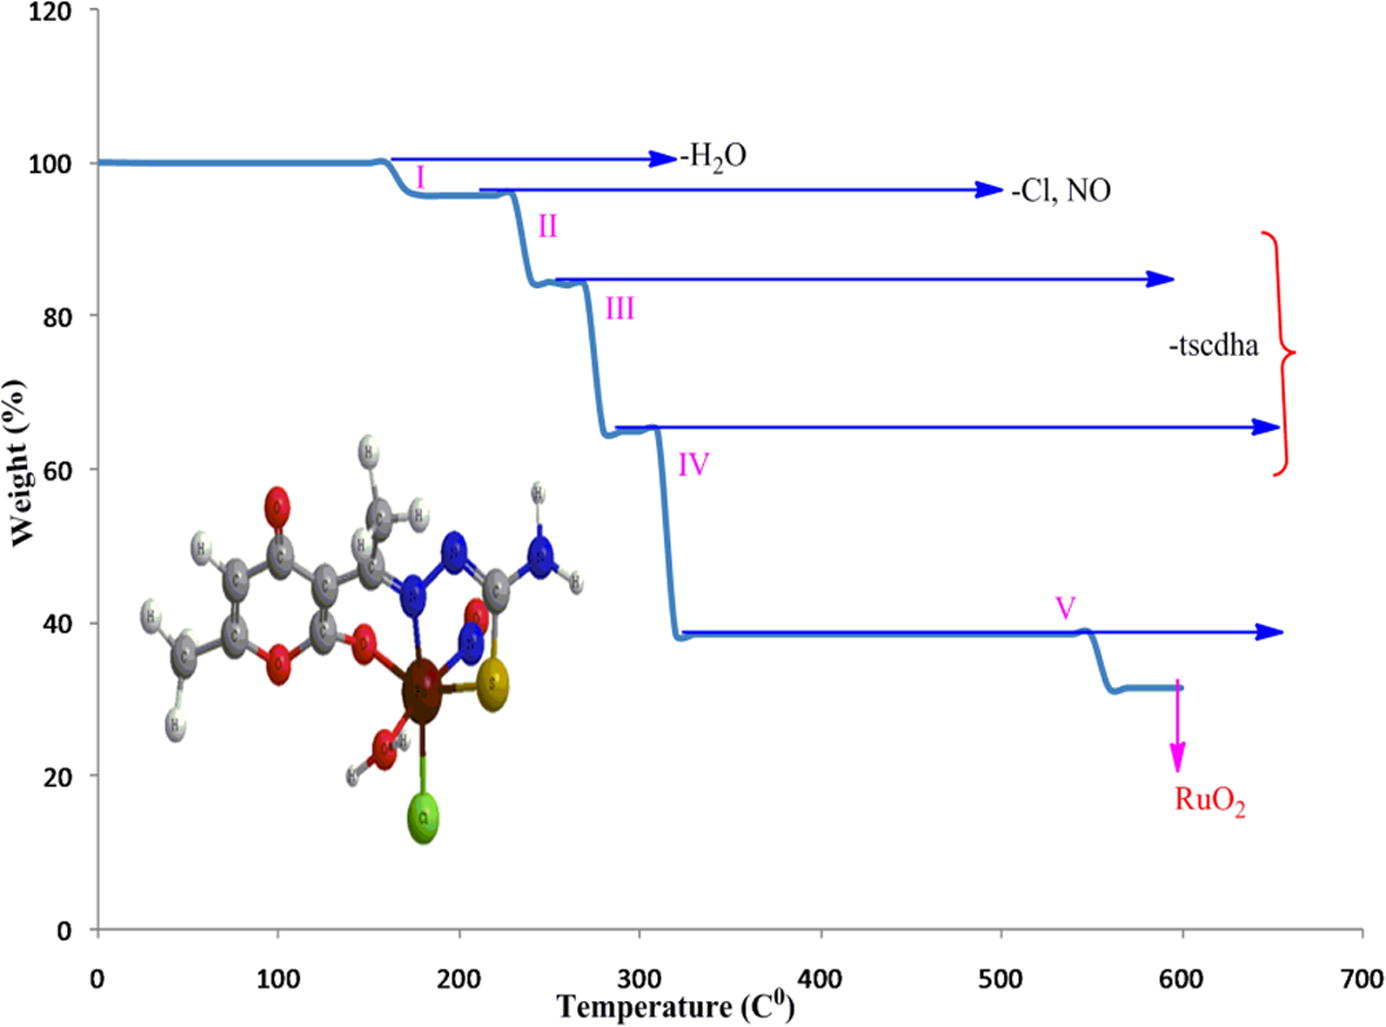
TG curve of the complex with respective pyrolysis.
3.2 DFT based geometrical optimization and electrostatics
Geometrical optimization is the first and foremost step in DFT calculation. As among an infinite number of minima and maxima of potential, one has to arrive an equilibrium structure to show least unstability, optimization solves this problem by attaining most stable stage of the potential. The optimized geometry of the complex is shown in Fig. 11. The various bond lengths, bond angles and dihedral angles generated from the equilibrium structure of the complex, are given in the Table 2. The computed bond lengths (Å), such as, N(11)-Ru(16), S(14)-Ru(16), Ru(16)-Cl(17), Ru(16)-N(18) and Ru(16)-O(20) confined to the metallic coordination sphere have been found to be 2.02, 2.41, 2.39, 1.77 and 2.24, respectively. All the bond lengths around coordination zone of metal are falling in the range of 2 Å except the bond connectivity between Ru and N of NO ligand. This clarifies the nature of charge delocalization along the path of nitric oxide ligand attached with the metal in a different manner. Similarly the bond angles (°) around the metallic sphere like Ru(16)-O(20)-H(28) ∼ 99.37, Ru(16)-O(20)-H(27) ∼ 97.49, N(18)-Ru(16)-O(20) ∼ 93.44, Cl(17)-Ru(16)-O(20) ∼ 80.3, S(14)-Ru(16)-O(20) ∼ 100.41, S(14)-Ru(16)-N(18) ∼ 88.93, S(14)-Ru(16)-Cl(17) ∼ 87.17, N(11)-Ru(16)-N(18) ∼ 96.73, N(11)-Ru(16)-S(14) ∼ 84.19 and dihedral angles like C(2)-C(1)-N(11)-Ru(16) ∼ 10.13, C(29)-C(1)-N(11)-N(12) ∼ 6.36, C(29)-C(1)-N(11)-Ru(16) ∼ −167.98, C(2)-C(3)-O(4)-Ru(16) ∼ 14.43, C(9)-C(3)-O(4)-Ru(16) ∼ −166.04 explain the octahedral geometry of the complex. One of the interesting facts about the calculated bond angles is the prediction of linear nitrosyl group for the model complex by considering the bond angle Ru(16)-N(18)-O(19), 172.37°.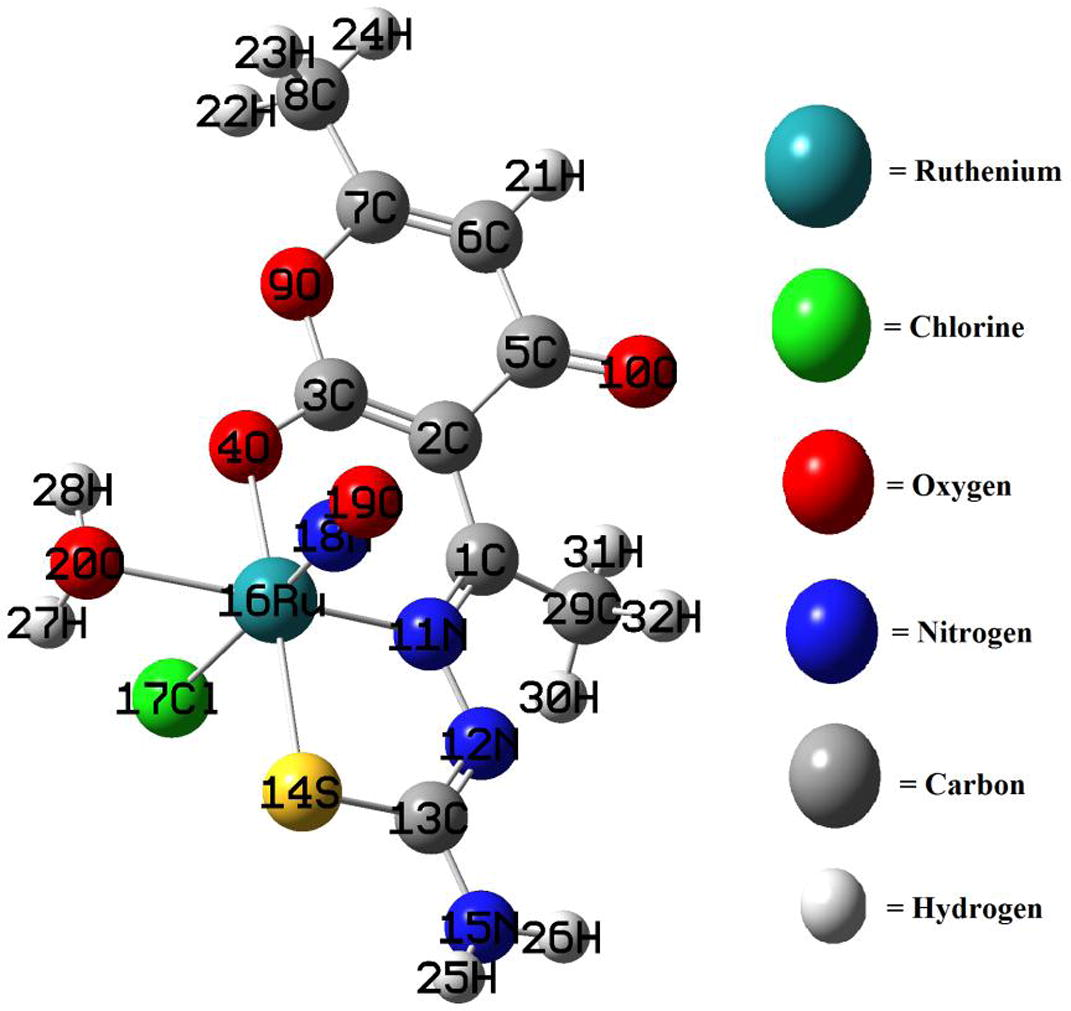
Optimized structure of the complex and color coding of the constituent atoms.
S. No.
Atom Connectivity
Bond Length (Å)
Atom Connectivity
Bond Angle (°)
Atom Connectivity
Dihedral Angle (°)
1
C(1)-C(2)
1.46
C(2)-C(1)-N(11)
124.43
N(11)-C(1)-C(2)-C(3)
−22.44
2
C(1)-N(11)
1.32
C(2)-C(1)-C(29)
119.34
N(11)-C(1)-C(2)-C(5)
156.66
3
C(1)-C(29)
1.51
N(11)-C(1)-C(29)
116.19
C(29)-C(1)-C(2)-C(3)
155.62
4
C(2)-C(3)
1.41
C(1)-C(2)-C(3)
124.15
C(29)-C(1)-C(2)-C(5)
−25.27
5
C(2)-C(5)
1.48
C(1)-C(2)-C(5)
118.44
C(2)-C(1)-N(11)-N(12)
−175.52
6
C(3)-O(4)
1.27
C(3)-C(2)-C(5)
117.41
C(2)-C(1)-N(11)-Ru(16)
10.13
7
C(3)-O(9)
1.36
C(2)-C(3)-O(4)
128.83
C(29)-C(1)-N(11)-N(12)
6.36
8
C(4)-Ru(16)
2.07
C(2)-C(3)-O(9)
121.43
C(29)-C(1)-N(11)-Ru(16)
−167.98
9
C(5)-C(6)
1.46
O(4)-C(3)-O(9)
109.74
C(2)-C(1)-C(29)-H(30)
−137.06
10
C(5)-O(10)
1.23
C(3)-O(4)-Ru(16)
120.73
C(2)-C(1)-C(29)-H(31)
−14.24
11
C(6)-C(7)
1.34
C(2)-C(5)-C(6)
115.7
C(2)-C(1)-C(29)-H(32)
105.5
12
C(6)-H(21)
1.08
C(2)-C(5)-O(10)
124.08
N(11)-C(1)-C(29)-H(30)
41.16
13
C(7)-C(8)
1.49
C(6)-C(5)-O(10)
120.2
N(11)-C(1)-C(29)-H(31)
163.98
14
C(7)-O(9)
1.37
C(5)-C(6)-C(7)
121.8
N(11)-C(1)-C(29)-H(32)
−76.28
15
C(8)-H(22)
1.09
C(5)-C(6)-H(21)
117.25
C(1)-C(2)-C(3)-O(4)
8.18
16
C(8)-H(23)
1.09
C(7)-C(6)-H(21)
120.93
C(1)-C(2)-C(3)-O(9)
−171.3
17
C(8)-H(24)
1.09
C(6)-C(7)-C(8)
127.96
C(5)-C(2)-C(3)-O(4)
−170.93
18
N(11)-N(12)
1.37
C(6)-C(7)-O(9)
120.66
C(5)-C(2)-C(3)-O(9)
9.59
19
N(11)-Ru(16)
2.02
C(8)-C(7)-O(9)
111.37
C(1)-C(2)-C(5)-C(6)
169.52
20
N(12)-C(13)
1.3
C(7)-C(8)-H(22)
110.45
C(1)-C(2)-C(5)-O(10)
−11.54
21
C(13)-S(14)
1.76
C(7)-C(8)-H(23)
110.63
C(3)-C(2)-C(5)-C(6)
−11.32
22
C(13)-N(15)
1.36
C(7)-C(8)-C(24)
110.44
C(3)-C(2)-C(5)-O(10)
167.62
23
S(14)-Ru(16)
2.41
H(22)-C(8)-H(23)
107.35
C(2)-C(3)-O(4)-Ru(16)
14.43
24
N(15)-H(25)
1.01
H(22)-C(8)-H(24)
108.94
C(9)-C(3)-O(4)-Ru(16)
−166.04
25
N(15)-H(26)
1.01
H(23)-C(8)-H(24)
108.96
C(2)-C(3)-O(9)-C(7)
−2.25
26
Ru(16)-Cl(17)
2.39
C(3)-O(9)-C(7)
122.03
O(4)-C(3)-O(9)-C(7)
178.17
27
Ru(16)-N(18)
1.77
C(1)-N(11)-N(12)
116.7
C(3)-O(4)-Ru(16)-N(11)
−19.12
28
Ru(16)-O(20)
2.24
C(1)-N(11)-Ru(16)
123.32
C(3)-O(4)-Ru(16)-Cl(17)
−108.81
29
N(18)-O(19)
1.15
N(12)-N(11)-Ru(16)
119.74
C(3)-O(4)-Ru(16)-N(18)
78.21
30
O(20)-H(27)
0.99
N(11)-N(12)-C(13)
117.3
C(3)-O(4)-Ru(16)-O(20)
170.35
31
O(20)-H(28)
0.973
N(12)-C(13)-S(14)
126.27
C(2)-C(5)-C(6)-C(7)
6.55
32
C(29)-H(30)
1.09
N(12)-C(13)-N(15)
117.48
C(2)-C(5)-C(6)-H(21)
−174.91
33
C(29)-H(31)
1.08
S(14)-C(13)-N(15)
116.24
O(10)-C(5)-C(6)-C(7)
−172.43
34
C(29)-H(32)
1.09
C(13)-S(14)-Ru(16)
92.08
O(10)-C(5)-C(6)-H(21)
6.02
35
C(13)-N(15)-H(25)
118.57
C(5)-C(6)-C(7)-C(8)
179.66
36
C(13)-N(15)-H(26)
116.62
C(5)-C(6)-C(7)-O(9)
0.68
37
H(25)-N(15)-H(26)
117.34
H(21)-C(6)-C(7)-C(8)
1.26
38
O(4)-Ru(16)-N(11)
93.49
H(21)-C(6)-C(7)-O(9)
−177.71
39
O(4)-Ru(16)-Cl(17)
85.8
C(6)-C(7)-C(8)-H(22)
120.93
40
O(4)-Ru(16)-N(18)
98.32
C(6)-C(7)-C(8)-H(23)
−120.35
41
O(4)-Ru(16)-O(20)
80.68
C(6)-C(7)-C(8)-H(24)
0.36
42
N(11)-Ru(16)-S(14)
84.19
O(9)-C(7)-C(8)-H(22)
−60.01
43
N(11)-Ru(16)-Cl(17)
89.95
O(9)-C(7)-C(8)-H(23)
58.7
44
N(11)-Ru(16)-N(18)
96.73
O(9)-C(7)-C(8)-H(24)
179.41
45
S(14)-Ru(16)-Cl(17)
87.17
C(6)-C(7)-O(9)-C(3)
−3.21
46
S(14)-Ru(16)-N(18)
88.93
C(8)-C(7)-O(9)-C(3)
177.66
47
S(14)-Ru(16)-O(20)
100.41
C(1)-N(11)-N(12)-C(13)
−179.99
48
Cl(17)-Ru(16)-O(20)
80.3
Ru(16)-N(11)-N(12)-C(13)
−5.43
48
N(18)-Ru(16)-O(20)
93.44
C(1)-N(11)-Ru(16)-O(4)
7.45
50
Ru(16)-O(20)-H(27)
97.49
C(1)-N(11)-Ru(16)-S(14)
−179.59
51
Ru(16)-O(20)-H(28)
99.37
C(1)-N(11)-Ru(16)-Cl(17)
93.25
52
H(27)-O(20)-H(28)
104.16
C(1)-N(11)-Ru(16)-N(18)
−91.36
53
C(1)-C(29)-H(30)
108.34
N(12)-N(11)-Ru(16)-O(4)
−166.73
54
C(1)-C(29)-H(31)
111.21
N(12)-N(11)-Ru(16)-S(14)
6.23
55
C(1)-C(29)-H(32)
110.66
N(12)-N(11)-Ru(16)-Cl(17)
−80.93
56
H(30)-C(29)-H(31)
111.45
N(12)-N(11)-Ru(16)-N(18)
94.46
57
H(30)-C(29)-H(32)
107.35
C(1)-N(11)-O(20)-H(27)
106.2
58
H(31)-C(29)-H(32)
107.76
C(1)-N(11)-O(20)-H(28)
1.43
59
N(12)-N(11)-O(20)-H(27)
−61.43
60
N(12)-N(11)-O(20)-H(28)
−166.19
61
N(11)-N(12)-C(13)-S(14)
−0.03
62
N(11)-N(12)-C(13)-N(15)
179.05
63
N(12)-N(13)-S(14)-Ru(16)
4.002
64
N(15)-N(13)-S(14)-Ru(16)
−175.09
65
N(12)-N(13)-N(15)-H(25)
163.01
66
N(12)-N(13)-N(15)-H(26)
13.92
67
S(14)-N(13)-N(15)-H(25)
−17.81
68
S(14)-N(13)-N(15)-H(26)
−166.89
69
C(13)-N(14)-Ru(16)-N(11)
−4.52
70
C(13)-N(14)-Ru(16)-Cl(17)
85.71
71
C(13)-N(14)-Ru(16)-N(18)
−101.4
72
C(13)-N(14)-Ru(16)-N(20)
165.31
73
O(4)-Ru(16)-O(20)-H(27)
103.43
74
O(4)-Ru(16)-O(20)-H(28)
−2.35
75
S(14)-Ru(16)-O(20)-H(27)
−69.15
76
S(14)-Ru(16)-O(20)-H(28)
−174.92
77
Cl(17)-Ru(16)-O(20)-H(27)
16.13
78
Cl(17)-Ru(16)-O(20)-H(28)
−89.64
79
N(18)-Ru(16)-O(20)-H(27)
−158.69
80
N(18)-Ru(16)-O(20)-H(28)
95.53
Density functional theory can also be used to explain charge topography of the complex justifying the nature of constituent atoms. From the calculation scheme it has been found that the complex bears 3.3 D dipole moment and the respective extension of the polarizability along different tensor orders in terms of x, y, z components are given in Table 3. The resultant force under dipole vector representation indicates nuclear-nuclear interaction to be 2.3 D, electron-nuclear 9.1 D and the kinetic energy parameter to be 1.8 D. This type of behaviour projecting under all the possible orientations represents the possibility of laser application or may be thought to be applicable in Photodynamics. The concept of molecular polarizability under such instance can be helpful in medical technology as well. From the apparent dipolar properties within the molecular system can be thought to have arised because of the different sets of electron donoring and accepting sites.
Dipole moment (field-independent basis, Debye):
µX = −0.5867, µY = −2.3604 and µZ = 2.1924 and µTotal = 3.3
Quadrupole moment (field-independent basis, Debye-Ang):
µXX = −128.7627
µYY = −139.3667
µZZ = −155.2914
µXX = −128.7627
µYY = −139.3667
µZZ = −155.2914
µXY = 21.8383
µXZ = 7.7356
µYZ = −2.0396
Traceless Quadrupole moment (field-independent basis, Debye-Ang):
µXX = 12.3776
µYY = 1.7735
µZZ = −14.1511
µXY = 21.8383
µXZ = 7.7356
µYZ = −2.0396
Octapole moment (field-independent basis, Debye-Ang2):
µXXX = 2.9848
µYYY = −84.1140
µZZZ = 32.2856
µXYY = 84.5021
µXXY = −13.9545
µXXZ = 7.8703
µXZZ = 5.2109
µYZZ = −20.3142
µYYZ = −14.4069
µXYZ = 19.1565
Hexadecapole moment (field-independent basis, Debye-Ang3):
µXXXX = −5148.4412
µYYYY = −2204.5703
µZZZZ = −1037.7812
µXXXY = 413.8366
µXXXZ = 99.6928
µYYYX = 192.3963
µYYYZ = 14.5440
µZZZX = 32.0483
µZZZY = −18.4305
µXXYY = −1334.0930
µXXZZ = −1239.0412
µYYZZ = −558.9781
µXXYZ = 10.8864
µYYXZ = 28.8143
µZZXY = −6.8147
3.3 Molecular graphics
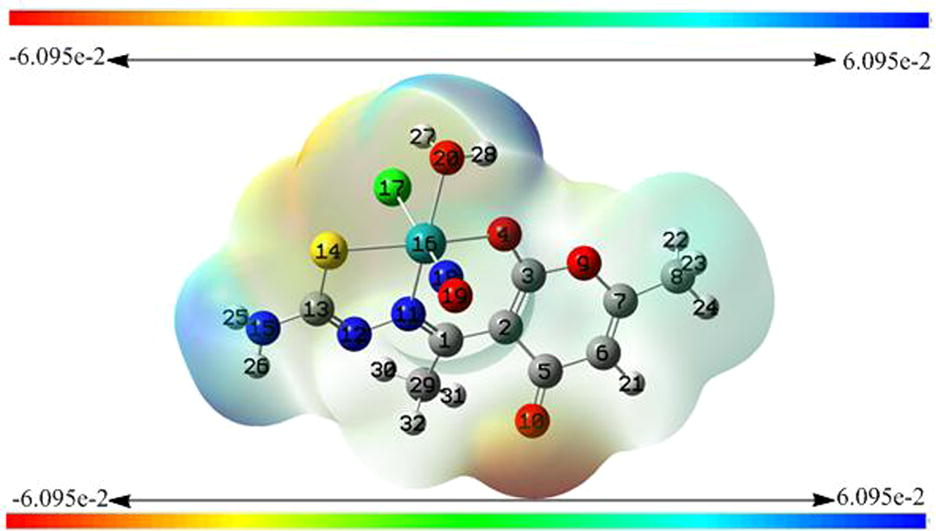
Molecular graphics are too difficult to be drawn by hand. Quantum theory enables us to reply the address of electrons and therefore they hold the key to our understanding of molecular structure and reactivity. Recalling that the number of MOs equals the total number of AOs used the complex under question has got 32 atoms including 210 electrons under neutral state. Among 210 electrons 28 electrons have been assigned as frozen core electrons and the remaining electrons are the tools to specialize the shape and size of the molecule. The resulting combinations of atomic orbitals shape sigma and pi molecular orbitals in such a way that a specific graphic diagrams are obtained in terms of electron density whether alpha, beta or total density is the case. Electron density (ED) plots represent the sum of electrons in all the filled molecular orbitals. The 3-D plot isosurface (Fig. 12) comprises of all the points having equal electron density wherein electron density decreases exponentially as we move away from the nuclei. A density of about = 0.02 electrons/Å3 is the typical “space-filling” image of a molecule. From Fig. 11 the specific color coding of particular regions around coordination zone is an indication of electropositive, electronegative and neutral properties. Under such investigation the ketonic group of dha moiety that faces away from the coordination sphere and is not bonded with metal represents high electron dense region whereas the zone of hydrogens bonded with terminal NH2 of tsc moiety and coordinated water are possessing electropositive potential.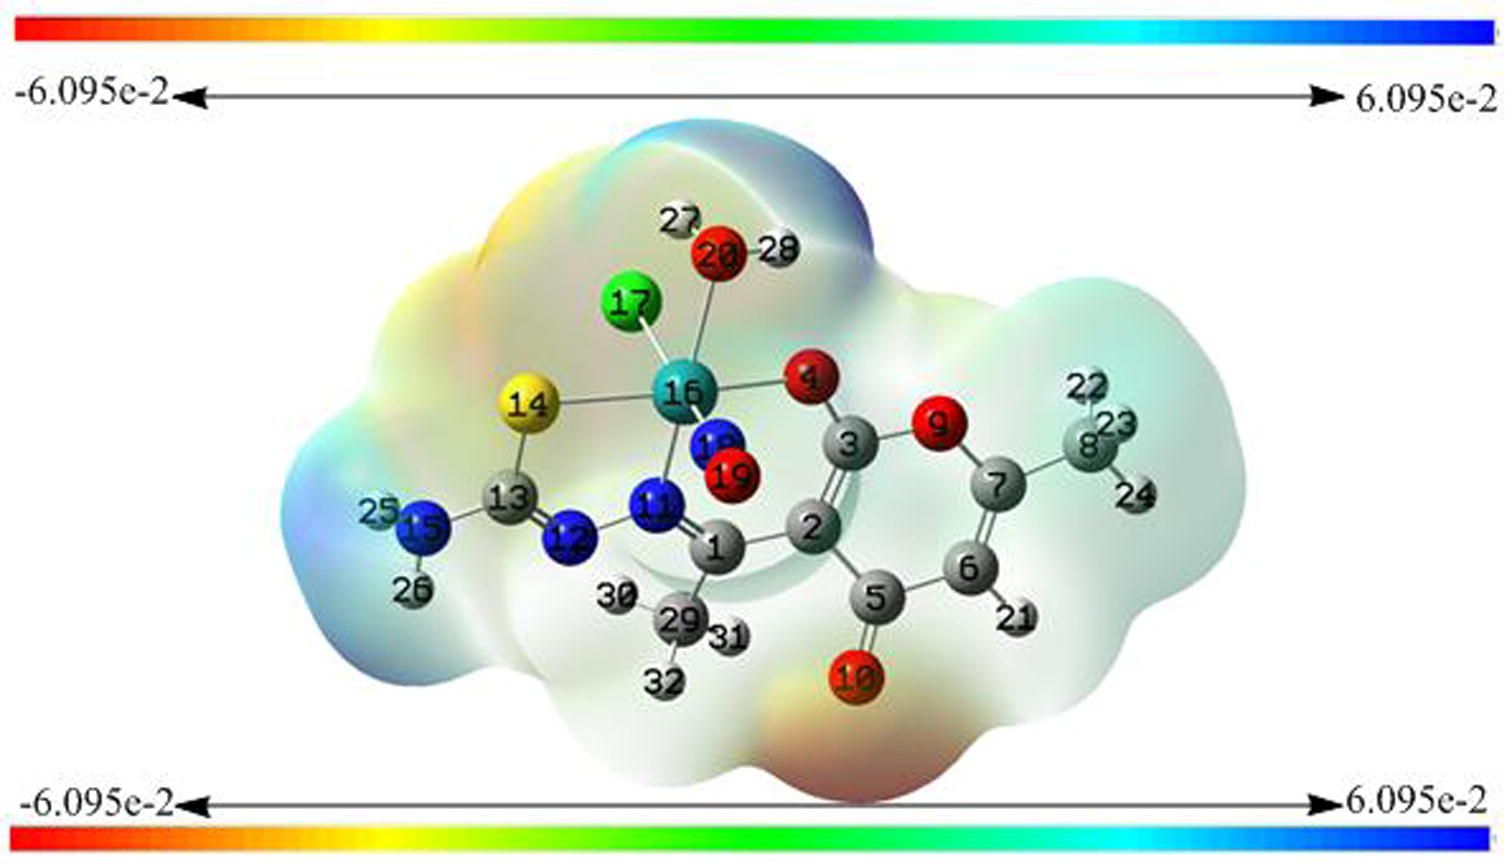
Electrostatic potential surface of the complex.
At any point the electrostatic potential (ESP) around the molecule is determined by the balance between the negative charges of any electron confined about the vicinity and positive charges of nearby nuclei. Hence, negative ESP means electron-rich site and positive ESP is positive. The 3-D mapped iso-surfaces plot containing a spectrum from red to blue onto the electron density surface of the complex under investigation gives a clear speculation of both the regions and such behaviour plays an important role in microbial activity.
This important parameter involves the charge analysis by numerical and color code assignment based on Mulliken and Natural Bond Orbitals (NBOs) analyses. Fig. 13 is the pictorial representation of individual atom charge analysis despite the fact that the molecule is neural on the whole. Rotational constants (GHz) 0.3734013, 0.1787494 and 0.1494406 along possible rotation and the magnitude of partial charges as analyzed shows the molecular flexibility to fetch better scaffolds to design desirable system. Although in both the NPA scales all the atoms bear same type of charges, i.e. every atom is either positive or negative in the both analysis except Ru which is negative in Mulliken scale and positive in NBO. Nevertheless, there is difference in magnitude of charges in both the scales, but it is factual to determine how far NBO is attaining the quantified values when compared with Mulliken scale. As Mulliken scale is not so much authentic scale in this regard.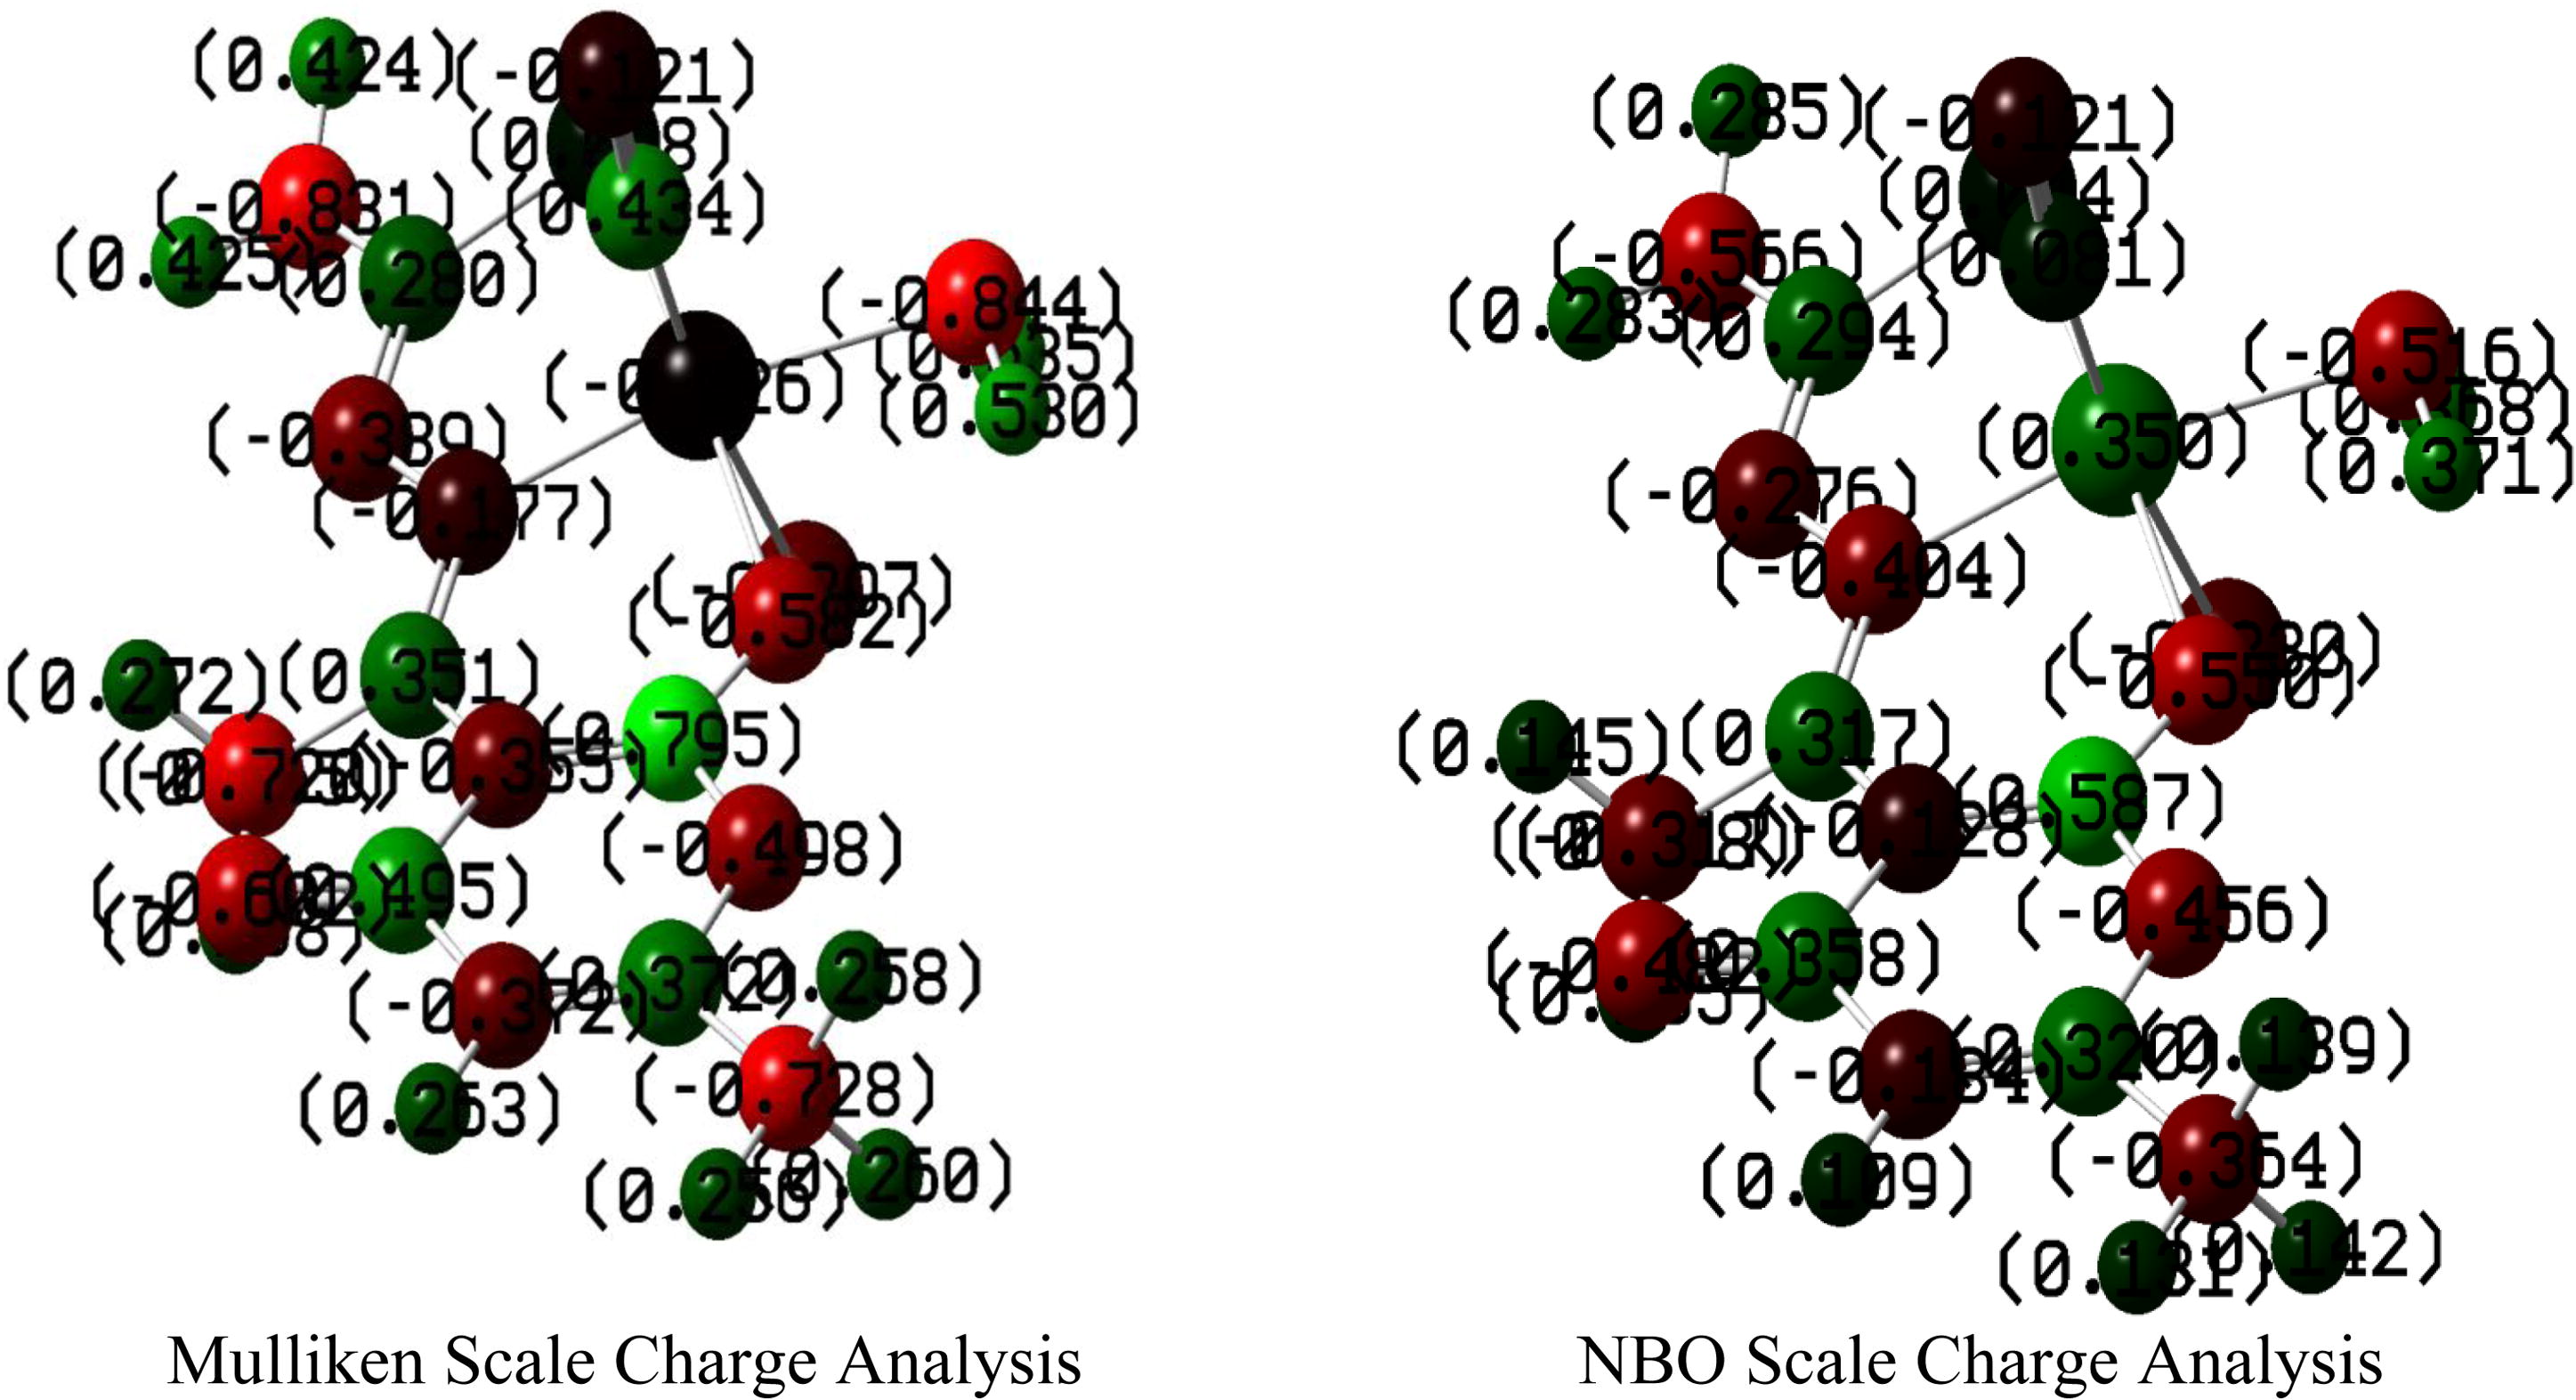
Mulliken and NBO charge analysis of the complex.
Depending on the electronic charge on the chelating atoms one may depict the bonding capability of a molecule. In order to quantify and compare specific interactions pertaining to the pictorial presentation of orbitals, numerical values serve as the keys to intensify their value. In case of donation versus back donation in transition metals and σ/π bonding it may prove helpful by assigning charges to the constituent atoms of a molecule (Hunt et al., 2006; Murali and Balachandran, 2012). The natural population analysis satisfies Pauli’s exclusion principle and solves the basis set dependence problem of the Mulliken’s population analysis (Mulliken, 1995). Table 4 indicates the electronic configuration of central metal of the complex. The Rydberg, Core and Valence sets have been shown. It is the d-orbital where in interesting val and Ryd is observed with no core electron. From the occupancy and the energy tabulated for the coordination zone of metallic orbital the flexibility of oxidation state is clearly evident. The dz2 among d orbitals bears lowest occupancy (valence electrons) and the energy content appears similar to low lying d-orbitals, hence proves the tendency of back-donation of ligand and low energy gap among the orbital levels that promotes the feasibility to NO ligand to undergo photo-dissociation.
Lang
Type Atomic Orbital
Occupancy
Energy (a.u.)
S
Cor(4S)
1.992
−2.90
S
Val(5S)
0.318
0.34
S
Ryd(6S)
0.001
3.38
px
Cor(4p)
1.998
−1.83
px
Val(5p)
0.225
0.17
px
Ryd(6p)
0.002
0.30
py
Cor(4p)
1.995
−1.83
py
Val(5p)
0.177
0.21
py
Ryd(6p)
0.003
0.30
pz
Cor(4p)
1.992
−1.84
pz
Val(5p)
0.259
0.13
pz
Ryd(6p)
0.001
0.23
dxy
Val(4d)
1.811
−0.30
dxy
Ryd(5d)
0.007
0.61
dxz
Val(4d)
1.477
−0.29
dxz
Ryd(5d)
0.005
0.54
dyz
Val(4d)
1.531
−0.30
dyz
Ryd(5d)
0.004
0.55
dx2y2
Val(4d)
1.147
−0.27
dx2y2
Ryd(5d)
0.004
0.73
dz2
Val(4d)
1.061
−0.31
dz2
Ryd(5d)
0.008
0.82
4 UTI antibacterial activity of the complex
The urinary tract infection causing bacteria were isolated, cultured and identified at Biological Science Department of our university and were obtained from samples collected from Mumbai Hospital, Jabalpur. Different concentrations of the complex were used for studying antibacterial activity. A stock solution of 1 mg in 1 mL of dimethyl sulfoxide was prepared by dissolving the compound in DMSO. This solution was serially diluted in order to find Minimum Inhibitory Concentration (MIC) values (50, 75 and 100 µM concentrations). Agar well diffusion method was employed to get active strains of Pseudomonas (MTCC 1688) and E. Coli (MTCC407). Mueller Hinton agar plates (MHA) were prepared and 20 μL suspensions of microorganism containing approximately 105 CFU (colony forming unit) were applied to the plate. The entire experimental procedure was carried out under strict aseptic conditions. After solidification of medium, sterile borer (5 mm) was used to make wells for different concentrations of the sample to be subjected for sensing their activity. 20 μL of the different diluted solutions of the compound were introduced into the wells and plates were incubated at 37 °C for 72 h. Six sets of the two strains were experimented to minimize possible errors. Microbial growth was determined by measuring the diameter of zone of inhibition. A control with standard antibiotic was kept for all test strains and the control activity was deducted from the test and results were recorded. Ofloxacin as antibacterial was the standard drug utilized for comparing antimicrobial properties of the model complex against the selected microbes. The MIC values and zone of inhibitions have been given in Table 5.
Microbial Strain
Zone of inhibition
100 µM
75 µM
50 µM
Standard (1 µM)
Pseudomonas
27.50 ± 1.914
23.75 ± 1.707
18.25 ± 0.957
34.25 ± 2.217
E. coli
19.50 ± 6.350
14.50 ± 5.066
7.50 ± 3.109
32.12 ± 1.314
The antimicrobial activity was assayed by measuring the diameter of the inhibition zone formed around the well. From the petri plates (Fig. 14) it may be seen that increasing the concentration of compound increases the antibacterial action of the complex. It may be stated that the under highest concentration of the compound the maximum anti-bacterial activity is pronounced against Pseudomonas. IC50 values of 80 µM against Pseudomonas and 110 µM against E. Coli depicts the same. The well pronounced increase in lipophilic character may result in the consequence of increase in permeability through the lipid layers of cell membrane. The existence of both the negative and positive charge centres well distinguished in MESP of the complex should represent the potential to cross the biological membrane.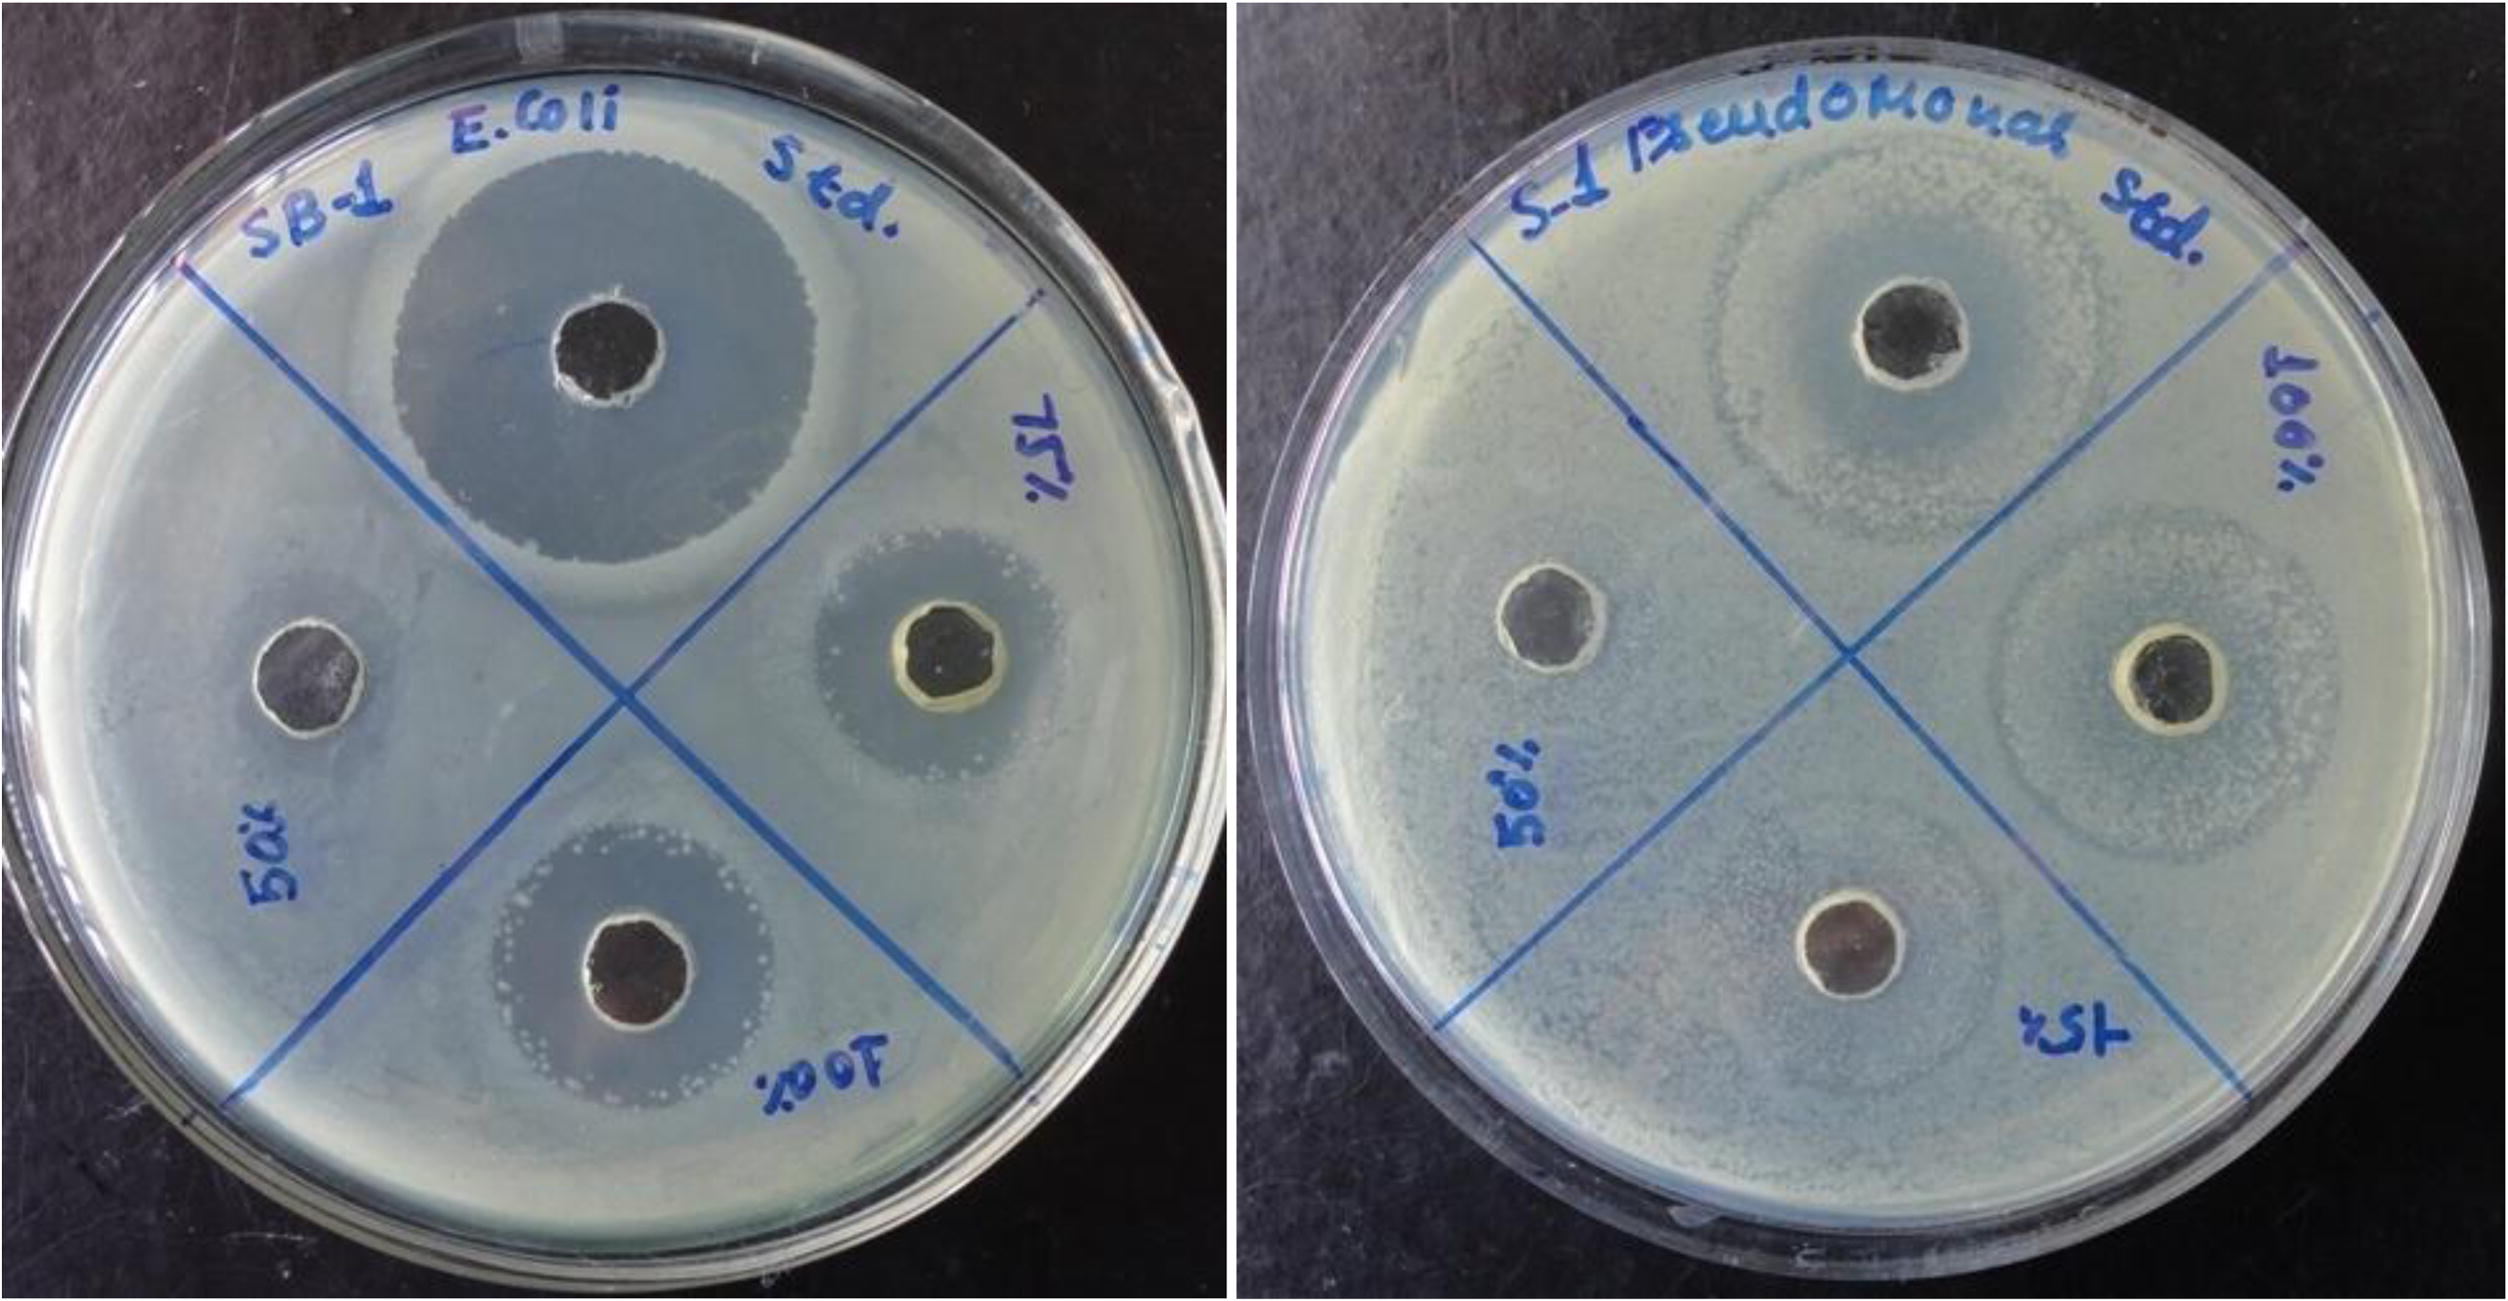
Petri-dishes showing inhibition zones.
It is a well known fact that nitric oxide is utilized as defensive molecule recognition by pathogens. This feature together with the bioactive components of the complex is expected to serve as sources of functional antibodies that can be used in immunotherapy. Antibody collection is a laborious task. However, such compounds are engineered to behave as antibiotics of interesting choice. Further stretch in their composition like immunogenic peptides can be brought up by chemical transformation methods. Seeking drugs under this heading may bring forth great approach to treat multidrug resistant microbes causing nosocomial and community acquired infections. The increasing incidence of drug resistant pathogens has developed interest towards compounds that becoming useful therapeutic tools. Briefly, it may be stated that there is a lot yet to be done to explore anti-infectious potential of the metallic complexes in this regard by altering the nature of ligand around the coordination zone.
5 Concluding remarks
From the overall study an octahedral geometry is suggested for the complex under investigation. The Schiff base ligand has been found coordinated in a tetra dentate dibasic fashion by the metallic centre. In summary, in addition to providing information that will increase our knowledge of ruthenium nitrosyl chemistry, these findings may be useful for tailoring new complexes for catalytic and medical applications. The useful sensitivity towards nosocomial infections of the metallic complex may be extended further on changing ligational properties.
Acknowledgements
Authors are thankful to Prof. Kapil Deo Mishra, Vice Chancellor, Rani Durgawati University, Jabalpur for his incessant enthusiasm to develop the infrastructure of our department. Biological Science Department, Mumbai Hospital, Jabalpur, SAIF-IIT, Mumbai and SAIF-CDRI, Lucknow are also gratefully acknowledged.
References
- J. Chem. Phys.. 1986;84(8):4524-4529.
- J. Chem. Phys.. 1993;98:5652-5684.
- Inorg. Chem.. 2002;41:5410-5416.
- Adv. Funct. Mater.. 2001;11:15.
- J. Braz. Chem. Soc.. 2013;24(9):1487-1496.
- J. Inorg. Biochem.. 2011;105:1035-1043.
- J. Inorg. Biochem.. 2014;134:36-38.
- J. Mol. Struct.. 2004;701:111.
- J. Mol. Struct.. 2013;1048:11-17.
- J. Chem. Phys.. 2001;115:4708.
- J. Comput. Chem.. 2003;24:669.
- Int. J. Quantum Chem.. 2010;110:2614.
- J. Inorg. Biochem.. 2001;83(2–3):169.
- New J. Chem.. 2008;32:1167-1174.
- J. Chem. Phys.. 1982;77:3654-3665.
- Inorg. Chim. Acta. 2014;409:147-155.
- Gaussian 09, Revision C.01, M.J. Frisch, G.W. Trucks, H.B. Schlegel, G.E. Scuseria, M.A. Robb, J.R. Cheeseman, G. Scalmani, V. Barone, B. Mennucci, G.A. Petersson, H. Nakatsuji, M. Caricato, X. Li, H. P. Hratchian, A.F. Izmaylov, J. Bloino, G. Zheng, J.L. Sonnenberg, M. Hada, M. Ehara, K. Toyota, R. Fukuda, J. Hasegawa, M. Ishida, T. Nakajima, Y. Honda, O. Kitao, H. Nakai, T. Vreven, J.A. Montgomery, Jr., J. E. Peralta, F. Ogliaro, M. Bearpark, J.J. Heyd, E. Brothers, K.N. Kudin, V.N. Staroverov, T. Keith, R. Kobayashi, J. Normand, K. Raghavachari, A. Rendell, J.C. Burant, S.S. Iyengar, J. Tomasi, M. Cossi, N. Rega, J.M. Millam, M. Klene, J.E. Knox, J.B. Cross, V. Bakken, C. Adamo, J. Jaramillo, R. Gomperts, R.E. Stratmann, O. Yazyev, A.J. Austin, R. Cammi, C. Pomelli, J.W. Ochterski, R.L. Martin, K. Morokuma, V.G. Zakrzewski, G.A. Voth, P. Salvador, J.J. Dannenberg, S. Dapprich, A.D. Daniels, O. Farkas, J.B. Foresman, J.V. Ortiz, J. Cioslowski, and D.J. Fox, Gaussian Inc, Wallingford CT, 2010.
- Science. 1982;218:747.
- GaussView 5.0, Gaussian Inc., Garnegieoffice. Park. Pittsburgh. PA, USA.
- J. Chem. Phys.. 1985;82:270-283.
- Eur. J. Med. Chem. 2011:1-7. xxx
- Polyhedron. 2014;70:29-38.
- Chem. Eur. J.. 2006;12:6762-6775.
- Hyperchem for Windows, Release 7.01. Hypercube Inc., 115 NW 4th street, Gainesville, FL 32601, USA.
- Inorg. Chim. Acta. 2014;413:90-96.
- Croat. Chem. Acta. 2011;84:203.
- Inorg. Chem.. 2013;52:5201-5205. Inorg. Chem.. 2009;48(19):9155-9165.
- Inorg. Chem. Acta. 2005;358:2883-2890.
- J. Comput. Chem.. 2006;27:1338-1351.
- Int. J. Sci. Eng. Res.. 2014;5:305-320.
- Polyhedron. 2014;69:240-243.
- J. Inorg. Chim. Acta. 1985;107:91.
- J. Chem. Phys.. 1995;23:1833.
- Indian J. Pure Appl. Phys.. 2012;50:19-25.
- Phys. Rev. B. 1986;33(12):8822-8824.
- Pradhan, B., Ramana Rao, D.V., J. Ind. Chem. Soc., LIV, 136, 1977.
- Behav. Brain Res.. 2014;267:46-54.
- J. Comput. Chem.. 1993;14:1347-1363.
- Spectrochim. Acta, A. 2012;83:540.
- Liebigs Ann.. 1995;10:1903.
- J. Comput. Chem.. 1989;10:209-220.
- Inorg. Chem. Commun.. 2013;28:60-63.
- Inorg. Chim. Acta. 2014;421:74-79.
- Polyhedron. 2014;81:238-244.
- Chem. Commun.. 2013;49:4391.
- Acta Cryst.. 2009;65:1463-1464.
- Inorg. Chem. Commun.. 2006;9:183-186.
- J. Am. Soc.. 1980;102:589-599.


