Translate this page into:
Validation of BEAMnrc Monte Carlo model for a 12 MV photon beam
⁎Corresponding author at: Radiations and Nuclear Systems Laboratory, University Abdelmalek Essaadi, Faculty of Sciences, Tetouan, Morocco. magedm22@gmail.com (Maged Mohammed)
-
Received: ,
Accepted: ,
This article was originally published by Elsevier and was migrated to Scientific Scholar after the change of Publisher.
Peer review under responsibility of King Saud University.
Abstract
Accurate dose calculation in the treatment planning system (TPS) process is the most important step to succeed the radiation therapy. For this purpose, Monte Carlo method is a powerful tool for dose calculation. This study aims to validate Monte Carlo BEAMnrc model of Saturne43 Linac head to simulate 12 MV photon beam. To validate MC model, the dose distributions were calculated by BEAMnrc simulation and then the results obtained were compared against measurements. This requires to adjust the parameters of the initial electron beam incident on the target, such as mean energy, beam radius and mean angular spread. Our approach has been suggested to determine the initial electron beam parameters. The dose distribution (percent depth dose and lateral profile) has been calculated for 10 × 10 cm2 field size in a homogeneous water phantom of 40 × 40 × 40 cm3. The results obtained are compared with measured data using gamma index criteria which were fixed within 1.5%-1 mm accuracy. Using phase space technique as a sub-source allows us to reduce the simulation time by a factor of 6. Good agreement between calculated and measured dose has been achieved when the mean energy, beam width and mean angular spread were 11.8 MeV, 1.5 mm and 0.5°, respectively. So, Monte Carlo based- BEAMnrc code is suitable to be used in the process of treatment planning system for calculating dose distribution.
Keywords
Monte Carlo
BEAMnrc
Dose distribution
Linac
Phase space
1 Introduction
A good compatibility between the calculated doses and those delivered to the patient is most important for the success of radiation therapy (Verhaegen and Seuntjens, 2003). Dose distribution can be estimated by Monte Carlo simulations with a high accuracy. A precision of dose calculation by Monte Carlo codes requires accurate identification of the head geometry and the incident electron parameters (Verhaegen and Seuntjens, 2003). Errors in determining the parameters of the electron incident on the target will directly cause a systematic error in every dose calculation (Keall et al., 2003). The difficult stage Monte Carlo users face in radiation therapy is to determine the initial electron parameters (Chow et al., 2013).
This work aims to validate the Monte Carlo model for a Saturne43 Linac of 12 MV photon beam and to study the influence of electron beam parameters on dose distributions. To achieve this objective, the dose distribution (depth dose and beam profile) calculated by Monte Carlo technique is compared with the experimental data. Initial electron beam parameters as mean energy, mean angular spread and beam width were studied. Our suggested methodology is summarized as the following:
Firstly, the beam width value and mean angular spread were fixed at 0.1 mm and 0.0°, respectively, then several mean energies, around the nominal energy 12 MeV, of incident electrons are tested in order to get the suitable value that gives the most agreement dose distribution with measured.
Secondly, the optimum value of mean energy obtained in the first step will be set as default, and then many width values are tested to produce a more consistent matching of dose distributions with measurement. Third step consists of simulating a range of mean angular spread angles. The best values obtained in two first steps are set as default.
For each simulation, the dose distribution results are compared to reference data using gamma index criteria. The tolerance value assigned to relative dose was fixed at 1.5% and the tolerance value for measured positions was considered as 0.1 cm. This accuracy is better than that proposed by the American Association of Medical Physics which was set at 2%–2 mm (EL Bakkali and EL Bardouni, 2017)
2 Materials and methods
2.1 Monte Carlo simulation
A BEAMnrc platform (Rogers et al., 2001), based on EGSnrc Monte Carlo technique (Kawrakow et al., 2006), was used to model a Sturne43 Linear accelerator and simulate 12 MV photon beam. The materials and geometrical data of considered Saturne43 Linac head were provided by CEA LIST LNHB (Henri Becquerel laboratory). The experimental dose distributions were calculated within water phantom of 40 × 40 × 40 cm3, for 10 × 10 cm2 field size defined at 100 cm and SSD equal 90 cm.
The BEAMnrc model of the Linac head components adopted in this work (the target, primary collimator, flattening filter and jaws) are shown in Fig. 1 (Maged Mohammed et al., 2014).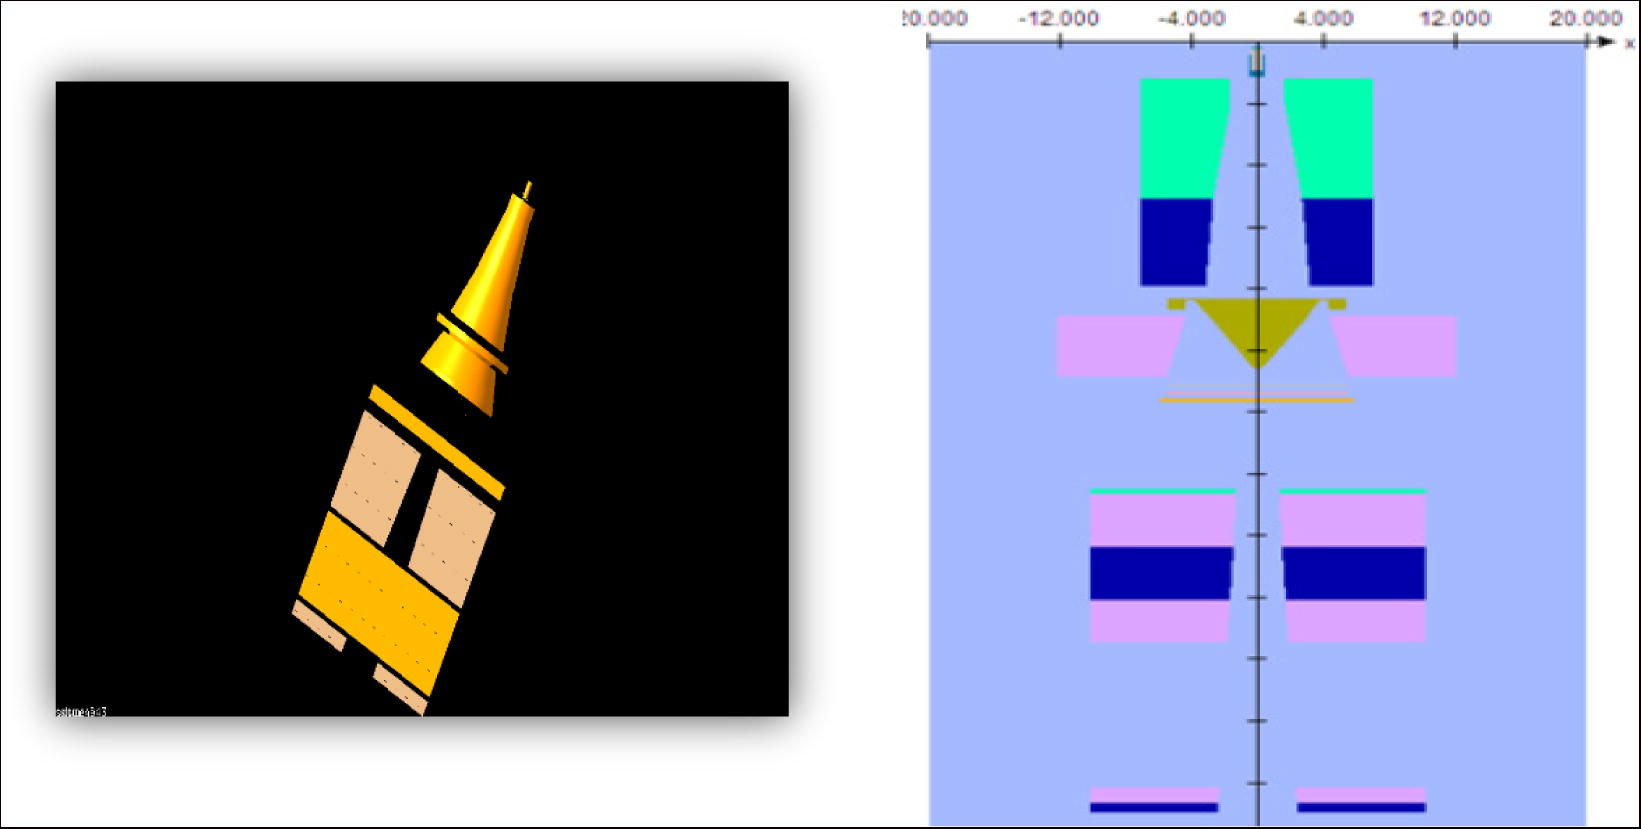
Illustration of the treatment head and the component modules used in the BEAMnrc simulation for Saturne43 of 12 MV photon beam.
The simulations of photon beams in BEAMnrc have been implemented in two steps, the first one consists in simulating the photon beam in the target component only, using ISOURC = 19: Elliptical Beam with Gaussian Distributions in X and Y, to generate a phase space files under the target, that will be used later. In the second step, the phase space files generated under the target will be used as virtual sub-sources of particles. These sub-sources, ISOURC = 21, are placed above the primary collimator to create phase space files under the jaws components at Z = 90 cm ISOURC = 21 source routine allows us to use any phase space file generated at any scoring plane, as a source for subsequent simulations.
The variance reduction parameters employed in this study include: a directional bremsstrahlung splitting (DBS) (with radius = 10, NBRS = 100 and Z = 90 cm), cut-off energy for electrons and photons are 700 keV, 100 keV respectively, ESAVE = 1 MeV (Energy below which electron will be discarded in range rejection) (Mohammed et al., 2016). The phase space technique was used as a variance reduction technique to reduce the time consumed in the simulation. The EGSnrc parameters were set as default. All simulations in BEAMnrc were run for 106 histories.
After simulating the photon beam and generating the phase space files, DOSXYZnrc (Walters et al., 2005) has been used to calculate the dose distribution within Cartesian geometry. The sub-phase space files created by BEAMnrc at 90 cm from the target were used as a source in DOSXYZnrc user code. The sub-phase space was placed directly on the studied phantom surface.
The dose distributions (depth dose and lateral profile) have been calculated in 40 × 40 × 40 cm3 homogeneous water phantom placed at Z = 90 cm from the target. This phantom is divided into uniform small regions (voxels) of 0.5 × 0.5 × 0.5 cm3.
DOSXYZ parameters such as the particle production threshold and transport energies for electron (ECUT) and photon (PCUT) were 700 and 100 keV respectively. Directional bremsstrahlung splitting (DBS) (with radius = 10, NBRS = 100 and Z = 90 cm) was defined for reducing the uncertainty. The particles in each phase space were recycled 10 times in order to achieve a statistical 1σ uncertainty less than 0.4% in all dose points. Default EGSnrc transport parameters are applied in our simulations. The histories’ number depends on the volume of data stored in the phase space file generated from BEAMnrc.
2.2 Mean energy identification
Based on the methodology proposed, depth dose (DD) distributions have been used to adjust the electron beam energy. In this study, the PDD curves calculated along the central axis of water phantom for 10 × 10 cm2 field size are compared with measured data. Our simulations are started by running the nominal energy 12 MeV, and then other energies that have lower and higher values of nominal energy, (from 11.4 MeV to 12.5 MeV) have been tested. In each simulation, the obtained results are compared to experimental data thanks to gamma index criteria (Low et al., 1998). All depth-dose curves were normalized to the dose at depth of 10 cm. Finally, Gamma index results were analyzed in order to choose the optimal mean energy.
2.3 Determination of beam width
Depending on Tzedakis (Tzedakis et al., 2004) and Mihailescu (Mihailescu and Borcia, 2014) studies, the depth-dose curves were unaffected by the radial spread of electron beam. Thus, to investigate the influence of electron beam width on the dose distribution, the lateral dose profile must be considered. In the present work, the beam profiles were calculated at depth of 10 cm within a water phantom for a field size set to 10 × 10 cm2 at 100 cm from the target. Several beam width values, from 0.1 to 3 mm by step of 0.2 mm, were simulated, while the mean energy value was fixed at those selected in the previous step. The lateral dose profiles are normalized to the dose at 10 cm on the central axis. In each simulation, the results obtained are compared with experimental data using gamma index criteria. The best agreement between experimental and simulation curves determines the optimum beam radius.
2.4 Determining the mean angular spread
Mean angular spread parameter of the electron beam was tested, by simulating a range of angles from 0° to 0.7°, to select the optimal divergence value of incident electron. In this step, mean energy and beam width (FWHM) of incident electron were set to 11.8 MeV and 0.15 cm, respectively. Depth dose curves and beam profiles calculated in each simulation were normalized to dose at 10 cm (D10 cm) at central axis.
2.5 Gamma index
In Monte Carlo dosimetry calculation must be compared with experimental data to optimize the beam parameters. Different cost functions have been used to analyze the results. These include ƙα factor, χ2 function, the slope of the difference (SOD), the absolute difference of the penumbra edge point (PEP), the mean absolute error (MAE) (Aljarrah et al., 2006) and Gamma index (Low et al., 1998). In this present paper, gamma index was employed to test the difference between Monte Carlo calculation and experiments results. The tolerance of acceptability was set to 1.5% for calculated dose and 1 mm for the position where we calculate the value of the associated dose.
3 Results and discussion
3.1 Percentage depth dose
Depending on our methodology proposed for tuning the electron beam parameters, dose distribution (PDD and beam profile) has been calculated within water phantom placed at 90 cm from the target for 10 × 10 field size. The first parameter tested is the initial energy (E). 10 pre-set energies from 11.4 to 12.2 MeV by step of 100 keV were carried out, starting by a nominal energy (12 MeV). The radial intensity and energy spread were 0.1 cm FWHM and 0%, respectively. As we mentioned before, each simulation was passed through three stages. Firstly, simulation of the transport of particles by BEAMnrc through treatment head components was done to create phase space file. Secondly, calculation of the energy deposited within water phantom to calculate the dose distribution was done. Finally, the results obtained were compared with measured data using the comparison quantities. Depth dose curves were calculated along the central beam axis and the dose normalized to the dose at D10 (dose at 10 cm). Lateral beam profiles were calculated at a depth of 10 cm and normalized to the dose at central axis. Fig. 2 shows the depth dose curves resulting from 10 energies simulated. The statistical uncertainty associated to depth dose calculation was less than 0.4% for all points.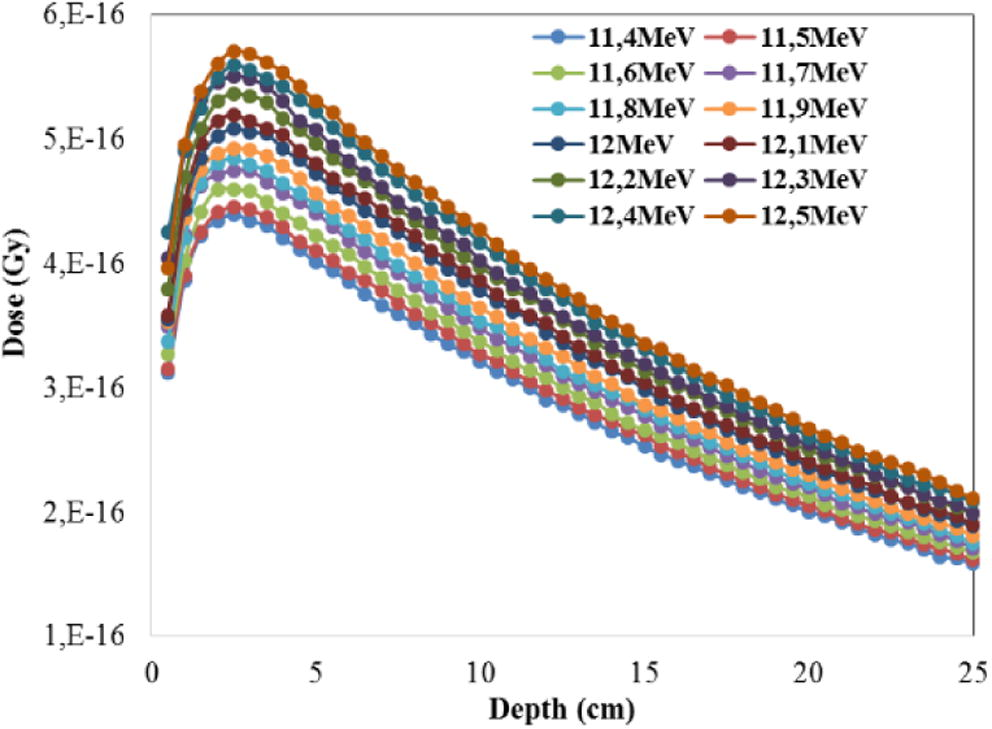
A comparisons of depth dose curves as a function of mean energy.
Fig. 2 shows the influence of mean energy of the initial electron beam on the depth-dose distributions, the curves highlight the sensitivity of the electron beam energy on depth-dose curve. From Fig. 2, it is clear that the absorbed dose increases with energy at all depths including the build-up zone. Similarly, the difference between the different curves increases from the surface to the maximum dose depth. Away from the maximum dose, this gap tends to be reduced in depth. After normalization, the percent depth dose (PDD) distributions for the energies simulated and measured ones are presented in Fig. 3.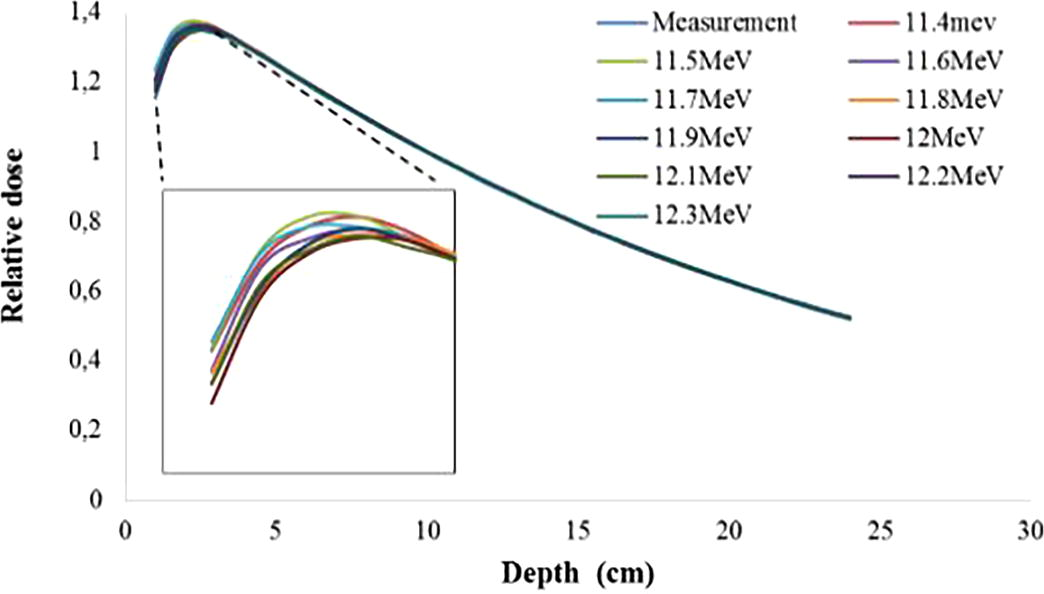
Illustration of PDD curves calculated by BEAMnrc for range energy (11.4–12.3 MeV) and measured one. The inset shows the build-up dose for different electron beam energies.
From Fig. 3, we notice that the surface dose and build-up regions are the most sensitive regions to change the energy of the electron beam, compared to the doses scored at the depth after maximum dose, which tend to be identical for all energies.
On the other hand, the impact of variation of energy on beam dose profile was investigated. It is clear that the flat region dose increases with energy and there is an influence of mean energy on the penumbra region as shown in Fig. 4. In the right part of the figure, we see that the dose in penumbra region increases with energy. The difference is clear when the energy changed by step more than 100 keV.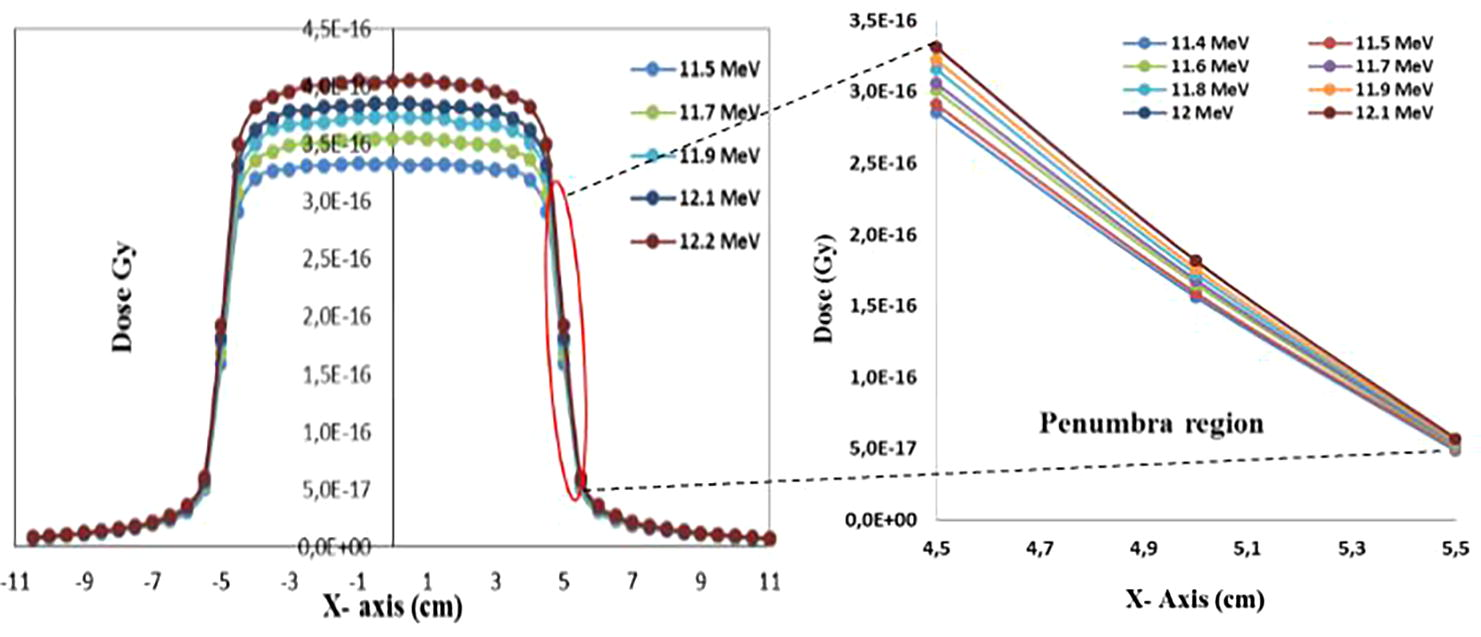
Lateral dose profiles as a function of the mean energy of electron beam distributions. The inset shows the variation of dose at penumbra region for different energy simulated.
To determine the best mean energy of the mono-energetic electron beam, we must compare each calculated curve to the measured one. Thus, our conclusion will be deduced according to three criteria of comparison defined above.
Following figures illustrate some examples of comparison of percent depth dose and beam dose profiles calculated by MC with measured data and gamma index tests.
Results obtained from comparing our calculations with experimental data by using gamma index are summarized in the following table, and two other criteria the depth of maximum dose ZDmax and the quality index (IQ) were added.
Based on results tabulated in Table 1 and Figs. 3–5, with the aim of identifying the appropriate mean energy of electron beam, we can make the following observations:
-
The influence of mean energy of the electron beam on the dose distributions is evident. We noticed that the depth dose curves are sensitive with variation the mean energy. The difference of depth dose curves is noticeable when the energy changes by step more than 100 keV. Generally, the dose along central axis increases with mean energy. our results obtained are consistent with previous studies (Aljarrah et al., 2006; Almberg et al., 2012; Chang et al., 2014; Jaafar, 2014; Keall et al., 2003; Mariam, 2012; Mesbahi et al., 2006; Sheikh-Bagheri and Rogers, 2002; Tzedakis et al., 2004; Verhaegen and Seuntjens, 2003) and others. They concluded that calculated depth dose in water is sensitive to the primary electron energy.
-
The influence of mean energy on beam profiles is measured at the horns of lateral dose profiles, because the horns are a good indicator for the primary electron parameters (Verhaegen and Seuntjens, 2003). So, based on the results and the figures presented, we can conclude that the beam dose profiles are less sensitive to such variations in the electron beam energy. (Sheikh-Bagheri and Rogers, 2002), they found that the beam profiles are to be very sensitive to the mean energy of the electron beam when evaluating the sensitivity of electron beam parameters of nine photon beams from three major manufacturers of medical linear accelerators (Varian, Elekta, and Siemens) Tzedakis et al., 2004). The mean energy was found to affect both dose-profile and depth-dose curves.
-
To select the optimal mean energy, since the depth dose distribution is more affected by the energy of primary electrons, based on Table 1, we used the gamma index results of percent depth dose. Firstly, we eliminate the energies the gamma index of which is less than 97%. So, the remaining energies are 11.8 and 11.9; to select one from them, gamma index and quality index are used. Finally, the optimal energy which gives the best agreement with measured data is 11.8 MeV.
| Energy (MeV) | PDD | Beam Profile | IQ (D20/D10) | Dmax (cm) | ||
|---|---|---|---|---|---|---|
| GI < 1 | GI < 0.5 | GI < 1 | GI < 0.5 | Measures = 0.6282 | Measures = 2.5 | |
| 11.4 | 91.5% | 89.4% | 91.1% | 91.1% | 0.6284 | 2.5 |
| 11.5 | 91.5% | 91.5% | 91% | 88.4% | 0.6264 | 2.5 |
| 11.6 | 95.7% | 93.6% | 91% | 91% | 0.6286 | 2.5 |
| 11.7 | 95.9% | 93.9% | 91% | 77.8% | 0.6278 | 2 |
| 11.8 | 97.9% | 97.9% | 91.1% | 84.7% | 0.6283 | 2.5 |
| 11.9 | 97.9% | 95.7% | 84.4% | 69% | 0.6297 | 2.5 |
| 12 | 95.7% | 95.7% | 84.4% | 73.3% | 0.6290 | 2.5 |
| 12.1 | 95.7% | 93.6% | 84.2% | 73.4% | 0.6293 | 2.5 |
| 12.2 | 95.7% | 91.5% | 91.3% | 73.5% | 0.6295 | 2.5 |
| 12.3 | 95.7% | 93.6% | 77.8% | 71.1 | 0.6310 | 2.5 |
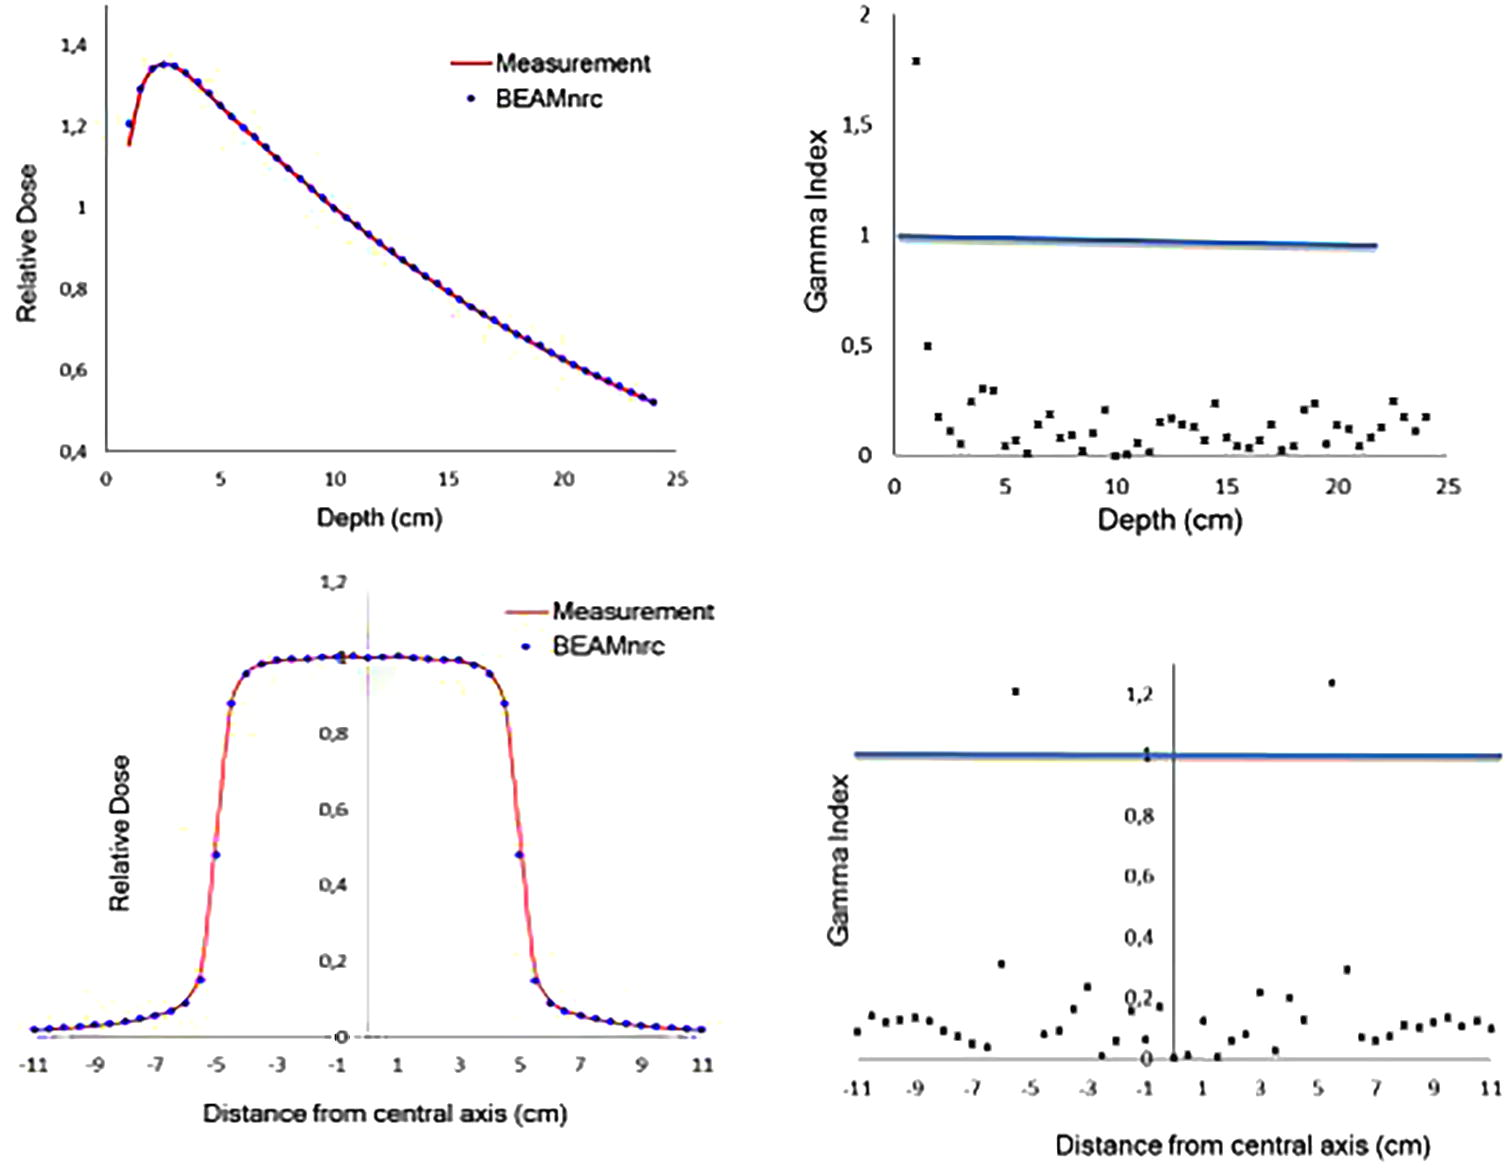
- Comparison of relative depth dose and beam profiles calculated by BEAMnrc and measured one and Gamma Index tests.
3.2 Determining the beam width distribution (spot size)
To select the optimal width of electron beam, dose distributions have been calculated for different FWHM values and the initial energy was set to that obtained in the first step (E = 11.8 MeV). The distribution angular of electron was set to 0°. The dose distributions which are depth dose and lateral dose profile were calculated for a square filed of 10 × 10 cm2 defined at 100 cm from the target. Several beam width values (FWHM), from 0.1 to 2.5 mm, were simulated. The simulation results are shown in Fig. 6.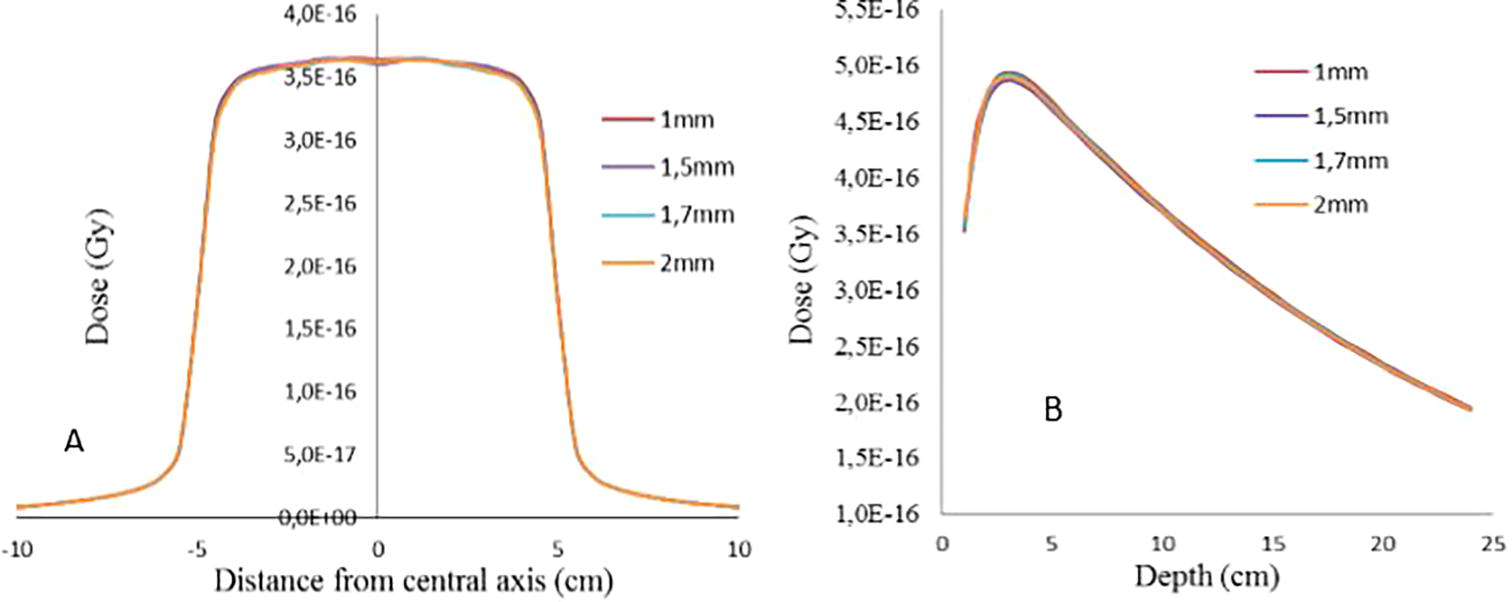
Illustration of A) beam dose profiles and B) depth dose curves calculated by BEAMnrc for radius from 0.05 to 1.7 mm for field size of 10 × 10 cm2.
For more details about the impact of electron beam width on dose distribution, PDD curves and lateral dose profiles were normalized to dose at 10 cm and illustrated in the following figure.
PDD curves and beam profiles calculated by BEAMnrc code are compared against measured data to find the best matching with experimental using gamma index criteria. Gamma index numerical results for each comparison are summarized in Table 2. Other two quantities of comparison as quality index and depth of maximum dose are calculated and tabulated in Table 2.
FWHM (mm)
PDD
Beam Profile
IQ(D20/D10)
ZDmax (cm)
GI < 1
GI < 0.5
GI < 1
GI < 0.5
Measures = 0.6282
Measures = 2.5
0.5
95.7%
95.7%
91%
87%
0.6302
2.5
1
97.9%
97.9%
91.1%
85.7%
0.6284
2.5
1.2
95.7%
95.7%
91%
80%
0.6284
2.5
1.5
97.9%
97.9%
91.6%
87.3%
0.6283
2.5
1.7
97.9%
97.9%
87%
78%
0.6280
2.5
2
97.9%
95.7%
87%
77%
0.6280
2.5
2.5
97.9%
95.7%
83%
70%
0.6275
2.5
As mentioned above, the most appropriate region in which we can determine the effect of the initial electron beam parameters on dose distribution are the horns in beam profiles and build- up for PDD curves. So, based on the figures and Table 2, we observe that the beam width of electron beam has a weak influence on the beam dose profile and central-axis relative depth-dose for field size of 10 × 10 cm2. It is in accordance with the study of (Tzedakis et al., 2004). Also, (Mesbahi et al., 2006) found that large field beam profiles are more sensitive to electron beam width than 10 × 10 cm2 field. In contrast, (Blazy-Aubignac, 2007) showed that the focal spot with a width at half height of 0.5 mm of Gaussian distribution of electron beam offers a better result for linear accelerator SATURNE43. Our findings are compared with the recent studies of (Jaafar, 2014; Mariam, 2012) which were performed using two different MC codes Geant4 and MCNP, respectively, for simulating SATURNE43 Linac head. They found that the width of electron beam is sensitive on dose distribution for 10 × 10 cm2 field size. From Figs. 6 and 7 and according to numerical results, for depth dose curves, the surface dose increases by 2.5% for each 0.3 mm of beam width due to the augmentation of secondary electrons created at the surface of phantom. So, we recommended to use large field size (30 × 30 cm2) for tuning the electron beam width.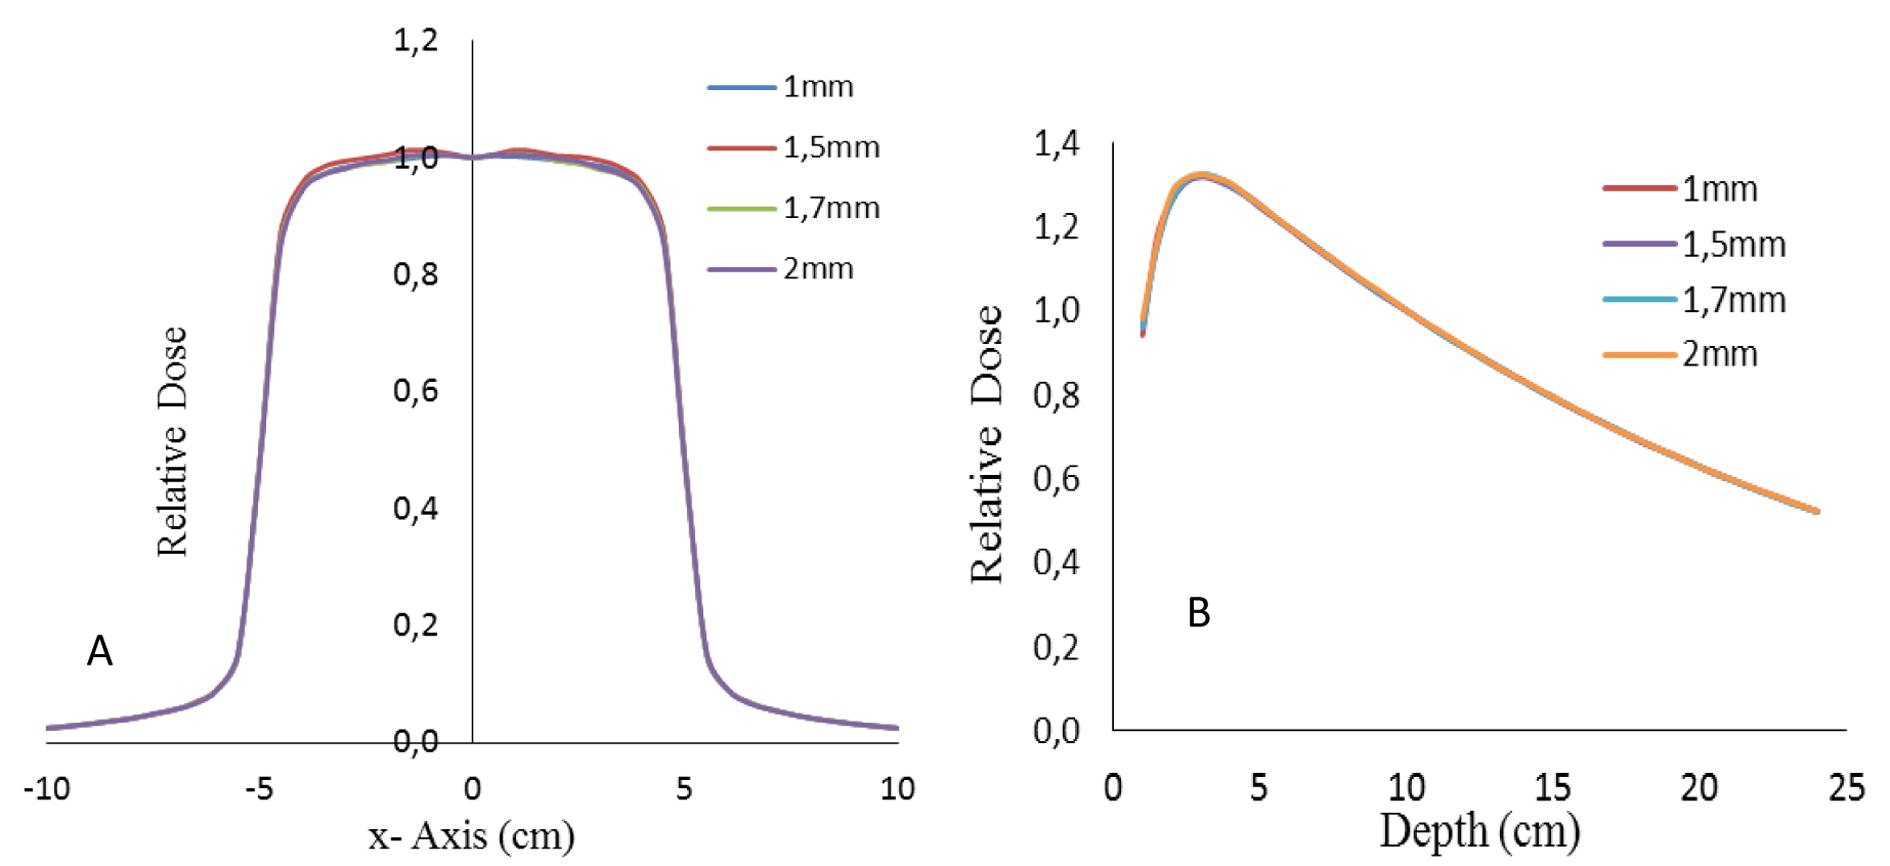
Illustration of A) beam dose profiles and B) percent depth dose curves calculated by BEAMnrc for radius from 1 to 1.7 mm for field size of 10 × 10 cm2.
Finally, Depending on numerical results listed in the Table 2, good agreement between our calculations with measured one is achieved with width of 1.5 mm. This value is very close to that obtained by (Mariam, 2012) with difference of 0.2 mm and with 0.32 mm from the recent study of (Jaafar, 2014). So the best combination of mean energy and radial intensity of electron beam was found for 11.8 MeV and 1.5 mm, respectively.
3.3 Determining the mean angular spread
Energy spread or energy distribution parameter of the electron beam was tested, by simulating a range of angles from 0° to 0.7°, to select the optimal divergence value of incident electron. In this step, mean energy and beam width (FWHM) of incident electron were set to 11.8 MeV and 0.15 cm, respectively. Depth dose curves and beam profiles calculated in each simulation were normalized to dose at 10 cm (D10 cm) at central axis, and presented in Fig. 8.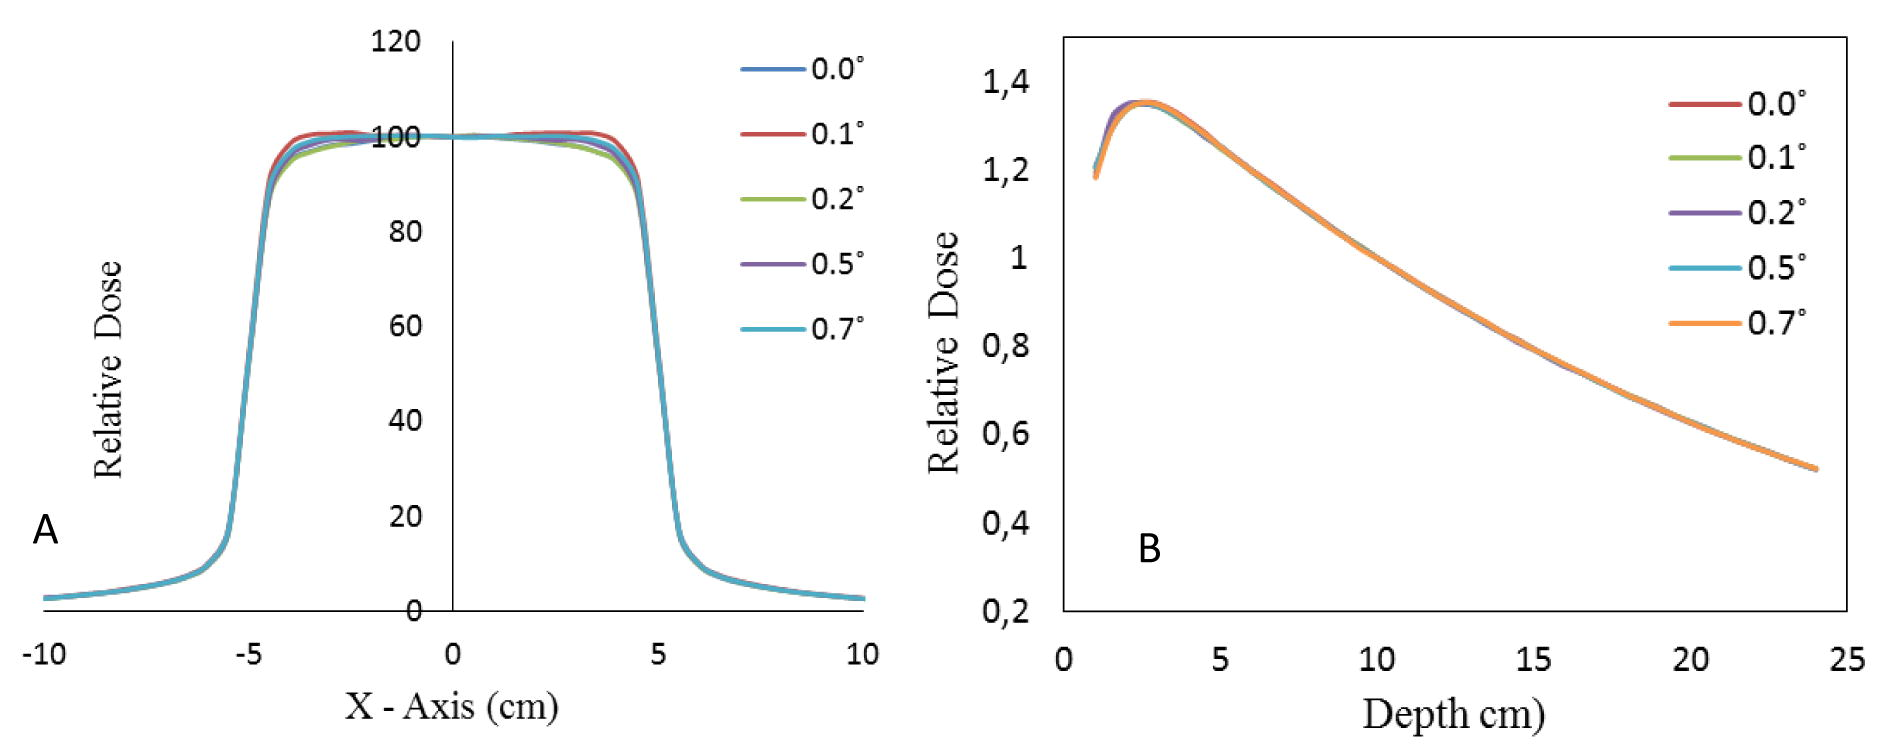
Comparisons of dose distribution A) beam profiles and B) percent depth dose as a function of mean angular spread of electron beam.
Percent depth dose and beam dose profile curves simulated are compared using gamma index. The numerical gamma index results, quality index and depth of maximum dose are tabulated in Table 3
Mean angular spread
PDD
Beam Profile
IQ (D20/D10)
ZDmax (cm)
GI < 1
GI < 0.5
GI < 1
GI < 0.5
Measures = 0.6282
Measures = 2.5
0.0°
97.7%
97.9%
90%
86.7%
0.6301
2.5
0.1°
97.9%
97.9%
86.7%
73%
0.6289
2.5
0.2°
95.7%
94%
86.7%
77%
0.6265
2.5
0.5°
97.9%
97.9%
91.6%
87%
0.6286
2.5
0.7°
97.9%
97.9%
91%
83%
0.6276
2.5
Based on the results presented in Table 3, A good agreement between calculated and measured dose distribution was found when the angle of divergence of electron beam is 0.5°. Fig. 8 highlights the insensitivity of the electron beam divergence on the depth-dose curve. In the same Figure, the influence of the mean energy spread on beam profiles is presented, it’s clear that the horns of beam profiles are sensitive with change in the mean angular spread of electron beam. Tzedakis et al. (2004) found that the mean energy spread doesn’t influence on depth dose and beam profile curves for two different field sizes 10 × 10 and 35 × 35 cm2. We found that energy spread is insensitive on penumbra dose region, which is consistent with the findings of (Almberg et al., 2012). Sheikh-Bagheri and Rogers (2002) found that the relative depth-dose values show some sensitivity to the angular spread of electron beam, especially at larger depths. We observed a minor influence on the build region and this influence is fading from the electronic equilibrium. We concluded that mean angular spread is sensitive to lateral dose profiles and doesn’t impact depth dose curve. The influence of energy spread on beam profile is referred as the distance between source of electron and the target, for SATURNE43 there is about 1 cm.
Finally; a full phase space file simulated and the dose distributions (depth dose and beam profile) calculated for 10 × 10 cm2 field size when the initial electron beams are set to the best combinations (E = 11.8 MeV, R = 1.7 mm and angle = 0.5°). PDD curves and beam profiles calculated and measured are illustrated in Fig. 9.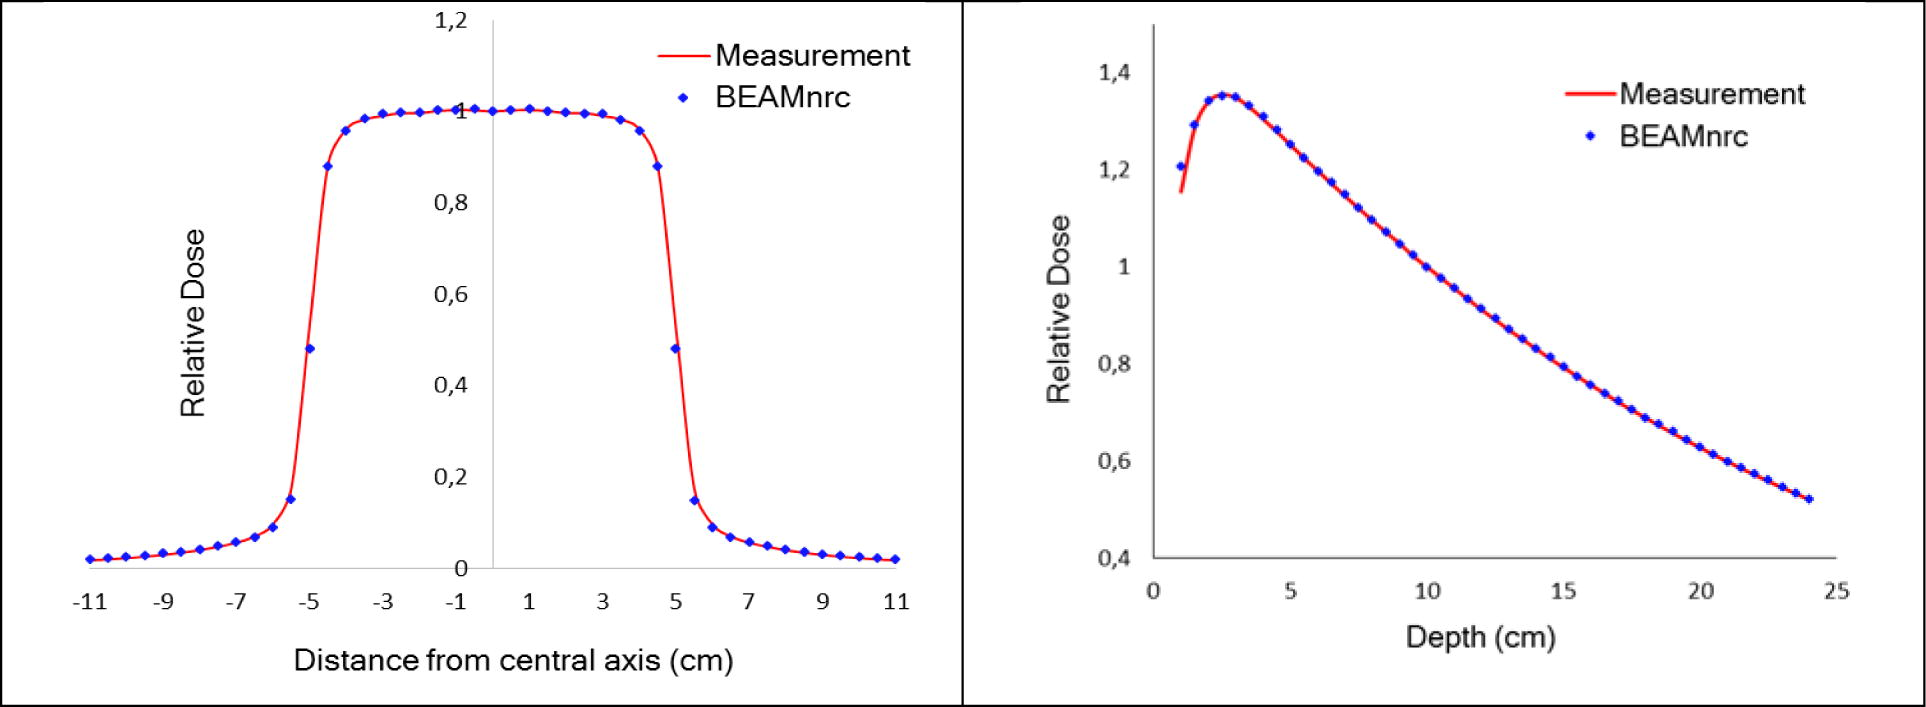
Beam profiles and percent depth dose curves calculated with optimal initial beam parameters compared with measured dose.
Fig. 9, shows the simulated and measured profiles and percent depth dose curves of 12 MV photon beam for square field of 10 × 10 cm2. Unfortunately, the manufacturer did not provide us with the experimental data of other fields in order to verify whether the results obtained in 10 × 10 cm2 field size can be circulated to all fields.
4 Conclusion
Monte Carlo based – BEAMnrc (Rogers et al., 2017) user code is an accurate tool for dosimetric calculations in radiation therapy. In this current work, the head of Saturne43 linear accelerator of 12 MV photon beams for a configuration of 10 × 10 cm2 field size has been modeled and the three parameters of the initial electron beam have been investigated to validate BEAMnrc model, as they represent the major characteristics of electron beam incident on the target. Dose distributions (beam profile and percent depth dose) have been calculated in a homogenous water phantom using DOSXYZnrc user code. A good agreement between measured and calculated dose was obtained when the mean energy, mean angular spread and spot size were 11.8 MeV, 0.5° and 1 mm, respectively. Depending on the obtained results for 10 × 10 cm2 field size, the depth dose and beam profile curves are very sensitive to the mean energy and insensitive to beam width. So, we recommended to use large field size for tuning beam width. Also the depth dose insensitive to mean angular spread and beam profile is sensitive. Using phase space file as a variance reduction technique leads to improve the calculation time.
References
- Determination of the initial beam parameters in Monte Carlo linac simulation. Med. Phys.. 2006;33:850.
- [CrossRef] [Google Scholar]
- Monte Carlo linear accelerator simulation of megavoltage photon beams: independent determination of initial beam parameters. Med. Phys.. 2012;39:40-47.
- [CrossRef] [Google Scholar]
- Blazy-Aubignac, L., 2007. Contrôle Qualité des systémes de planification dosimétrique des traitements en radiothérapie externe au moyen du code Monte-Carlo Penelope. Université Toulouse III-Paul Sabatier.
- Determining optimization of the initial parameters in Monte Carlo simulation for linear accelerator radiotherapy. Radiat. Phys. Chem.. 2014;95:161-165.
- [CrossRef] [Google Scholar]
- Dosimetry of small bone joint calculated by the analytical anisotropic algorithm: a Monte Carlo evaluation using the EGSnrc. J. Appl. Clin. Med. Phys. 2013:15.
- [Google Scholar]
- Validation of Monte Carlo Geant4 code for a 6 MV Varian linac. J. King Saud Univ. Sci.. 2017;29:106-113.
- [CrossRef] [Google Scholar]
- Jaafar, E.B., 2014. Mise en œuvre de la plate-forme de Monte-Carlo Geant4 Application aux accélérateurs médicaux Linacs.
- EGSnrcMP: the multi-platform environment for EGSnrc. Natl. Res. Counc. Can. Ott. 2006
- [Google Scholar]
- Determining the incident electron fluence for Monte Carlo-based photon treatment planning using a standard measured data set. Med. Phys.. 2003;30:574.
- [CrossRef] [Google Scholar]
- A technique for the quantitative evaluation of dose distributions. Med. Phys.. 1998;25:656-661.
- [Google Scholar]
- Implementation of the EGSnrc/BEAMnrc Monte Carlo code-Application to medical accelerator SATURNE43. Int. J. Innov. Appl. Stud.. 2014;6:635.
- [Google Scholar]
- Mariam, Z., 2012. Analyse Monte Carlo de la qualité des faisceaux des accélérateurs linéaires médicaux pour la planification du traitement en radiothérapie.
- Development and commissioning of a Monte Carlo photon beam model for Varian Clinac 2100EX linear accelerator. Appl. Radiat. Isot.. 2006;64:656-662.
- [CrossRef] [Google Scholar]
- Monte Carlo simulation of the electron beams produced by a linear accelerator for intra-operative radiation therapy. Romanian Rep. Phys.. 2014;66:61-74.
- [Google Scholar]
- Evaluation of variance reduction techniques in BEAMnrc Monte Carlo simulation to improve the computing efficiency. J. Radiat. Res. Appl. Sci.. 2016;9:424-430.
- [CrossRef] [Google Scholar]
- Rogers, D.W.O., Walters, B., Kawrakow, I., et al., 2001. BEAMnrc users manual. NRC Rep. PIRS 509.
- Sensitivity of megavoltage photon beam Monte Carlo simulations to electron beam and other parameters. Med. Phys.. 2002;29:379.
- [CrossRef] [Google Scholar]
- Influence of initial electron beam parameters on Monte Carlo calculated absorbed dose distributions for radiotherapy photon beams. Med. Phys.. 2004;31:907.
- [CrossRef] [Google Scholar]
- Monte Carlo modelling of external radiotherapy photon beams. Phys. Med. Biol.. 2003;48:R107.
- [Google Scholar]
- Walters, B., Kawrakow, I., Rogers, D.W.O., 2005. DOSXYZnrc users manual. NRC Rep. PIRS 794.


