Translate this page into:
Synthesis, characterization and visible light photocatalytic activity of carbon and iron modified ZnO
⁎Corresponding author. Fax: +91 22 22816750. y_malghe@rediffmail.com (Yuvraj S. Malghe)
-
Received: ,
Accepted: ,
This article was originally published by Elsevier and was migrated to Scientific Scholar after the change of Publisher.
Peer review under responsibility of King Saud University.
Abstract
In the present work visible light active C and Fe modified ZnO photocatalysts were prepared using microemulsion method. The obtained samples were characterized by TG-DTA, XRD, FT-IR, XPS, SEM, EDX, TEM, PL and UV–visible spectroscopy. XRD study reveals that C and Fe modified ZnO have hexagonal wurtzite structure. As the concentration of Fe changes, morphology of ZnO also changes from rod like shape to spherical shape. It was found that C, Fe co-doping improves the photoabsorption capacity of ZnO in visible region (red shift is observed). XPS study reveals that C and Fe are successfully doped into ZnO lattice with Iron in Fe (III) state. PL quenching for C, Fe co-doped ZnO photocatalysts indicates lower recombination rate of excited electrons/holes. As compared to undoped and C doped ZnO, and Fe doped ZnO, the C, Fe co-doped ZnO photocatalysts exhibited much higher photocatalytic activity for 2,4,6-trichlorophenol (TCP) degradation under visible light irradiation. The optimal ratio of Fe is found to be 2.07 wt%. Stability of photocatalyst was investigated up to fourth cycle and is found to be very stable.
Keywords
2,4,6-Trichlorophenol
Photocatalysis
Nanorods
Visible light
Zinc oxide
1 Introduction
Rapid industrial development in recent years leads to release large number of toxic pollutants into the environment which are hazardous to human health. Among these pollutants, phenolic compounds are very toxic, hazardous and common in industrial waste water originating from coal conversion and petroleum refining industries. Chlorophenols are used as herbicides, pesticides and wood preservatives and at natural conditions they may transform to more hazardous compounds (Anisuzzaman et al., 2015; Skurlatov et al., 1997; Park et al., 2002). The presence of 2,4,6-trichlorophenol (TCP) leads to serious impact on water quality. It shows adverse effects on the human nervous system and cause many health disorders (Bashiri and Rafiee; Vinita et al., 2010). Therefore, it is necessary to find innovative and cost-effective methods for the safe and complete destruction of these chlorinated compounds. Several traditional techniques like activated carbon adsorption, biological treatment, chemical oxidation, etc are used to remove these compounds from waste water. But these techniques are having certain drawbacks. For example, activated carbon adsorption technique based on phase transfer and does not decompose the pollutant. In biological treatment technique microbes are used to degrade chlorophenols. However, this technique is inefficient as chlorinated phenols are resistant to biodegradation, within acceptable time period and tends to accumulate in sediments. Chemical oxidation technique is unable to oxidize all organic pollutants. Heterogeneous photocatalysis is widely studied method for the degradation of pollutants due to its low cost and potential to remove organic pollutants from waste water. Major advantage of this method is, complete degradation of organics into non hazardous CO2 and H2O. Titanium dioxide (TiO2) based materials are widely used as promising photocatalytic material (Jafari et al., 2016; Lavand and Malghe, 2015a; Khan and Kim, 2009). ZnO has been reported as a suitable alternative to TiO2 in view of the fact that its photodegradation mechanism is similar to that of TiO2. In the past two decades, ZnO has attracted much attention with respect to the degradation of various pollutants due to its high photosensitivity, good optical properties, non-toxic, stability and wide band gap. ZnO is reflected as a low cost alternative photocatalyst to TiO2 for degradation of organics in aqueous solutions. Main advantage of ZnO is that it can absorb a larger fraction of the solar spectrum than TiO2 (Zaier et al., 2015; Hong et al., 2008), and hence ZnO photocatalyst is considered more suitable for photocatalytic degradation in the presence of sunlight (Pawar et al., 2013; Lavand and Malghe, 2015b). However, it can be activated using UV light only, which contributes approximately 5% of solar spectrum (Iqbal et al., 2016). Hence, many attempts have been dedicated to prepare visible light active ZnO photocatalyst. It can be achieved by doping of ZnO with transition metals and anionic non-metals. Among them, doping of ZnO with transition metal cations was reported as a good tool to improve photocatalytic properties for enhancement of visible light response (Bahsi and Oral, 2007). Fe doped ZnO nanocrystalline particles showed better photocatalytic activities than pure ZnO under visible light in many reports. It was believed that Fe(III) cations could act as shallow traps in the lattice of photocatalyst, which reduced the recombination rate of electron/hole. Best photocatalytic properties could be achieved upon doping iron at a relatively weak level. Additionally, doping with nonmetallic species, such as N, C, S, P and halogen atoms also caused the photosensitization of ZnO in the visible light region. Among various non-metal modified ZnO, carbon doped ZnO has been reported as a kind of promising photocatalyst (Lavand and Malghe, 2015c). Cho and co-workers reported that C doped ZnO prepared using vitamin-C was able to photodegrade Orange-II under visible light. Zhang et al. found C doped ZnO nanoparticles prepared by facile one pot synthesis exhibited high photocatalytic activity for degradation of methylene blue under visible light illumination. Haibo et al. synthesized C-doped ZnO by calcinations of powders prepared by hydrothermal reaction of zinc gluconate and this C-doped ZnO photocatalyst showed a good visible light activity for RhB decoloration. Carbon doping could create new energy state in the band gap as well as oxygen vacancies in the bulk of ZnO, which could be responsible for the visible photoactivity of C-doped ZnO. More recently, the simultaneous doping of two kinds of atoms into ZnO has attracted considerable interest, since it could result in a higher photocatalytic activity and peculiar characteristics compared with single element doping into ZnO. Hence, in the present work C and Fe co-doped ZnO nanostructures were synthesized using microemulsion method. Synthesized material was characterized using various characterization techniques and its visible light photocatalytic activity was investigated for the degradation of TCP.
2 Materials and methods
2.1 Chemicals
2,4,6-Trichlorophenol (TCP) used in the present study was procured from SD fine Chemicals Ltd. Mumbai, India and used without any further purification. Zinc nitrate (Zn(NO3)2. 6H2O) was obtained from Merck Chemicals, Mumbai, India and used as zinc source. AR grade cyclohexane, n-butanol, N,N,N-cetyl trimethyl ammonium bromide (CTAB), acetone, ferric nitrate (Fe(NO3)3.9H2O), sodium hydroxide (NaOH) and ethanol were procured from SD Fine Chemicals Ltd. Mumbai, India and used without further purification.
2.2 Catalyst synthesis
Pure ZnO and C as well as C, Fe co-doped ZnO photocatalysts were prepared by microemulsion method. The detailed procedures are as follows: zinc nitrate (1 mol/L, 57.6 mL) and stoichiometric amount of ferric nitrate was added to a mixture of cyclohexane (71 mL), CTAB (11.8 g) and n-butanol (16 mL) with constant stirring for 20 min to obtain microemulsion A. Sodium hydroxide (2 mol/L, 57.6 mL), cyclohexane (71 mL), and CTAB (11.8 g) were mixed with n-butanol (16 mL) with stirring for 30 min to obtain microemulsion B. Microemulsion B was added drop wise to microemulsion A with constant stirring for 30 min. The resultant mixture was transferred to 250 mL stainless steel autoclave (with Teflon inner liner) and kept in an oven at 150 °C for 2 h. After, it was cooled to room temperature and the residue obtained was separated using filtration, it was washed several times with ethanol and water and dried in an oven at 40 °C. The product obtained was used as a precursor. This precursor was calcined in furnace at 300 °C for 2 h to get C, Fe co-doped ZnO. The iron doping concentration was chosen as 0.5, 1.0, 2.0, 3.0 and 5, which was the mole percentage of Fe(III) in the theoretical ZnO powder. C doped and pure ZnO were prepared using same method. During this preparation microemulsion A was prepared without adding ferric nitrate. Precursor obtained was calcined at 300 and 500 °C gave C doped and Pure ZnO respectively.
2.3 Characterization methods
Simultaneous TG and DTA curves of C, Fe co-doped ZnO precursor were recorded by heating 8.87 mg sample in nitrogen atmosphere with a constant heating rate 10 °C min−1 using Rigaku TG-DTA system (Model-Thermo Plus TG8120). X-ray diffraction patterns (XRD) of the precursor calcined at 300 °C were recorded using X-ray diffractometer (Rigaku, Model-Miniflex II). FT-IR spectra of precursor and the precursor calcined at 300 °C were recorded using FT-IR spectrophotometer (Perkin-Elmer). X-ray photoelectron spectrum (XPS) was recorded with PHI VersaProbe-II photoelectron spectroscope (Physical Electronics, USA) with Al Ka radiation. Surface morphology and qualitative elemental analysis of the synthesized compounds were carried out using scanning electron microscope (SEM) and energy dispersive X-ray spectroscopy (EDX) (ZEISS-ULTRA-55). TEM images of pure and doped ZnO powder prepared in the present work were recorded using transmission electron microscope (Philips, CM200). UV–visible spectrophotometer was used to estimate the band gap energy of synthesized compounds. Reflectance spectra of a compound were recorded in the wavelength range 200–800 nm using Shimadzu (Model-1800) UV–visible spectrophotometer. Information obtained from the spectra was used to estimate the band gap energy. Photoluminescence spectra of samples were recorded at room temperature using Fluorescence spectrophotometer (Perkin Elmer-LS-55) with an excitation wavelength of 325 nm.
2.4 Photocatalytic activity study
Photocatalytic activity of nanosized pure/C doped/C, Fe co-doped ZnO was tested for degradation of TCP solution. Reaction suspension was prepared by adding 0.1 g photocatalyst in 100 mL (20 mg L−1) TCP solution. This aqueous suspension was stirred in the dark for 30 min to attain adsorption-desorption equilibrium. After, the solution was irradiated with visible light. Visible light irradiation was carried out in a photo reactor using a compact fluorescent lamp (65 W, λ > 420 nm, Philips, Mumbai). Temperature of test solution was maintained constant throughout the experiment by circulating water around the solution. Amount of TCP was estimated by sampling out 5 mL of aliquot solution at regular time intervals. The catalyst was first separated by centrifugation, then filtered through 45 μm Millipore membrane filter and the concentration of TCP in the supernatant solution was estimated using UV–visible spectrum recorded in the wavelength range 200–800 nm. Amount of TCP in the test solution during the photocatalytic degradation process was also evaluated using HPLC technique. For this study HPLC (HPLC; 1200, Agilent) equipped with a Zorbax C-18 column (250 mm × 4.6 mm × 5 μm) with a diode array detector was used. Mobile phase used to record the chromatogram is a mixture of acetonitrile and 1% acetic acid solution in a ratio of 80:20. Injection volume of the sample used and flow rate of mobile phase are 20 μL and 1.0 mLmin−1 respectively.
2.5 Hydroxyl (•OH) radical detection
Terephthalic acid (TA) was used as a probe molecule to study hydroxyl (•OH) radicals produced after irradiation of visible light over C, Fe co-doped ZnO nanoparticles. TA reacts with •OH radicals to generate highly fluorescent 2-hydroxyterpthalic acid (TAOH). It gives absorption maximum at 430 nm. TA solution of 0.25 mmol L−1 was prepared by dissolving TA acid in NaOH solution (1.0 mmol L−1). To the above solution 0.5 g L−1 C, Fe co-doped ZnO was dispersed with constant stirring. The mixed solution was irradiated with 65 W compact fluorescent lamp. The reacted solution was centrifuged and used for PL measurement with an excitation wavelength of 315 nm.
3 Results and discussion
3.1 TG and DTA study
Simultaneous TG and DTA curves of the C, Fe (3.01, 2.07 wt%) co-doped ZnO precursor were recorded in nitrogen atmosphere and are presented in Fig. 1. TG curve shows that the mass of precursor decreases up to 400 °C and 18.21% mass loss is observed between room temperature to 400 °C. Above this temperature no mass loss is observed. DTA curve shows first endothermic peak near 102 °C which is due to loss of free adsorbed water and second endothermic peak near 158 °C is due to evaporation of solvents cylcohexane and n-butanol. Exothermic peak near 221 °C is due to decomposition of the surfactant and residual OH group. TG and DTA curves show that precursor gives final product ZnO above 500 °C. Beyond 300 °C, carbon oxidation takes place and carbon is replaced by oxygen. In order to obtain doped carbon and to avoid complete replacement of carbon by oxygen we choose calcinations temperature 300 °C.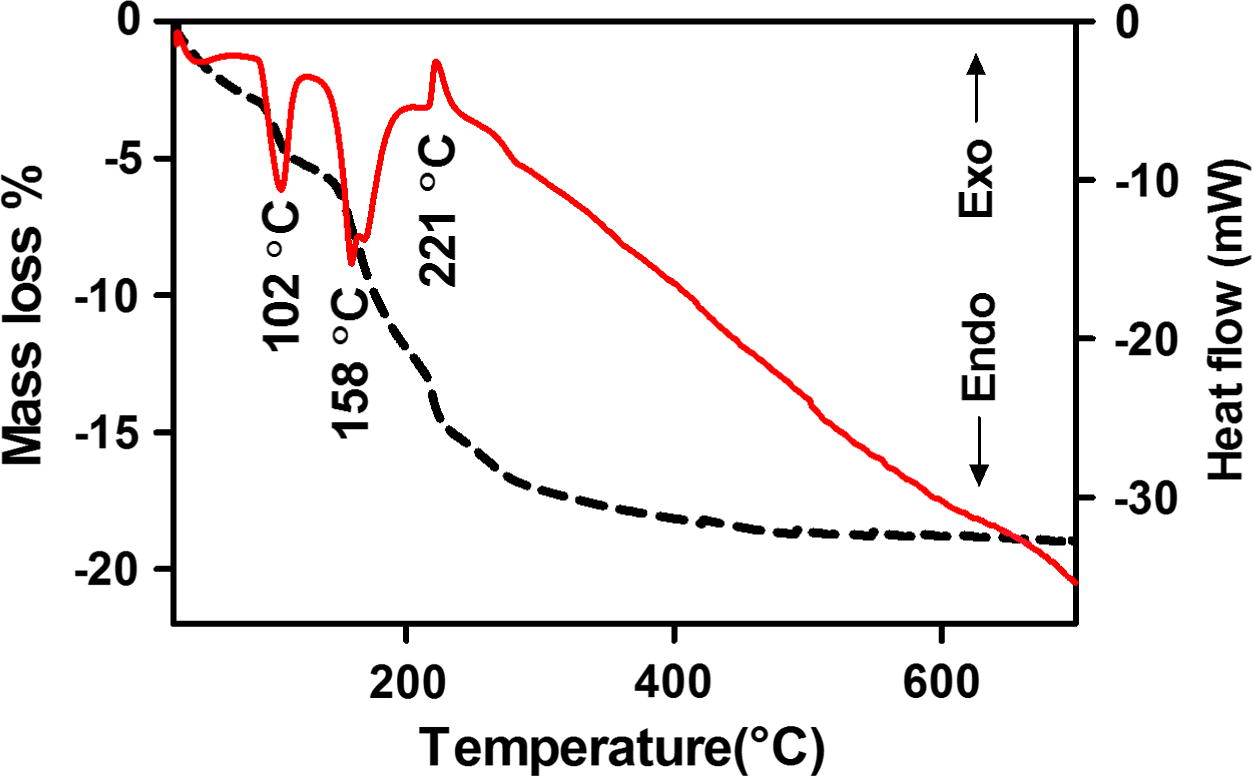
TG and DTA curves of C, Fe (3.01, 2.07 wt%) co-doped ZnO precursor in flowing nitrogen.
3.2 X-ray diffraction study
XRD patterns of C, Fe co-doped ZnO precursors (a–f = 0.0, 0.47, 1.08, 2.07, 3.04, 4.97 wt% of Fe) heated at 300 °C for 2 h were recorded and are presented in Fig. 2. XRD peaks indexed as (1 0 0), (0 0 2), (1 0 1), (1 0 2), (1 1 0), (1 0 3), (2 0 0), (1 1 2), (2 0 1), (0 0 4), (2 0 2) are matches with wurtzite phase of ZnO (JCPDS card No. 36-1451). Diffraction patterns of C, Fe co-doped ZnO do not show any peak indicating the presence of secondary phase such as Fe or Fe2O3. This demonstrates that Fe ion is well incorporated into the lattice sites of ZnO during synthesis or may be due to a small concentration of Fe used. Instead slight peak shift is observed towards lower angles (inset), which is usually assigned for successful doping of C and Fe ion in ZnO matrix (Panigrahy et al., 2012; Iqbal et al., 2014; Kumar et al., 2014). Small variation in lattice parameters induced by Fe doping is observed. Rieteveld refinement calculations obtained for lattice parameters are presented in Table 1. As Fe concentration increases, a- and c-axis lattice spacing decreases linearly which indicates that Zn ions are substituted by Fe ions. Fig. 2 shows that the width of all peaks increases with an increase in Fe concentration, which is due to change in grain size. This phenomenon can be attributed to difference in size of ionic radii of Fe3+ (0.067 nm) and Zn2+ (0.083 nm).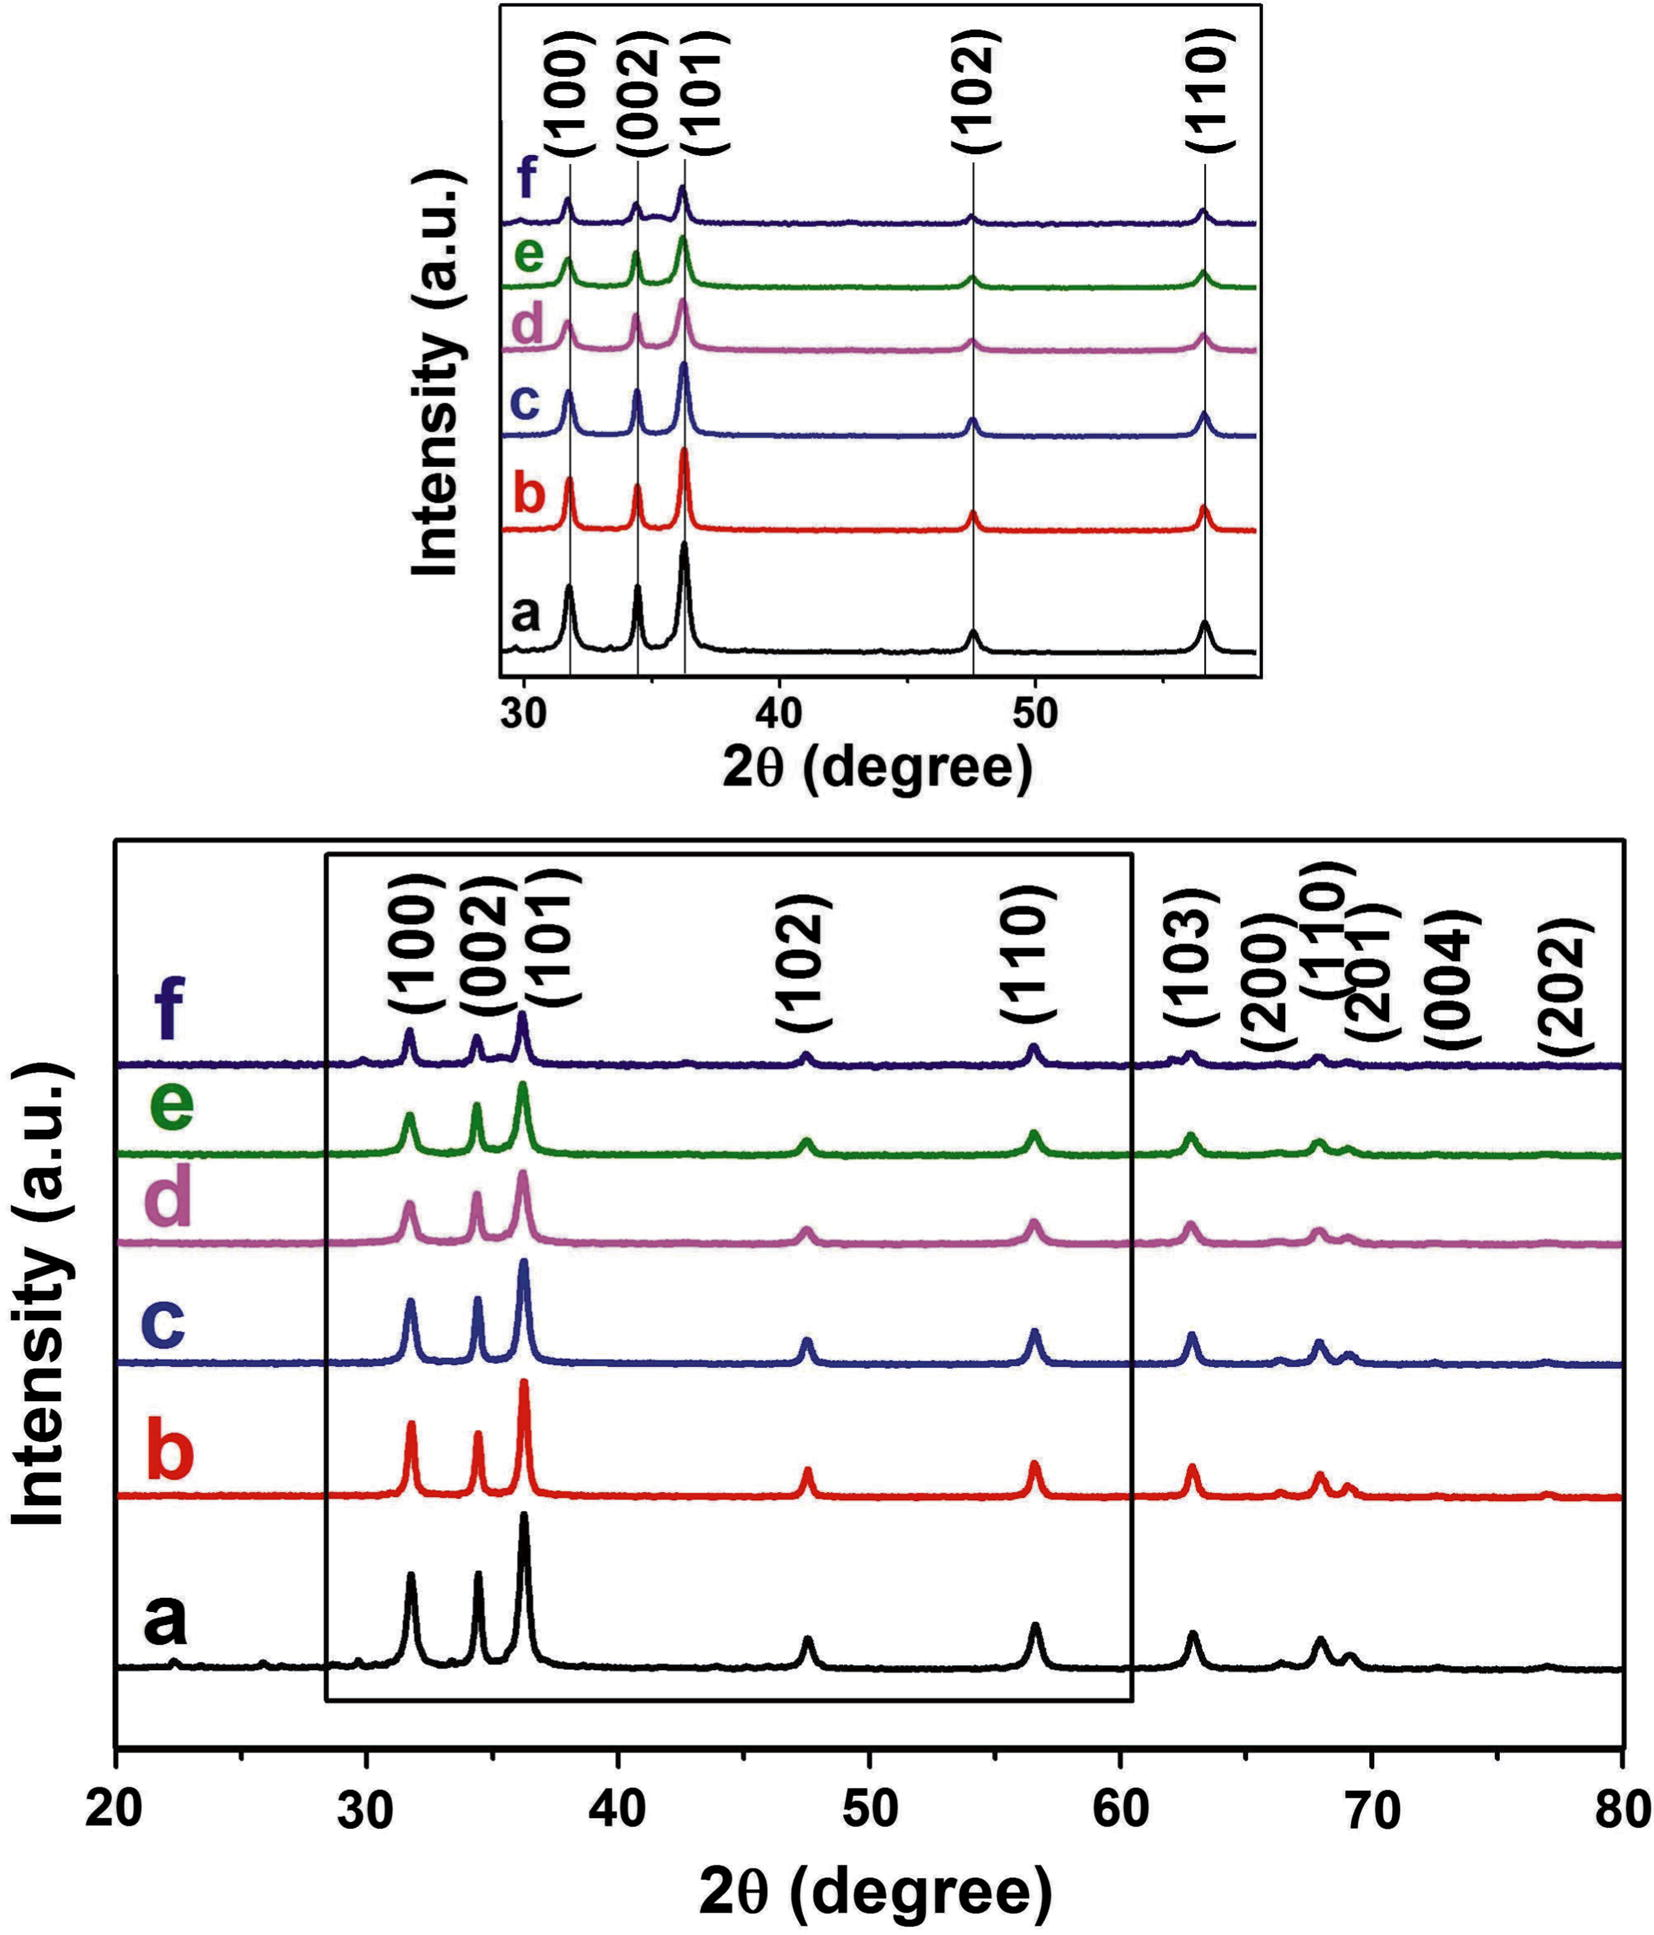
Full and expanded (inset) view of XRD diffraction patterns of C, Fe co-doped ZnO with (a) 0.0, (b) 0.47, (c) 1.08, (d) 2.07, (e) 3.04 and (f) 4.97 wt% Fe heat treated at 300 °C.
Wt% of Fe
Lattice parameters
c/a
Band gap energy (eV)
a = b [A°]
c [A°]
V [A°3]
0
3.2514
5.2068
47.689
1.6014
2.69
0.47
3.2493
5.2066
47.601
1.6023
2.50
1.08
3.2490
5.2063
47.5984
1.6024
2.38
2.07
3.2487
5.2061
47.5843
1.6025
2.29
3.04
3.2477
5.2058
47.5764
1.6029
2.24
4.97
3.2458
5.2052
47.5514
1.6036
2.10
3.3 FT-IR study
FT-IR spectra of the precursor and products obtained after calcination of the precursor at 300 °C for 2 h are presented in Fig. 3. Precursor shows absorption peaks at 3493, 1140 and 1653 cm−1 which corresponds to the O–H stretching and bending vibrations in Zn-O lattice. Peak at 2940 and 2890 cm−1 is assigned for asymmetric and symmetric stretching frequency for CH3. This spectrum also shows absorption peak at 425 cm−1 which corresponds to the stretching frequency of Zn–O bond in zinc oxide. Weak absorption peak at 615 cm−1 in Fe doped ZnO samples is characteristic of Fe–O stretching. It shows that Fe is successfully incorporated in ZnO crystal. Peak at 1498 and 1412 indexed to COO– group and stretching vibrations of carbonate species. Therefore, it seems like that the Fe and carbonate-like species have been successfully incorporated into ZnO.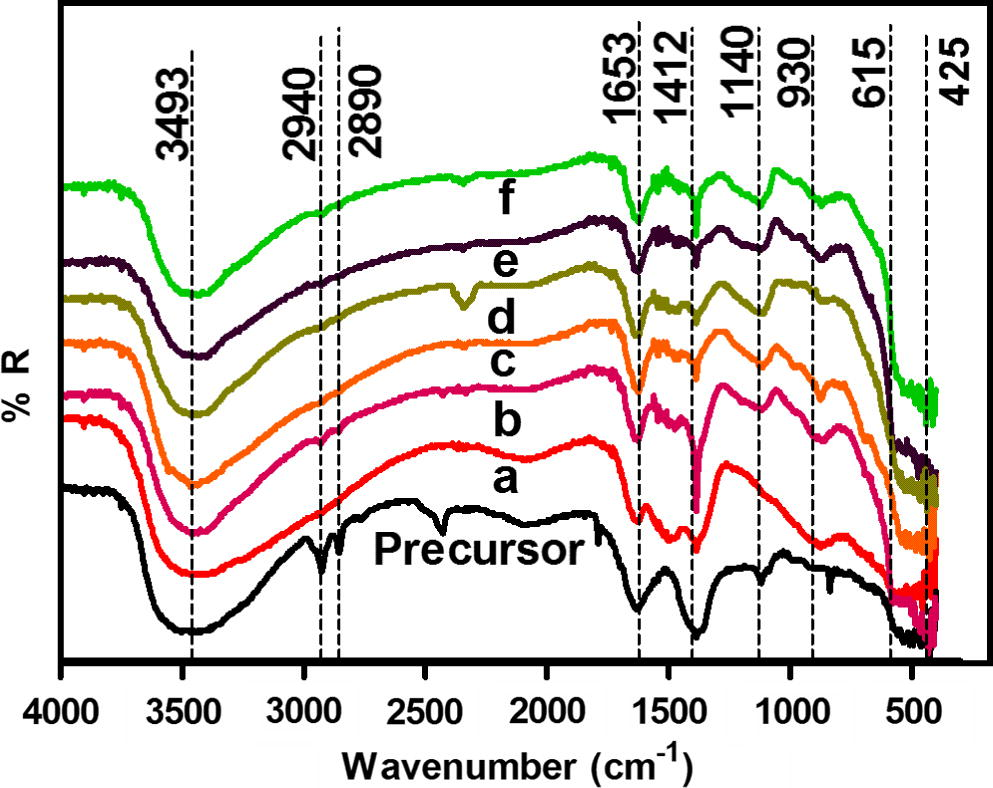
FT-IR spectra for C, Fe co-doped ZnO precursor and precursor with (a) 0.0, (b) 0.47, (c) 1.08, (d) 2.07, (e) 3.04 and (f) 4.97 wt% Fe heat treated at 300 °C.
3.4 XPS study
Fig. 4 shows XPS survey spectra for C, Fe (2.07 wt% Fe) ZnO calcined at 300 °C which indicated the existence of four elements: Zn, O, Fe and C. The Zn 2p XPS high-resolution spectrum shows peaks at 1020 and 1043 eV corresponds to Zn 2p3/2 and Zn 2p1/2 respectively. The C1s spectra can be fit into two peaks located at 284 and 287 eV, respectively. The peak at 284 eV can be indexed to adventitious elemental carbon and other band at 287 eV is associated with the peaks of C–O or C⚌O of carbonate group. From the XPS C1s spectra of the sample, it can be concluded that carbon-containing species, which come from CTAB, isopropanol, cyclohexane, butanol and their possible reactant, may get trapped in ZnO during the hydrothermal process. On heating the precursor, at 300 °C the carbon may incorporate into the ZnO lattice. From XPS and FTIR results we can conclude that carbon could be doped by replacing oxygen atoms to form Zn–O–C. Fe 2p spectra was measured in order to evaluate the electronic nature of Fe in C, Fe doped ZnO. Fe 2p core level spectrum is fitted in three peaks. Binding energy of Fe 2p3/2 and Fe 2p1/2 peaks are located at 710 eV and 724 eV respectively. Peak at 718 eV suggests that Fe is incorporated into the ZnO lattice in Fe3+ ionic state (Chey et al., 2014; Karamat et al., 2014). The O 1s spectrum centered at 529 and 531 eV belongs to O2− in the wurtzite structure of a ZnO and the presence of loosely bound oxygen on the surface respectively (Rambu et al., 2013).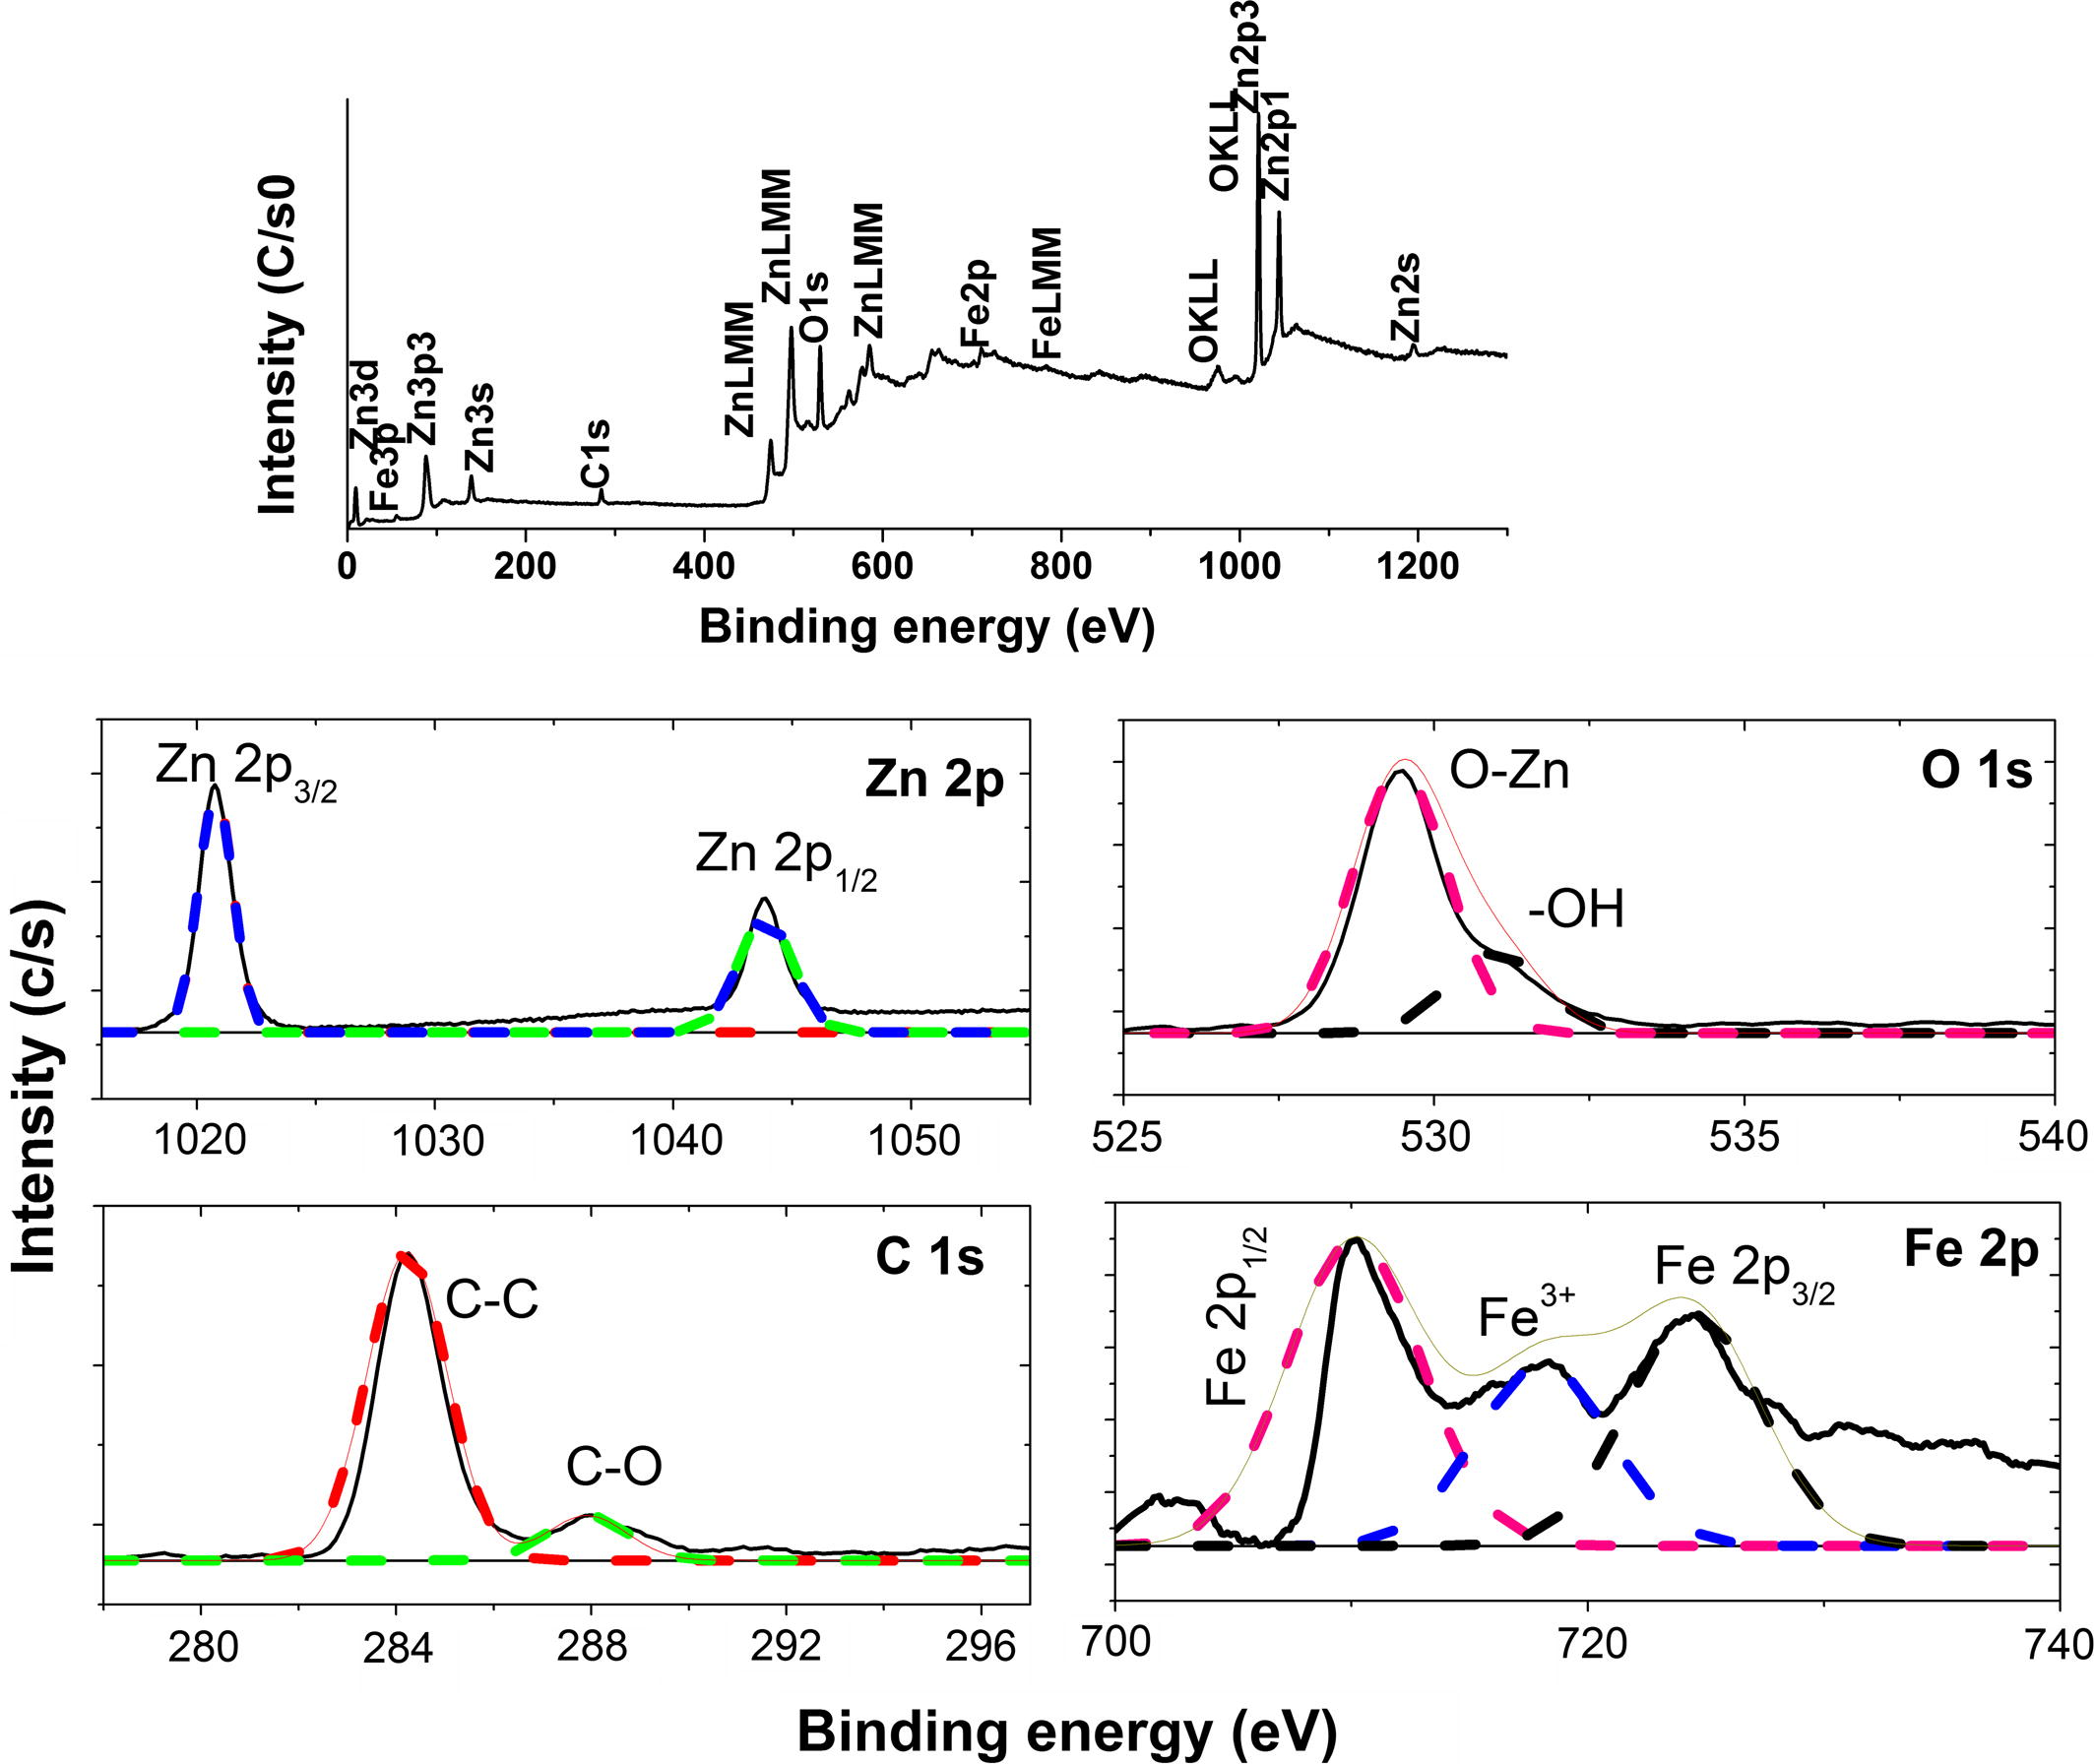
XPS survey of C, Fe (2.07 wt% Fe) ZnO and high resolution xps spectra of Zn2p, Fe2p, C1 s and O1 s.
3.5 SEM and EDX analyses
The morphologies of the prepared samples were examined by FESEM. Fig. 5 shows the FESEM images of the synthesized samples. It shows that rod-like structures of ZnO formed with carbon doping. When C and Fe were co-doped into the lattice, ZnO still showed rod-like structures, but the aspect ratio of ZnO rods decreased. As the Fe concentration into C, Fe co-doped ZnO increases above 3 wt%, crystal structure changes from rod like shape to spherical shape. EDX analysis allows detection of C, Fe, Zn and O in crystal structure. Carbon, Iron, zinc and oxygen content in the synthesized sample are 3.01 wt%, 2.07 wt%, 91.94 wt%, and 2.98 wt% respectively (Fig. S1).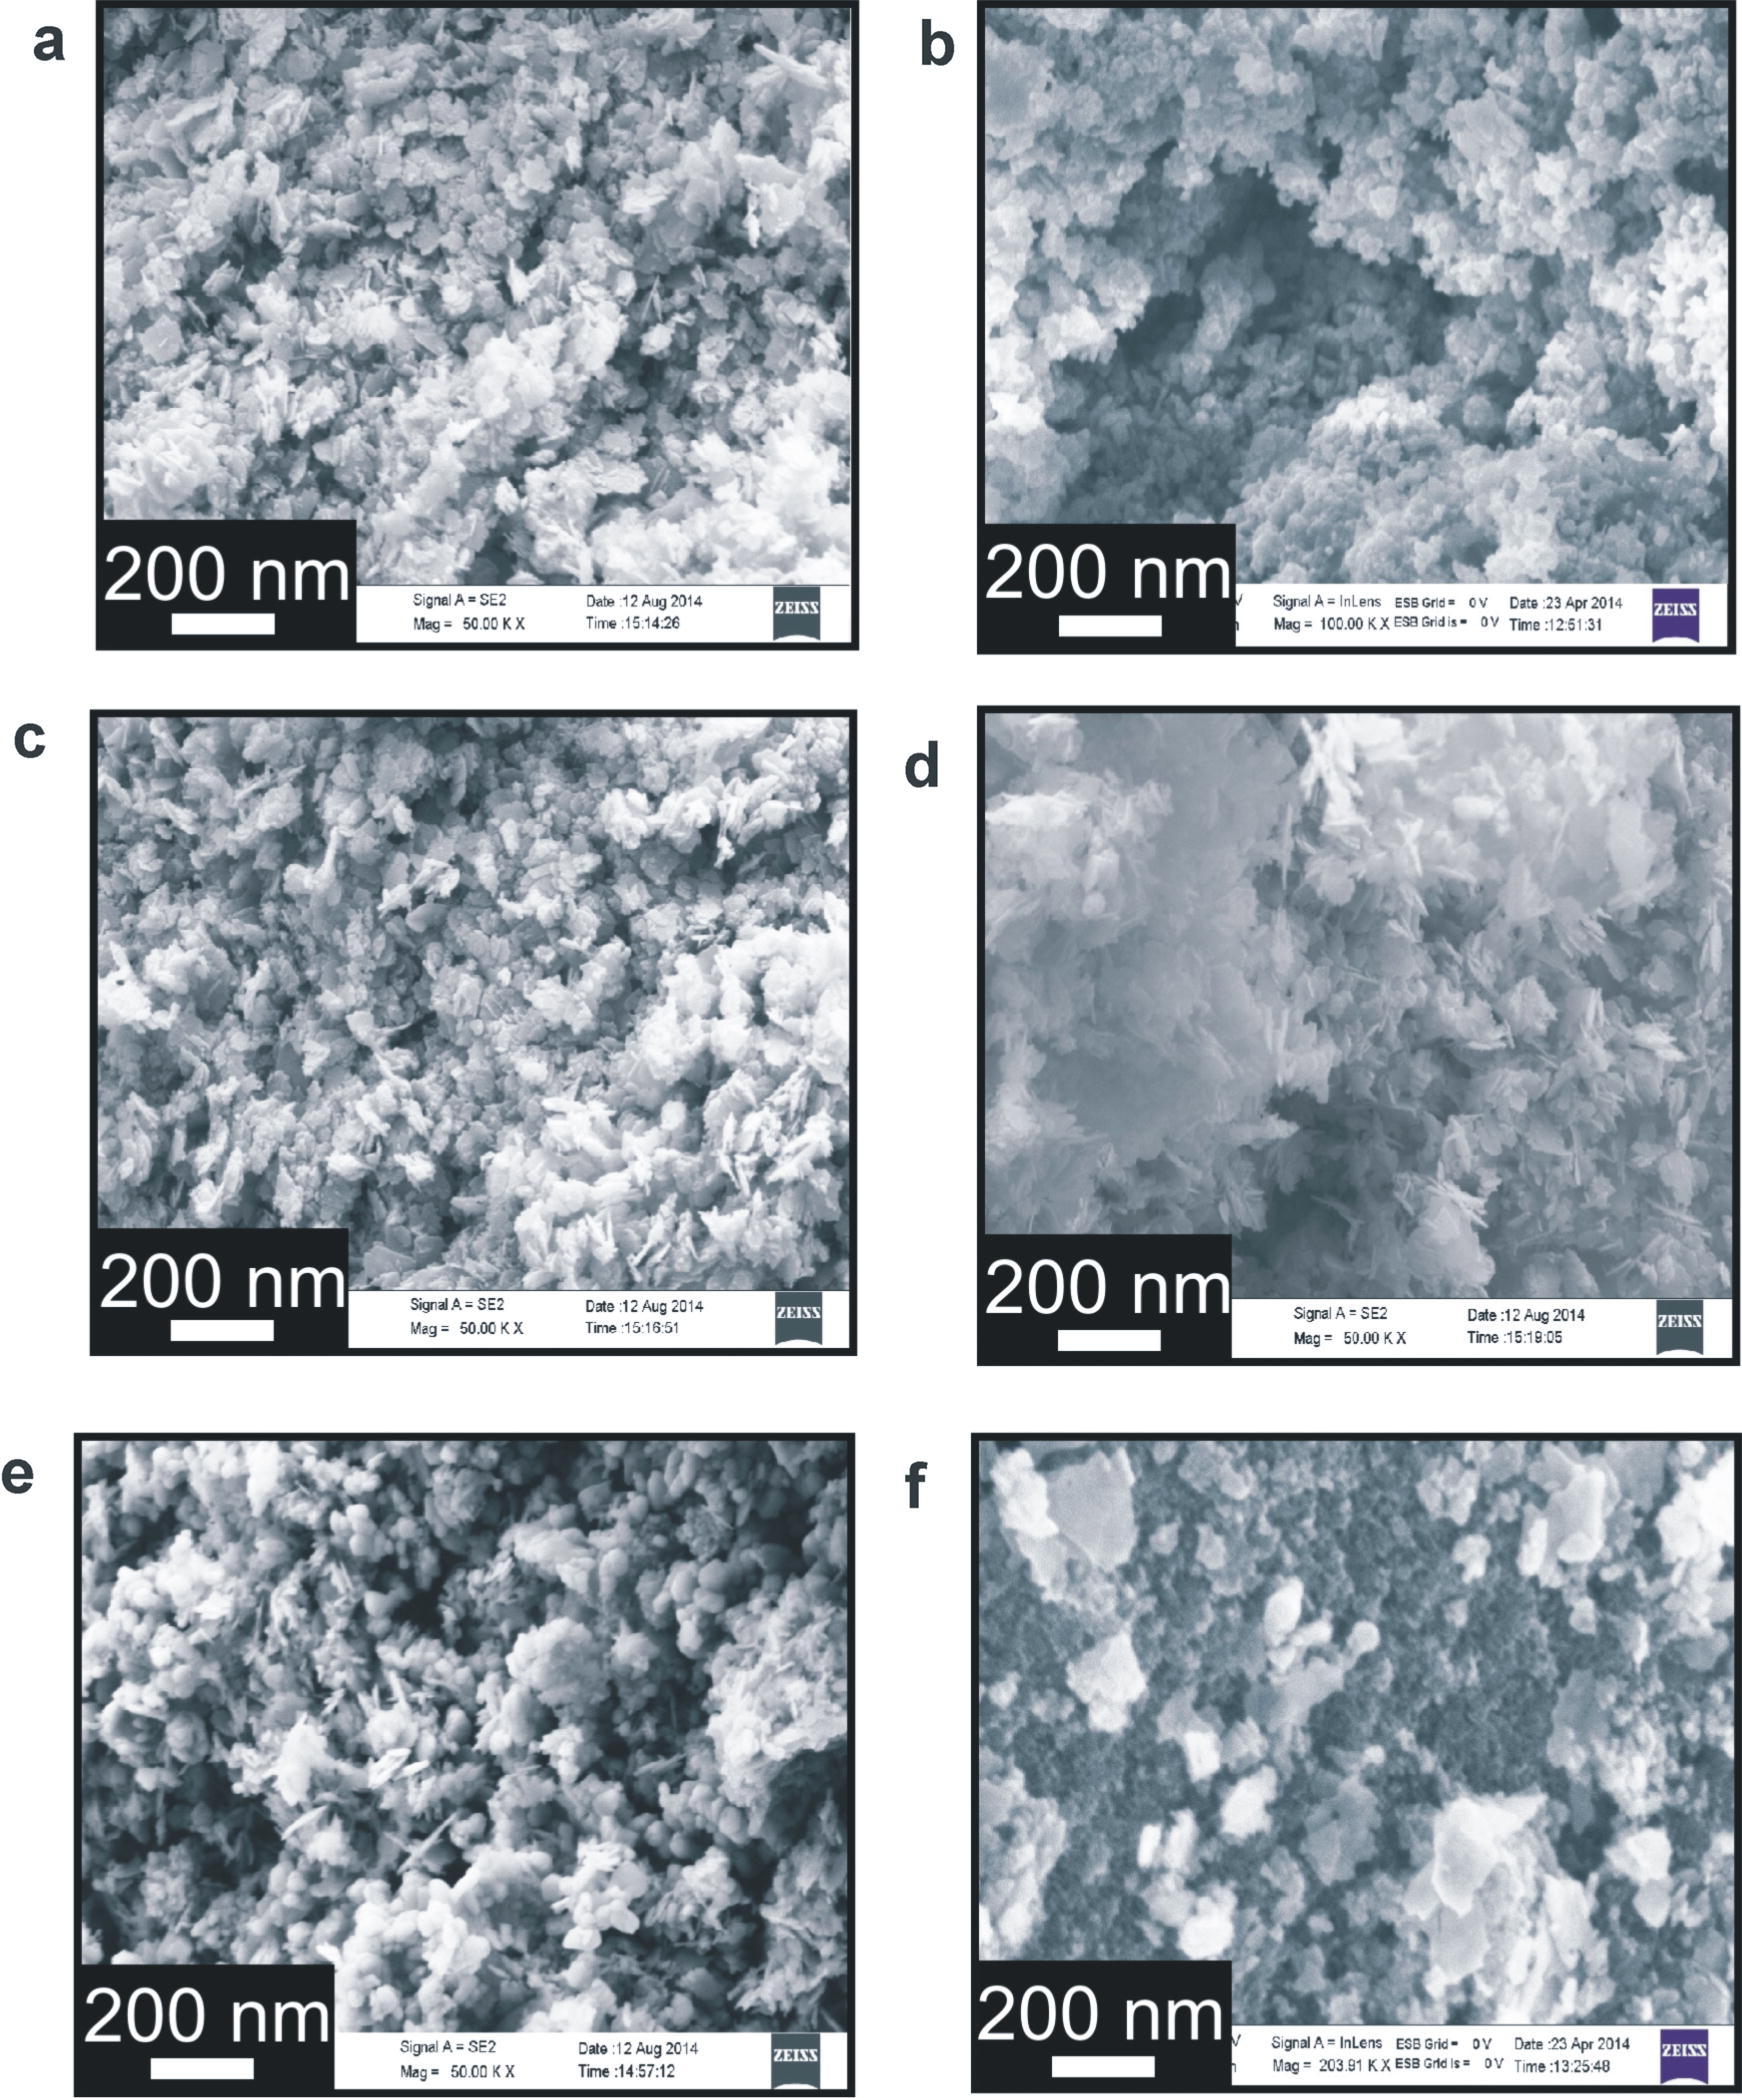
SEM mages of C, Fe co-doped ZnO with (a) 0.0, (b) 0.47, (c) 1.08, (d) 2.07, (e) 3.04 and (f) 4.97 wt% Fe.
3.6 TEM study
TEM images of C doped ZnO, C, Fe (2.07 wt% Fe) co-doped ZnO and C, Fe (4.97 wt% Fe) co-doped ZnO were recorded and are presented in Fig. 6a–c respectively. C doped ZnO and C, Fe (2.07 wt% Fe) co-doped ZnO have a rod like morphology. It is observed that for C doped ZnO prepared at 300 °C have a rod like structure with diameter and length varying between 25–40 and 200–400 nm respectively. TEM image of C, Fe (2.07 wt% Fe) co-doped ZnO shows rod like structure having average length 130 and diameter 15 nm. Introduction of Fe into ZnO matrix inhibits the growth of nanorods. Thus length as well as diameter of rods decreased as Fe ion is doped into ZnO matrix. The C, Fe (4.97wt% Fe) co-doped ZnO is spherical in shape. Selected area electron diffraction patterns (SAED) of the sample (inset) shows distinct rings that correspond to the diffraction pattern of wurtzite ZnO indicating crystalline nature.
TEM images of C, Fe co-doped ZnO with (a) 0.0, (b) 2.07, and (c) 4.97 wt% Fe.
3.7 Diffuse reflectance spectroscopic study
Pure ZnO powder is white in color. C doped and C, Fe co-doped ZnO powders are light blackish and light reddish brown in color. UV–visible diffuse reflectance spectra of as synthesize pure and doped ZnO samples are shown in Fig. 7. This figure shows that absorption spectrum for ZnO shifted to visible region after doping with C and Fe. Doping of C and Fe may introduce new energy level in band gap of ZnO, which results in shifting of absorption band to higher wavelength region by narrowing its band gap. Additional band edge absorption for C, Fe co-doped ZnO is due to d–d transition of Fe (III) (2T2g → 2A2g, 2T1g) or the charge transfer transition between interacting Fe ions (Fe3+ + Fe3+ → Fe4+ + Fe2+) (Navio et al., 1999). This red shift is interpreted in terms of the sp-d exchange interaction between the band electrons and the localized “d” electrons of the Fe3+ ion at cationic site (Kim and Park, 2004). Band gap reduction is observed because Fe3+ ion in the valance band creates defect site and after exposing to light produces electron–hole pair. Due to the presence of this new energy level just below conduction band of ZnO, energy required for transition from valence band to conduction band is lowered than that of pure ZnO (Pall and Sharon, 2002). The Kubelka-Mulk function is used to evaluate the bandgap energy of photocatalysts by plotting (F(R)hv)2 versus photon energy (eV) and results were presented in the inset of Fig. 7. The optical band gap of pure ZnO is 3.21 eV, and the optical band gap for C doped ZnO is 2.69 eV, which is in agreement with its visible light absorption capacity. As expected optical band gap of C doped ZnO reduced further with Fe co-doping (Cheng and Ma, 2009). The C, Fe co-doped ZnO samples can utilize large region of visible spectrum (nearly 46%) than pure ZnO, which is active only under small UV-region (4%).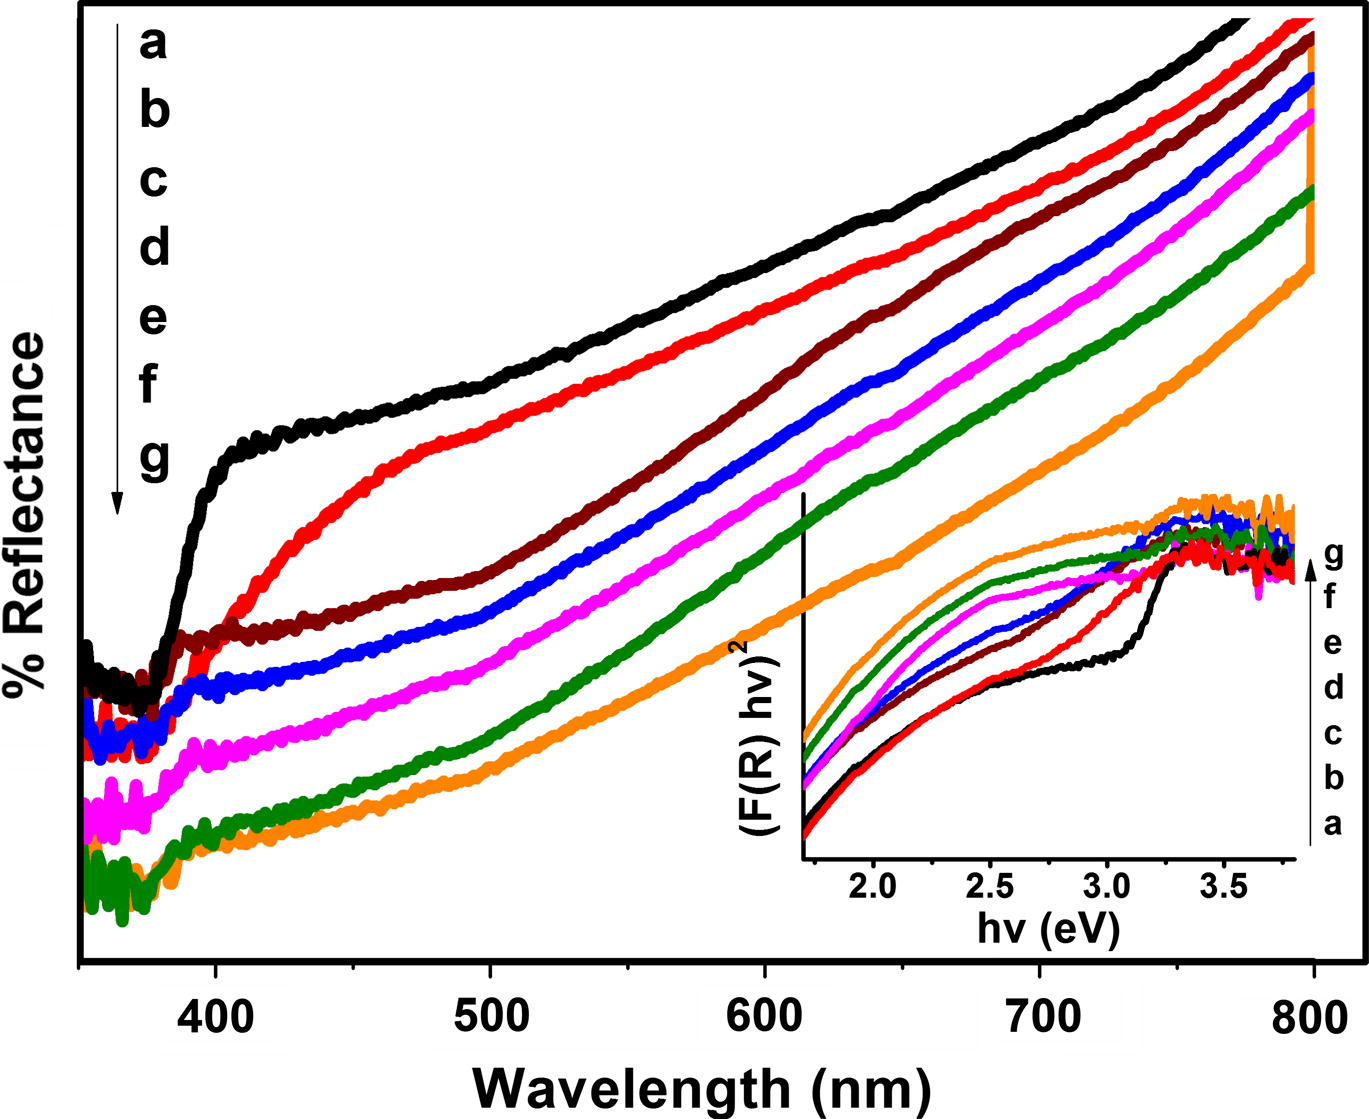
UV–visible diffuse reflectance spectra and plot of (F(R) hv)2 versus energy (hv) (using Kubelka–Munk method) for (a) Pure ZnO and C, Fe co-doped ZnO with (b) 0.0, (c) 0.47, (d) 1.08, (e) 2.07, (f) 3.04 and (g) 4.97 wt% Fe.
3.8 Photoluminescence (PL) study
Room temperature photoluminescence (PL) spectra of samples were also recorded to study the defects of the samples (Fig. 8). PL emission band at 405 nm is due to recombination between electron and zinc interstitials (Zni) and hole in the valence band (Chong et al., 2012). High intensity emission bands were observed at 405, 428 and 483 nm. The peak at 428 nm corresponds to blue emission, here electron transition takes place from conduction band to the zinc interstitial sites through non radiative process and then to the zinc vacancies. The green emission peak at 485 nm is attributed to stoichiometry related defects and these are generally attributed to zinc vacancies as well as interstitial zinc and structural defects. The peak at 530 nm is due to singly ionized oxygen vacancy. Electron transition takes place from zinc interstitials to oxygen vacancy. It is observed form Fig. 8 that PL intensity of doped ZnO samples are much lower as compared to pure ZnO. It can be seen that C and Fe co-doped ZnO showed lower intensity of PL peak than that of pure ZnO, especially the C, Fe (2.07 wt%) co-doped ZnO prepared at 300 °C showed lowest PL intensity. Lowest PL intensity of the samples corresponds to the highest photocatalytic activity. This is because, lower the excitonic PL intensity, stronger the capacity of the dopants to capture photo-induced electrons and higher the separation rate of photoinduced electrons-holes. Doping may offer competitive pathways for recombination resulting quenching of the emission. In case of photoluminescence effect, which is present as the result of direct radiative recombination, lower recombination of generated carriers causes the decrease in light emission intensity (Wojcieszak et al., 2013). However, this process simultaneously increases the photocatalytic activity of the semiconductor. Therefore photocatalytic activity of C, Fe co-doped ZnO prepared at 300 °C could enhanced due to inhibition of electron–hole recombination.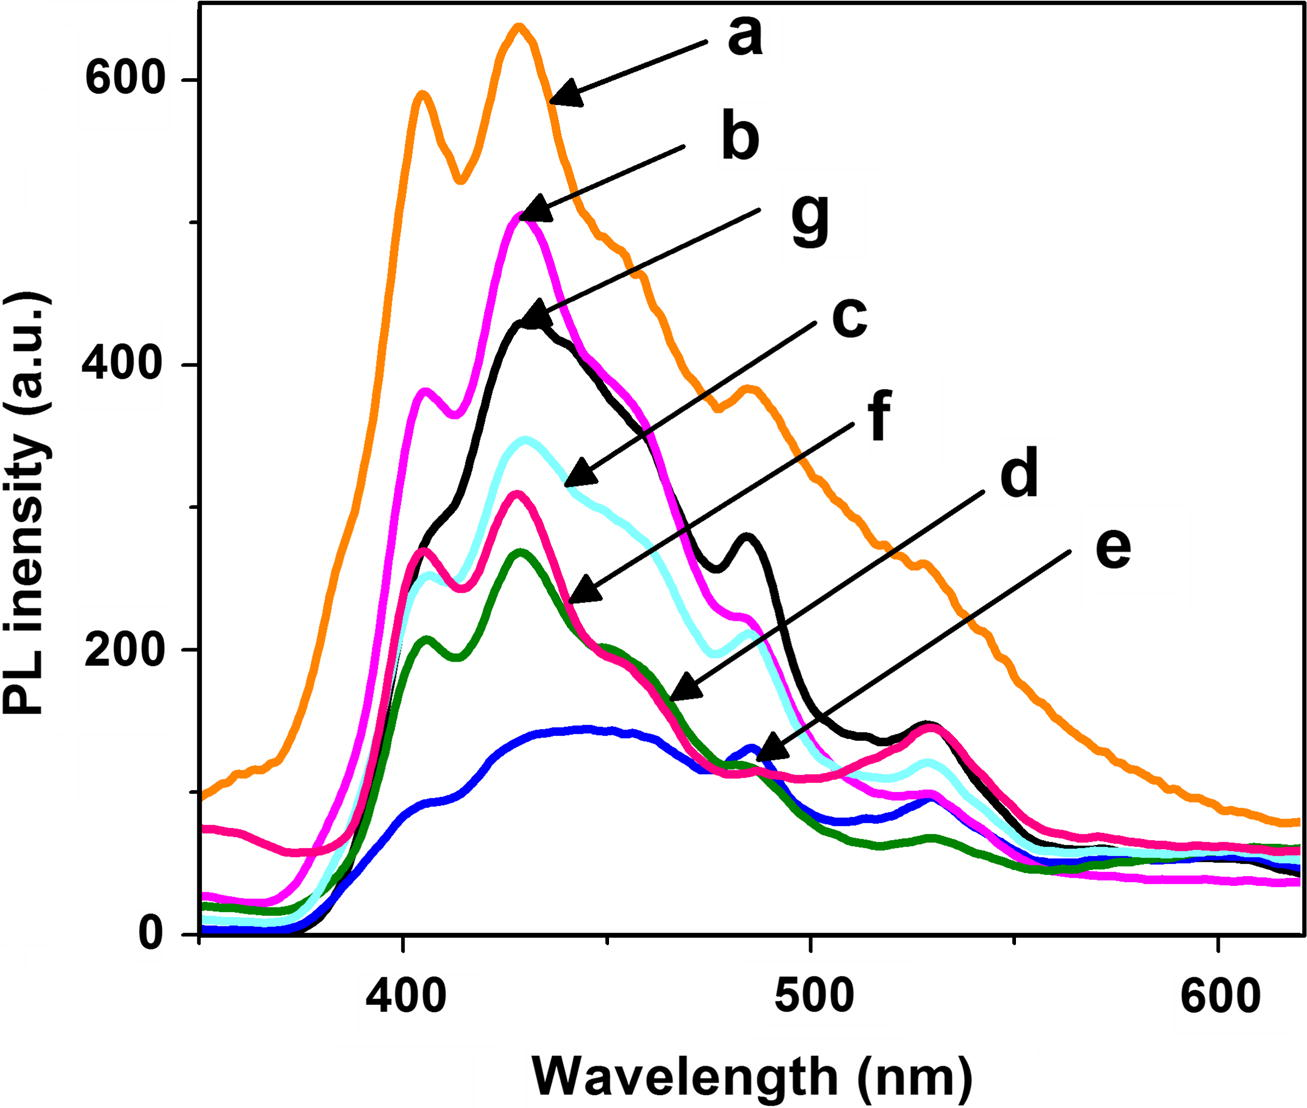
Photoluminescence spectra of (a) Pure ZnO and C, Fe co-doped ZnO with (b) 0.0, (c) 0.47, (d) 1.08, (e) 2.07, (f) 3.04 and (g) 4.97 wt% Fe.
3.9 Visible light photocatalytic activity study
Visible light photocatalytic degradation of TCP was studied in the presence of nanosized pure and doped ZnO photocatalyst. Representative UV visible spectra of aqueous solution of TCP irradiated with visible light at different time intervals in the presence of C, Fe (2.07 wt% Fe) co-doped ZnO (prepared at 300 °C) were recorded and are presented in Fig. 9a. These spectra show two peaks located at 245 and 315 nm. As irradiation time increased the height of peak at both these wavelength decreased due to the photocatalytic degradation of TCP. This study indicates ∼98% TCP is degraded in 120 min. Amount of TCP in the test solution during the photocatalytic degradation process was also evaluated using HPLC technique. HPLC chromatograms of test solution irradiated at different time intervals in the presence of C, Fe (2.07 wt% Fe) co-doped ZnO were recorded and are presented in Fig. 9b. Chromatogram of standard solution gives two peaks at retention time 2.6 and 4.7 min. Peak observed at 2.6 min is characteristic peak of water and peak at 4.7 min is due to TCP. As irradiation time increased the intensity of peak at 4.7 min decreases, indicating that TCP degrades in visible light and ∼ 98% mineralization occurred in 120 min. It is known that TCP degradation leads to the formation of a mixture of byproducts such as catechol, benzoquinone, resorcinol, and hydroquinone which further reacts with hydroxyl radicals and forms CO2 and H2O (Ahmed et al., 2011; Selvam et al., 2013). Compared to bare ZnO, C doped ZnO exhibit better visible light catalytic activity for degradation of TCP. To enhance the visible light activity further, ZnO was co-doped with Fe and the photocatalytic activity of C, Fe co-doped ZnO was studied and results are presented in Fig. 9c. This figure shows that compared to pure and C doped ZnO, C, Fe co-doped ZnO has better degradation efficiency. As the amount of Fe increases degradation of TCP increases up to 2.07 wt% Fe co-doping. A further increase in the amount of Fe results in a decrease in TCP degradation. Photocatalytic activity of C and Fe modified ZnO is higher due to Fe doping because it effectively captures photo induced electrons and inhibits the electron–hole recombination and improves photocatalytic activity. Interstitial C dopant could create intra band states close to the valence band edges and Fe (III) introduces a dopant energy level below conduction band of ZnO. Thus, C and Fe species in the co-doped ZnO system improves separation efficiency of photogenerated electrons and holes (Wu et al., 2010). This shows that synergistic effects of C and Fe enhances the utilization of visible light by narrowing the band gap and also enhances the separation of photogenerated holes and electrons which leads to increase the photo degradation of TCP in visible light. Fig. 9c shows that the C, Fe co-doped ZnO photocatalyst with 2.07 wt% Fe gives better photocatalytic activity therefore its stability was studied. Stability tests were performed by repeating the reaction four times using recovered photocatlyst. The data obtained are presented in Fig. 9d. These data reveal that there is no noticeable decrease in photocatalytic activity up to the fourth cycle. It indicates that C, Fe co-doped ZnO prepared in the present work is highly stable and reusable photocatalyst.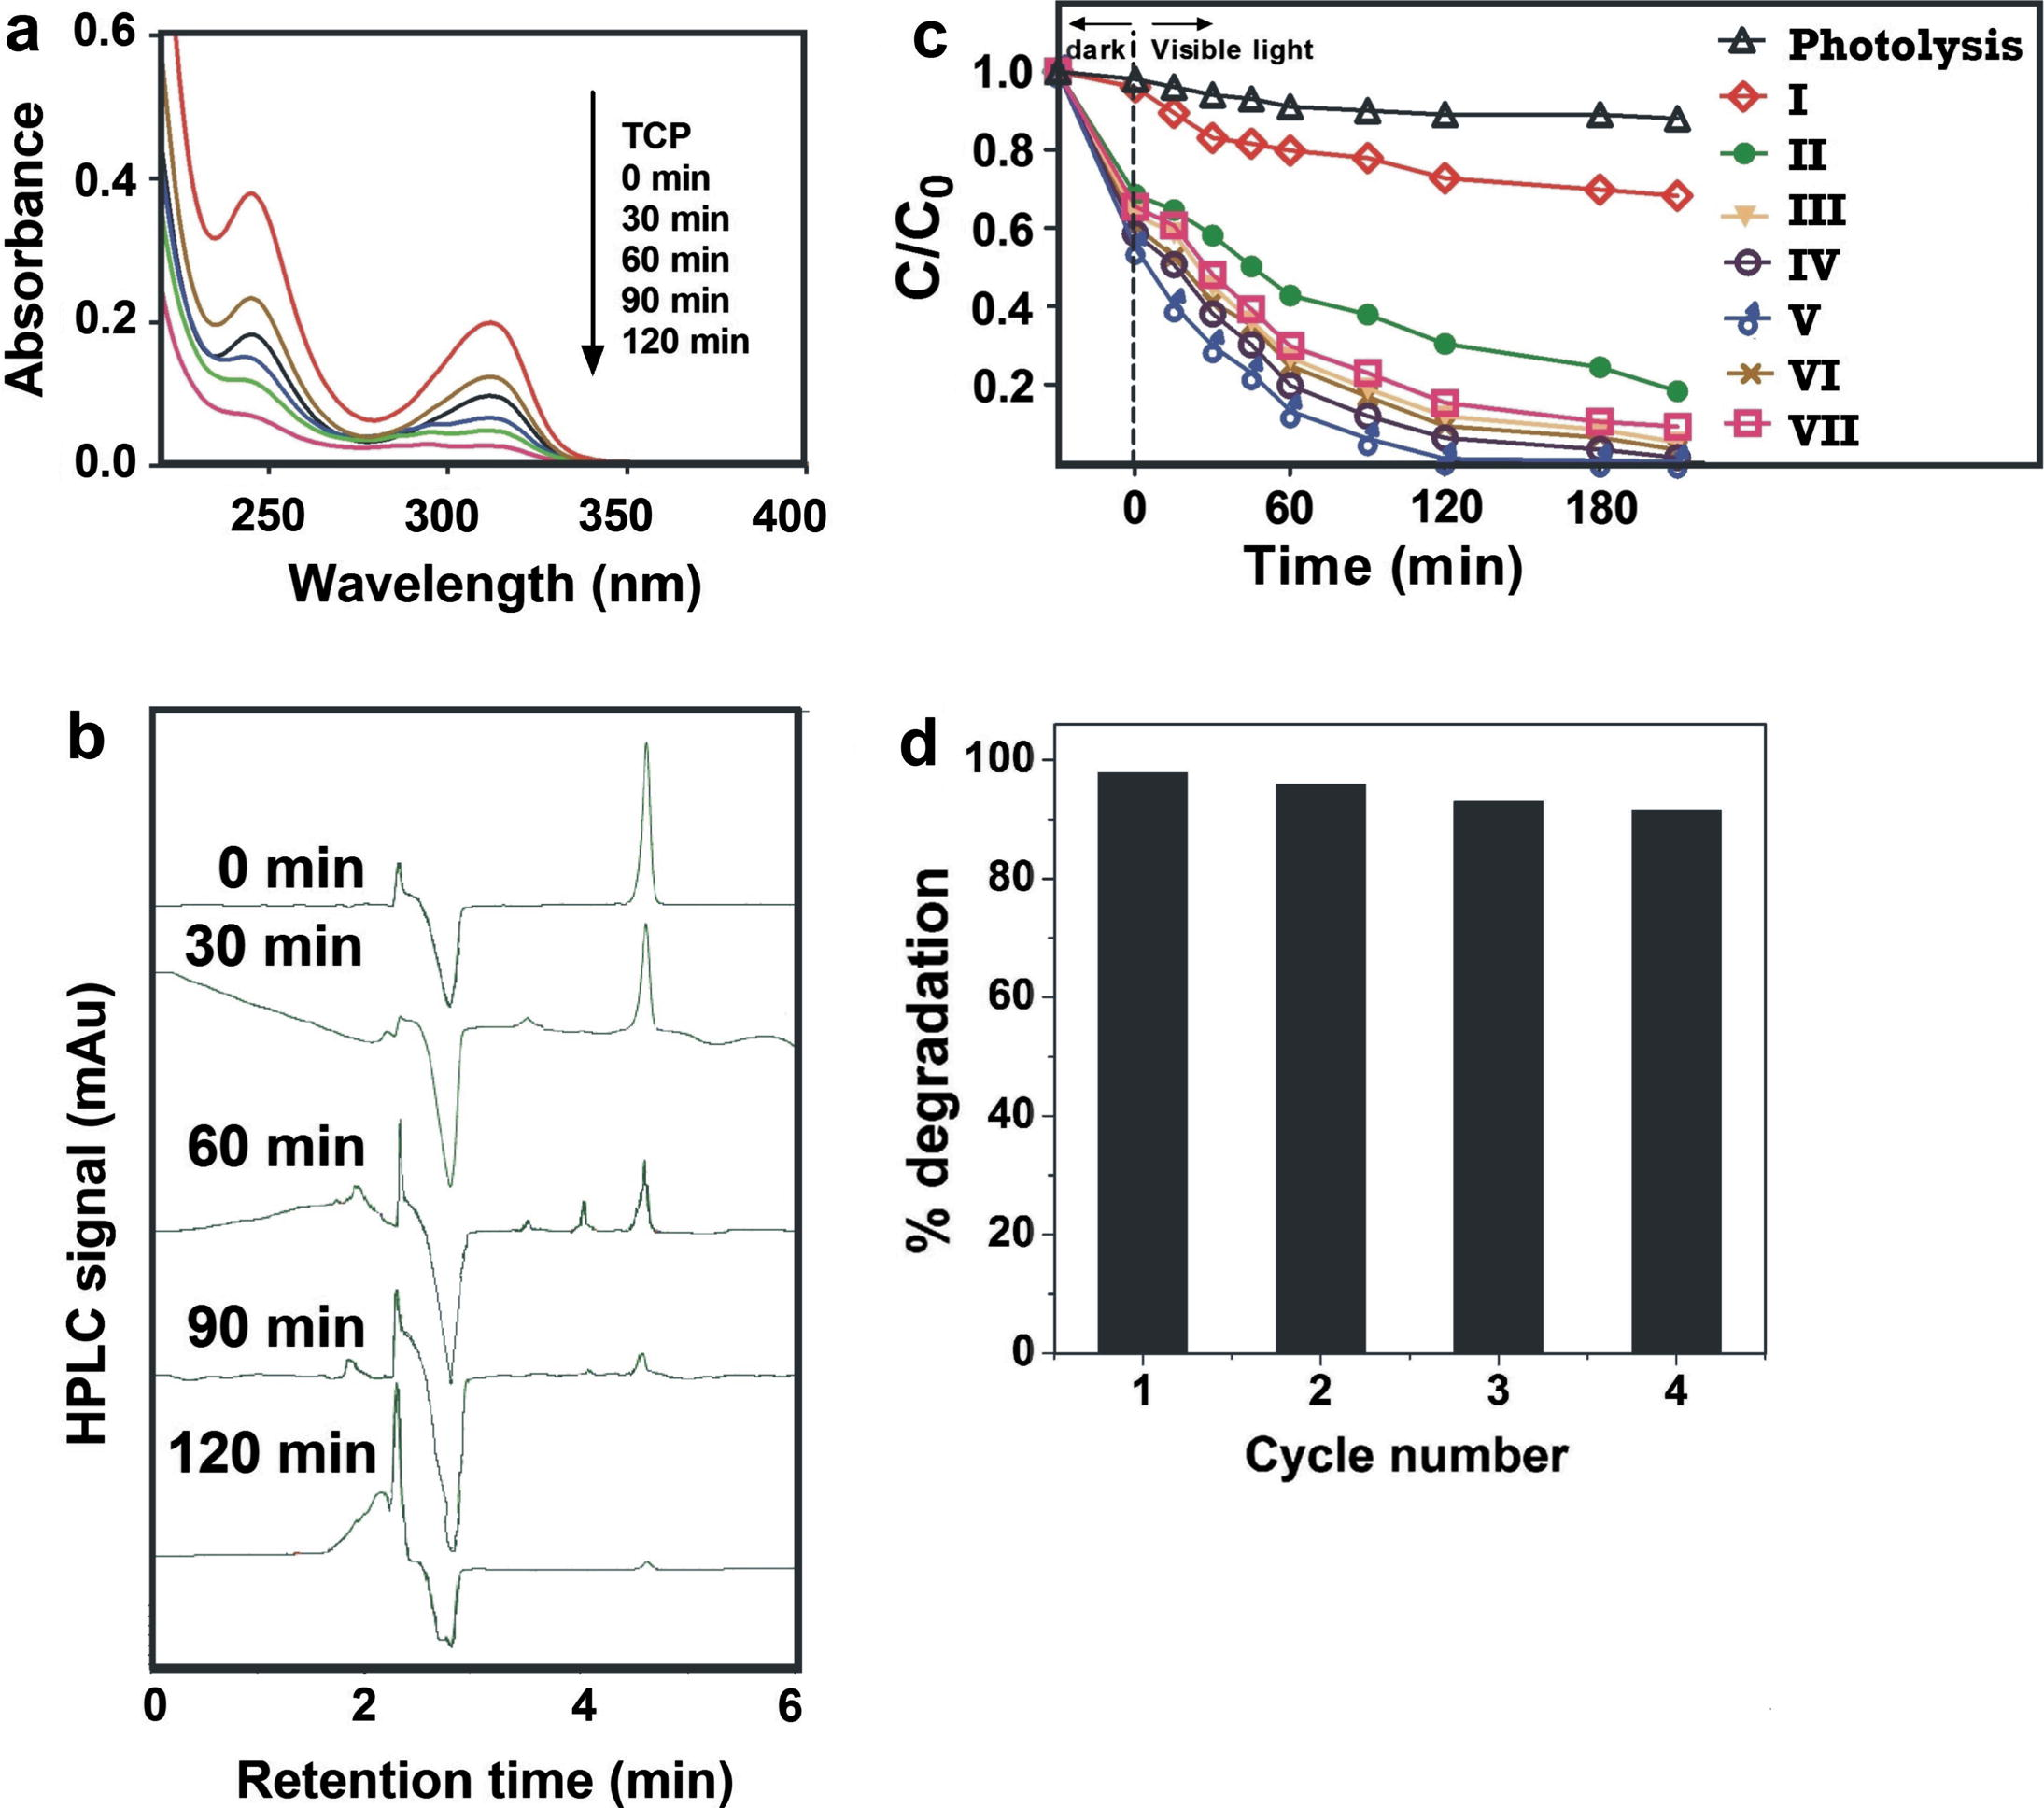
(a) UV–visible spectra of TCP solution irradiated with visible light at different time intervals in the presence of C, Fe (2.07 wt%) co-doped ZnO, (b) HPLC chromatograms of TCP solution irradiated with visible light at different time intervals in the presence of C, Fe (2.07 wt%) co-doped ZnO (c) Effect of C and Fe co-doping on TCP photodegradation and (d) Reuse of photocatalyst.
Fig. 10a shows PL spectra of Terephthalic acid (TA) solution after exposure for 4 h under visible light irradiation in the presence of C, Fe (2.07 wt%) co-doped ZnO nanoparticles. The blank experiment result indicates that in the absence of catalyst no signal was generated at 429 nm. In the presence of C, Fe (2.07 wt%) co-doped ZnO, PL intensity increases with irradiation time. This reveals the generation of •OH radicals which are mainly responsible for degradation of TCP. From Fig. 10b it can be observed that the formation rate of •OH radicals on the C, Fe doped ZnO powders is much higher than that of the pure ZnO powder. It suggests that the surface of C, Fe co-doped ZnO sample is supportive to produce •OH radicals and constructive for improving its photocatalytic activity. In addition, the PL intensity of C, Fe (2.07 wt%) co-doped ZnO is higher than any other samples, symptomatic of the formation rate of •OH radicals on its surface is the largest.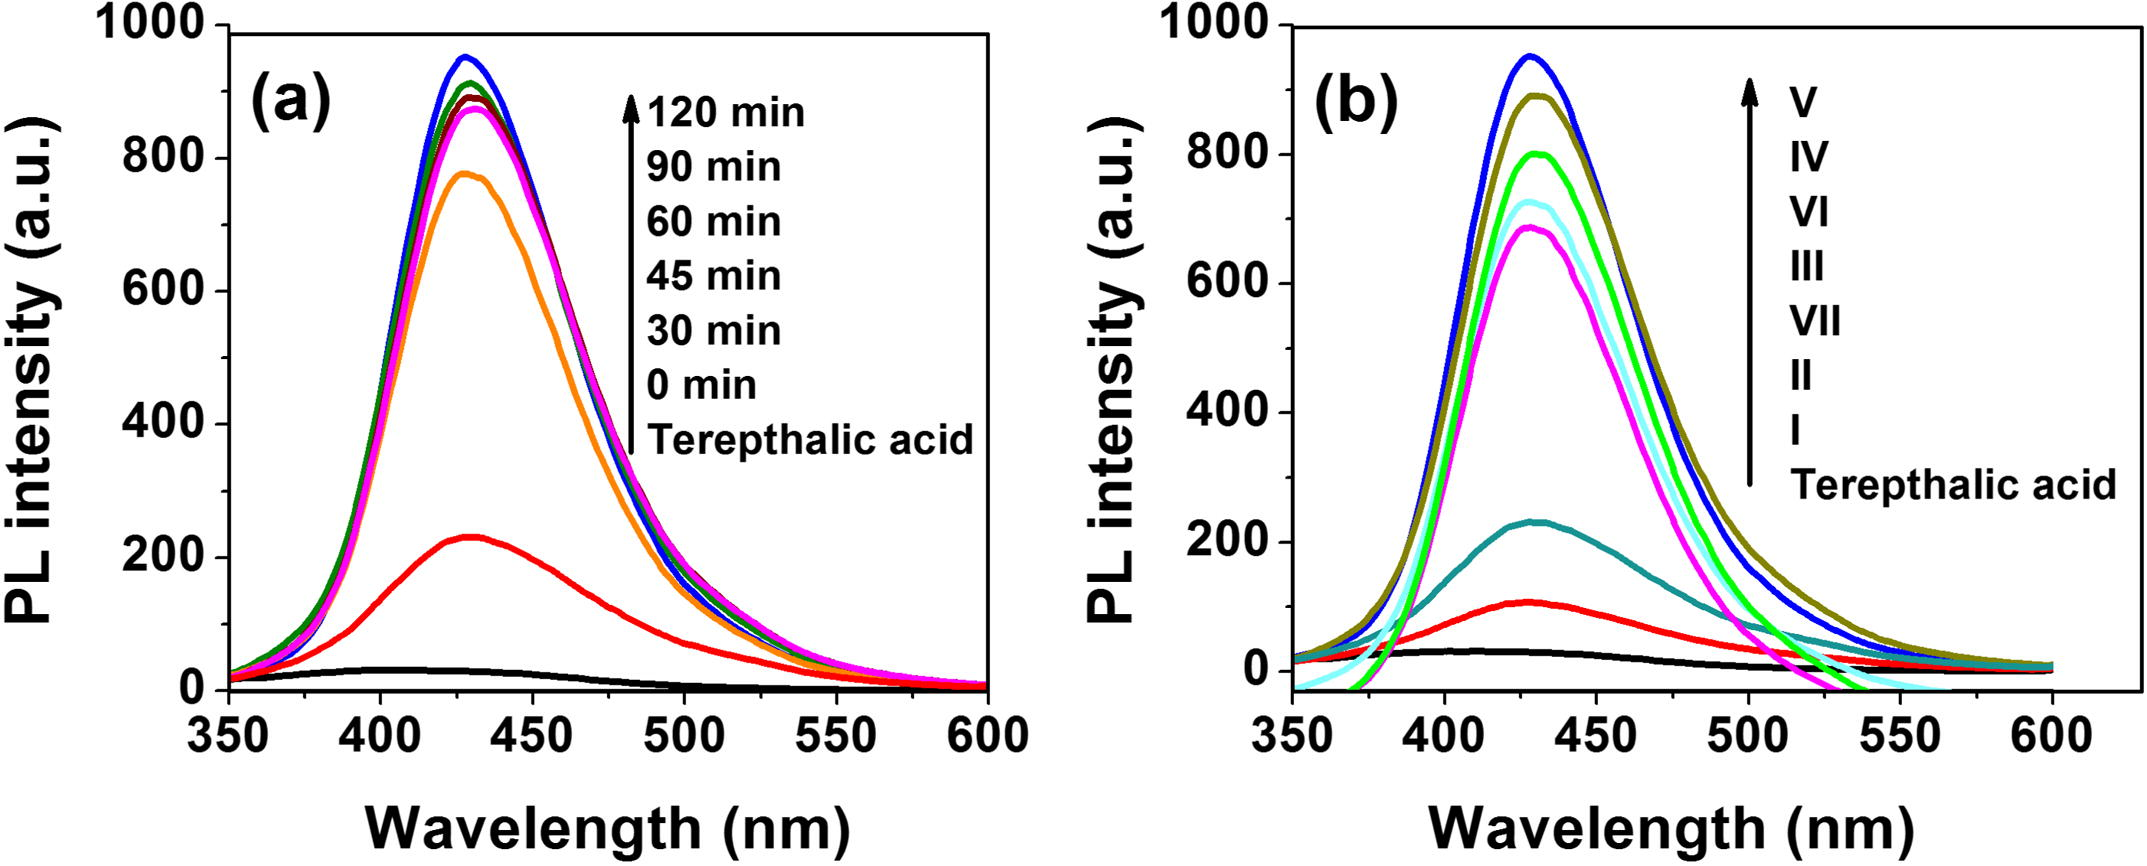
(a) PL spectra of Terephthalic acid (TA) solution after illumination of C, Fe (2.07 wt%) co-doped ZnO and (b) fluorescence spectra of Terepthalic acid (TA) in the presence of pure and doped ZnO samples under visible light irradiation.
Possible mechanism for synergistic effect of C and Fe into ZnO photocatalyst is presented in Fig. 11. Carbon could create intra energy level just above the valence band and Iron could create new energy level below the conduction band to reduce the band gap of ZnO. Fe ions act as shallow electron-trapping center under visible light irradiation. Fe2+ could oxidize to Fe3+ by transferring electron to absorbed O2 on the surface of ZnO. In this reaction C species could trap the part of photo generated holes and suppressed the recombination of electrons and holes. Possible Mechanism of TCP degradation in the presence of C and Fe co-doped ZnO can be explained as below,
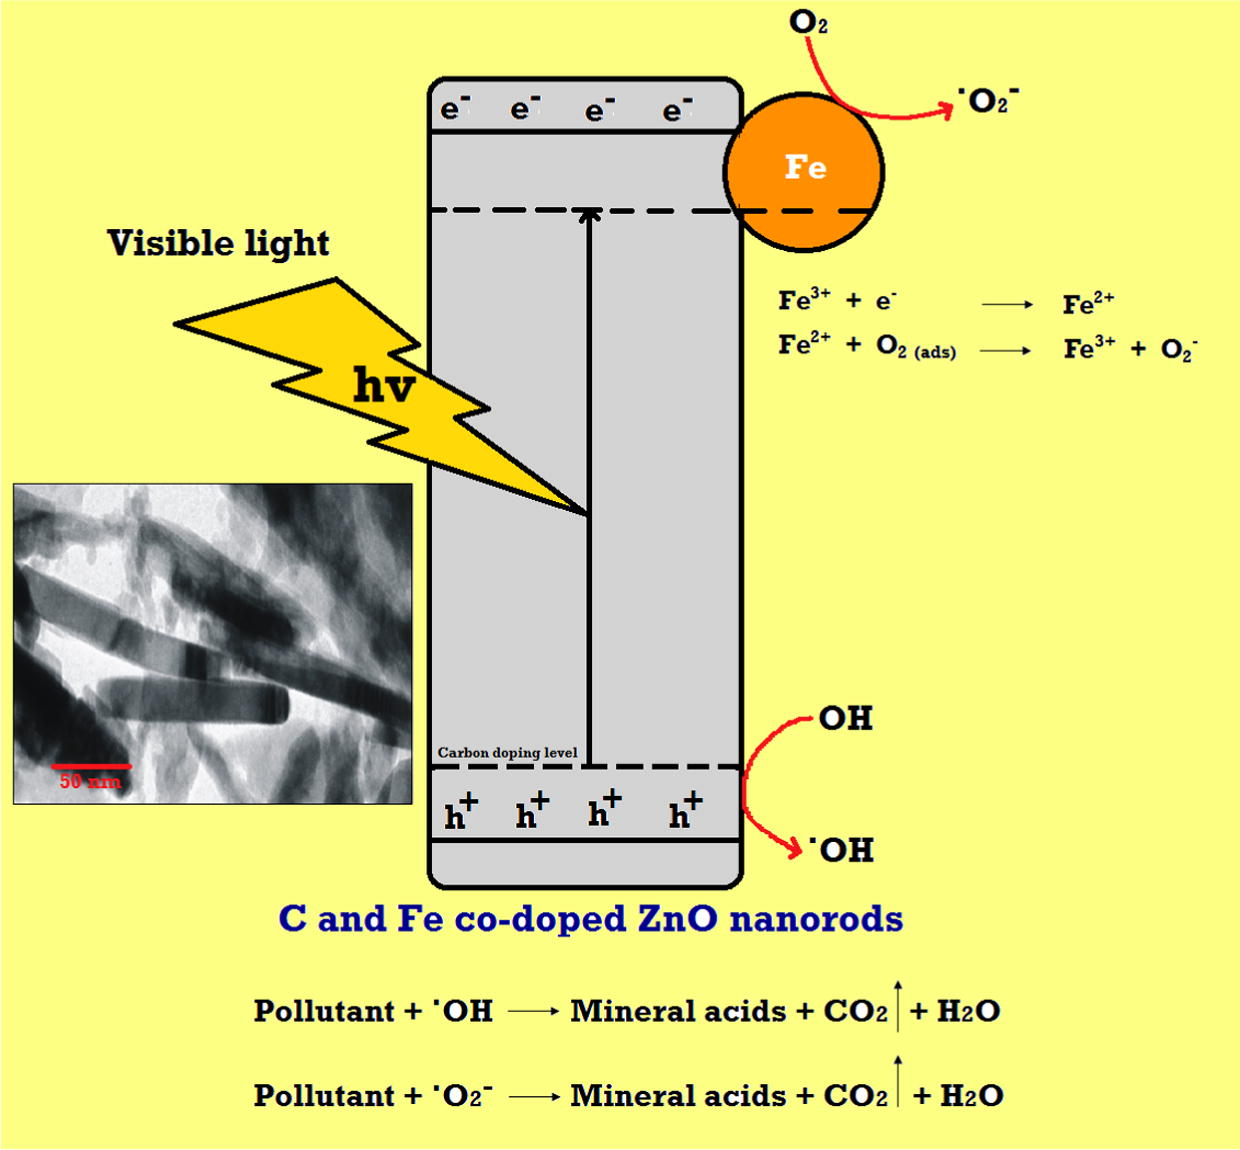
Proposed mechanism to explain the increase in the photocatalytic activity due to synergic effect of C and Fe co-doping in ZnO nanorods.
This shows that synergistic effects of C and Fe enhances the utilization of visible light by narrowing the band gap and also enhances the separation of photogenerated holes and electrons which leads to high photo degradation of TCP under visible light.
4 Conclusion
We have successfully synthesized bare, C doped and C, Fe modified ZnO using microemulsion method at low temperature. C, Fe modified ZnO samples showed strong visible light absorption capacity, more surface hydroxyl groups as well as lower recombination rate of electron/hole, which contribute to high photocatalytic degradation of TCP under visible light. XPS and FTIR study reveals doping of C into ZnO lattice. Fe(III) cations doped into ZnO lattice can trap photogenerated electrons, which is the benefit of the separation of photogenerated electrons and holes. The synergistic effects of C and Fe may efficiently promote the separation of photogenerated holes and electrons, and are responsible for high photodegradation of TCP under visible light irradiation. C, Fe (2.07 wt%) ZnO photocatalyst showed highest photocatalytic activity among other doped samples and is highly stable and one can reuse it up to several cycles.
Conflict of interests
The authors declare that there is no conflict of interests regarding the publication of this paper.
Acknowledgements
Authors are thankful to SAIF, IIT, Mumbai for recording SEM and TEM images of the samples. One of the authors Atul Bhausaheb Lavand is grateful to UGC, New Delhi for providing BSR fellowship.
References
- Advances in heterogeneous photocatalytic degradation of phenols and dyes in wastewater: a review. Water Air Soil Poll.. 2011;215:3-29.
- [Google Scholar]
- Modification of commercial activated carbon for the removal of 2,4-dichlorophenol from simulated wastewater. J. King Saud Univ.- Sci..
- Effects of Mn and Cu doping on the microstructures and optical properties of sol–gel derived ZnO thin films. Opt. Mater.. 2007;29:672-678.
- [Google Scholar]
- Kinetic Monte Carlo simulation of 2,4,6-thrichloro phenol ozonation in the presence of ZnO nanocatalyst. J. Saudi Chem. Soc. 2014 https://doi.org/10.1016/j.jscs.2014.11.001
- [Google Scholar]
- Structural, optical and magnetic properties of Fe-doped ZnO. J. Phys: Conf. Ser.. 2009;152:012039.
- [Google Scholar]
- Synthesis of Fe-doped ZnO nanorods by rapid mixing hydrothermal method and its application for high performance UV photodetector. J. Nanomater.. 2014;2014:524530.
- [Google Scholar]
- Carbon-doped ZnO nanostructures synthesized using vitamin C for visible light photocatalysis. CrystEngComm. 2010;12:3929-3935.
- [Google Scholar]
- Synthesis, characterization and room temperature photoluminescence properties of Al doped ZnO nanorods. Physica E. 2012;44:1399-1405.
- [Google Scholar]
- Synthesis of carbon doped ZnO with a porous structure and its solar-light photocatalytic properties. Mater. Lett.. 2013;111:217-220.
- [Google Scholar]
- Tunable electronic transport characteristics of surface-architecture-controlled ZnO nanowire field effect transistors. Nano Lett.. 2008;8:950-956.
- [Google Scholar]
- Doping induced tailoring in the morphology, band-gap and ferromagnetic properties of biocompatible ZnO nanowires, nanorods and nanoparticles. Nano Micro Lett..
- ALD grown nanostructured ZnO thin films: Effect of substrate temperature on thickness and energy band gap. J King Saud Univ.-Sci..
- The role of adsorption in the photocatalytic decomposition of Orange II on carbon-modified TiO2. J. Mol. Liq.. 2016;220:504-512.
- [Google Scholar]
- Structural, elemental, optical and magnetic study of Fe doped ZnO and impurity phase formation. Prog. Nat. Sci.: Mater. Int.. 2014;24:142-149.
- [Google Scholar]
- Preparation and application of visiblelight-responsive Ni-doped and SnO2-coupled TiO2 nanocomposite photocatalysts. J. Hazard. Mater.. 2009;163:1179-1184.
- [Google Scholar]
- Optical investigation of Zn1−xFexO films grown on Al2O3(0001) by radio-frequency sputtering. J. Appl. Phys.. 2004;96:4150.
- [Google Scholar]
- Photocatalytic, optical and magnetic properties of Fe-doped ZnO nanoparticles prepared by chemical route. J. Alloy. Comp.. 2014;588:681-689.
- [Google Scholar]
- Nanosized C-doped TiO2 as a visible-light photocatalyst for the degradation of 2,4,6-trichlorophenol. Adv. Mater. Lett.. 2015;6:695-700.
- [Google Scholar]
- Synthesis, characterization and visible light photocatalytic activity of nitrogen-doped zinc oxide nanospheres. J. Asian Cer. Soc.. 2015;3:305-310.
- [Google Scholar]
- Synthesis, characterization, and visible light photocatalytic activity of nanosized carbon doped zinc oxide. Int. J. Photochem.. 2015;2015:790153.
- [Google Scholar]
- Iron-doped titania semiconductor powders prepared by a sol-gel method. Part I: synthesis and characterization. Appl. Catal. A Gen.. 1999;177:111-120.
- [Google Scholar]
- Enhanced photocatalytic activity of highly porous ZnO thin films prepared by sol–gel process. Mater. Chem. Phys.. 2002;76:82-87.
- [Google Scholar]
- Effect of Fe doping concentration on optical and magnetic properties of ZnO nanorods. Nanotech.. 2012;23:115601.
- [Google Scholar]
- Carbon-chlorine and carbon-bromine bond cleavage in the catalytic hydrodehalogenation of halogenated aromatics. J. Catal.. 2002;211:451-463.
- [Google Scholar]
- Fabrication of nanocomposite photocatalysts from zinc oxide nanostructures and reduced graphene oxide. Curr. Appl. Phys.. 2013;13(2):S50-S57.
- [Google Scholar]
- Influence of Fe doping on the optical and electrical properties of ZnO fims. Superlattices Microstruct.. 2013;59:87-96.
- [Google Scholar]
- Pure and Mg-doped self-assembled ZnO nano-particles for the enhanced photocatalytic degradation of 4-chlorophenol. J. Environ. Sci.. 2013;25:2157-2167.
- [Google Scholar]
- Photochemical transformation of polychlorinated phenols. J. Photochem. Photobiol. A Chem.. 1997;107:207-213.
- [Google Scholar]
- Degradation of 2,4,6-trichlorophenol by photo Fenton’s like method using nano heterogeneous catalytic ferric ion. Sol. Energy. 2010;84:1613-1618.
- [Google Scholar]
- Correlation of photocatalysis and photoluminescence effect in relation to the surface properties of TiO2: Tb thin films. Int. J. Photoenergy. 2013;526140:1-9.
- [Google Scholar]
- Properties of carbon and iron modified TiO2 photocatalyst synthesized at low temperature and photodegradation of acid orange 7 under visible light. Appl. Surf. Sci.. 2010;256:4260-4268.
- [Google Scholar]
- Annealing effects on the structural, electrical and optical properties of ZnO thin films prepared by thermal evaporation technique. J. King Saud Univ.-Sci..
- Carbon-doped ZnO nanostructures: facile synthesis and visible light photocatalytic applications. The J. Phys. Chem. C.. 2015;119:20544-20554.
- [Google Scholar]
Appendix A
Supplementary data
Supplementary data associated with this article can be found, in the online version, at https://doi.org/10.1016/j.jksus.2016.08.009.
Appendix A
Supplementary data


