Geophysical mapping of contaminant leachate around a reclaimed open dumpsite
⁎Corresponding author. Wasiu.raji@gmail.com (W.O. Raji)
-
Received: ,
Accepted: ,
This article was originally published by Elsevier and was migrated to Scientific Scholar after the change of Publisher.
Peer review under responsibility of King Saud University.
Abstract
Very low frequency electromagnetic (VLF-EM), 2D Electrical Resistivity Profiling (2D ERP) and Vertical Electrical Sounding (VES) methods of geophysics were deployed to map the extent of leachate contamination in near-surface rocks around a popular reclaimed dumpsite in north central Nigeria. Two years after abandon and waste excavation; the dumpsite was converted to a residential area with over 80 houses under construction. Prior to waste dumping operation, clay-seal was installed at 2 m depth around the dumpsite to prevent leachate from the waste material flowing to the adjoining area. Results from VLF, 2D ERP, and VES show presence of leachate contamination in rocks and soil of the reclaimed dumpsite. Leachate has spread laterally up to a distance of about 1 km on the northern and southern parts of the dumpsite centre, and up to a depth of about 20 m. Compared to the results of similar survey in an area outside the dumpsite, leachate infiltration raised the conductivity signature of the rocks around the dumpsite by about 200%: from 7% to 22%. Both VLF-EM and 2D ERP show the presence of approximate north – south oriented structures/fracture characterised by high conductivity. VES results show the presence of four – five geo-electric layers. Important conclusions from the study are that (i) leachate is still present in the rocks and soil of the reclaimed dumpsite two years after the abandonment and excavation of the waste materials, and (ii) the clay seal installed around the dumpsite could not prevent leachate migration to the adjoining areas.
Keywords
2D electrical resistivity profiling
Very low frequency electromagnetic
Vertical electrical sounding
Leachate contamination
Crystalline rocks
Open dumpsite
1 Introduction
Open dumpsite is a common method of waste disposal in developing African countries. Some of these dumpsites are sited within the metropolis. They are poorly constructed or maintained, open to the air, and are unregulated. As air and water from rain mix with the decomposed waste materials, contaminants from the solid wastes are extracted into the liquid phase to form leachate. The characteristics and volume of leachate produced in a dumpsite depend on the composition of the waste materials, availability of moisture, and the local temperature conditions. Dumpsite leachate is the worst known source of shallow groundwater aquifer contamination (MacDonald et al., 2012). Depending on the topography, hydrology condition, and the rock type within the locality, leachates can travel several metres of vertical and horizontal distance, thereby polluting soil, rocks, surface water, and groundwater (Bernstone et al., 2000).
Human dependence on groundwater is very high. Most local communities in Africa source drinking water from individually owned water wells; some of the wells are less than 5 m deep (Olasehinde and Raji, 2007; MacDonald et al., 2012; Abubakar et al., 2014). Shallow aquifers are vulnerable to leachate contamination. Consumption of leachate-polluted water is a known source of gastrointestinal illness, reproductive problems and neurological disorder (WHO report, 2006) especially in children and pregnant women. Study on dumpsite-derived leachate is important for assessing the impact of dumpsite on community health. Geophysical methods used for this study include Very Low Frequency Electromagnetics (VLF-EM), Electrical Resistivity Profiling (ERP), and Soil Conductivity Test (SCT). Of all the geophysical methods, ERP is the most widely used geophysical method for dumpsite evaluation because it is fast, reliable, affordable, and non-destructive.
Rocks and soil are generally poor conductors of electric current. Rock and soil infiltrated by leachate or contaminated water may contain significant amount of dissolved ions that can raise their conductivities from poor or moderate to anomalous-high (Karlik and Kaya, 2001). Very Low Frequency Electromagnetic (VLF-EM) and 2D Electrical Resistivity Profiling (2D ERP) methods of geophysics are particularly suited for contamination study. The methods have been successfully used for dumpsites and landfill evaluation studies, to map leachate flow around dumpsites, to study groundwater contamination, and to characterise geo-electric layers (Dodds and Ivic, 1988; Carpenter et al., 1991; Powers et al., 1999; Bernstone et al., 2000; Karlik and Kaya, 2001; Stanton and Schrader, 2001; Porsani et al., 2004; Ogilvy et al., 2002; Olasehinde and Raji, 2007; Sundararajan et al., 2007; Boudreat et al., 2010; Osinowo and Olayinka, 2012; Ramalho et al., 2013; Naudet et al., 2014). Very low Frequency Electromagnetic Method (VLF-EM) is a geophysical ground probing techniques that utilises Very Low Frequency signals (in the range of 10–30 KHz) normally used for submarine and military communication. VLF-EM method relies on transmitted currents inducing secondary responses in conductive geologic units. While soils and rocks generally possess low to moderate conductivity, high positive VLF-EM signatures are expected of leachate contaminated rocks and soils.
Electrical resistivity method of geophysics is based on electrolytic conduction, where current and potential electrodes are coupled to the ground and connected to resistivity metre through conducting wires (Dobrin, 1976; Burger et al., 1992). The rule of thumb is that the farther apart the current electrodes, the deeper the depth of penetration (Dobrin, 1976; Zohdy, 1989). While moderate resistivity values are expected in rock units saturated with fresh water, very low resistivity values are diagnostic of the presence of dissolved ions probably derived from leachates (Santos et al., 2006). The aim of this study is to map leachate contamination in soil and rock units around the reclaimed dumpsite in order to know if the clay-seal installed in the area was able to prevent leachate flow to the adjoining areas. In addition to mapping the contaminant leachate, the study seeks to (i) investigate the vertical extent of leachate migration with the objective of determining the depth to ‘safe aquifers’ in the area, (ii) determine the number of geo-electric layers, and (iii) estimate depth to fresh basement rock
2 The study area
The study area is an abandoned open dumpsite along Asa–Dam Road, Ilorin metropolis, north central geo-political zone of Nigeria. The study area is a part of Ilorin NW Sheet, lying between longitude 4°30′E and 4°38′E and latitude 8°27′N and 8°31′N. Prior to its use as dumpsite about 12 years ago, vegetation covering the area was removed and the topsoil was excavated to about 2 m depth. Part of the excavation depth was filled with a clay-seal called bentonite (personal communication, 2016) to prevent leachate flow to the adjoin area. Bentonite is a low permeability self-sealing clay that can provide barrier to the free flow of fluid. The dumpsite was not engineered, fenced, or covered. It received unknown quantity of municipal wastes from various parts of the city, and industrial wastes from paint, ceramics, detergent and cigarette companies among others. During dry season, wastes in the dumpsite are frequently burnt to reduce its volume. After about 10 years of operation, the dumpsite was abandoned for two years. Waste materials was excavated and moved to another dumpsite. The dumpsite has been converted to residential area with over 80 housing units under construction. Field study and geophysical mapping took place in the year 2014, during dry season. Fig. 1 shows the geological map of Nigeria and the site diagram of the study area.
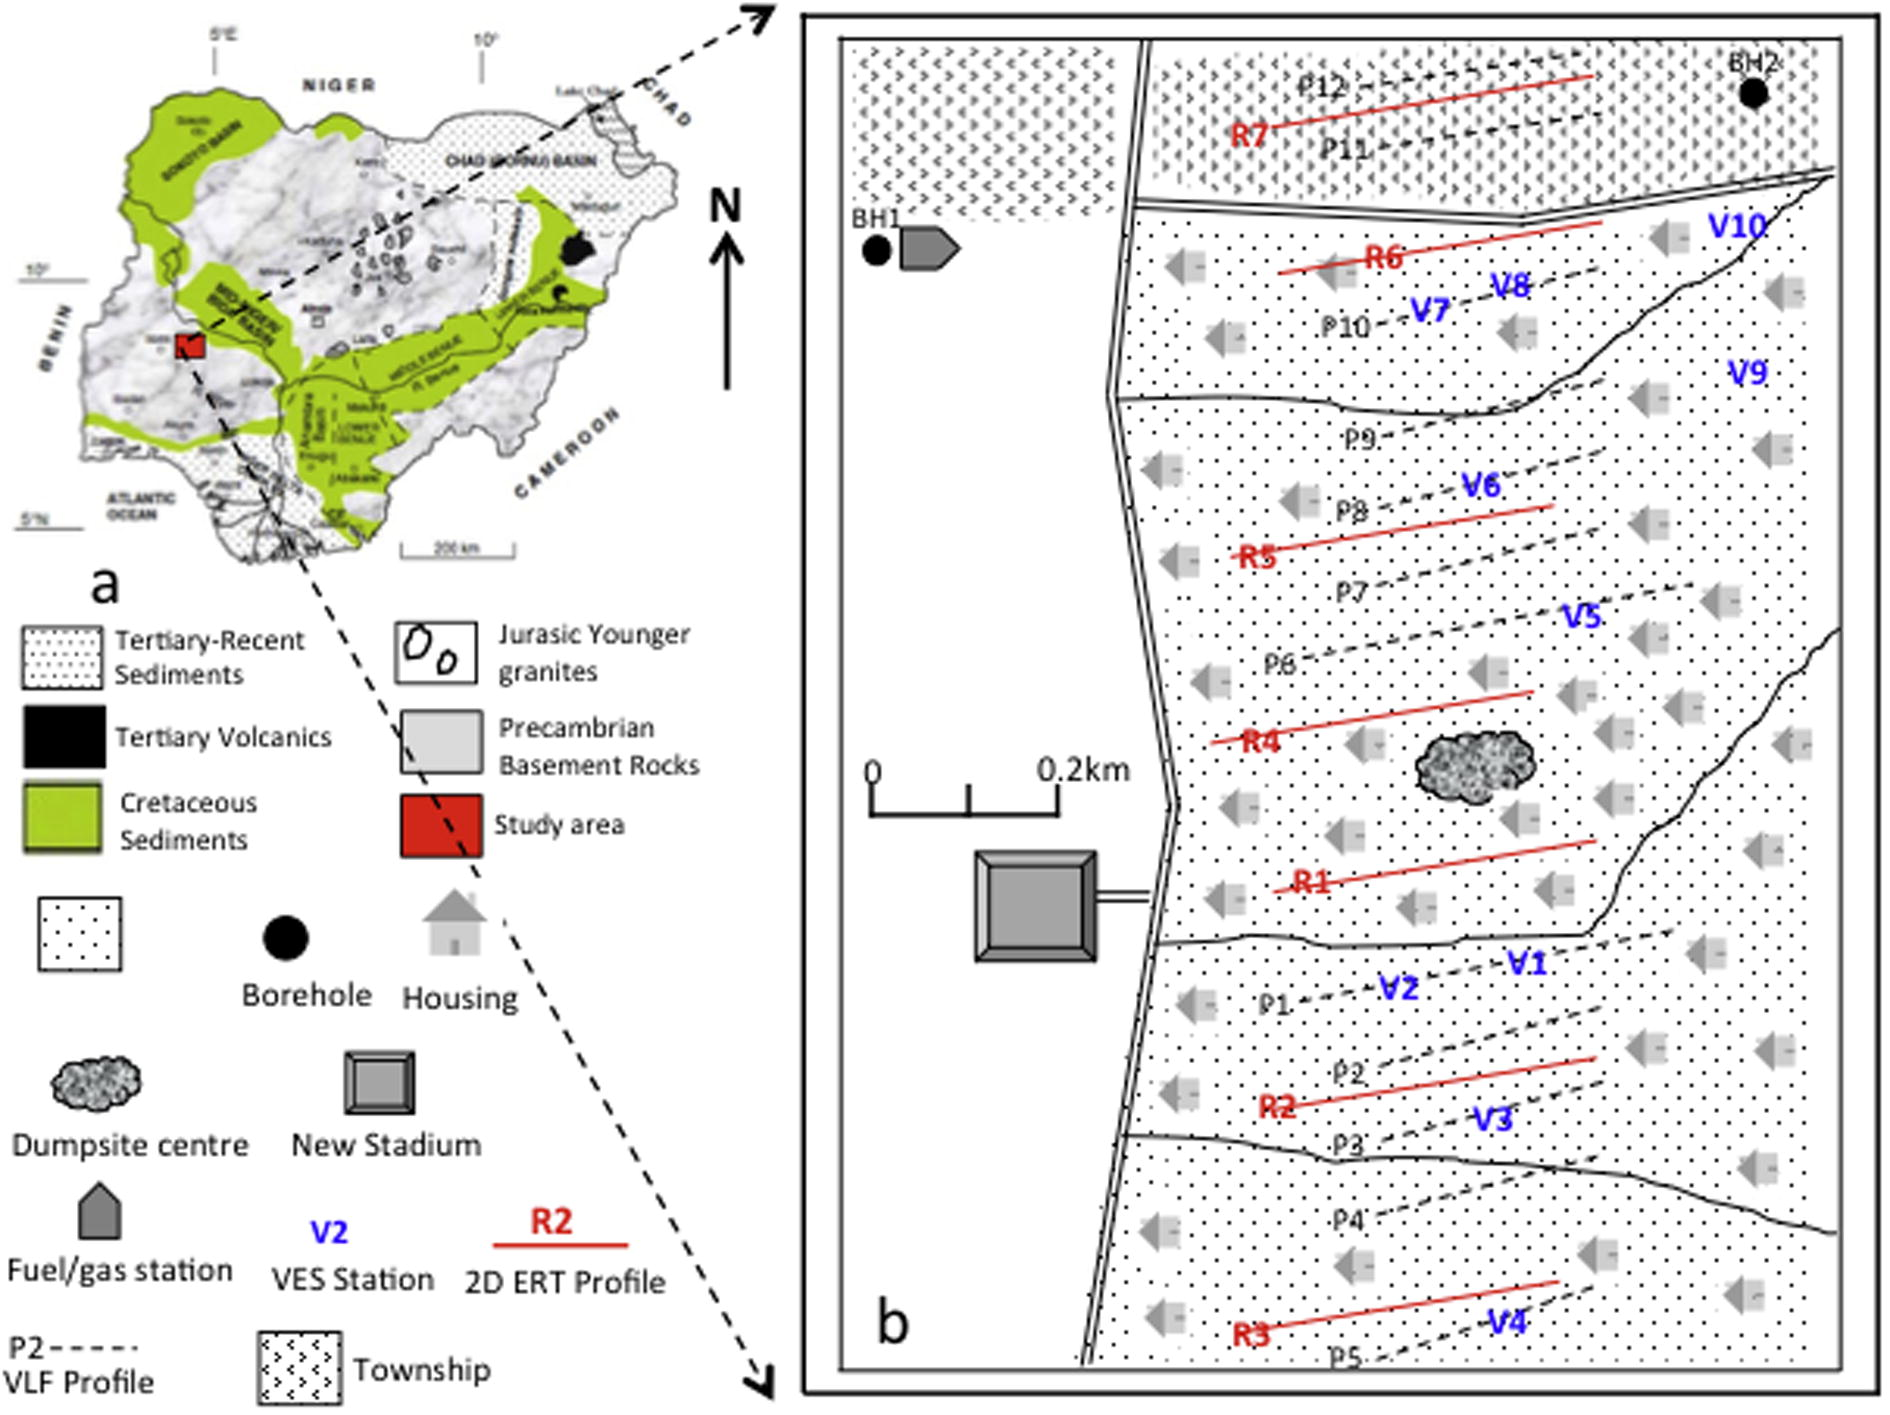
- (a) Geological map of Nigeria. (b) Site map of the study area showing VLF profiles, 2D ERP profiles, VES stations, borehole locations, and rock types in the study area.
2.1 Climate, topography, and drainage
Ilorin is situated in the transition zone between the forest and the guinea savannah regions of Nigeria. It experiences two major climatic seasons (i.e. rain and dry seasons). Its annual rainfall varies between 1250 and 1500 mm, and its daily temperature ranges from 20.5 °C to 34 °C with an average of 27 °C (Ajibade, 2002). The rainy season is between April and October while dry season occurs between November and March. Drainage pattern is dendritic with Asa River being the major river. Agba, Osere, Okun, Alalubosa, and Aluko Rivers drain to River Asa, which flows in the south-northern direction. Asa River in turn drains to River Niger (Olasehinde, 1999). Topography is high and undulating.
2.2 Geological mapping, and hydrogeology of the area
The study area is a part of the basement terrain. It lies in the Central Nigeria Geo-political Zone, between the south-western boundary of the Precambrian crystalline rocks and the north-central edge of the upper Cretaceous sediments of Bida Basin. In the study area, crystalline rocks out crop sparsely in few places, and are in many places covered by the poorly sorted medium-coarse grained sandstones. At shallow subsurface, the crystalline rocks have been fractured and disjointed by tectonic activities, and weathered by in situ chemical weathering resulting from the prolong rock-water interaction. Rocks mapped in the area include Migmatite gneisses, Granites gneiss, banded gnesiss, quartzite and schist that have been reworked and intruded by pegmatites and quartzites (Oyawoye, 1964; Rahaman, 1976; McMurry and Wright, 1977; Jones, 1985; Annor et al., 1987). Some of the rocks mapped in the area are shown in Fig. 2. Structural features mapped on the rocks include, foliations and dip structures, joints, and fractures. The profound fracture orientation is approximately north-south. The rocks are dipping to the east with angles ranging from 25° to 32°.
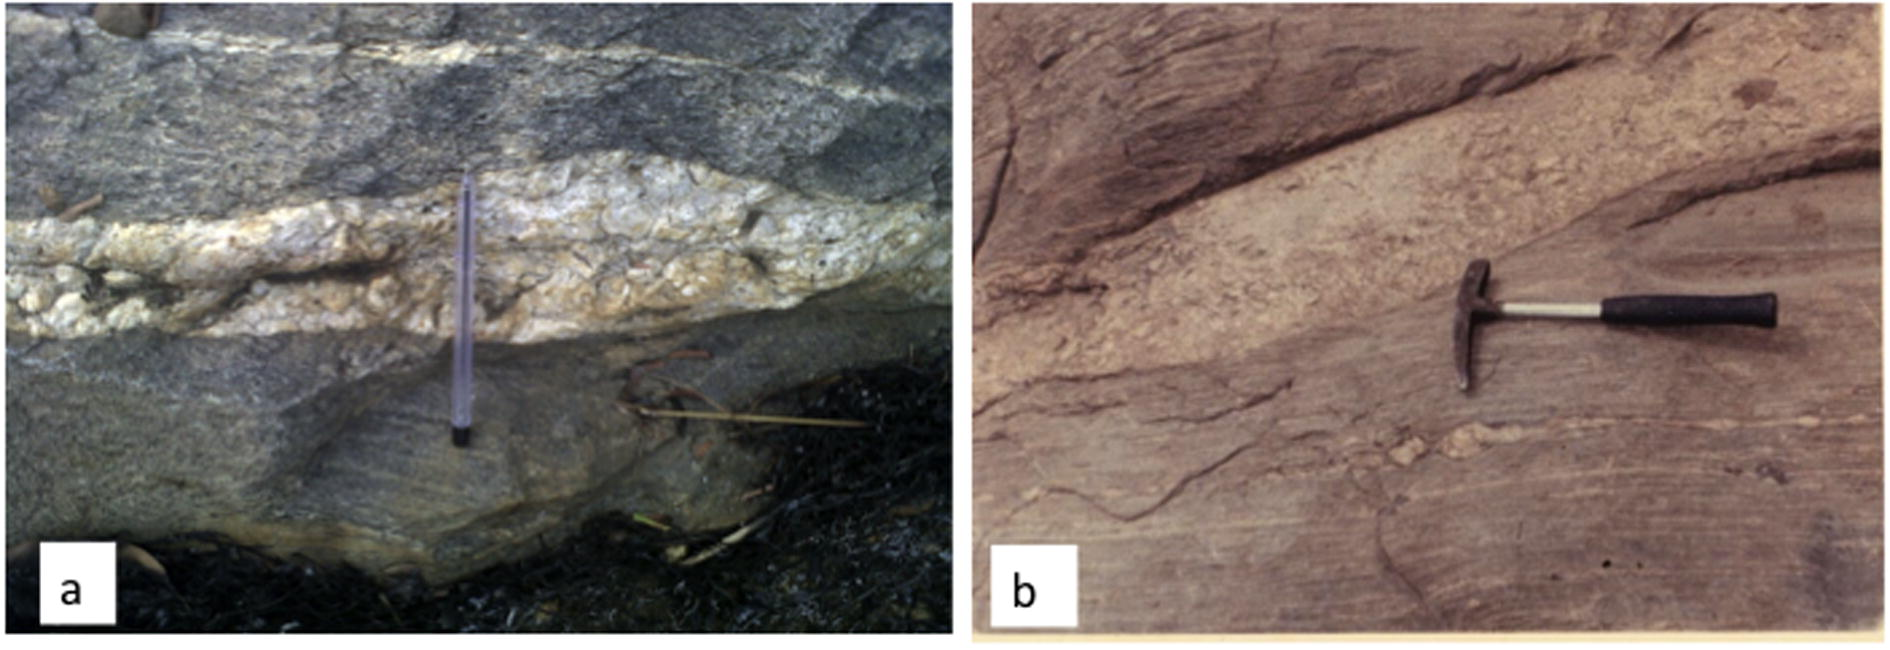
- Some of the rocks mapped in the study area. Left-Granite gneiss, Right-Banded gneiss crosscut by pegmatite.
In the basement complex of Nigeria, weathered rocks and fracture basement rock form the groundwater aquifers because they have high porosity and high transmissivity that aids groundwater abstraction and recharge. Groundwater aquifers occur in localised and disconnected aquifers system. Aquifer recharge is through rainwater and river system. The aquifers have irregular characteristics and limited extent (Oteze, 1981; Tijani, 1994; Olasehinde and Raji, 2007; Osinowo and Olayinka, 2012). Shallow aquifers are susceptible to contamination from dumpsite leachates. Aquifer types in the study area are unconfined and semi-confined depending on the nature of the overburden material. Hydraulic communication between aquifers at great depth is by secondary porosities created by fractures and joints in the rocks. Groundwater flow in the study area is aided by sloppy topography.
3 Geophysical data acquisition and processing
3.1 VLF data acquisition and processing
VLF-EM transmitter stations are available across the world. They are primarily used for submarine communication to transmit radio signal at frequencies that range from 10 KHz to 30 KHz. VLF-EM field measurement for this study proceeded with the selection of a 15.8 KHz transmitter that provides a primary electromagnetic field that is north-south oriented and approximately parallel to the strike of the rocks in the study area. Conductive bodies at the study area provided the secondary electromagnetic field that is shifted in phase to the primary electromagnetic field. A WADI (ABEM) VLF equipment is used to measure the vertical (
There were five profiles on each side (north and south) of the dumpsite centre, and two other profiles outside the dumpsite area (Fig. 1). Profiles were oriented approximately east-west direction. Profile length varies from 220 m to 450 m depending on space availability as buildings in the area constitute obstruction to the VLF profile length. Only the real component of the data is used for our study. The real component of the data is filtered following the method of Fraiser (1966). Using the method of Karous and Hjelt (1983), the filtered real component of the data is used to compute current density pseudo-section for each VLF profile. Computation and plotting of current density pseudo-section is done with the aid of KHFILT inversion software (Pirttijarvi, 2004). The inversion uses skin depth normalisation that compensates for the effect of attenuation with depth. Current density pseudo-sections inverted for the profiles in the south and north of the dumpsite are shown in Figs. 3 and 4 respectively. Profile 1 is 300 m south of the dumpsite centre. Profiles 2, 3, and 4 are separated by 150 m while profile 5 is 250 m from profile 4. Similarly, profile 6 is 300 m north of the dumpsite Centre; profiles 7, 8, and 9 are separated by 150 m, while profile 10 is 250 from profile 9. The two profiles outside the dumpsite were to serve the purpose of comparison to provide a basis for VLF anomaly interpretation for the dumpsite area. The result for the two profiles are shown later in this section.
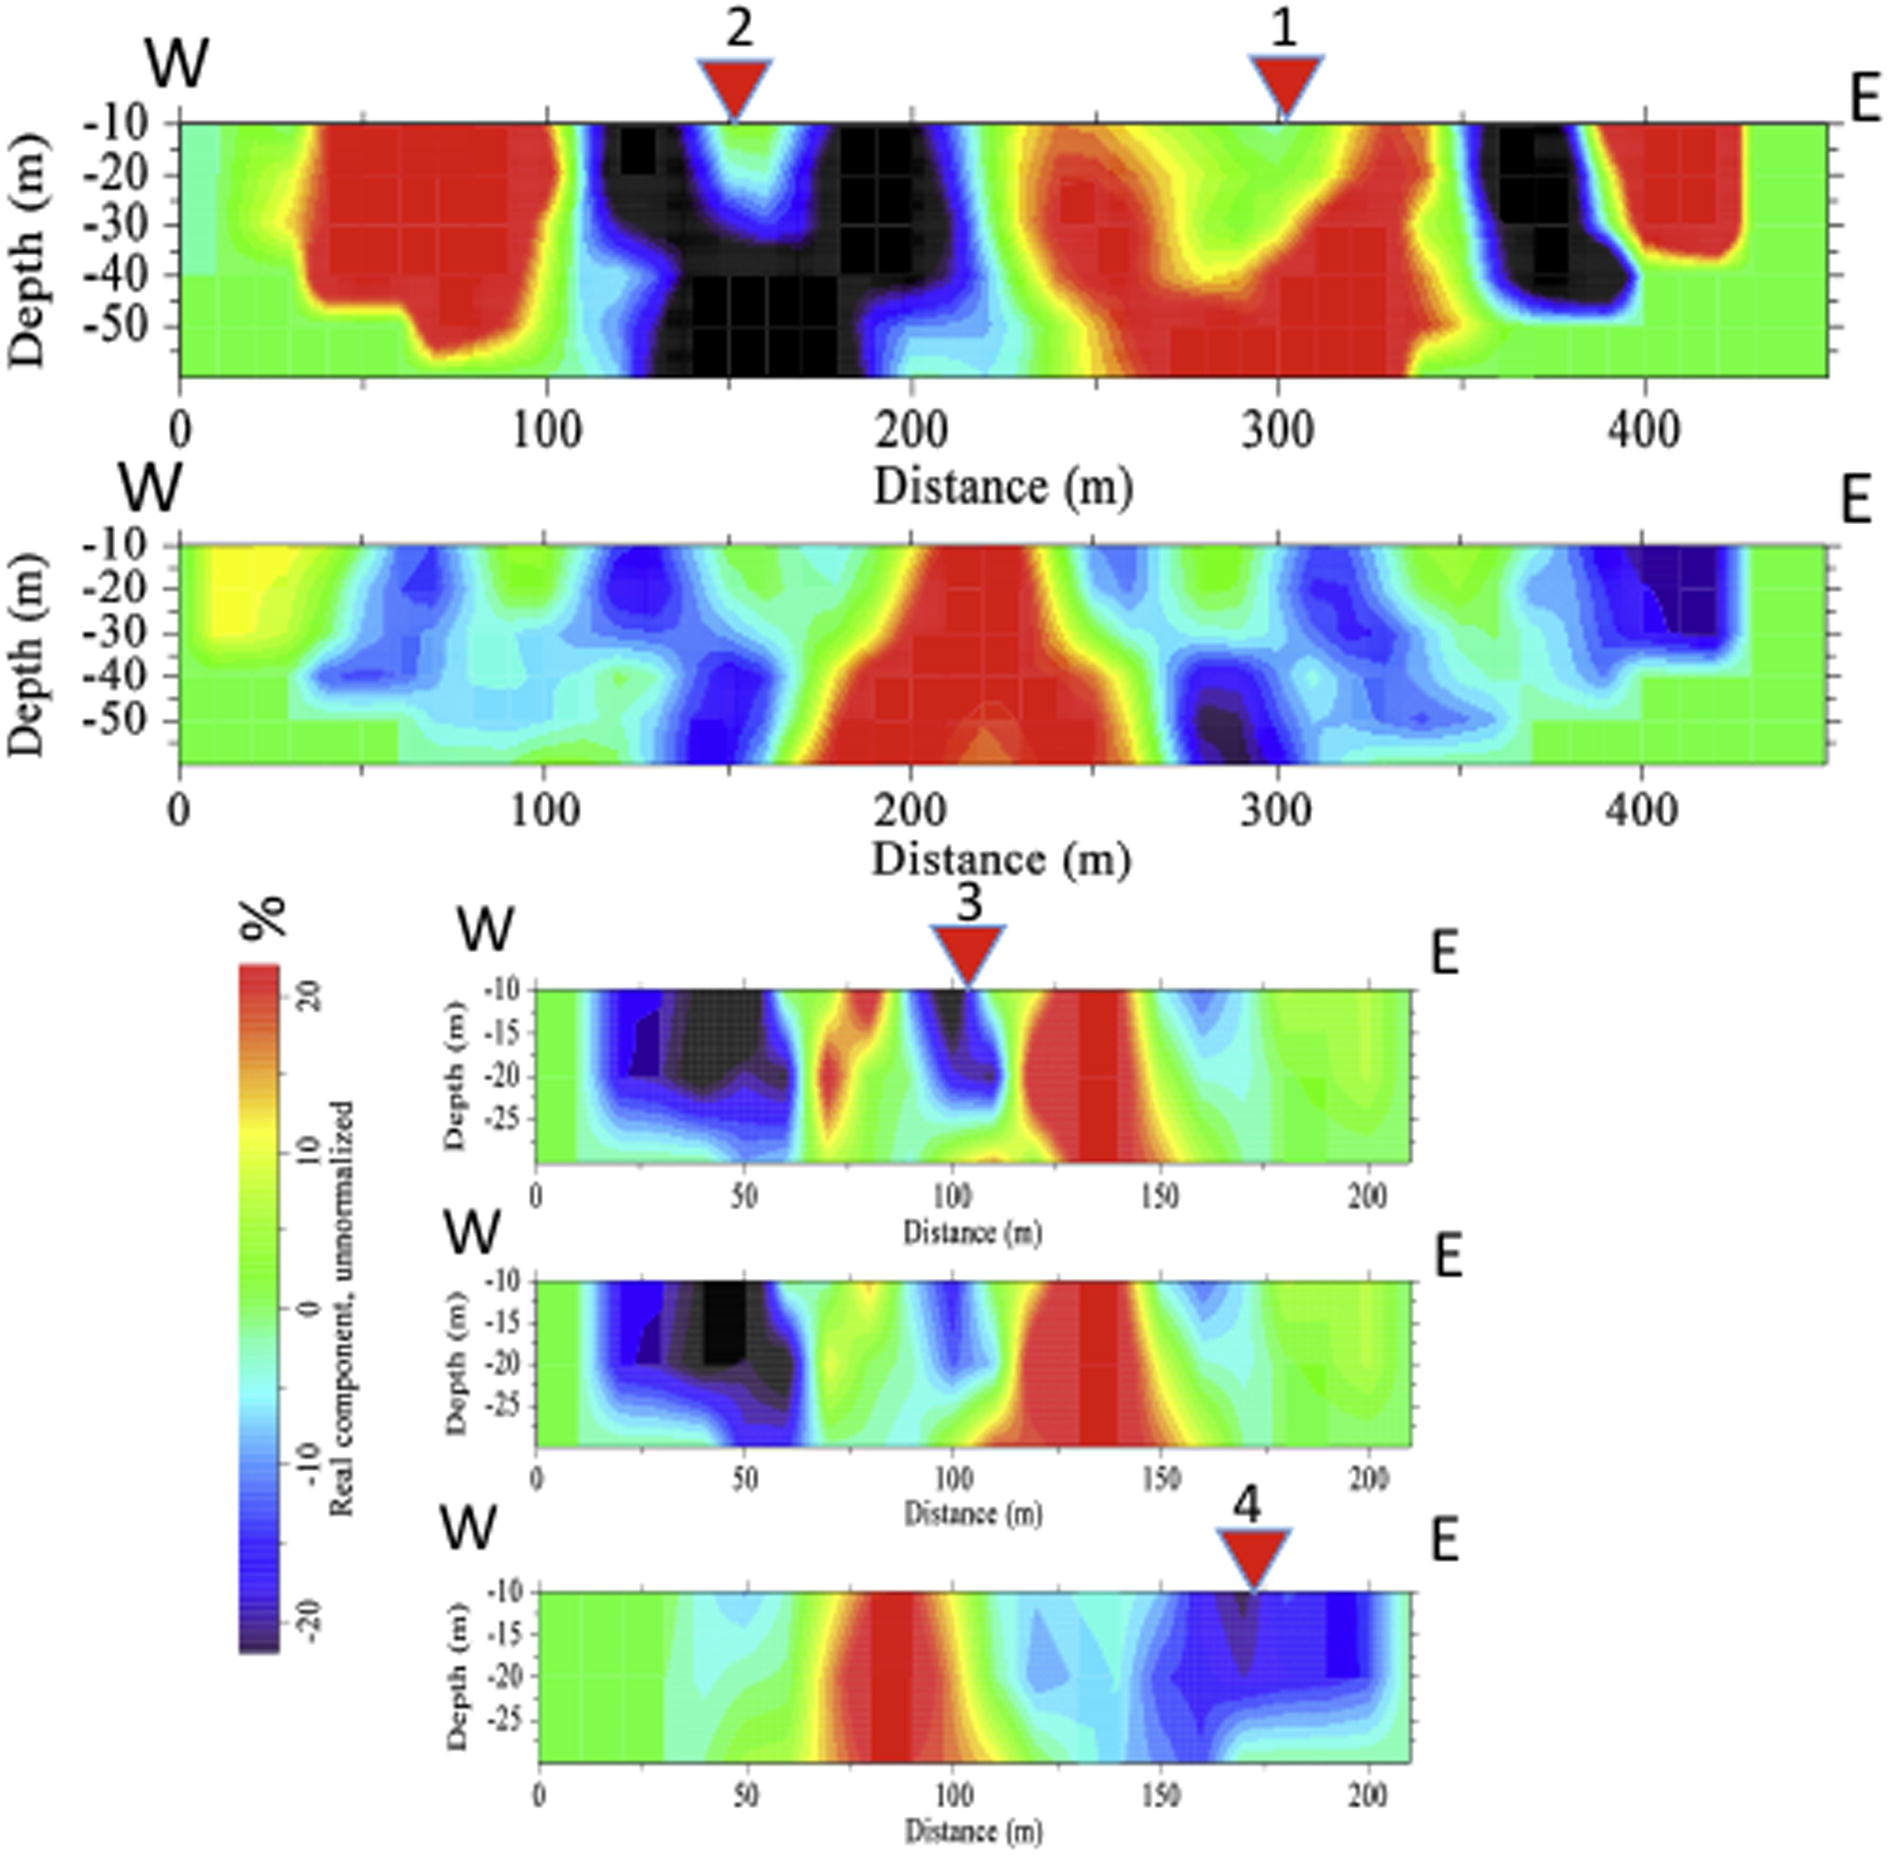
- Current density pseudo-section along VLF profiles 1–5 – from top to bottom (south of the dumpsite). Light colour represents high current density (i.e., high conductivity); dark colour represents low current density (i.e., low conductivity). VES stations are indicated on the profiles.
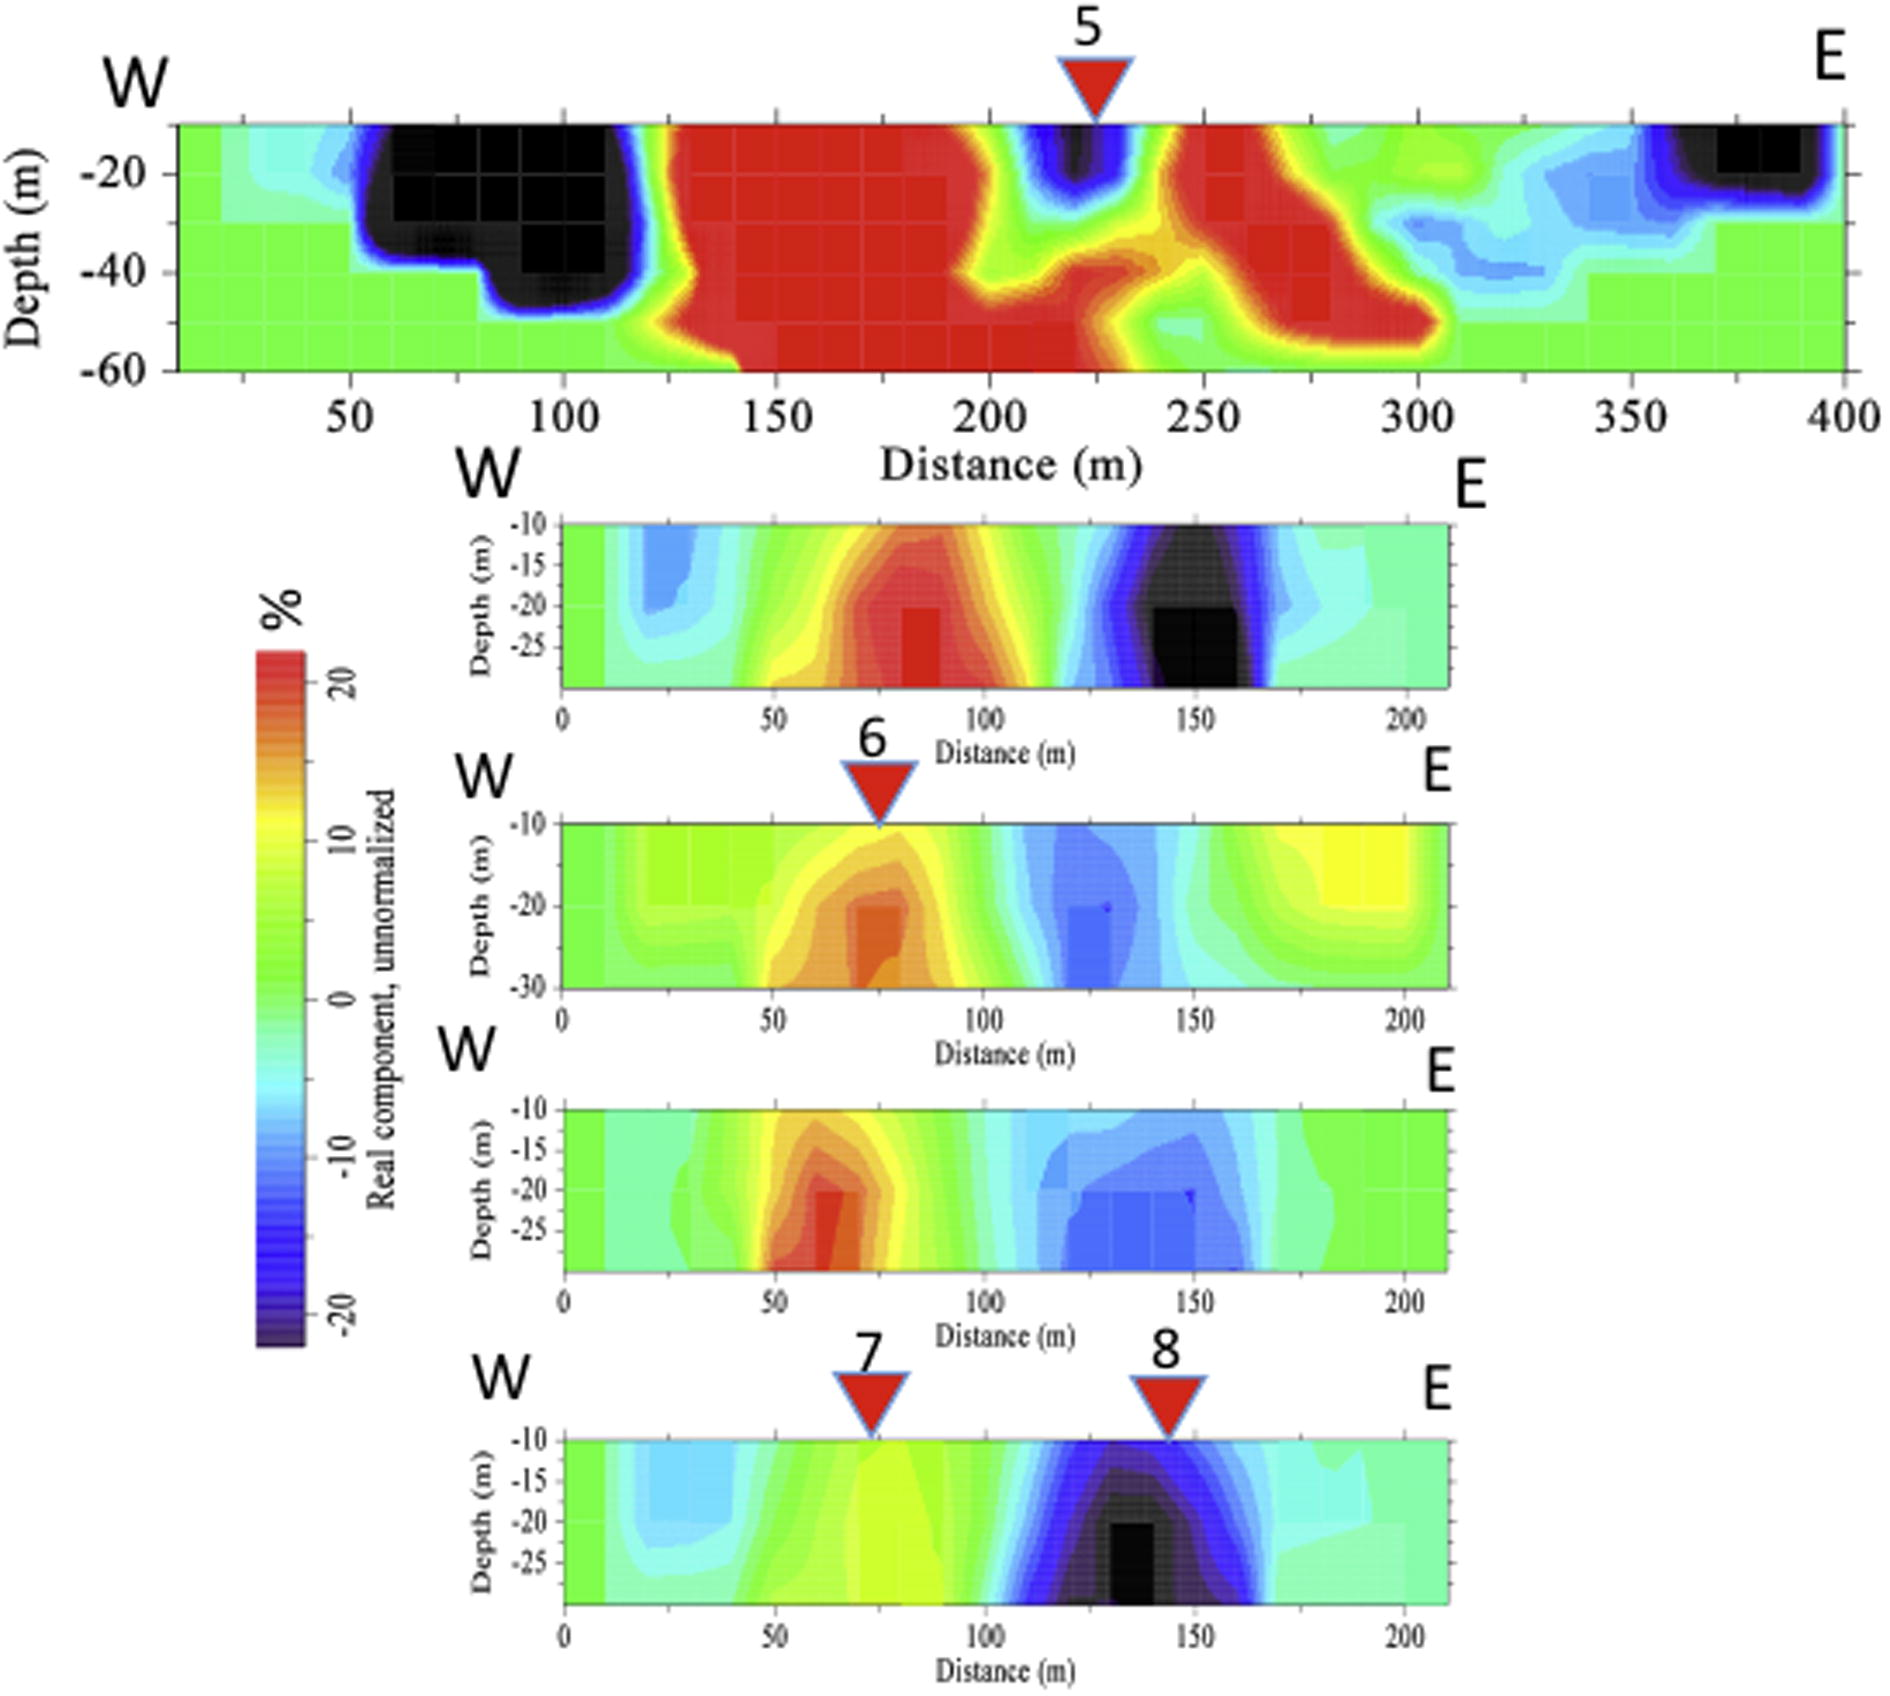
- Current density pseudo-section for VLF profiles 6–10 – from top to bottom (northern part of the dumpsite). Light colour represents high current density/high conductivity; dark colour represents low current density/low conductivity. VES stations are indicated on the profiles.
3.2 Electrical resistivity data acquisition and processing
1D VES surveys were undertaken at predetermined locations as shown in Fig. 1. The survey took place within the same month of VLF measurement – after interpreting VLF results. The objective of VES survey is to determine the number of geo-electric layers, the depth to fresh basement rocks, and to probe some conductivity structures observed in VLF results. VES data were treated to attenuate noise and spurious data using a code built in Matlab. The code uses four neighbouring data filtering system. Then, the filtered data are plotted on bi-logarithm paper as shown in Fig. 5. At first, the curves are interpreted manually using master curves (Koefoed, 1979; Orelana and Mooney, 1960) to obtain the geo-electric parameters of each layer. Then, filtered data were input to a resistivity inversion programme (Alex et al., 2002) for detailed interpretation. The number of layers obtained from manual interpretation is used to set the maximum and minimum layers number for the inversion scheme. For an example, where 4 layers are interpreted for a VES curve, a minimum of three and maximum of five layers are set for the VES inversion scheme. The field data curve and theoretical curve converge after a few iterations. The misfits range from 0.98% to 3.1%. The geo-electric parameters interpreted from the results are presented in Fig. 6a and b. The interpretation is guided by lithological logs from boreholes in the area (Fig. 6c).
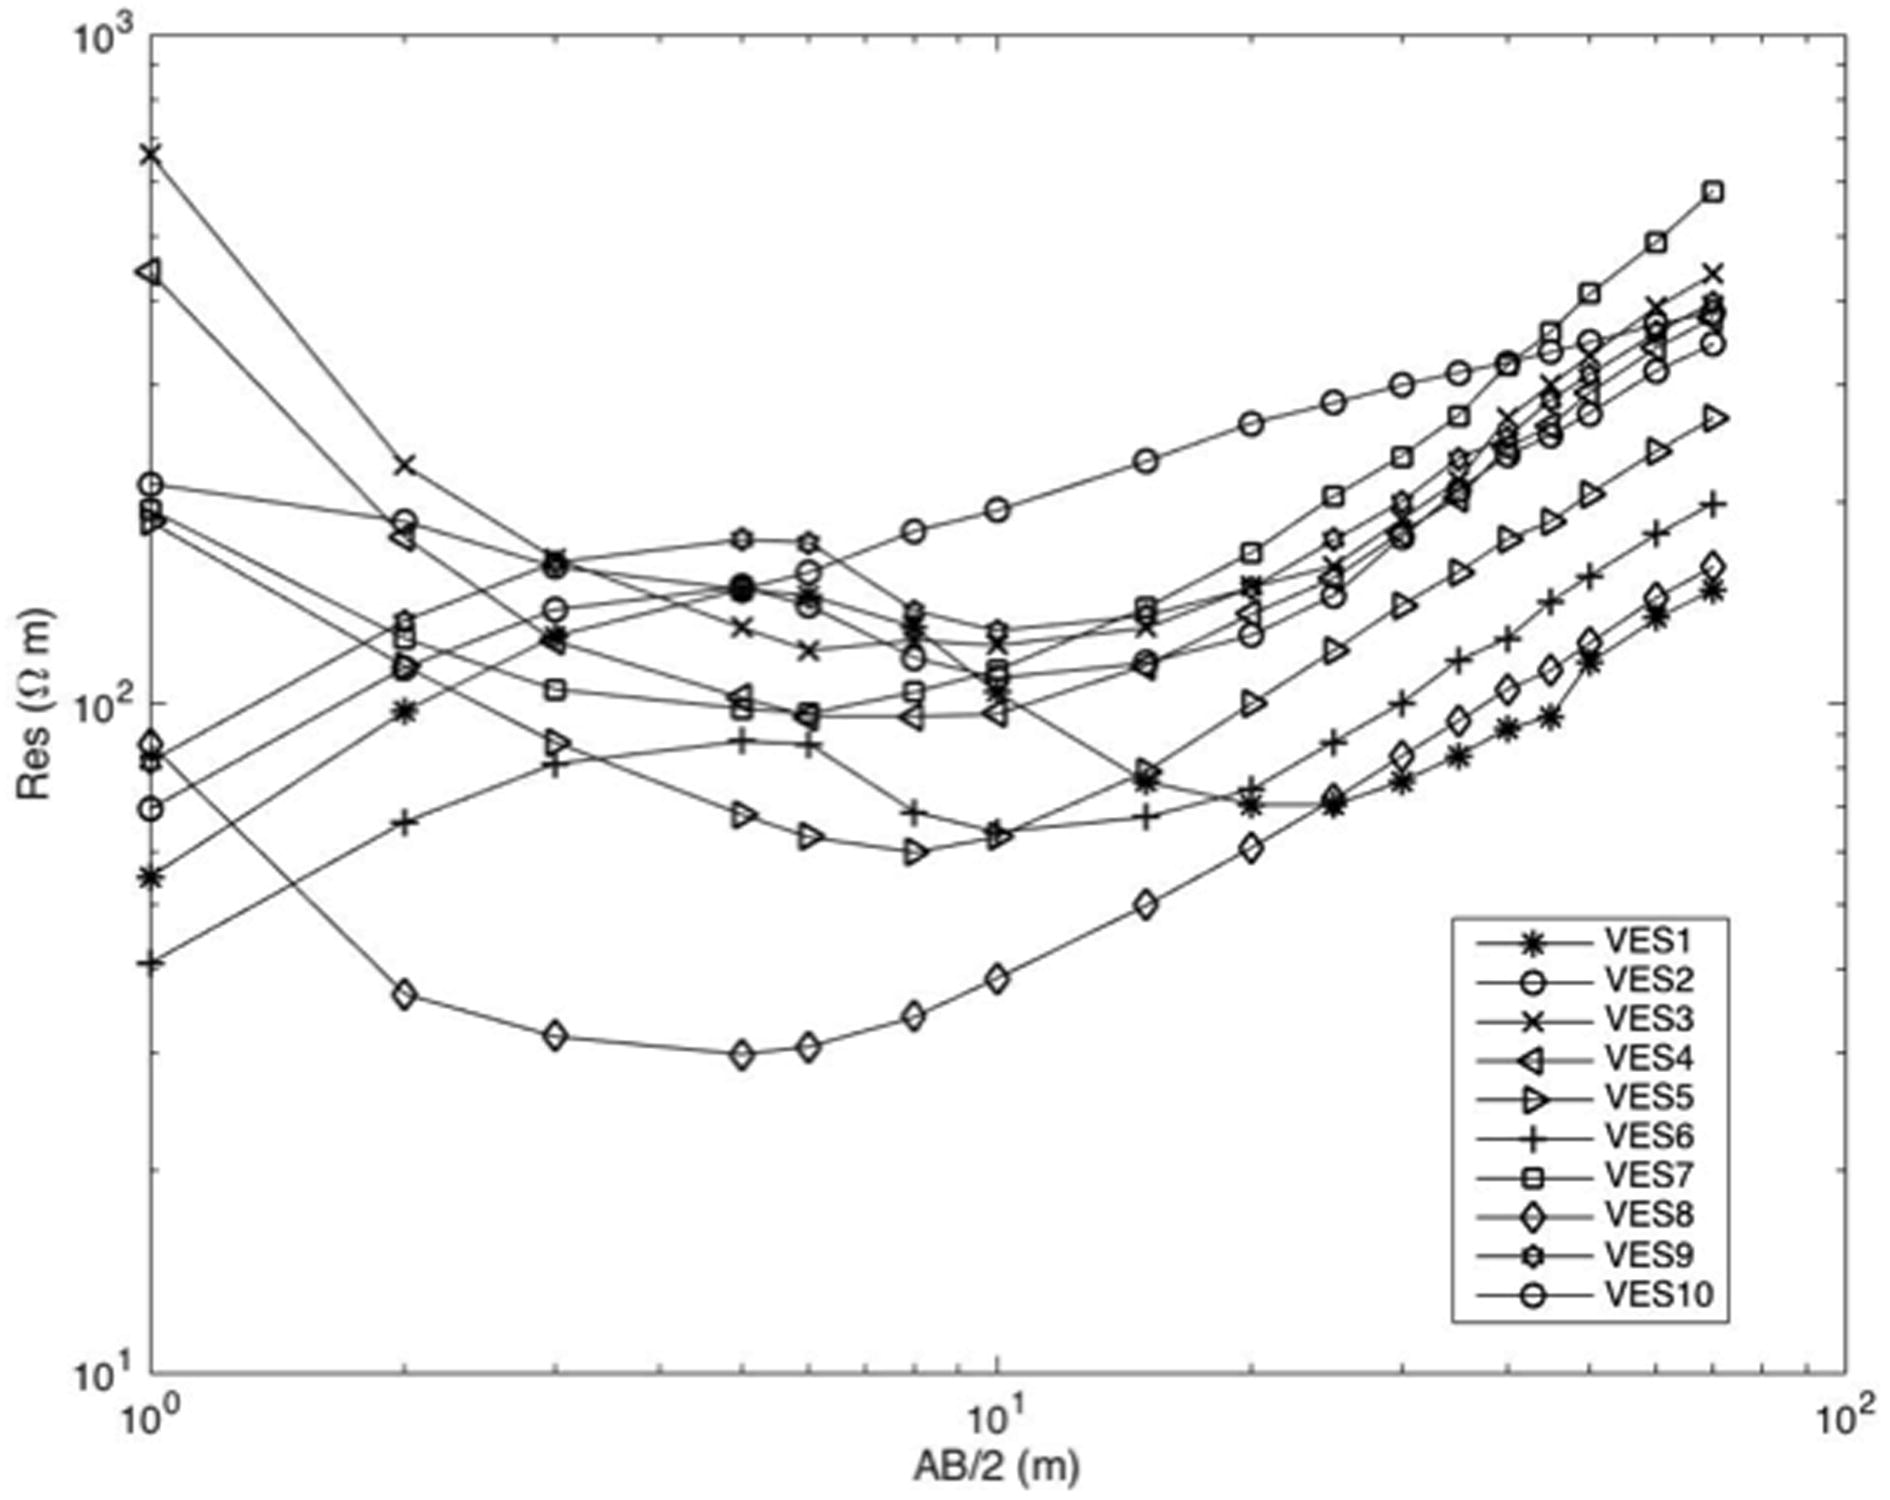
- Log-log plots of vertical electrical sounding data for VES stations 1–10.
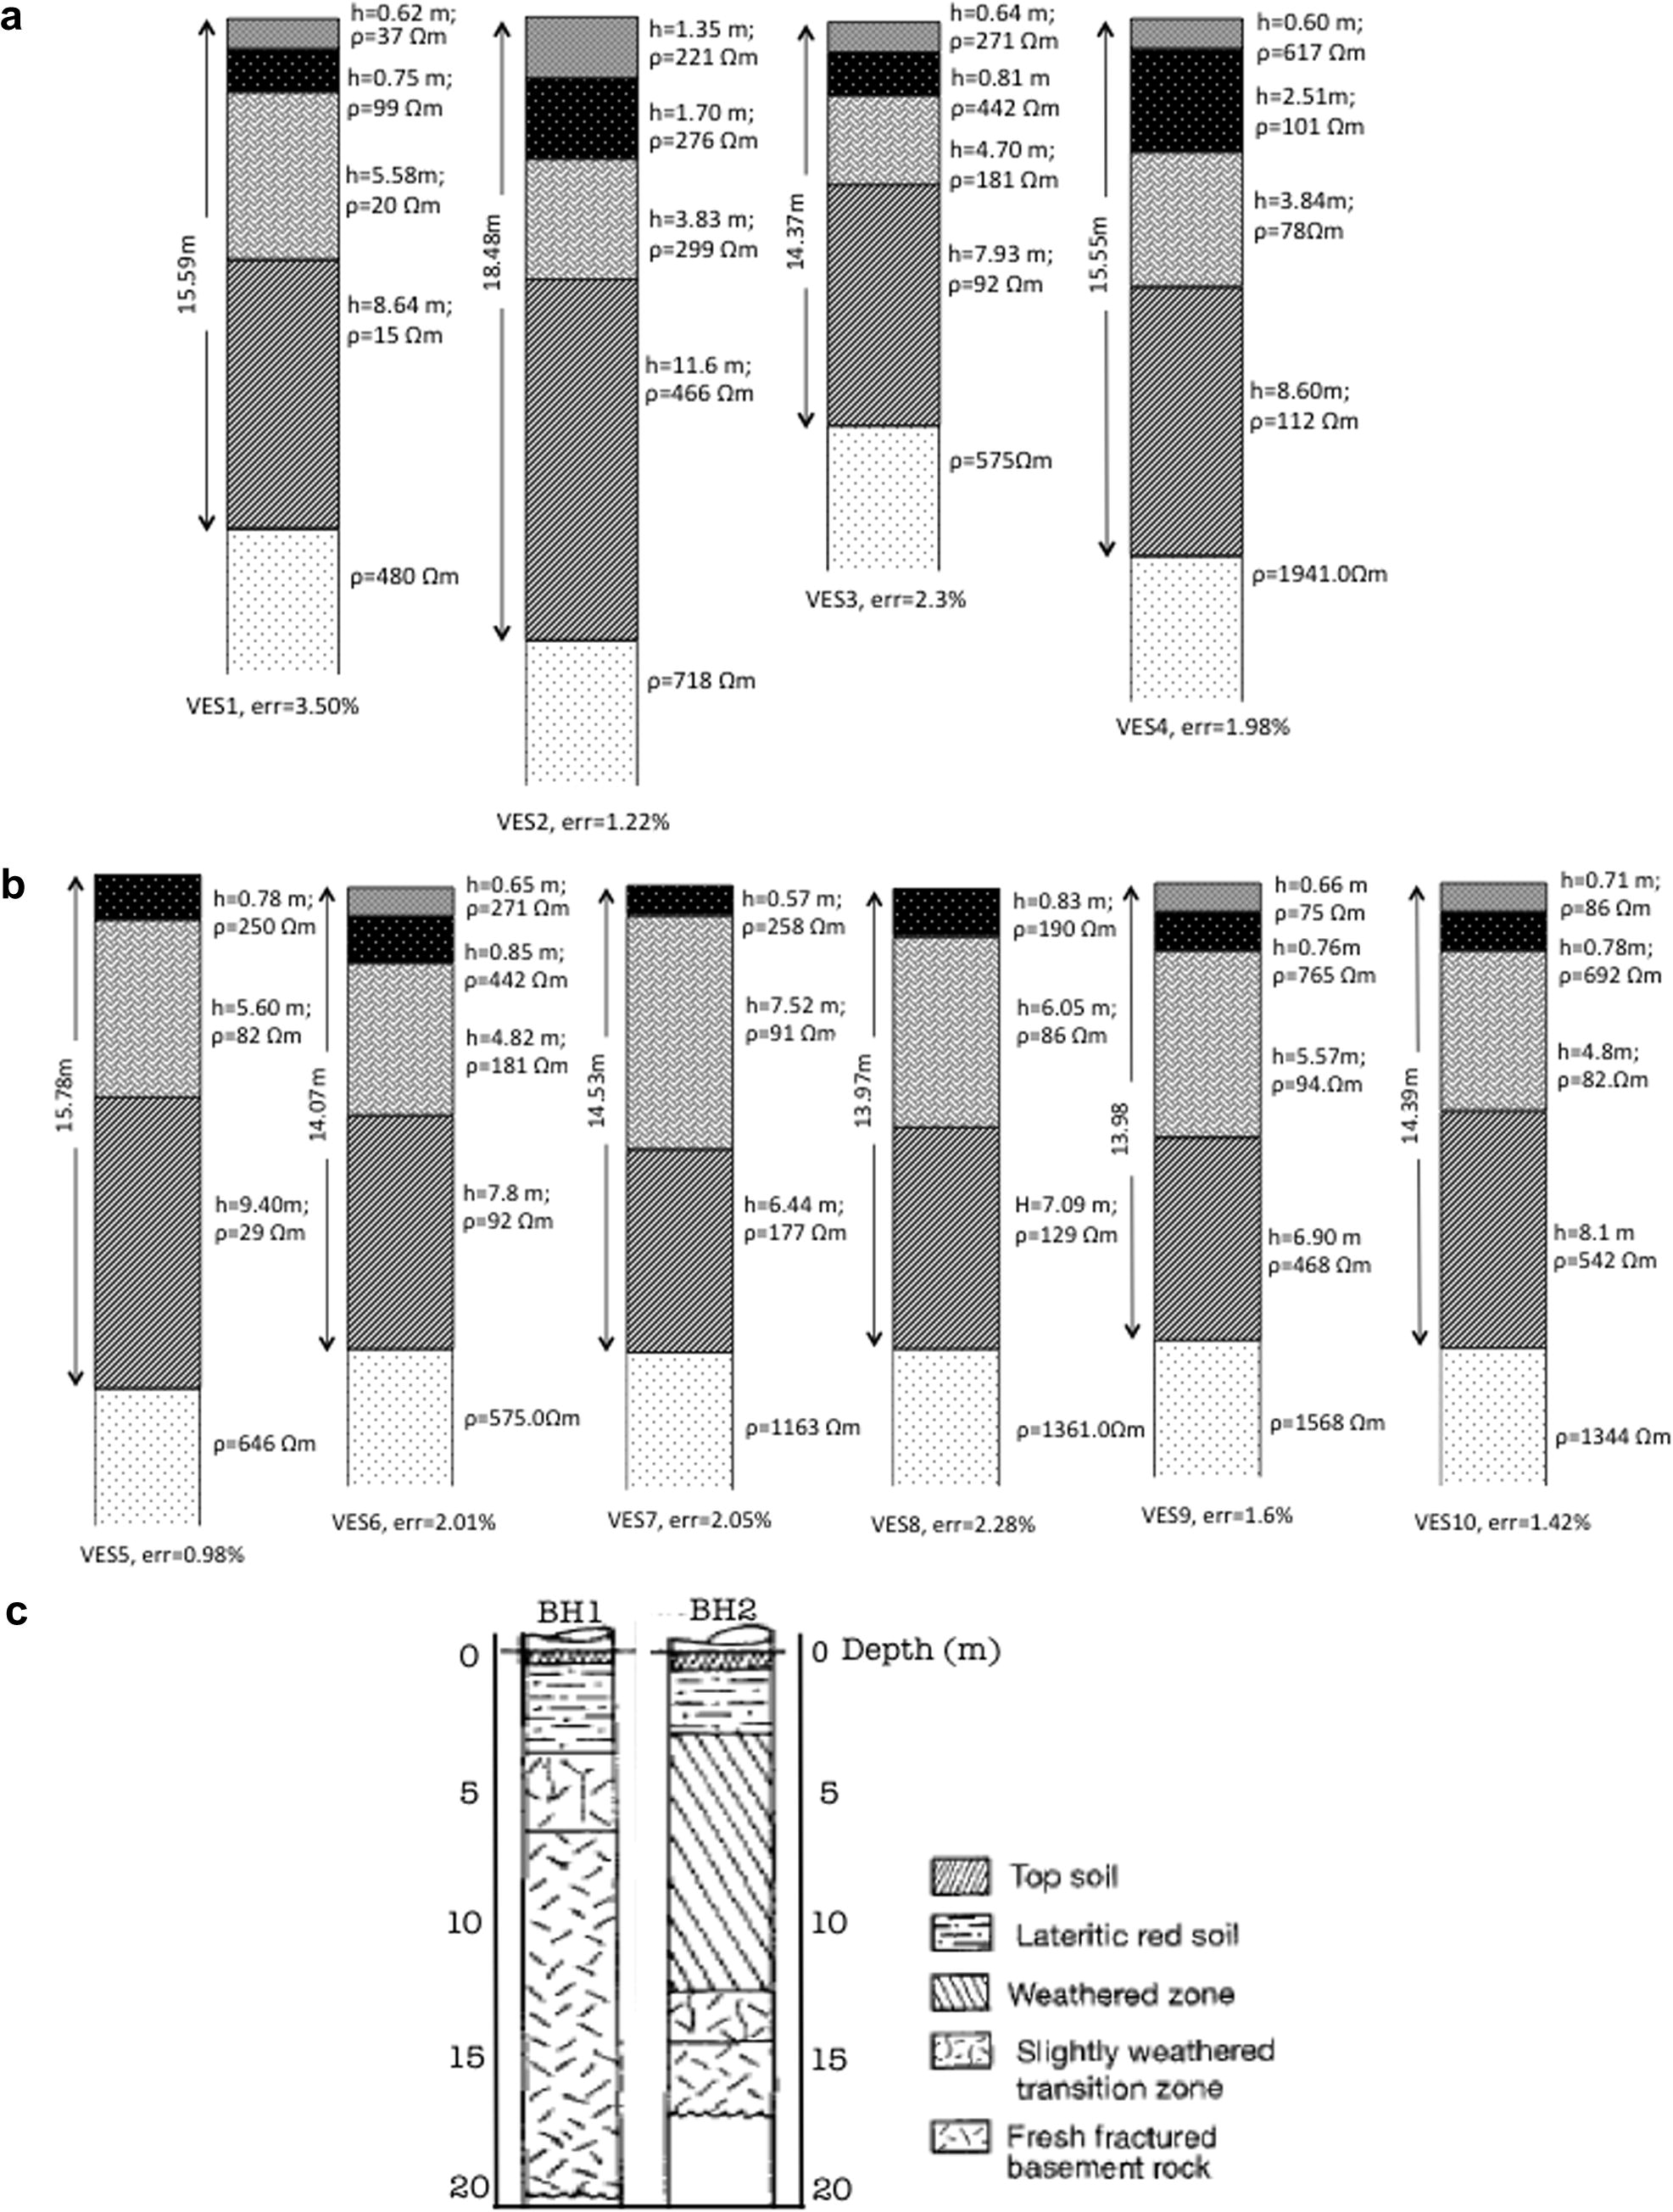
- Schematic diagram of geo-electric parameters interpreted from VES stations around the dumpsite showing the different geo-electric layers, thickness of each layers, and their resistivities. (a) Result of VESs 1–4 data from the south. (b) Results of VESs 5–10 data from the North. (c) Lithological log for boreholes 1 and 2 in the study area.
2D Electrical Resistivity Profiling (2D ERP) data were acquired around the VLF profiles lines. The field equipment consists of a SuperSting R8/IP terrameter, a multichannel box, connecting wires, and 84 electrodes. The electrode system consist of 12 channels with each channel having 7 electrodes, the connecting wires have a total length of 840 m. To achieve a dense survey with reasonable depth penetration, 3 m electrode spacing was used with a Dipole-Dipole electrode configuration. 2D ERP survey lines are shown in Fig. 1. Because of the unavailability of the equipment and other logistic problems, 2D ERP survey took place about five months after the VLF and 1D VES surveys. 2D ERP lines could not be placed exactly on the VLF profile lines due to the obstruction to electrode spreading by the increased construction activities in the study area. However, we believe that the time difference in the surveys would not constitute significant difference in the properties of the rock and soil in the area since VLF, 1D VES and 2D ERP measurements were taken before the onset of rainy season.
2D ERP data were processed to remove noise using the elimination method. All the negative valued data points and the spikes were eliminated. Spikes are the positive data points with spurious values. Data inversion was done with the aid of Res2DInv software by GEOTOMO using the least square method. To achieve good resolution, the cell width of the inversion routine is set to half the electrode spacing. This made the number of computation grid points in the tomographic inversion to be twice the number of electrode used. To reduce uncertainties and non-uniqueness of the inversion results, knowledge of the subsurface geology of the area from previous study is used to guide the inversion process (Olayinka and Yaramanci, 2000) assuming nearly horizontal stratigraphy. To emphasise the boundary between the bedrock and weathered rock, robust inversion was used (Loke and Barker, 1996). The resistivity tomograms inverted for the profile data are shown in Figs. 7 and 8. The numbers of 2D ERP profiles are fewer than those of VLF because of the cost of renting the equipment and the time taken to acquire data. The result of the 2D ERP acquired outside the dumpsite is shown in Fig. 9a while the current density pseudo-section computed for the two VLF profiles outside the dumpsite are shown in Fig. 9b.
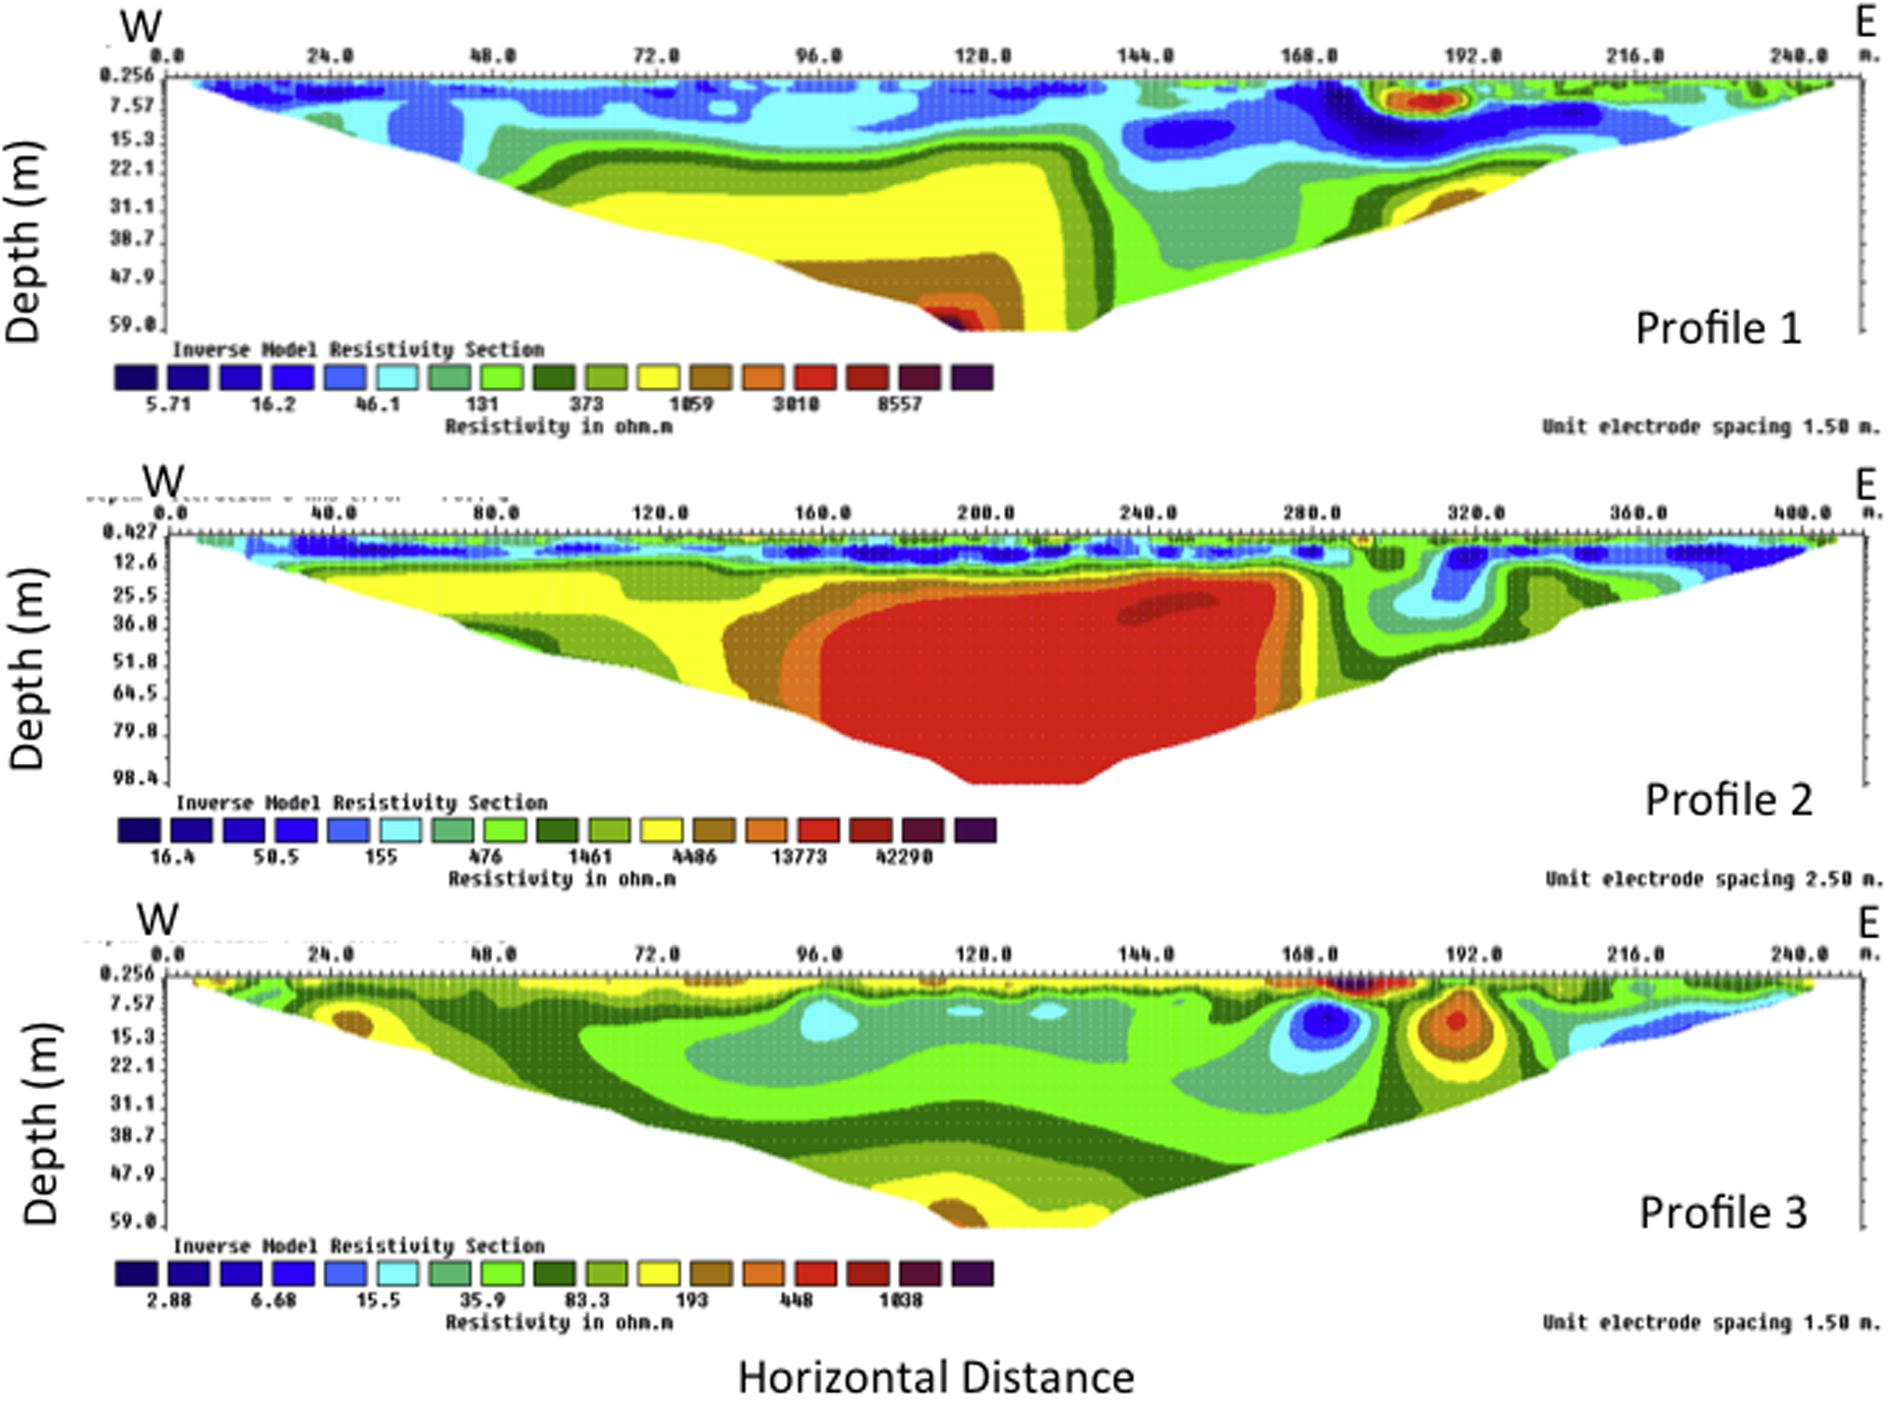
- 2D electrical resistivity tomograms for the ERP profiles 1, 2, and 3 in the southern section of the dumpsite.
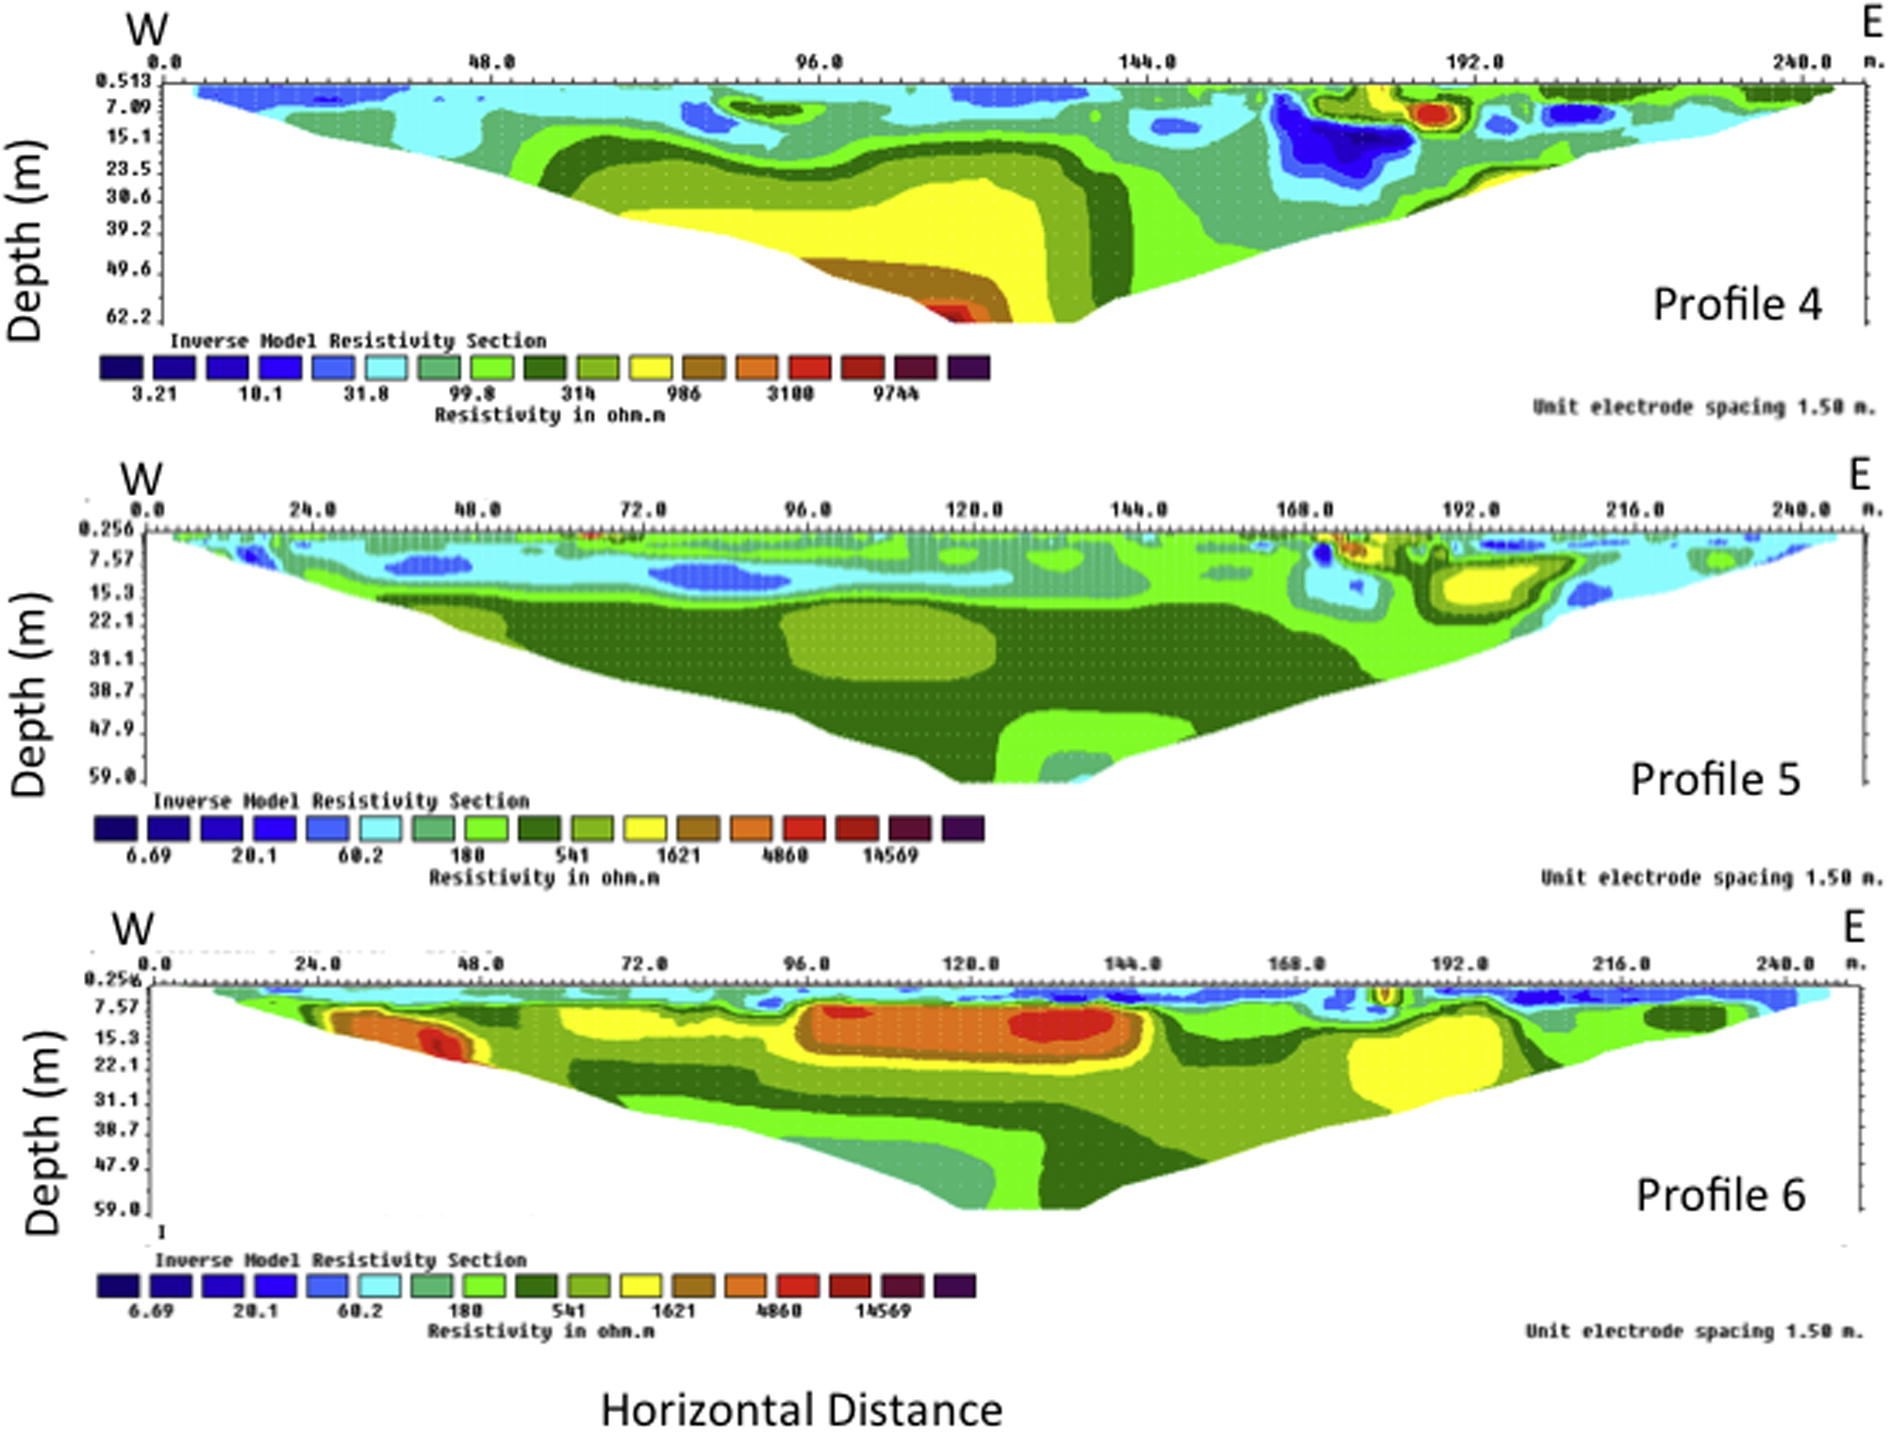
- 2D electrical resistivity tomograms for the ERP profiles 4, 5, and 6 in the northern section of the dumpsite.
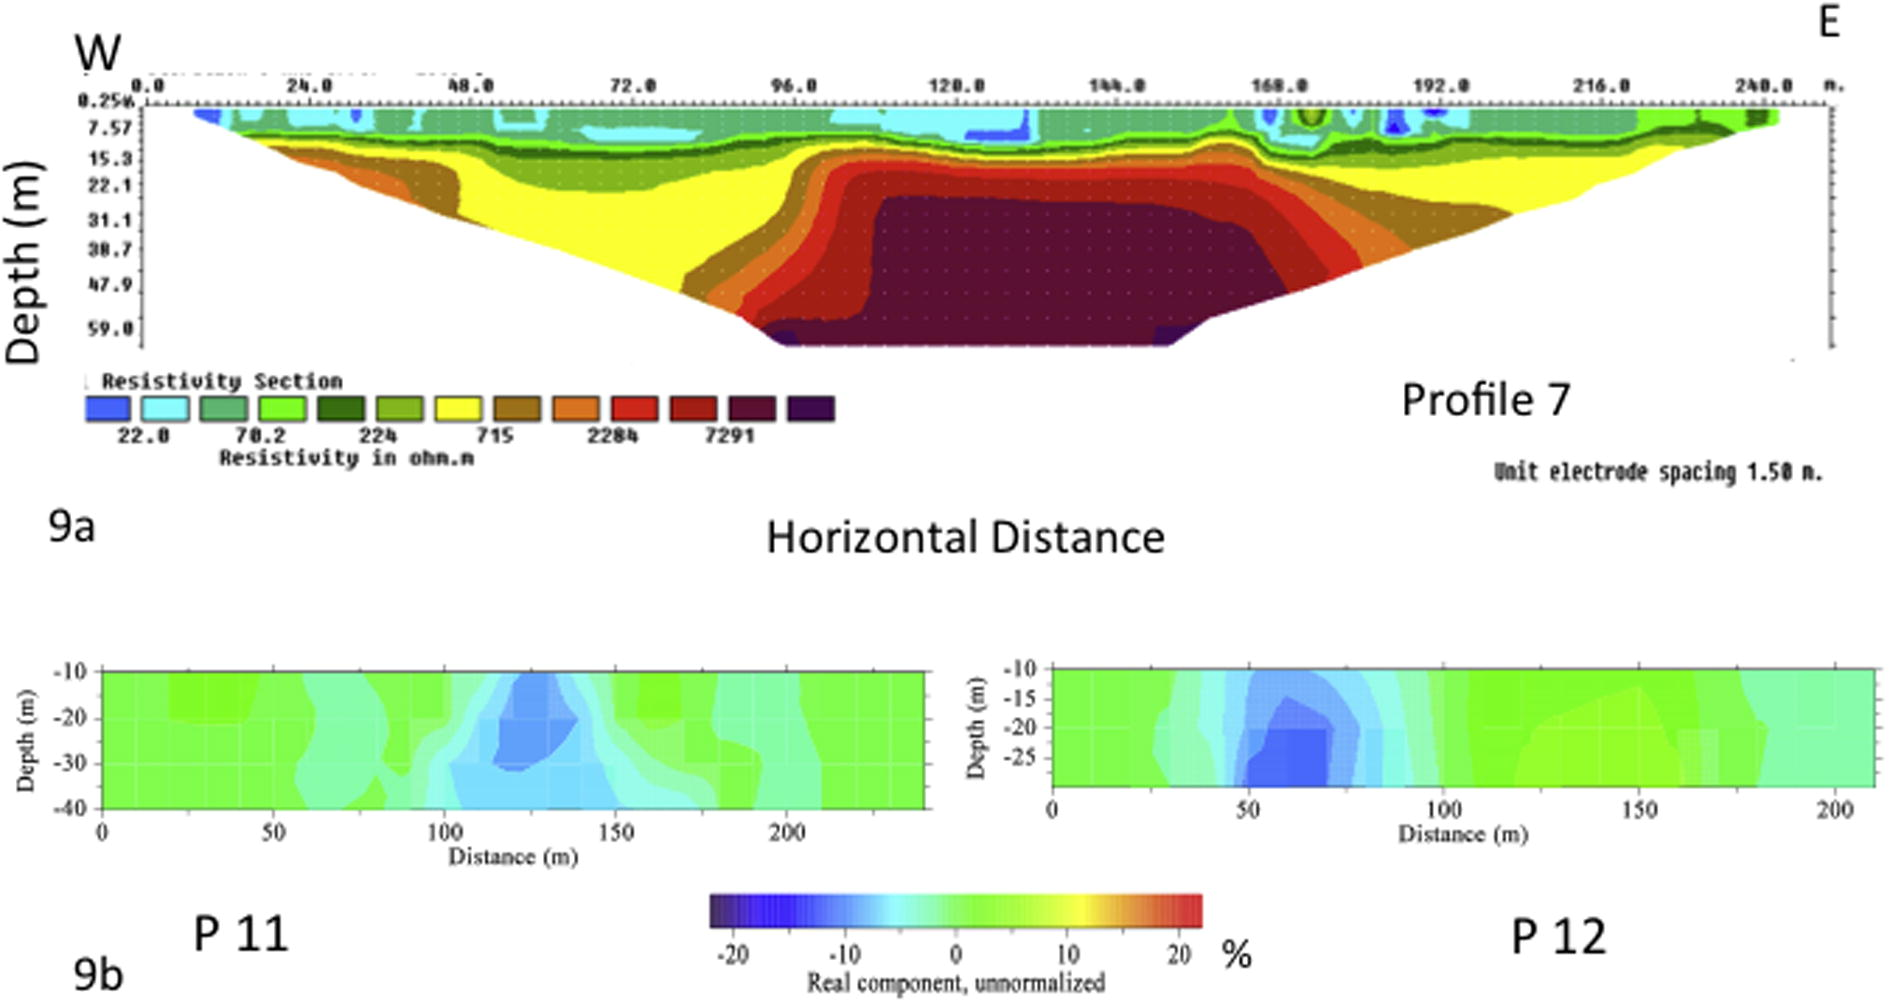
- VLF and resistivity tomograms for the area outside the reclaimed dumpsite. (a) 2D electrical resistivity tomograms for the profile 7. (b) VLF pseudo-section for profiles 11 and 12.
4 Interpretation of results
4.1 Interpretation of Very Low Frequency Electromagnetic (VLF-EM) results
According to the theory of electromagnetic conductivity, conductive rocks at shallow subsurface are the secondary sources of electromagnetic field. In the secondary magnetic field, the primary electrical and magnetic fields are nearly vertical and horizontal respectively (Santos et al., 2006). Conductive body at subsurface will allow high current density penetration, while poorly conductive rocks will allow low current density penetration. Generally speaking, unconsolidated rocks are moderate conductors; and crystalline rocks are poor conductors because of their lack of porosity and absence of dissolved ions and water. Leachate derived from dumpsite usually contains dissolved ions derived from the interaction of water (from rain) with waste materials. The presence of leachate in rocks and soil will raise the rocks’ conductivity above the background (i.e., low – moderate) values, leading to high positive current density anomaly. Qualitative interpretation of VLF data is based on the methods of Fraiser (1966) and Karous and Hjelt (1983). The Fraiser operator uses dynamic frequency band-pass to attenuated noisy data and transform zero crossing to peaks, thereby yielding semi-qualitaive contourable data. Karous-Hjelt operators transform the magnetic field associated with the current flow in conductive bodies to current density at the depth of the conductive body (rock) causing the magnetic field to yield a 2D conductivity model (McNeill and Labson, 1991; Beamish, 1994, 2000).
Places showing high positive current-density anomaly along the VLF profiles (Figs. 3 and 4) are interpreted to be rocks/soil infiltrated by leachate. Places with low negative - low positive (7 < 0 < −7%) are interpreted to be rocks with low conductivity property. Places with high negative anomaly are interpreted to be crystalline rocks. Crystalline rocks are very resistive because they lack porosity that will permit the infiltration of water or leachate. Concretion iron-stone were seen in some places showing high negative current density at shallow depth. Concretion iron-stone is a term used to describe a ‘hard rock’ (of post Precambrian age) formed by iron oxides cementing spaces between rock particles (Neuendorf, 2005). The iron mineral in iron-stone can be limonite, haematite, or magnetite.
For ease of comparison, the starting point on profiles 3–5 and profiles 7–10 is equivalent to 100 m on profiles 1 and 6, respectively. High positive anomaly is prominent in the northern and southern parts of the dumpsite indicating lateral and vertical spread of leachate from the waste to the subsurface. In the southern part of the dumpsite, places with high positive current density include 30 m – 100 m, 230 m – 340 m, 385–430 m on profile 1, and 200 m – 250 m on profile 2. Other places in the south with high positive anomaly include 215 m – 250 m along profiles 3 and 4, and 175 m – 200 m on profile 5. In the northern part of the dumpsite, high positive anomaly indicating intense leachate contamination is observed at 125 m – 275 m on profile 6. The vicinity around 150 m – 200 m along profiles 7, 8, and 9 also show high positive anomaly that decrease in magnitude and size with distance from the centre of the dumpsite. At profile 10, high positive anomaly has reduced to background values indicating the absence of leachate at shallow subsurface. Places showing high positive current density are interpreted as soil and rocks infiltrated by leachate. The two VLF profiles located outside the dumpsite show lower current density (Fig. 9b) than their corresponding profiles within the dumpsite (Figs. 3 and 4). This suggests that high current density is due to the presence of leachate.
4.2 Interpretation of vertical electrical sounding results
Interpretation of VES data shows that the study area is composed of four – five geo-electric layers (Fig. 6a and b). VES data from stations 1, 2, 3, 4, 6, 9, and 10 revealed five geo-electric layers, while those of VES stations 5, 7, 8 show four geo-electric layers. Based on the lithological logs from boreholes around the study area (Fig. 6c) and previous study (Olasehinde and Raji, 2007), the five geo-electric layers are interpreted as: top soil layer, lateritic layer, weathered rock layer, fractured basement rock, and fresh basement rock. Topsoil layer is absent in places interpreted for four geo-electric layers. VES 1 and 2 are located on profile 1 at 300 m and 150 m respectively. They were meant to investigate the contrasting conductivity structures observed in the VLF-EM results at the two points. The two VES stations show five geo-electric layers. VES 2 shows progressive increase in resistivity (or decrease in conductivity) with depth – 221 Ωm, 276 Ωm, 299 Ωm, 466 Ωm, and 718 Ωm. VES 1 reveals progressive decrease in resistivity for layers 1–4 except for the thin resistive layer 2–37 Ωm, 99 Ωm, 20 Ωm, 15 Ωm. The fifth layer corresponds to the fresh basement rock with resistivity of 480 Ωm. VES 1 and 2 show agreement with VLF interpretations for profile 1.
VES station 3 located on profile 3 was meant to probe the contrast in the conductivity structure with depth at 100 m. The VES interpretation shows two resistive layers underlain by two conductive layers, and then, the high-resistive basement rock (271 Ωm – 442 Ωm – 181 Ωm – 92 Ωm – 575 Ωm). VES station 5 is meant to probe the conductivity structure observed at 225 m on profile 6. VES result shows four geo-electric layers. The first three layers show successive reduction in resistivity with depth (250 Ωm, 82 Ωm, and 29 Ωm) while the fourth layer–fresh basement rock shows high resistivity (646 Ωm). This result conforms to the conductivity trend observed in VLF result. VES 6 is located on profile 8 at 150 m. This VES result shows a resistivity pattern (271 Ωm – 442 Ωm – 181 Ωm – 92 Ωm – 575 Ωm) that does not conform with the conductivity structure seen in the VLF result.
4.3 Interpretation of 2D ERP results
2D ERP profiles were not directly placed on the VLF profile lines because the increased construction activities obstructed the profile lines previously established for the VLF survey. 2D ERP profile lines were chosen based on space availability. Because of this, we exercised some level of cautions not to compare ERP and VLF results directly – location-by-location. 2D ERP tomograms are interpreted in terms of the resistivity signature expected of contaminated soil and rocks (Karlik and Kaya, 2001; Ogilvy et al., 2002; Porsani et al., 2004; Boudreat et al., 2010; Ramalho et al., 2013; Naudet et al., 2014), the geologic structures, and the depth to fresh basement rocks. As shown in all the 2D ERP profiles (Figs. 7 and 8), the reclaimed dumpsite is characterised by very low resistivities measuring 3 Ωm - 60 Ωm (or very high conductivity) at shallow depth very close to the ground surface. These low resistivities are interpreted as signatures of leachate derived from the waste materials dumped in the area. The low resistivities could not be interpreted as groundwater because the depth is too shallow and the resistivities are too low. From the resistivity tomograms, low resistivity anomalies are present in the south and the northern part of the dumpsite. Similar to the observation in the VLF results, the resistivity anomaly decreases with distance away from the centre of the dumpsite. Generally, the resistivity pattern in the 2D ERP tomograms is similar to the current density pattern observed in the VLF–EM tomograms: leachate intensity is higher in the southern part of the dumpsite than in the northern part.
The presence of leachate (low resistivities) at shallow depth diminished at profile 3. This is similar to the observation in VLF profile 5 (located close to 2D ERP profile 3) where high positive current density diminished. The north – south conductivity structures seen in VLF tomograms are also seen in some places on the ERP tomograms. These structures suggest the presence of a north-south oriented fractures in the area. Structures suggesting local pool of leachate in the northern part of the dumpsite are consistent around the vicinity of 170 m on 2D ERP tomograms for profiles 2, 3, 4 and 5. Except in few places, high resistivity signatures suggesting the presence of basement rocks (that are not permeable to leachate infiltration) dominate depths greater than 25 m. Places where low resistivities are present at a depth greater than 25 m are probably weathered rocks saturated with water, or leachate-contaminated groundwater. Comparing the 2D ERP profiles 1–6 within the dumpsite (Figs. 7 and 8) to the profile 7 outside the dumpsite (Fig. 9a), it’s noted, generally, that rocks outside the dumpsite are more resistive than those within the dumpsite. This comparison shows that the present of leachate in the reclaimed dumpsite is responsible for the low resistivities measured in the area.
5 Discussion
VLF-EM and Electrical Resistivity Surveys were deployed to measure the conductivity and resistivity properties of near-surface rocks and soil around a reclaimed dumpsite. The aim of this study is to map the leachate plume in the area to determine, whether or not, the clay seal was able to prevent migration of leachate to the adjoining areas. The objectives of the study include determining: the depth of leachate penetration; the number of geo-electric layers, and depth to fresh basement rocks.
Data acquired from the area were subjected to processing, modelling, and inversion. Results from VLF-EM, VES, and 2D ERP show strong agreement–indicating lateral and vertical spread of leachate plume beyond the depth of the bentonite clay-seal. Resistivity values obtained from the 2D ERP within the reclaimed dumpsite is far lower than the resistivity values obtained outside the reclaimed dumpsite. Similarly, the current density value obtained by VLF-EM method in the reclaimed dumpsite is far higher than values obtained outside the reclaimed dumpsite. The highest positive current density recorded outside the reclaimed dumpsite is about 7.0% while the highest value recorded within the reclaimed dumpsite is about 22.5%. From this observation, we inferred that leachate from the dumpsite raised the current density of rocks and soil in the area by about 200%. Both the VLF and 2D ERP profiles (Figs. 3, 4, 7 and 8) show that leachate contamination is higher in the southern part than in the northern part of the dumpsite. This could be due to difference in topographic height– the north being higher than the south, or the difference in the nature of the waste material dumped in the area.
Generally, leachate contamination decreases with distance from the centre of the dumpsite. Both VLF profile 5 and ERP 3 indicate absence of leachate contamination at shallow subsurface at the far south of the dumpsite, while VLF Profile 10 and ERP profile 6 indicate the presence of leachate at shallow subsurface around the far north of the dumpsite. The presence of high current density and low resistivity at depth range where groundwater aquifers are usually found in the basement complex suggest that groundwater aquifers in the area have been contaminated by leachate derived from the dumpsite.
Four to five geo-electric layers are interpreted for the area. Based on borehole lithological logs (Fig. 6c) and previous studies in the area, the five geo-electric layers are interpreted as top-soil, lateritic layer, weathered rock layer, fractured basement rocks, and the fresh basement rock. Typical of the basement complex of Nigeria, the weathered rock layers and the fractured basement rocks are interpreted as the aquifer units in the area. The weathered layer measured very low resistivities, as low as 3.38 Ωm, 5.58 Ωm, and 7.52 Ωm, in some places (Figs. 7 and 8). These very low resistivity values in the weathered zone suggest possible contamination of groundwater aquifers by leachate plume. Given that groundwater aquifer can be found at depth of about 5 m (or higher) in the basement complex of Nigeria (e.g., Jones, 1985; MacDonald et al., 2012; Abubakar et al., 2014) and the presence of leachate at this depth range from this study area, we inferred that groundwater in the area has been infiltrated by leachate. The estimated minimum depth to the fresh basement rock in the area is 13.97 m from VES and 12.6 m from 2D ERP.
One of the following techniques is recommended for remediating leachate contamination in the area: (i) pump-and-treat technique, or (ii) co-treatment of leachate with sewage in wastewater treatment plant. In pump-and-treat technique, leachate in the soil will be flushed into wells and then pumped to treatment plants where it will be treated to remove the toxic components. In co-treatment technique, leachate from dumpsite will be channelled to underground sewage tanks built for domestic or industrial wastewaters. The mixture of leachate and wastewater is then piped to waste treatment plant for treatment (Tsanis, 2006).
6 Conclusion
Important conclusions from this study are that (i) leachate contamination is still present in the area after two years of abandon and removal of the waste materials and (ii) the clay seal installed around the dumpsite could not prevent leachate migration to the adjourning area. There are strong agreements in the results of VLF-EM, VES, and 2D ERP - indicating the presence of leachate at depth below the clay seal. Compared to the area outside the dumpsite, the resistivity values obtained from the 2D ERP around the reclaimed dumpsite are far lower than the resistivity values obtained outside the dumpsite. Similarly, the current density value obtained around the reclaimed dumpsite by VLF-EM study is far higher than those obtained outside the dumpsite. The highest positive current density recorded outside the dumpsite is about 7.0% while the highest recorded around the reclaimed dumpsite is about 22.5%. From these we also conclude that the presence of leachate raised the conductivity, or reduced the resistivity of the soil and rocks around the dumpsite. The presence of leachate at depth up to 20 m compared to the 2 m depth where clay-seal was installed shows that leachate has migrated across the clay-seal. The clay-seal could not prevent leachate flow throughout the lifetime of the dumpsite. This study is important for groundwater exploration and groundwater quality control in the area. Groundwater in the depth range of 20 m in the study area is not safe for drinking except when treated. Remediation of leachate contamination in the area can be achieved by either pump-and–treat technique or co-treatment technique.
References
- Direct current resistivity and very low frequency electromagnetic studies for groundwater development in a basement complex area of Nigeria. Sci. Focus. 2014;19(1):1-10.
- [Google Scholar]
- Ajibade, L.T., 2002. Indigenous Systems of Land Evaluation in the Yoruba Speaking Area of Kwara State. Ph.D Thesis. Obafemi Awolowo University (OAU), Ile-Ife, Nigeria.
- Authomated and Semi-authomated Interpretation of Vertical Electrical Sounding and Induced Polarization Data obtained from A Variety of Popular Arrays used in Electrical Prospecting, IPI2Wi. Geological and Geophysical Department, Moscow State University; 2002.
- Basement fracture pattern in the control of river channels. An example from central Nigeria. J. Min. Geol.. 1987;26(1):5-11.
- [Google Scholar]
- Two-dimensional, regularized inversion of VLF data. J. Appl. Geophys.. 1994;32:357-374.
- [Google Scholar]
- DC-resistivity mapping of internal landfill structure: two pre-excavation surveys. Environ. Geol.. 2000;39:3-4.
- [Google Scholar]
- Geophysical characteristic of contaminated urban fills. Eng. Geol.. 2010;116:196-206.
- [Google Scholar]
- Burger, R.H., Sheehan, A.F., Jones, C.H., 1992. Introduction to Applied Geophysics – Exploring the Shallow Subsurface.
- Assessing a fractured landfill cover using electrical resistivity and seismic refraction techniques. Geophysics. 1991;56(11):1896-1904.
- [Google Scholar]
- Introduction to Geophysical Prospecting (third ed.). New York: McGraw-Hill Company; 1976.
- Dodds, A.R., Ivic, D., 1988. Integrated geophysical methods used for groundwater studies in the Murray Basin, South Australia. In: Geotechnical and Environmental Studies. Geophysics, vol. II. SEG, Tulsa, OK, pp. 303–310.
- The weathered zone aquifers of the basement complex areas of Africa. Q. J. Eng. Geol.. 1985;18:35-46.
- [Google Scholar]
- Investigation of groundwater contamination using electric and electromagnetic methods at an open waste-disposal site: a case study from Isparta, Turkey. Environ. Geol.. 2001;40(6):34-42.
- [Google Scholar]
- Linear filtering of VLF dip-angle measurements. Geophys. Prospect.. 1983;31:782-792.
- [Google Scholar]
- Geosounding Principles I: Resistivity Sounding Measurements. Amsterdam: Elsevier; 1979. p. :276.
- Rapid least-squares inversion of apparent resistivity pseudosections using a quasi-Newton method. Geophys. Prospect.. 1996;44:131-152.
- [Google Scholar]
- Quantitative map of groundwater resource in Africa. Environ. Res. Lett.. 2012;7:024009.
- [Google Scholar]
- Geochemistry of calc-alkaline volcanics in northwestern Nigeria, and a possible Pan-African suture zone. Earth Planet. Sci. Lett.. 1977;37:90-96.
- [Google Scholar]
- Geological mapping using VLF radio fields electromagnetic methods. In: Nabighian M.N., ed. Applied Geophysics. Vol vol. 2. Tulsa, OK: SEG; 1991. p. :521-640.
- [Google Scholar]
- 3D electrical resistivity tomography to locate DNAPL contamination around a housing estate. Near Surf. Geophys.. 2014;12(3):351-360.
- [Google Scholar]
- Neuendorf, K.K.E., Mehl Jr., J.P., J.A. Jackson, J.A., (Eds.), 2005. Glossary of Geology, fifth ed. American Geological Institute, Alexandria, Virginia. 779pp (ISBN 0-922152-76-4).
- The use of 3D electrical resistivity tomography to characterize waste and leachate distributions within a closed landfill, Thriplow, UK. J. Environ. Eng. Geophys.. 2002;7:11-18.
- [Google Scholar]
- Geophysical studies on fractures of basement rocks at University of Ilorin, Southwestern Nigeria: application to groundwater exploration. Water Resour.. 2007;17:3-10.
- [Google Scholar]
- An integrated geologic and geophysical exploration techniques for groundwater exploration in the basement complex of west central part of Nigeria. Water Resour.. 1999;11:46-49.
- [Google Scholar]
- Use of block inversion in the 2-D interpretation of apparent resistivity data and its comparison with smooth inversion. J. Appl. Geophys.. 2000;45:63-82.
- [Google Scholar]
- Master Tables and Curves for Vertical Electrical Sounding over Layered Structures. Madrid: Intergencia; 1960. p. :159.
- Very low frequency electromagnetic (VLF-EM) and electrical resistivity (ER) investigation for groundwater potential evaluation in a complex geological terrain around Ijebu-ode transition zone, Southwestern Nigeria. J. Geophys. Eng.. 2012;9:374-396.
- [Google Scholar]
- The geology of Nigerian basement complex – a survey of our present knowledge of them. J. Nigerian Min. Geol. Metall. Soc.. 1964;1(2):87-102.
- [Google Scholar]
- Pirttijarvi, M., 2004. Karous-Hjelt and Fraiser Filtering of VLF Measurements. KHFFILT Users’ Guide.
- The use of GRR & VES in delineating contamination plume in a landfill site. A case study in SE Brazil. J. Appl. Geophys.. 2004;155:199-209.
- [Google Scholar]
- Surface geophysical investigation of University of Connecticut Landfill, Water Resources Investigations Report 99-4211. U.S. Department of the Interior U.S. Geological Survey; 1999.
- Review of the basement geology of southwestern Nigeria. In: Kogbe C.A., ed. Geology of Nigeria (second ed.). Lagos: Elizabethan publication; 1976. p. :41-58.
- [Google Scholar]
- Assessment of leachate movement in a sealed landfill using geophysical methods. Environ. Earth Sci.. 2013;68(343–354):1742-1748.
- [Google Scholar]
- Mapping groundwater contamination around a landfill facility using VLF-EM method – a case study. J. Appl. Geophys.. 2006;60:115-125.
- [Google Scholar]
- Stanton, G.P., Schrader, T.P., 2001. Surface geophysical investigation of a chemical waste landfill in northwestern Arkansas. U.S. Geological Survey Karst Interest Group Proceedings. Kuniansky EL (Ed.), Water-Resources Investigations Report 01-4011, pp. 107–115.
- VES and VLF – an application to groundwater exploration, Khammam, India. Leading Edge 2007:708-716.
- [Google Scholar]
- Hydrogeochemical assessment of groundwater in Moro- Area, Kwara state, Nigeria. Environ. Geol.. 1994;24:192-202.
- [Google Scholar]
- Modeling leachate contamination and remediation of groundwater at a landfill site. Water Resour. Manage.. 2006;20:109.
- [CrossRef] [Google Scholar]
- World Health Organisation, 2006. Guidelines for Drinking Water Quality. WHO Report, vol. 1 (First addendum to the third edition).
- A new method for the automatic interpretation of Schlumberger and Wenner sounding curves. Geophysics. 1989;54(2):245-253.
- [CrossRef] [Google Scholar]


