Translate this page into:
GIS based landslide hazard evaluation and zonation – A case from Jeldu District, Central Ethiopia
⁎Corresponding author. Tel.: +251 911 875983. tkraghuvanshi@gmail.com (Tarun Kumar Raghuvanshi) tarunraghuvanshi@yahoo.com (Tarun Kumar Raghuvanshi)
-
Received: ,
Accepted: ,
This article was originally published by Elsevier and was migrated to Scientific Scholar after the change of Publisher.
Abstract
In the present study landslide hazard evaluation and zonation (LHZ) was carried out in Jeldu District in Central Ethiopia, about 156 km West of Addis Ababa, the capital city of Ethiopia. Through field based inventory mapping and image interpretation 34 past landslides were mapped in the study area. The governing factors; aspect, slope and elevation, were determined from the digital elevation model (DEM), which was obtained from the ASTER satellite. Lithology was adopted from the geological map of Ethiopia (1:2,000,000), while the soil and land use/land cover were processed from Landsat + ETM satellite data. All governing factors were statistically analyzed to find the correlation with the past landslides. In this study, statistical – probabilistic approach was used to rate the governing factors and then customized raster calculation was made in GIS environment to develop the LHZ map.
The results revealed that 12% (5.64 km2) of the study area falls under no hazard, 27% (12.69 km2) as low hazard, 32% (15.04 km2) as moderate hazard, 21% (9.87 km2) as high hazard and the rest 8% (3.76 km2) as very high hazard. The validation of LHZ map shows that, 92% of past landslides fall in high or very high hazard zones, while 6% fall in medium and only 2% in low landslide hazard zones. The validation of LHZ map thus, reasonably showed that the adopted methodology produced satisfactory results and the delineated hazard zones may practically be applied for the regional planning and development of infrastructures in the area.
Keywords
Digital elevation model
Hazard index
Landslide
Landslide hazard zonation
1 Introduction
Landslides, one of the major natural disasters, have resulted into significant injury and loss to the human life and damaged property and infrastructure throughout the world (Girma et al., 2015; Raghuvanshi et al., 2014; Pan et al., 2008; Kanungo et al., 2006; Crozier and Glade, 2005; Dai et al., 2002; Parise and Jibson, 2000; Varnes, 1996).
In general, heavy rainfall, high relative relief and complex fragile geology with increased manmade activities, such as roads on mountains have resulted in increased landslide activities in the highlands of Ethiopia (Girma et al., 2015; Raghuvanshi et al., 2014; Woldearegay, 2013).
It is essential to identify, evaluate and delineate landslide hazard prone areas for proper strategic planning and mitigation (Girma et al., 2015; Raghuvanshi et al., 2014; Bisson et al., 2014; Pan et al., 2008; Anbalagan, 1992). Therefore, to delineate landslide susceptible slopes over large areas, landslide hazard zonation (LHZ) techniques can be employed (Anbalagan, 1992).
Landslides are resulted because of intrinsic and external triggering factors. The intrinsic factors are mainly; geological factors (lithology or soil type, structural discontinuity characteristics, shear strength of the material, groundwater condition and its effect), geometry of the slope (slope inclination, aspect, elevation and curvature) and land use/land cover (Raghuvanshi et al., 2014; Wang and Niu, 2009; Ayalew et al., 2004; Anbalagan, 1992; Hoek and Bray, 1981). The external factors which generally trigger landslides are rainfall (Dahal et al., 2006; Dai and Lee, 2001; Collison et al., 2000), seismicity (Bommer and Rodríguez, 2002; Keefer, 2000; Parise and Jibson, 2000) and manmade activities such as; construction activities and cultivation practices in mountainous regions (Raghuvanshi et al., 2014; Wang and Niu, 2009). Several LHZ techniques have been developed over the past and these can be broadly classified into three categories; expert evaluation, statistical methods and deterministic approaches (Kanungo et al., 2006; Fall et al., 2006; Casagli et al., 2004; Guzzetti et al., 1999; Leroi, 1997). Each of these LHZ techniques has its own advantage and disadvantage owing to certain uncertainties on account of factors considered or methods by which factor data are derived (Carrara et al., 1995).
In the past, several published or unpublished studies following analytical, qualitative or empirical approaches have been carried out in different parts of Ethiopian Highlands (Raghuvanshi et al., 2014; Ayele et al., 2014; Woldearegay, 2013; Ayenew and Barbieri, 2004; Ayalew and Yamagishi, 2004; Ayalew, 1999 etc.). The present study area is located in the highlands under Jeldu District, West Showa Zone in Central, Ethiopia. The area is frequently affected by landslides and the people have been permanently displaced from their residences. Therefore, vulnerability of the lives and property of the people by landslides in the area need immediate attention.
2 Objective and general methodology
The main objective of the present study was to prepare a LHZ map of the study area. The general methodology followed includes landslide inventory mapping, followed by preparation of a statistical hazard model based on various causative factors and their interrelation with past landslides. Finally, LHZ map was prepared based on relative influence of various causative factors.
3 Study area
The present study area falls in Jeldu District in Oromiya National Regional State in West Showa Zone of Central Ethiopia and is located between 09°25′ N to 9°30′ N latitude and 038°00′ E to 38°05′ E longitude, approximately 156 km West of Addis Ababa, the capital city of Ethiopia (Fig. 1). The area is characterized by rugged topography with altitudes ranging from 1497 m to 2426 m. The area has dendritic drainage with Tutu, Kersa, Fele and Litu Rivers, which are the tributaries of the Mugher River. All these rivers ultimately join the Blue Nile (Abay) River. The study area falls in subtropical (1500–2300 m) to temperate (2300–3300 m) climatic zones (Daniel, 1977). The rainfall data collected from Kachisi Ethiopian Meteorological Agency station showed that the area gets 967 mm annual average precipitation (data for the period 2002–2011). The highest monthly average precipitation recorded in the area was 387.6 mm in August 2011. The area is characterized by uni-modal rainfall pattern with only one distinct rainy season (i.e. June to August).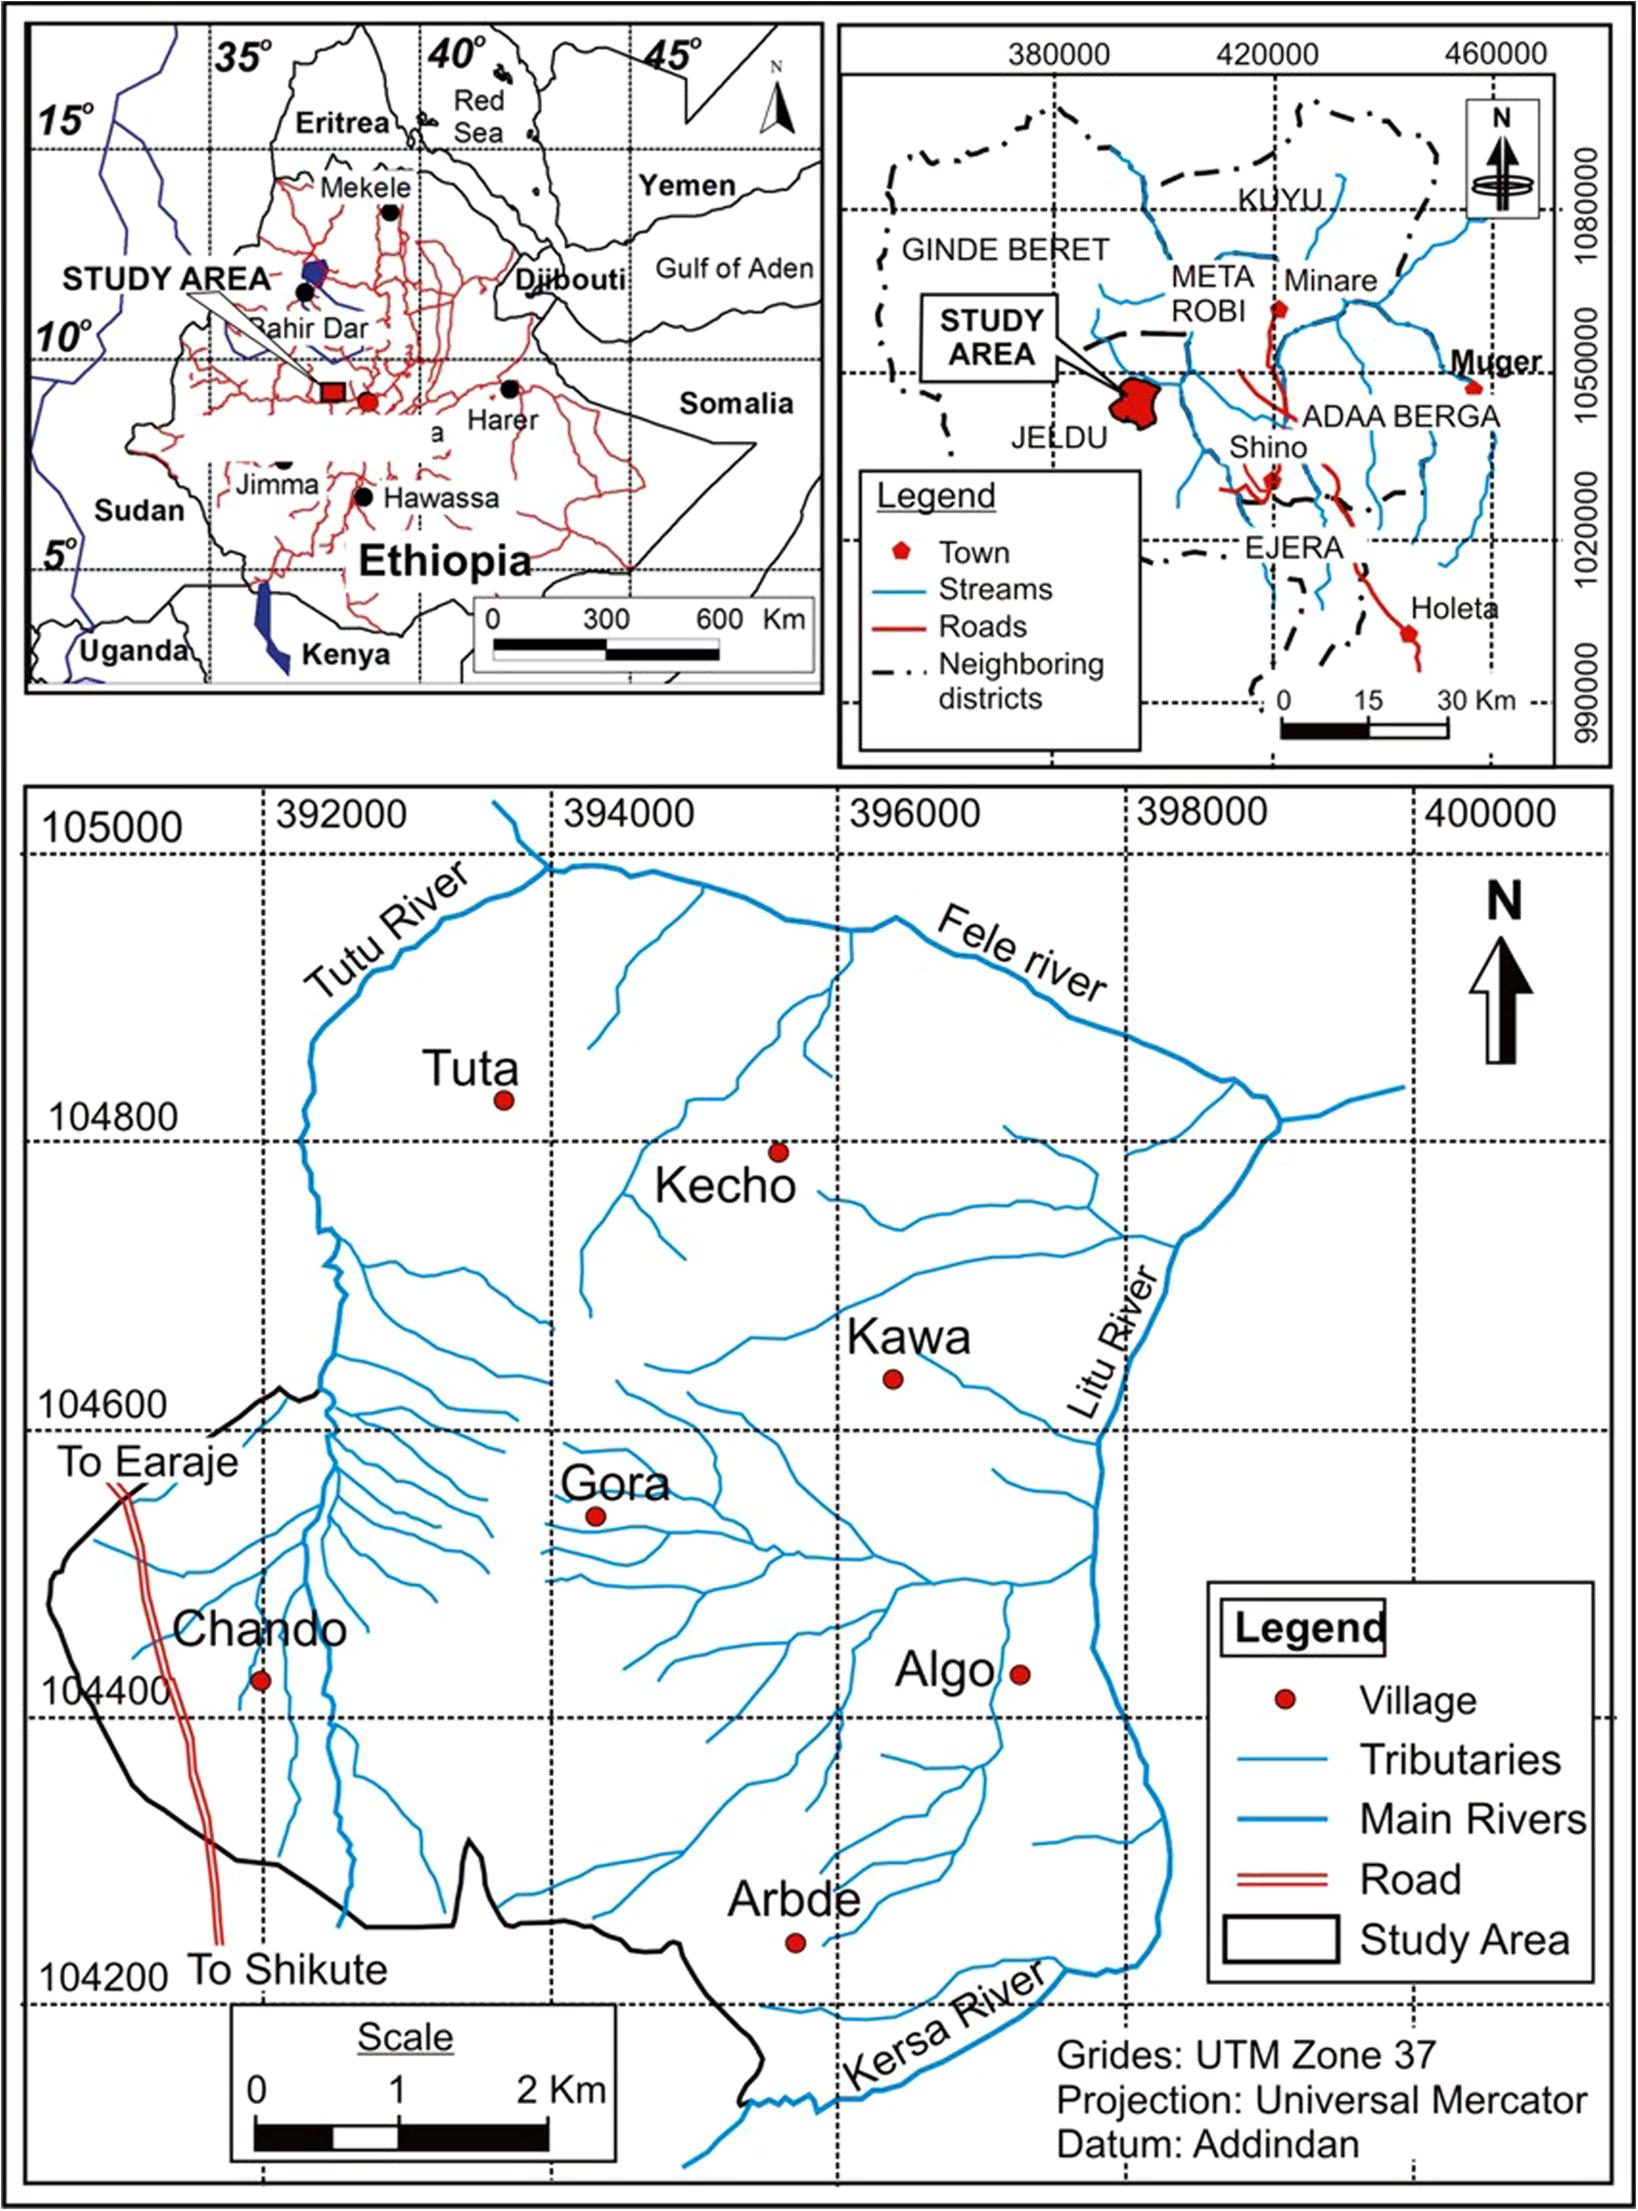
The study area.
3.1 Geology
The regional geological characteristics were described by Kazmin (1973). The description of the lithological units exposed in the study area is mainly taken from the geological map of the area at a scale of 1:50,000 prepared by the Geological Survey of Ethiopia (GSE, 2011).
3.1.1 Antalo Formation
The Antalo Formation, age middle to late Jurassic, mainly contains thin beds of marl and calcareous shale, and occasionally arenaceous bands which are mainly exposed near the top. In the Abay River canyon, in which the present study area is located, the Antalo Formation is restricted to the upper 288 m thick sequence and lies between the Abay Formation and the Tertiary Volcanics which is separated from the Adigrat Formation by the Abay Formation (Mamo et al., 1996). In the present study area, Antalo Formation consists of massive limestone with intercalated shale, which is mainly exposed on the steeper cliff forming parts in the area (Fig. 2).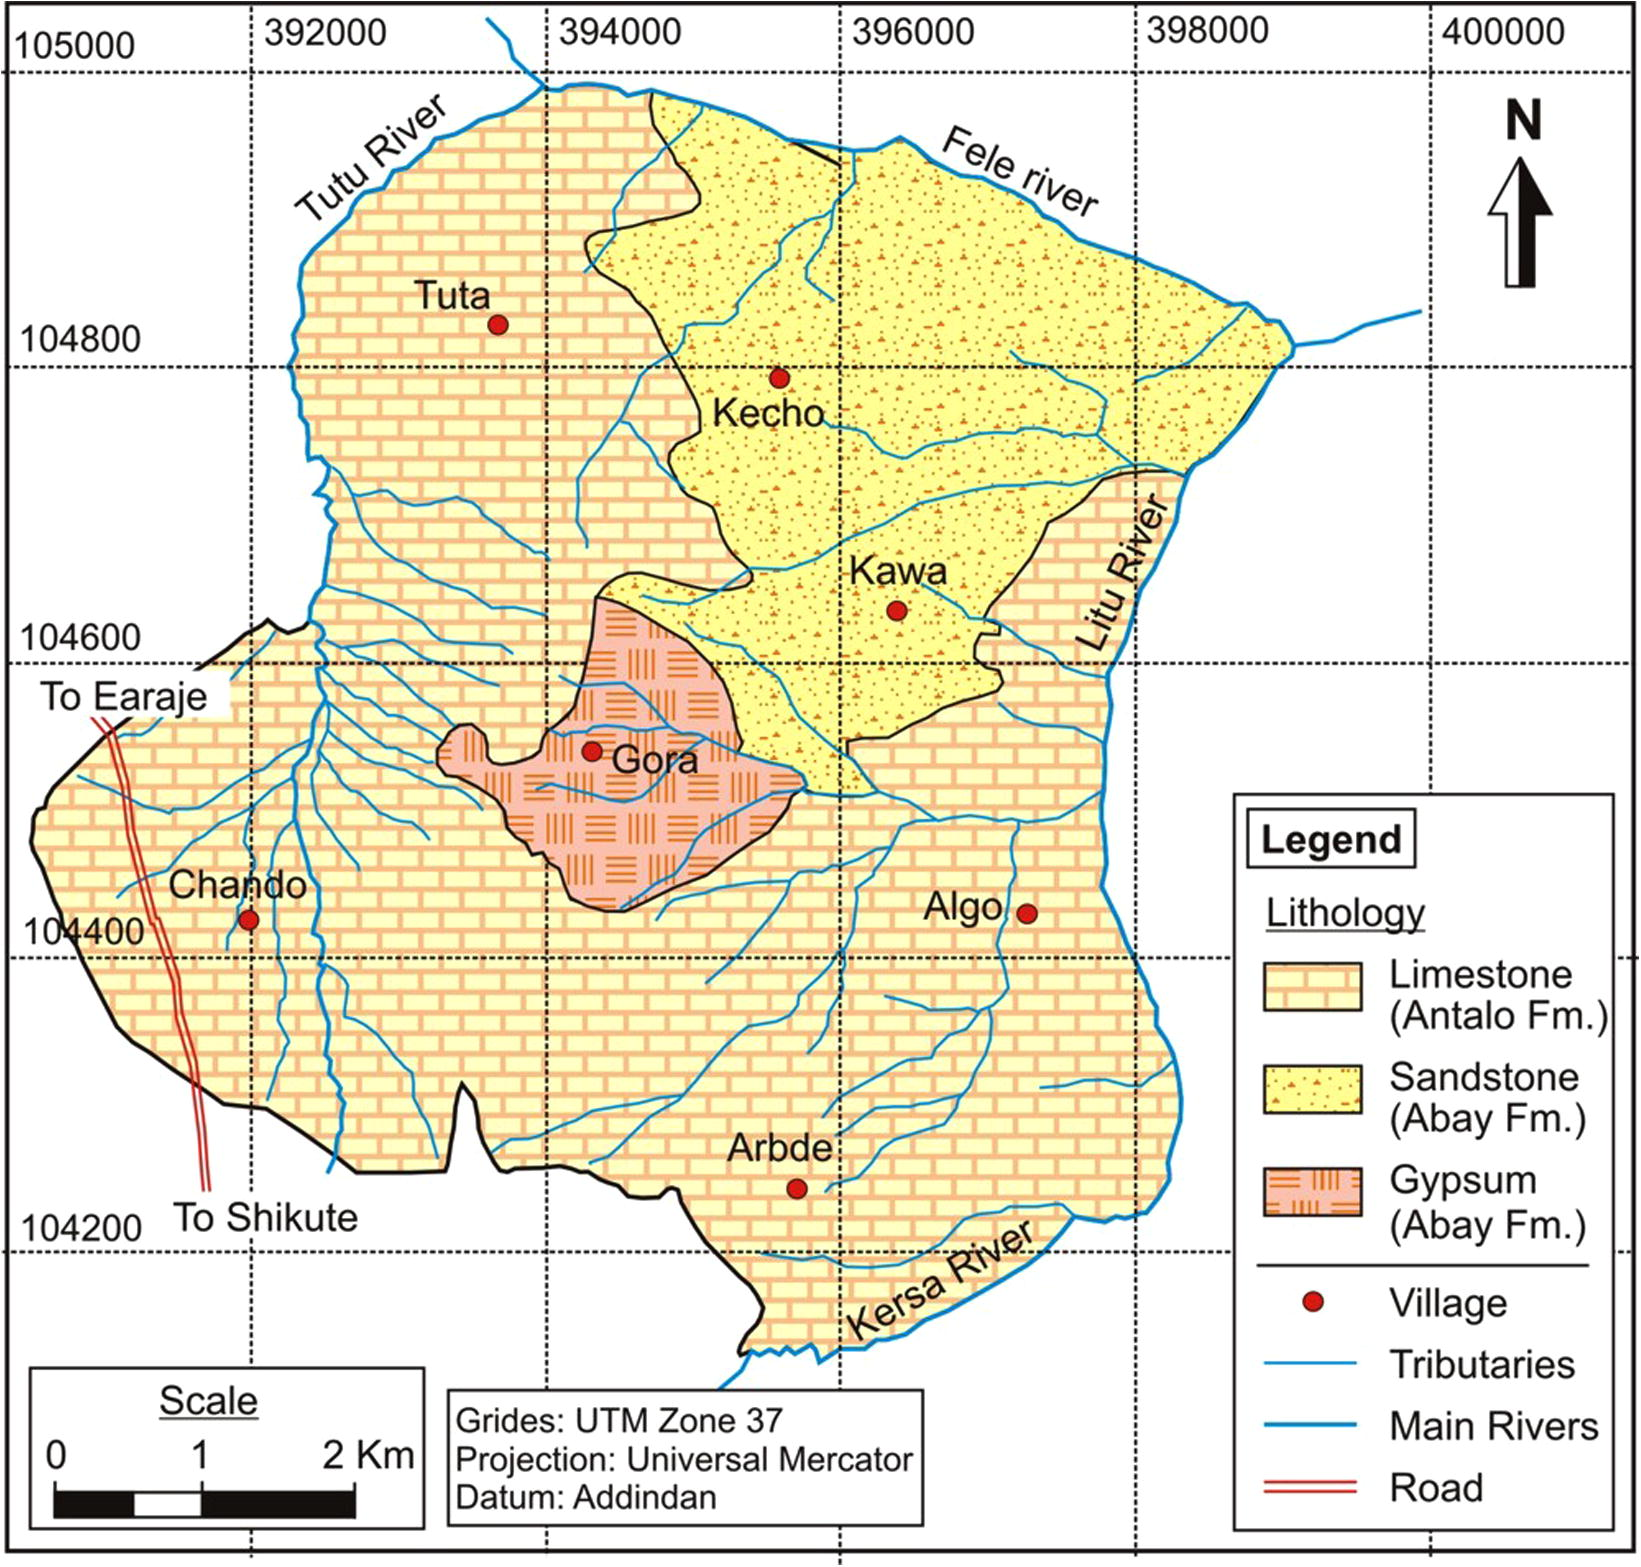
Lithological map of the study area.
3.1.2 Abay Formation
This Formation comprises Middle to Jurassic Limestone, Shale and Gypsum. The Formation consists of sandy limestone, calcareous sandstone, gypsum and upper sequence of alternating shale and limestone (Kazmin, 1973, 1975). This formation is common in the upper and middle most parts of the study area (Fig. 2).
3.1.3 Quaternary superficial deposits
This unit comprises mainly of the colluvium soil and alluvial deposit. The colluvium soil is deposited in the central part of the study area (Fig. 3). The alluvial sediments are deposited in northern, north – eastern and western parts of the study area, mainly along the Muger River valley. Much of the area is covered by these quaternary superficial deposits and the rocks are only exposed in the central portion of the study area.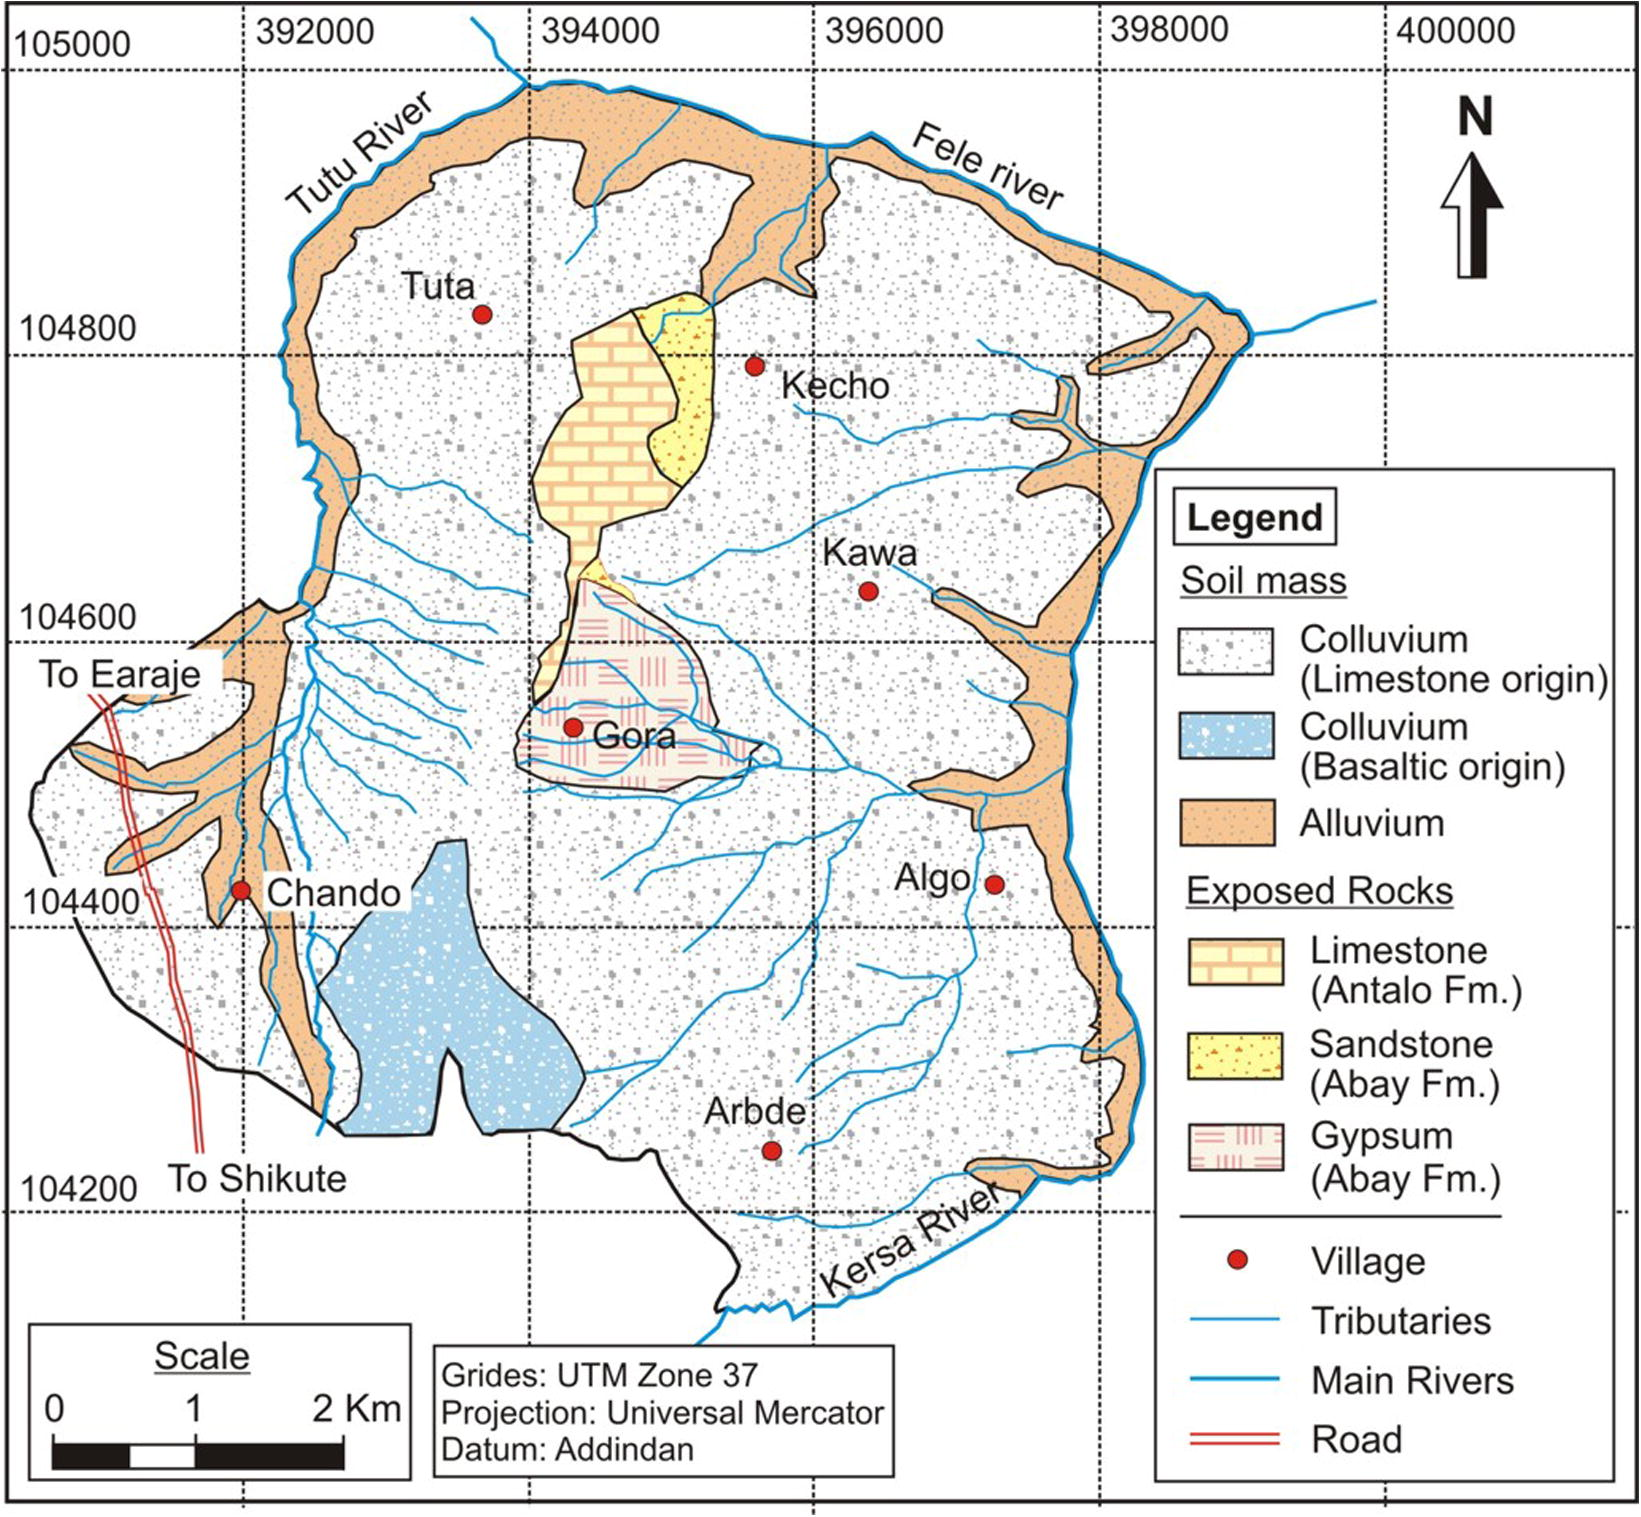
Rocks and soil mass in the study area.
4 Methodology
For the present study bivariate statistical approach was followed. In this approach the main objective is to derive the densities of landslide occurrences within each causative factor map and its parameter map classes. Later, based on the class distribution and the landslide density, respective weights can be derived (Süzen and Doyuran, 2004). Further, the general quantitative prediction was developed to rate the causative factors that might result in landslides with similar conditions (Girma et al., 2015). Thus, with the derived weights, factor maps were combined to get the landslide hazard zonation map.
The present study area is around 47 km2, therefore, for LHZ map preparation medium scale was adopted. Later, the statistical relationship between the contributing factors and the past landslides was established (Dai and Lee, 2001). For the present study six causative factors namely, lithology, soil mass, slope, elevation, aspect and land use/land cover were considered. The technique followed in the present study is based on an assumption that the considered causative factors, possibly responsible for past landslides, can be quantified by counting grid cells and a hazard index value may be computed which may ultimately lead to assess the landslide hazard. This hazard index value for each causative factor is the ratio between landslides that ‘did’ occurr to landslides that ‘did not occurr’ (Lee and Min, 2001). Later, as per these hazard index values, appropriate weight was assigned to each of the causative factors. Finally, random trial combinations of all six causative factor layers were made. Thus, the best combination of the factors was utilized for the evaluation of the landslide hazard. The LHZ map thus, prepared was validated with the actual past landslide data in the area.
5 Data collection and analysis
All pertinent data required for landslide hazard evaluation were collected from primary and secondary sources. Pre-field work included secondary data collection related to topographical maps, satellite images, meteorological data and digital elevation model (DEM) data. Field investigation was mainly undertaken to have all relevant information about the past landslide activities in the area and to verify various causative factor maps prepared during the pre-field works.
5.1 Landslide inventory
For landslide hazard assessment it is generally assumed that the conditions that led to the past landslides in the area if reoccurred elsewhere in the given area, may again result in landslides (Dai et al., 2002; Lan et al., 2004; Raghuvanshi et al., 2015).
For the present study a systematic landslide inventory was undertaken. All existing landslides in the study area were thoroughly studied and relevant data necessary for hazard evaluation were collected. Thus, data on location, type of failure, dimension and material involved in past landslides were collected. Majority of the landslides in the study area were identified by the field surveying and the GPS point data along the periphery were collected. Later, with this information polygon data were created with the help of Google earth image. However, landslides on inaccessible areas like gorges, high cliffs and in the dense vegetated areas were identified on Google earth image only (Google Earth, 2014). Thus, based on this survey, 34 past landslides were recognized in the study area. Out of these, 56% (19) were recognized as debris flow, 26% (9) as translational slide, 3% (1) as rotational, 12% (4) as fall and remaining 3% (1) as complex type of failures (Fig. 4). Debris flows were observed in colluvium material which formed mostly gentle slopes. Similarly, transitional mode of failure was also observed mostly in colluvium and alluvial soil mass. Rotational, fall and complex modes were mainly recognized in alluvial, limestone and colluvium materials, respectively. The main triggering factor for all the past landslides in the area was heavy rainfall.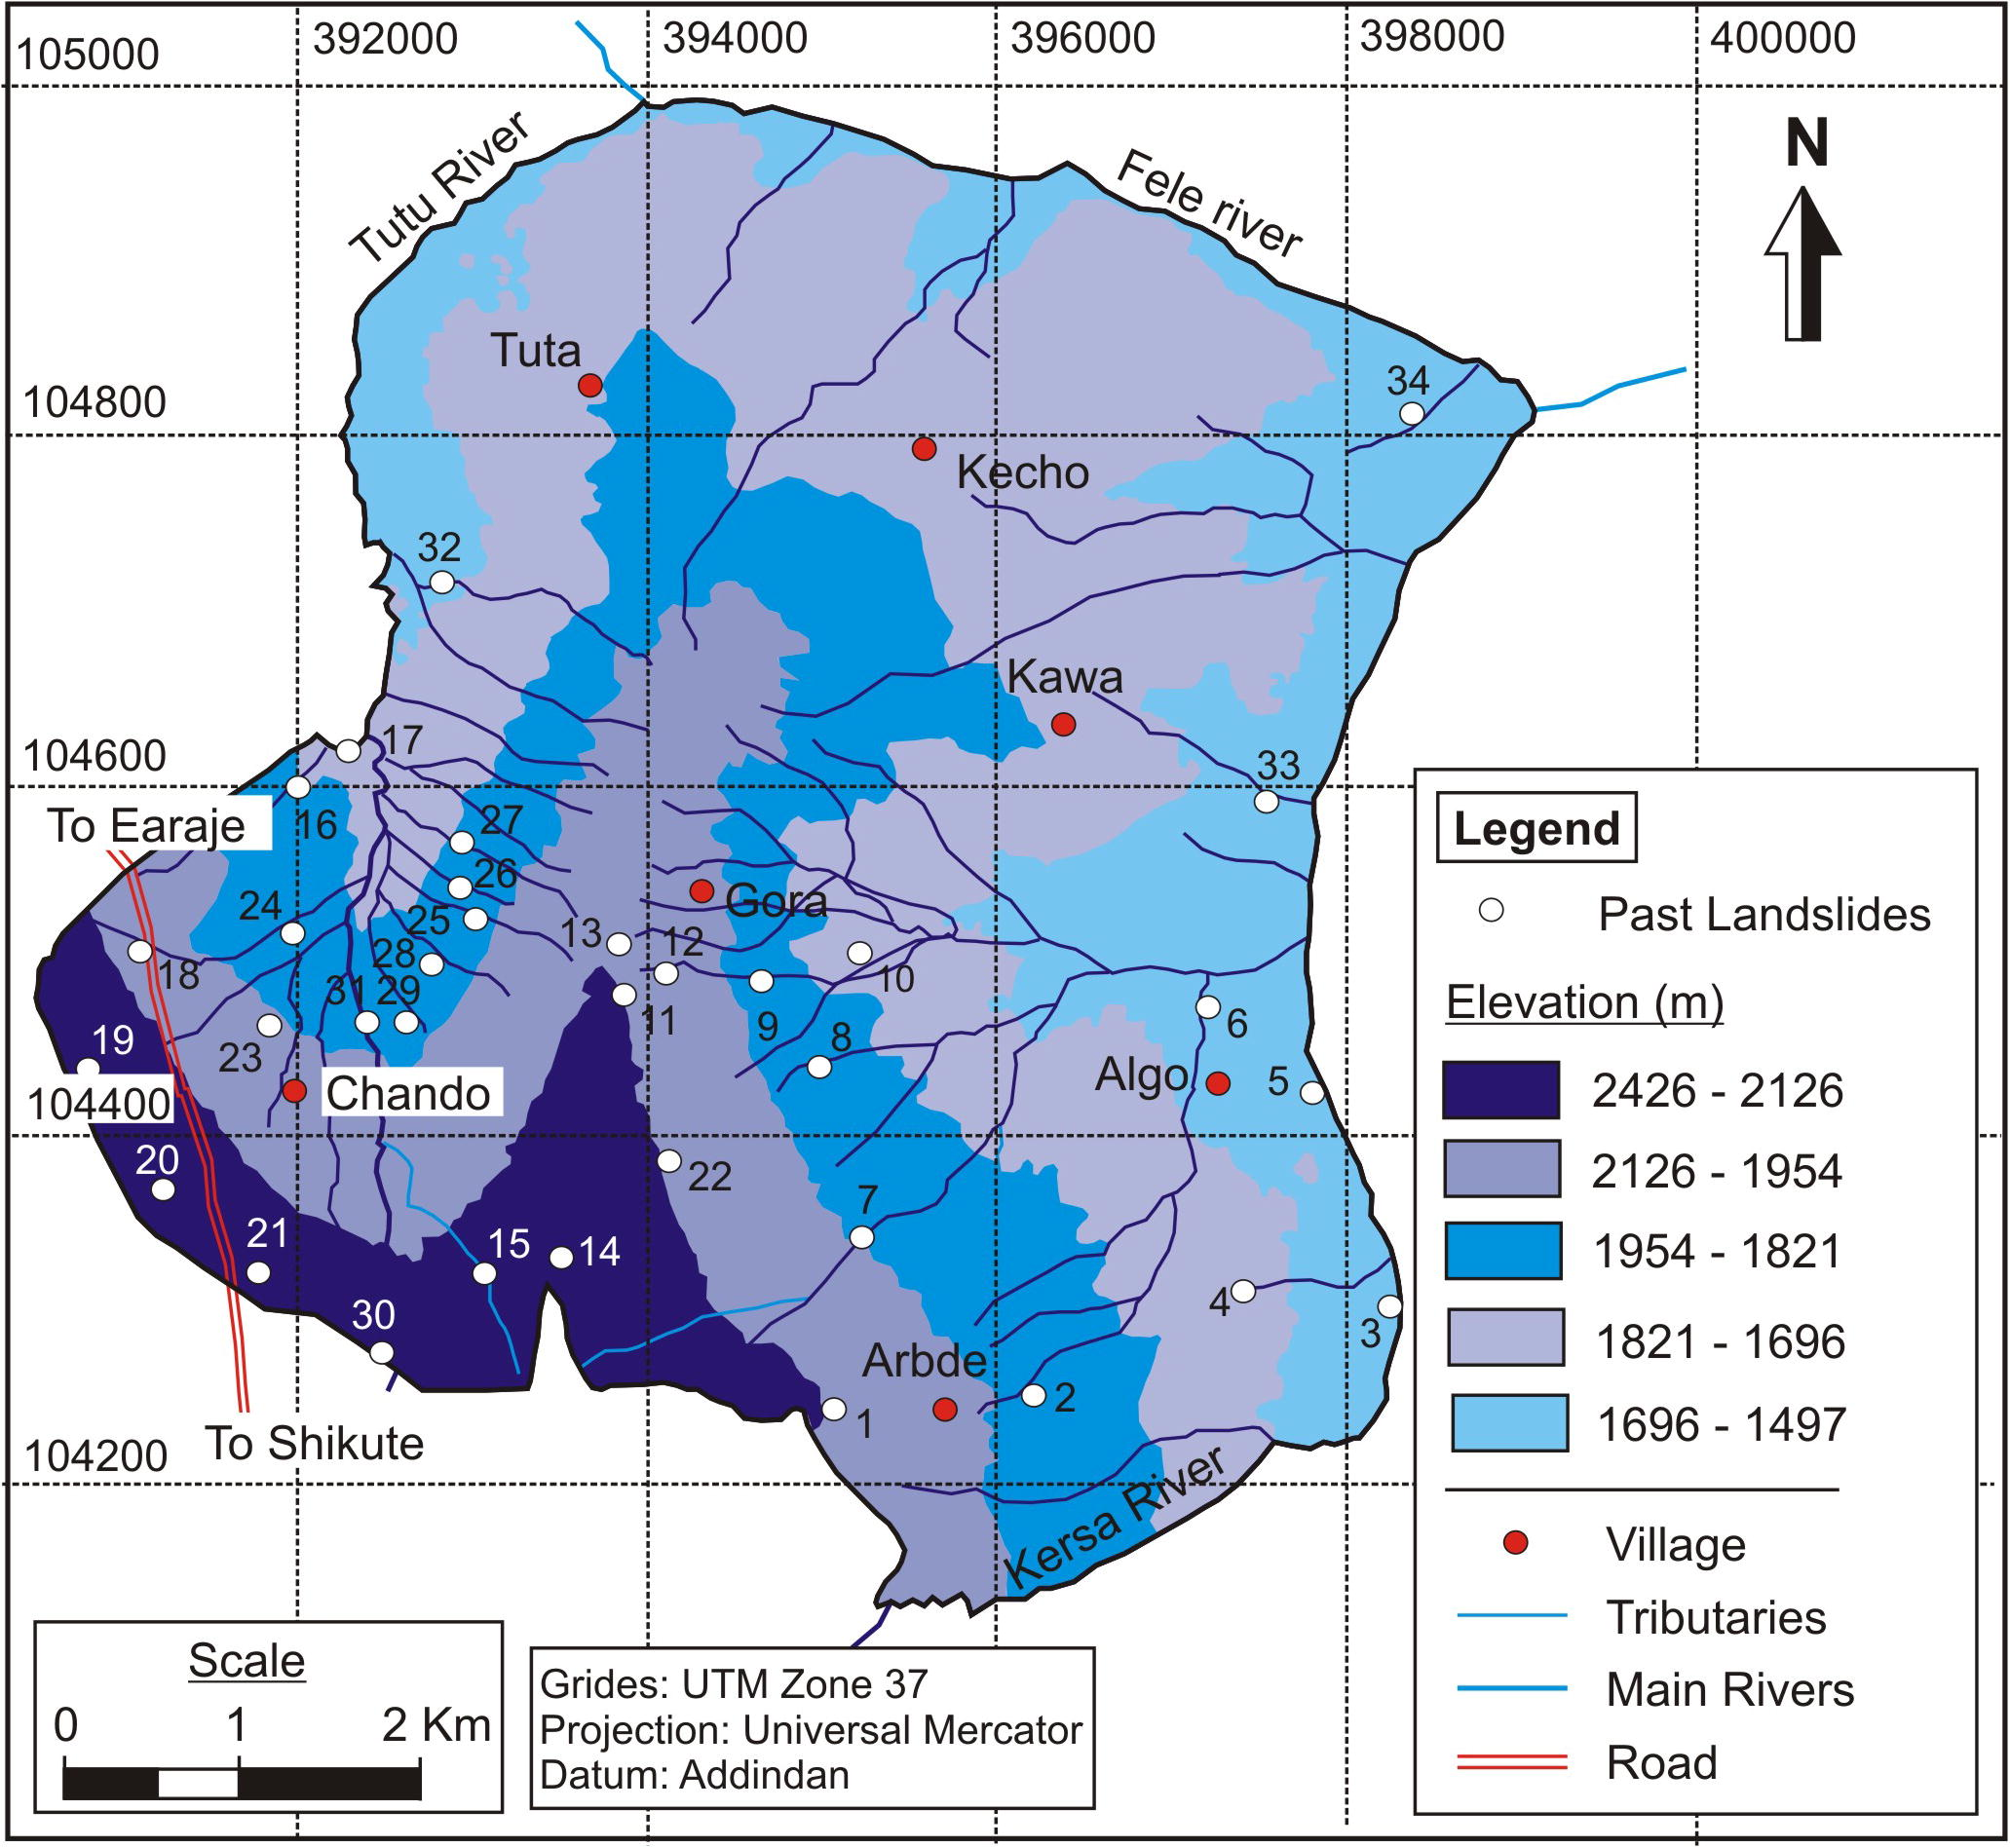
Landslide inventory map.
5.2 Evaluation of causative factors and landslide distribution
During the present study for landslide hazard evaluation six prominent causative factors namely; (i) lithology, (ii) soil mass (iii) slope, (iv) elevation, (v) aspect and (vi) land use/land cover were considered. These causative factors were considered based on observation of past landslides and their possible contribution in inducing instability to the slopes in the area.
5.2.1 Lithology and soil mass
The Lithological map of the present study area has been modified from the Geological Map compiled by Ethiopian Geological Survey 1973 (GSE, 2011) and through a present field survey. This map was prepared at a scale of 1:50,000 (Fig. 2). Majority of the study area is covered by thick quaternary deposits. The quaternary deposit consists of colluvium material with basaltic origin, colluvium material with limestone origin and alluvial material of sandstone and limestone origin (Fig. 3). Past landslide distribution among various lithology shows that 3% of the landslides occurred in limestone, 3% within gypsum and 2% were recorded in the sandstone which forms the lower most part of the study area (Fig. 5). In the case of soil mass, 65% of the past landslides occurred in the colluvium deposit of limestone origin, 11% accounts for colluvial deposit of basaltic origin and 16% of the landslide occurred in the alluvial deposits.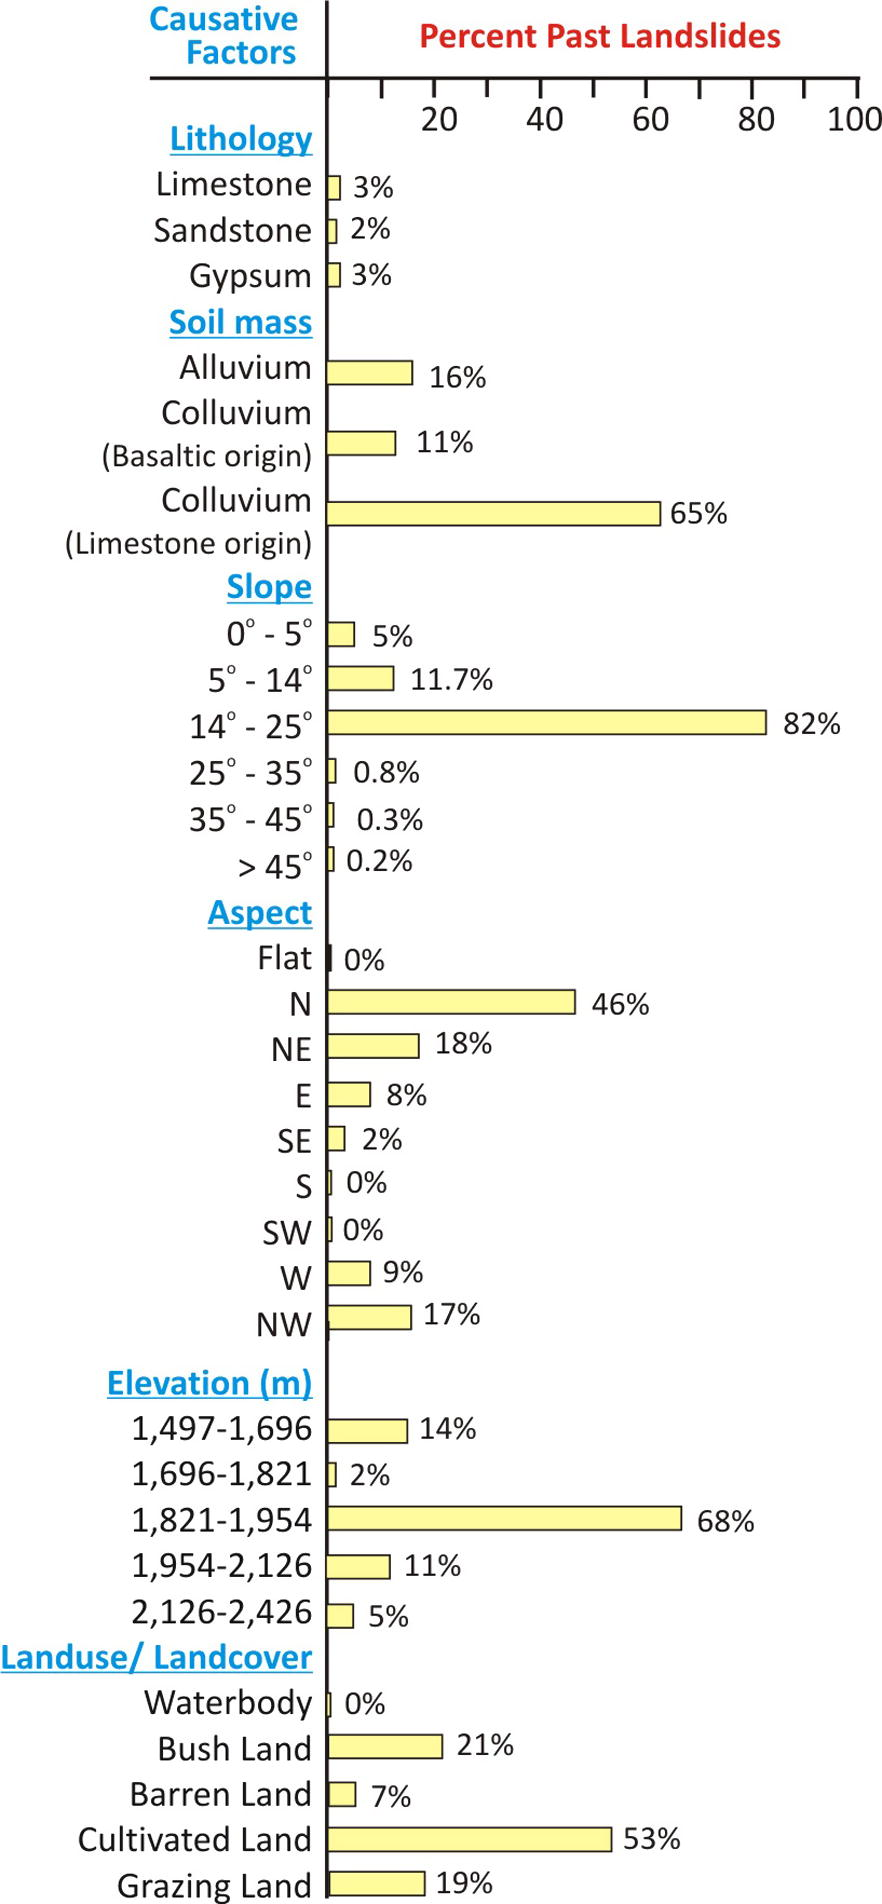
Past landslide distribution in corresponding classes of various causative factors.
5.2.2 Slope
In general, if the slope is steeper it will be more susceptible to instability as compared to gentle slope. The gravity pull which is the main driving force for instability is directly proportional to the slope gradient (Raghuvanshi et al., 2014; Bisson et al., 2013, 2014, 2010). The slope for the present study area was extracted from the digital elevation model (DEM). For the present study a slope category map was prepared for six categories: (i) 0–5°, (ii) 5–14° (iii) 14–25°, (iv) 25–35°, (v) 35–45° and (vi) >45° as shown in Fig. 6. From the past landslides inventory data the distribution of landslides showed that 82% of the landslides occurred in the slope class 14–25° (Fig. 5). About 0.8% past landslides occurred in slope class 25–35° and 0.3% of the landslides occurred in the slope class 35–45° whereas, the remaining 5.2% of landslides were observed either in slope class less than 5° or above 45°. The reason for high concentration of landslides within slope class 14–25° is evident from the fact that most of these slopes are formed by either colluvium or by the alluvial soils. Also, much of the cultivated land falls within this slope class, as relatively gentler slopes favor agriculture practice. Further, it is a known fact that agricultural activities over slopes generally result into increase of soil moisture because of irrigation practice, thus it may induce instability in the slopes (Raghuvanshi et al., 2014). The slopes having angles greater than 45° represent mostly limestone in the present study area which is generally kinematically stable.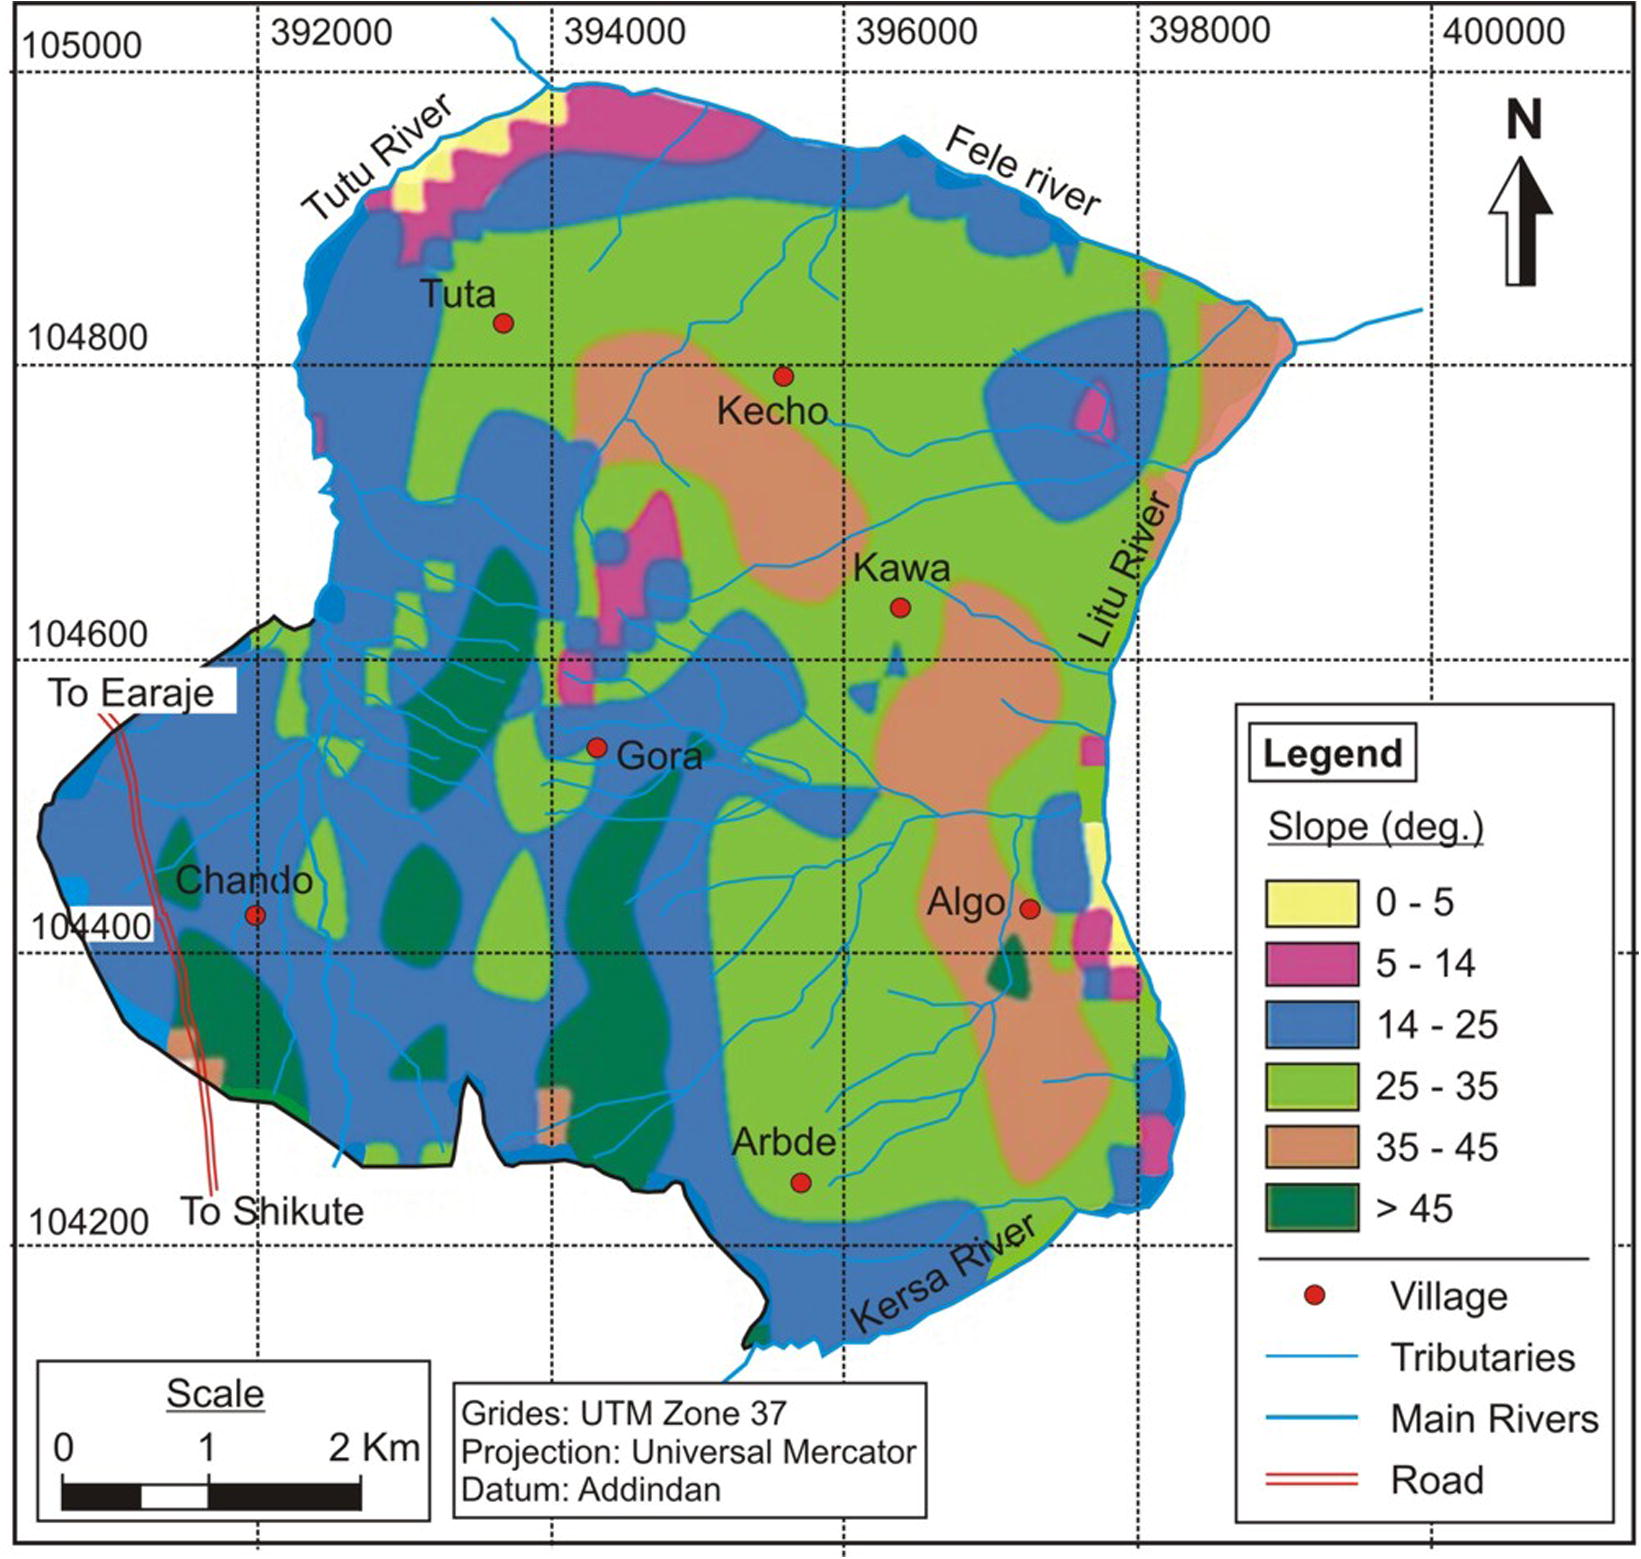
Slope map of the study area.
5.2.3 Elevation
For the present study the elevation was sub divided into five classes: 1497–1696 m, 1696–1821 m, 1821–1954 m, 1954–2126 m and 2126–2426 m, respectively (Fig. 7). Data on past landslides in the area indicate that the highest distribution of landslides (68%) falls in the elevation class 1821–1954 m. This is followed by elevation classes 1497–1696 m (14%) and 1954–2126 m (11%). Further, the elevation classes 2126–2426 m and 1696–1821 m showed very less landslide distribution with only 5% and 2% of landslides, respectively (Fig. 5). The high distribution of landslides in elevation class 1821–1954 m may be mainly related to the presence of colluvium and alluvial material on these slopes.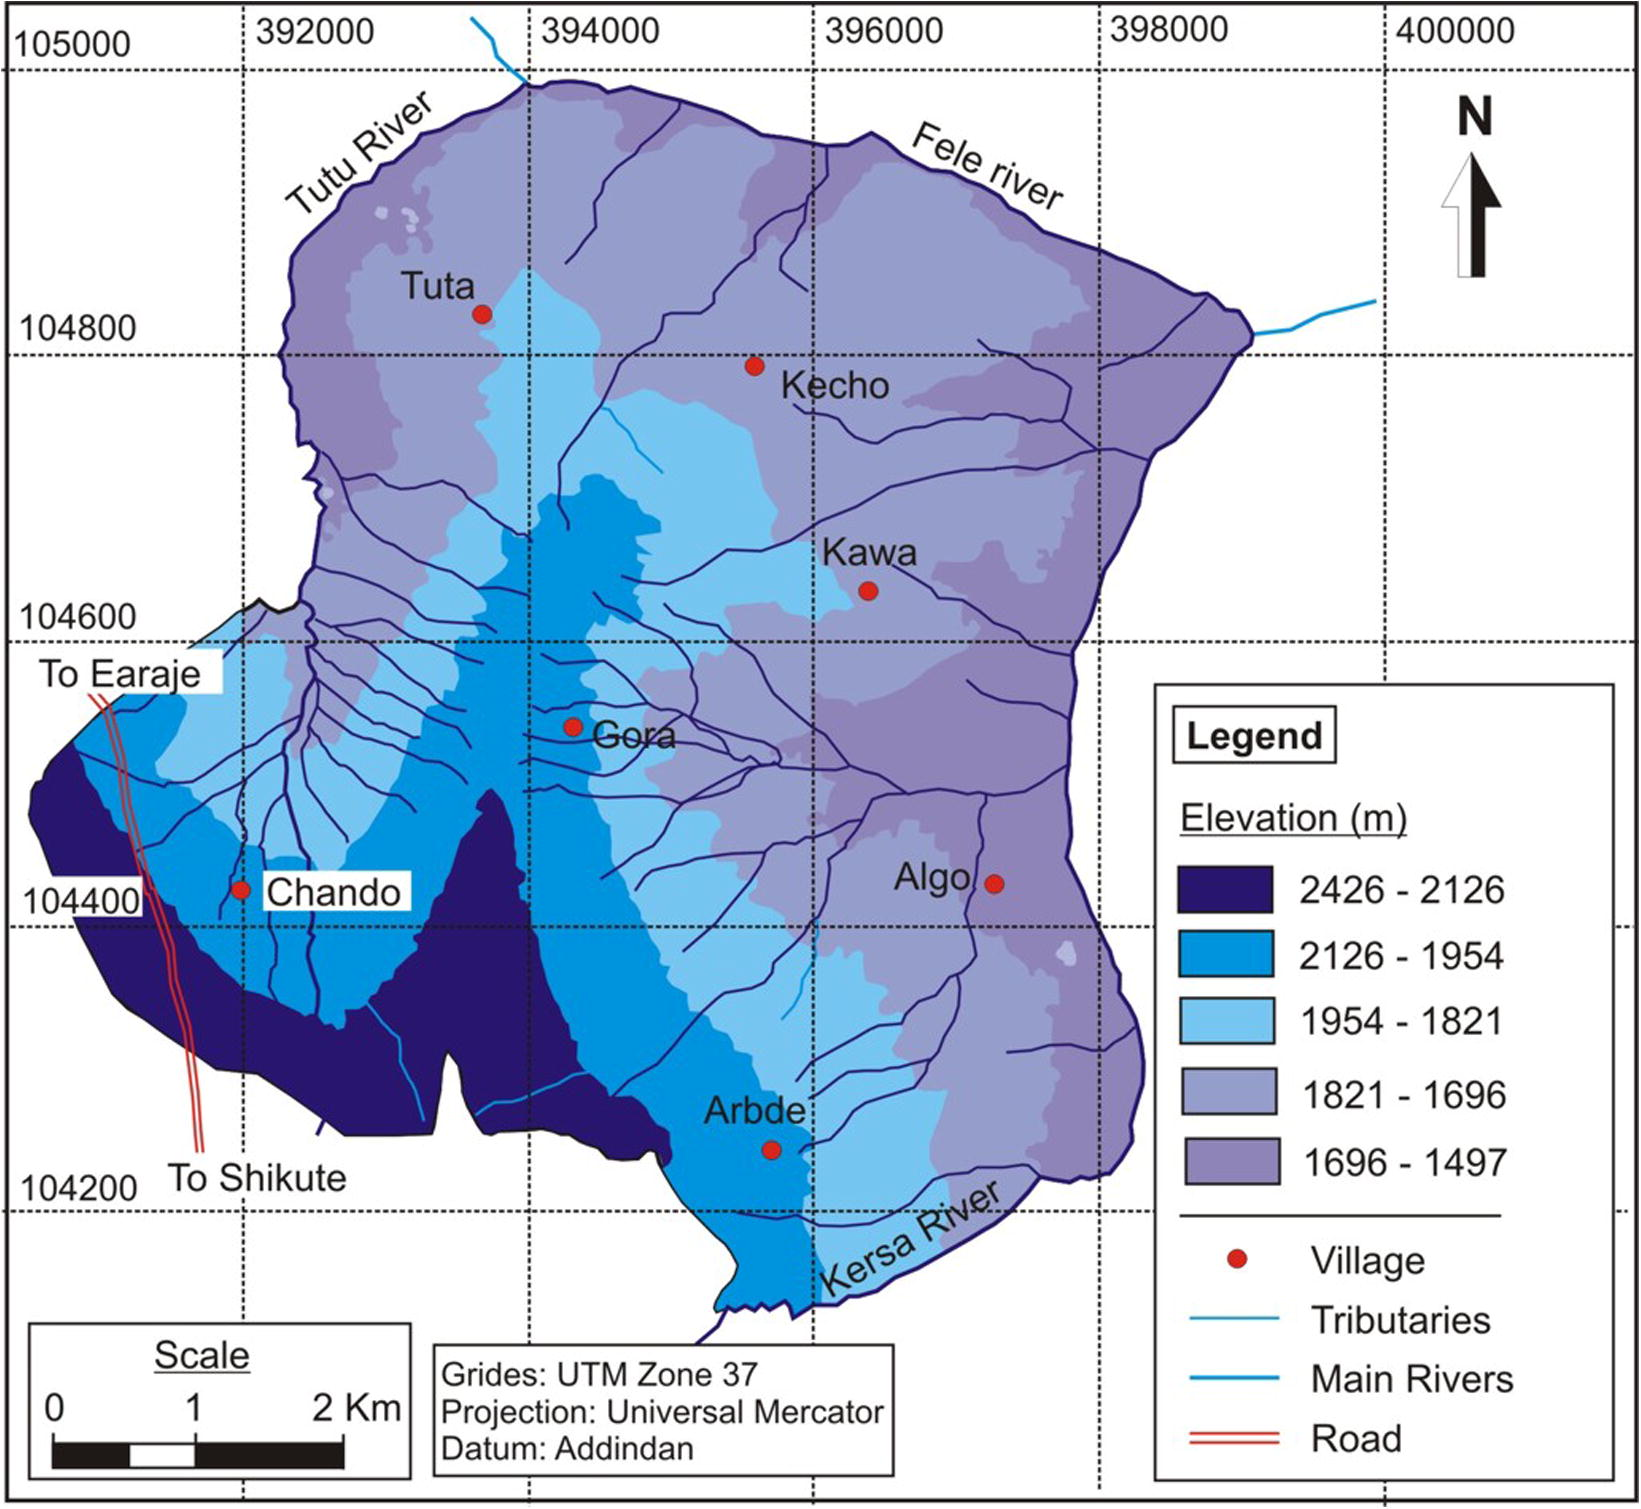
Elevation map of the study Area.
5.2.4 Aspect
The aspect of slopes in the present study area was derived from the DEM and it was classified into 9 classes; Flat (−1°), North (0–22.5°), Northeast (22.5–67.5°), East (67.5–112.5°), Southeast (112.5–157.5°), South (157.5–202.5°), Southwest (202.5–247.5°), West (247.5–292.5°) and Northwest (292.5–337.5°) (Fig. 8). The distribution of past landslides in the area with respect to aspect reveals that maximum landslides occurred on slopes which are inclined toward North direction (46%), followed by Northeast (18%) and Northwest (17%). The remaining, landsides occurred in slopes facing West (9%), East (8%) and Southeast (2%) directions, respectively (Fig. 5).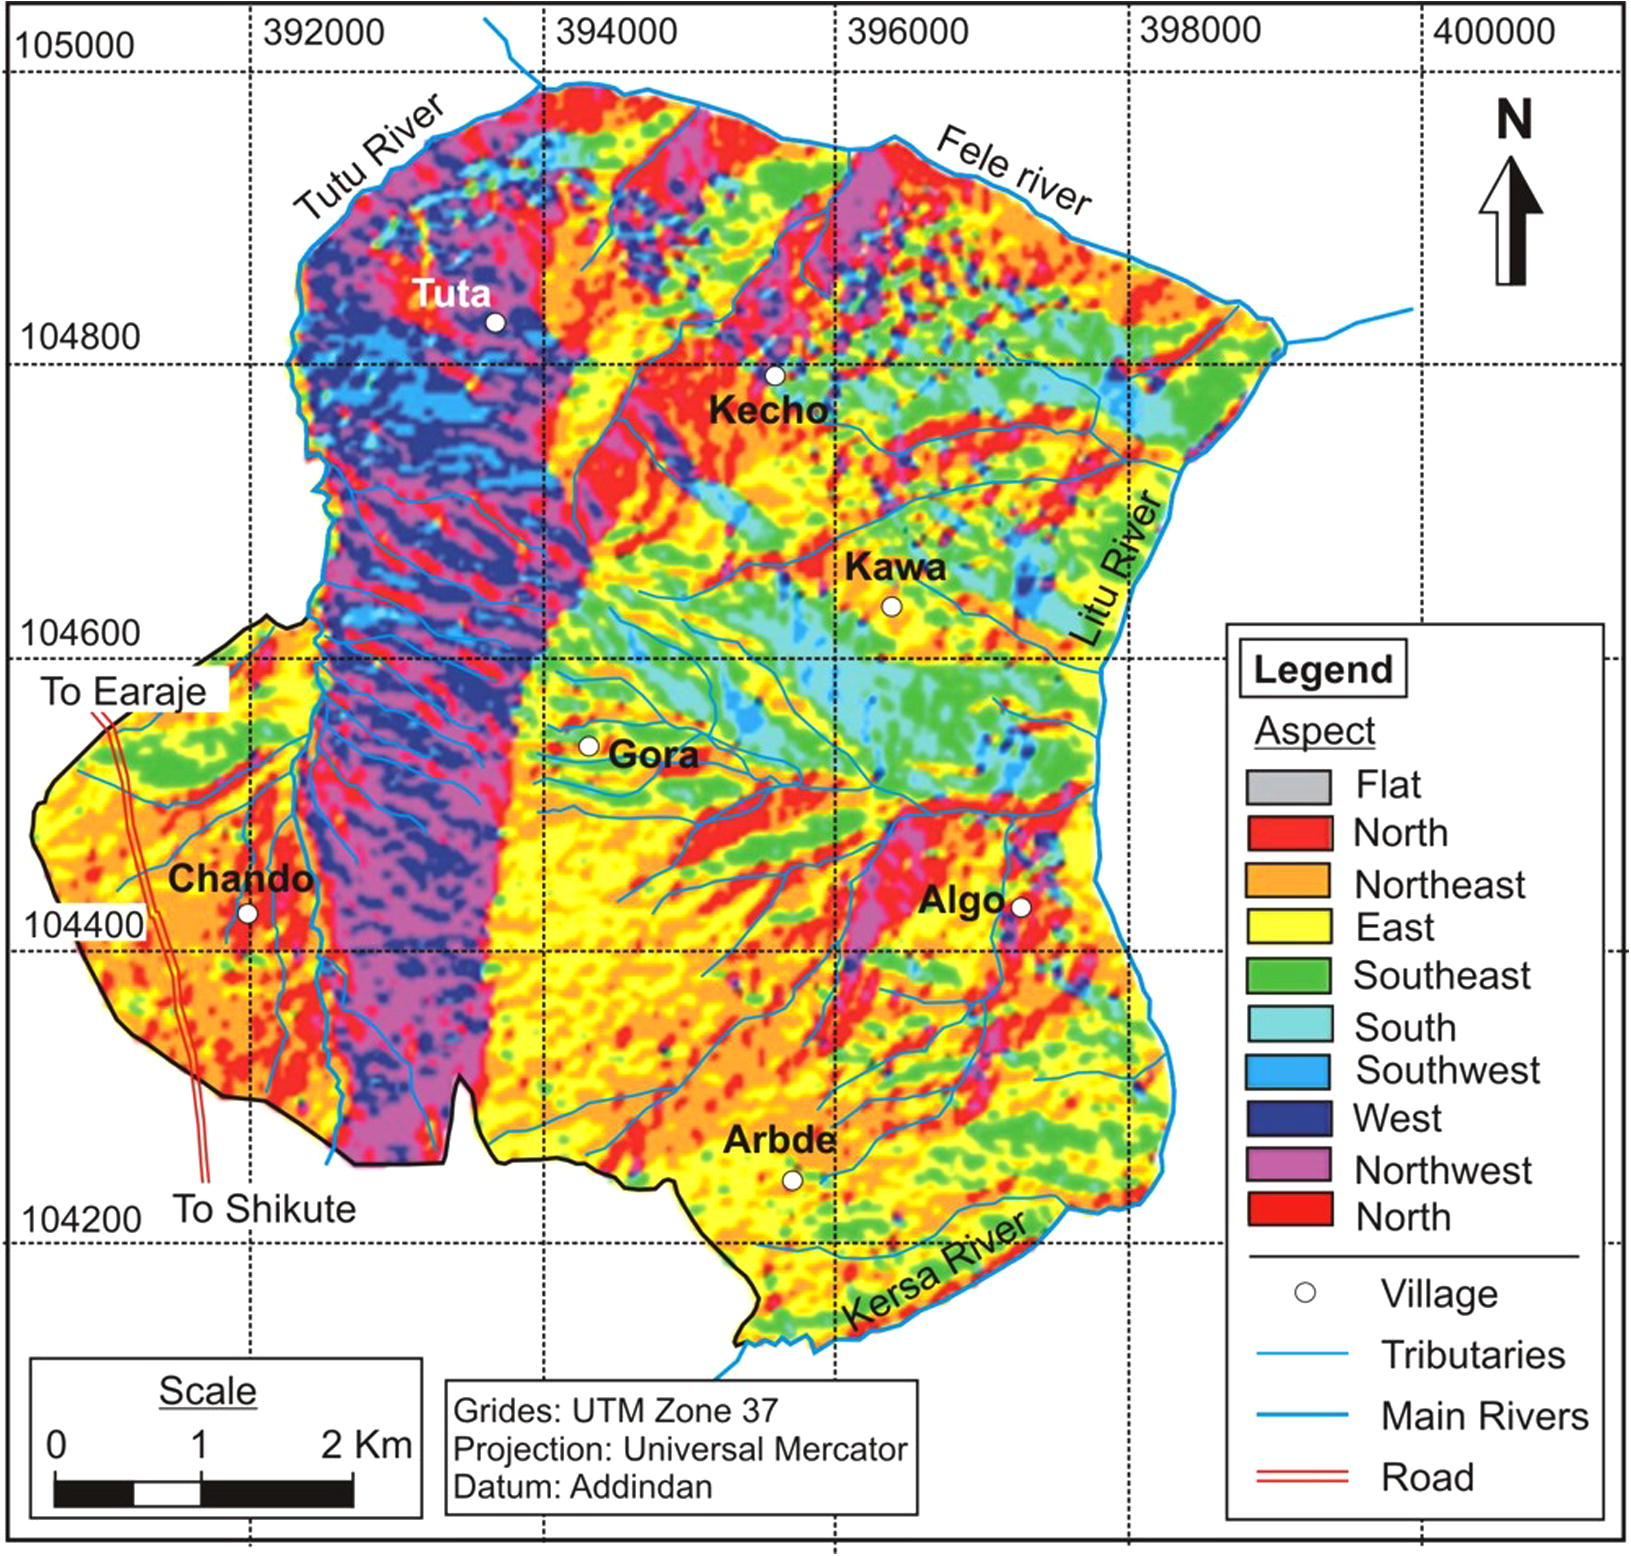
Aspect map of the study area.
5.2.5 Land use and land cover
For the present study land use and land cover map was prepared through supervised classification by utilizing satellite image of Landsat + ETM through ERDAS IMAGINE and the training of pixels was controlled with Google Earth (2014) image. The land use and land cover classes considered are; cultivated land, bush land, barren land and grazing land (Fig. 9). The distribution of landslides within various land use and land cover classes indicates (Fig. 5) that 53% of landslides occurred within cultivated land and 21% were recorded within bush land. Remaining landslides were recorded within grazing land (19%) and barren land (7%). The high concentration of landslides within the cultivated land is possibly related to two reasons; firstly most of the cultivated lands are within colluvium or alluvial soils, which are generally highly susceptible to instability and secondly cultivation activities such as; irrigation results into saturation of soil mass thus, resulting into reduction of shear strength of soil mass (Raghuvanshi et al., 2014).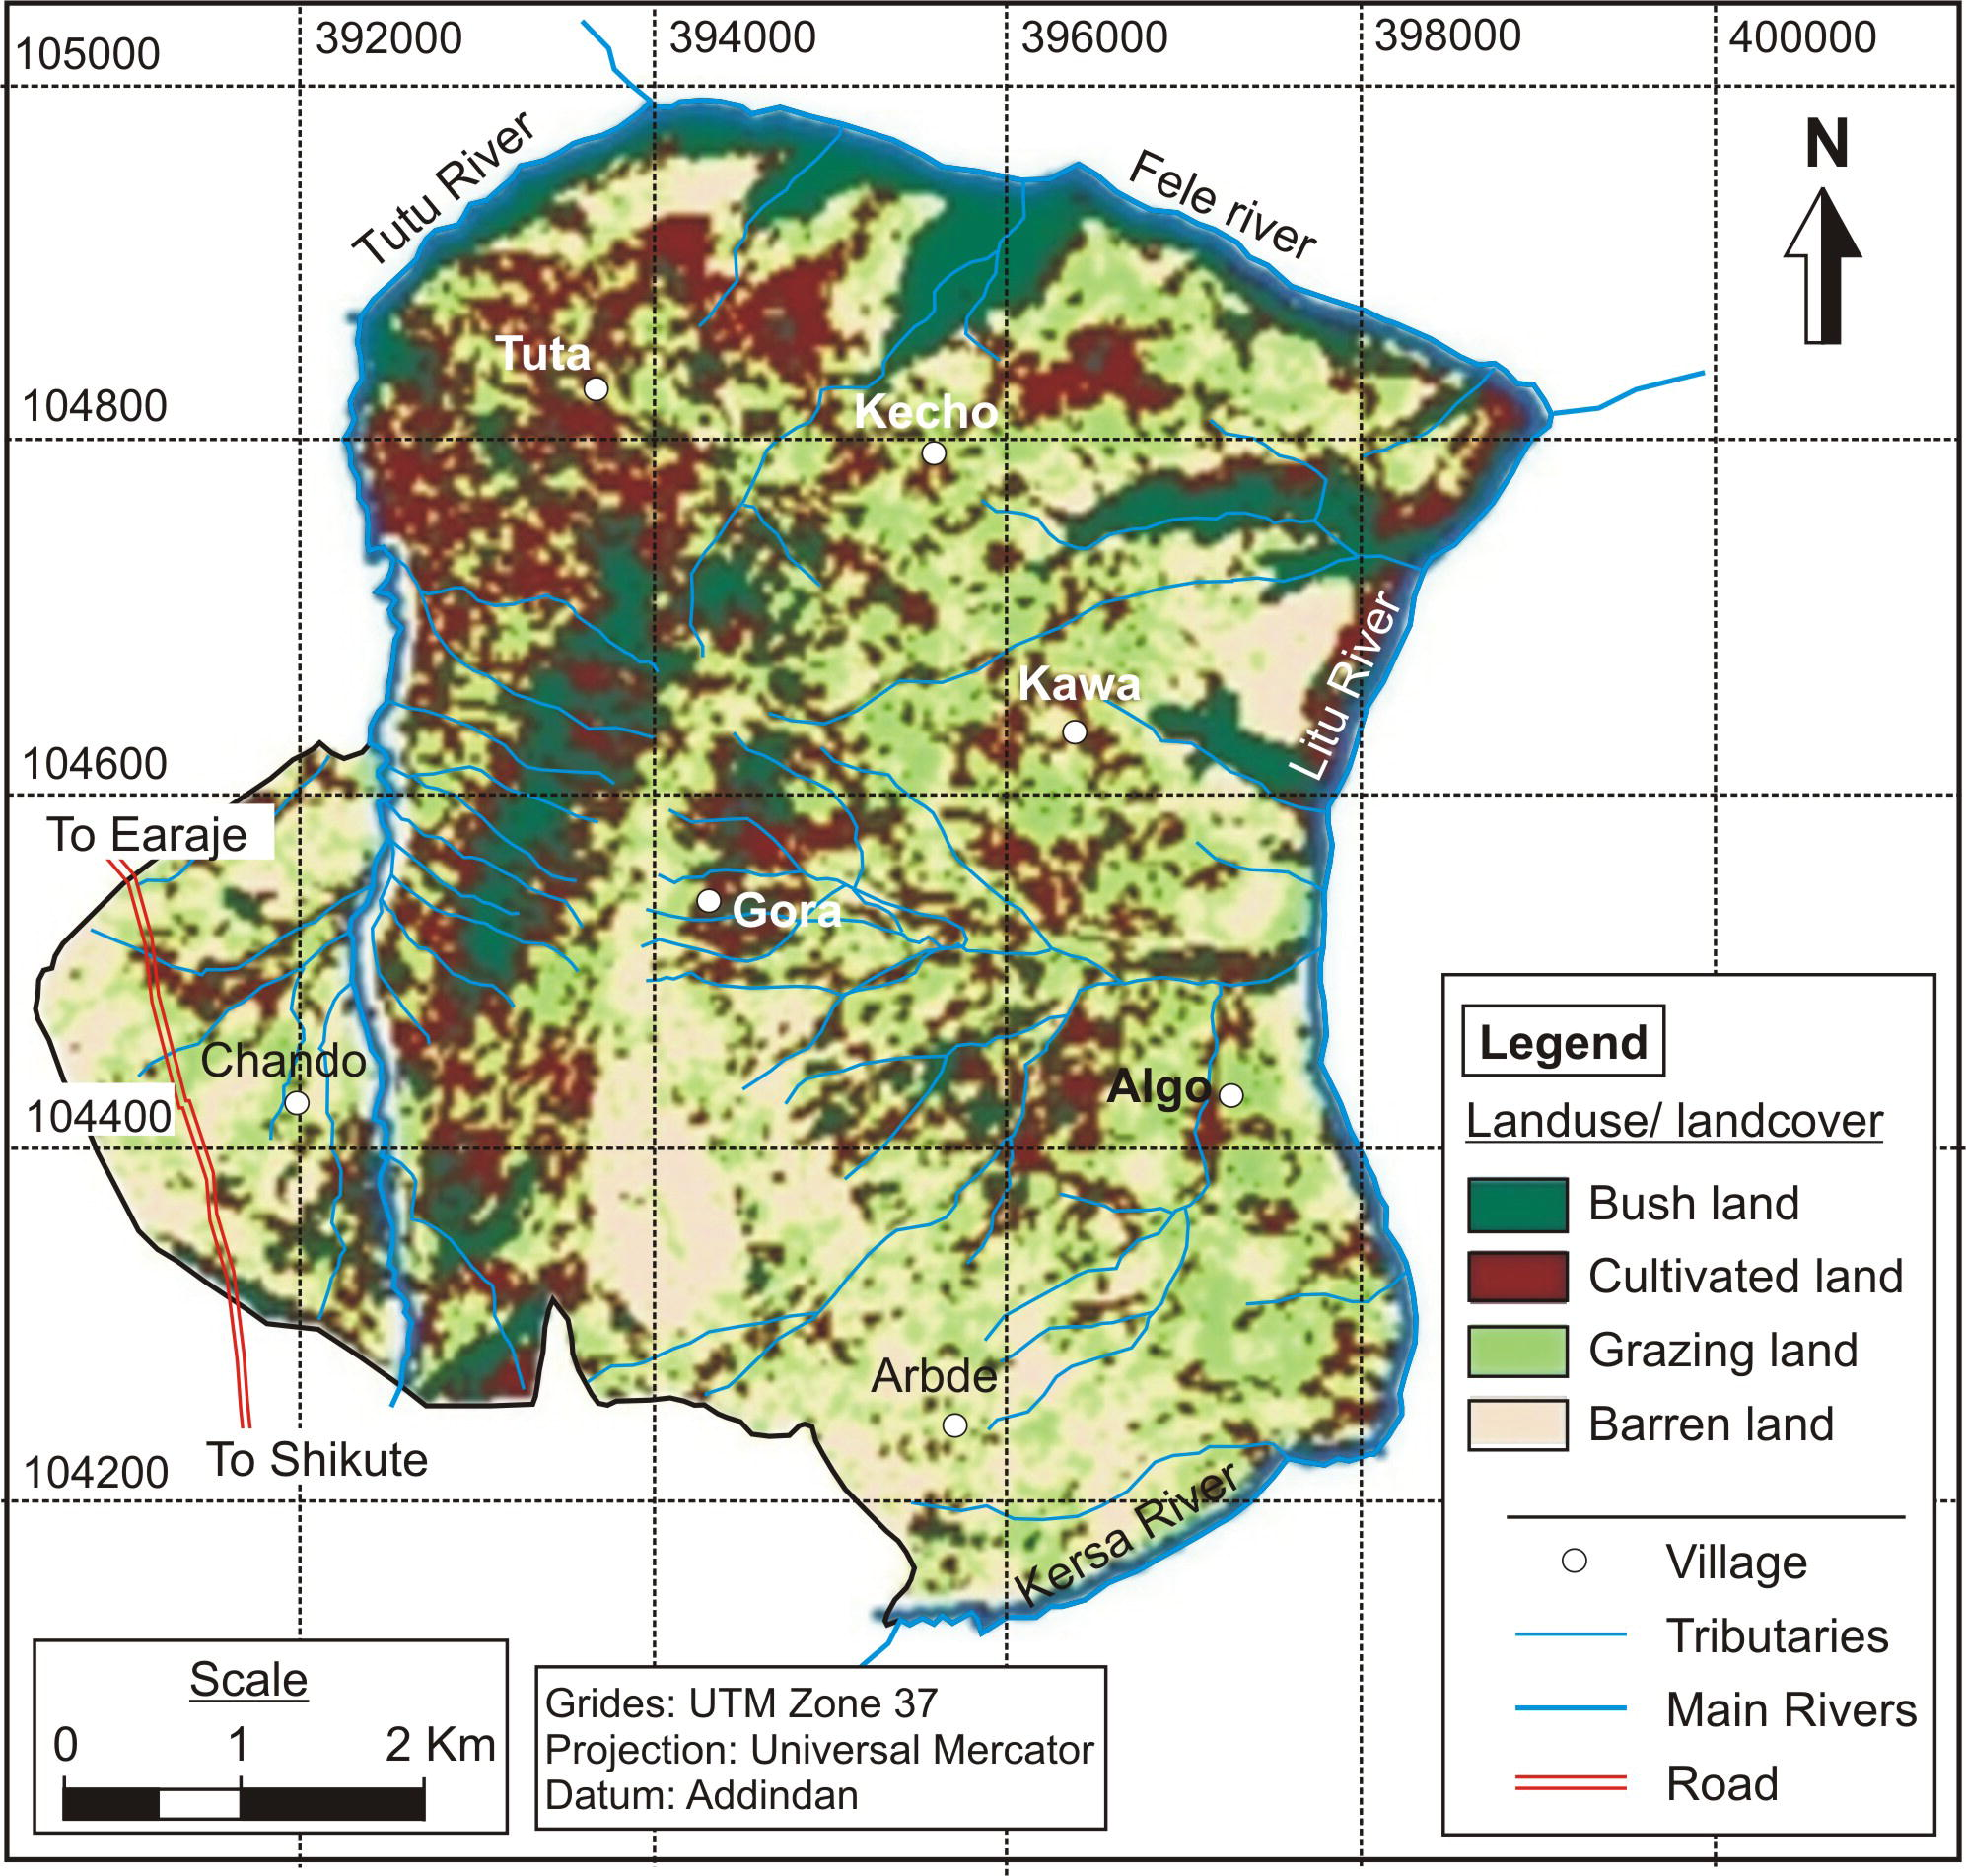
Land use/land cover map of the study area.
5.3 Landsilide hazard evaluation
In order to prepare the landslide hazard zonation map for the present study area bivariate statistical method was followed. The densities, derived for each factor class were later utilized to derive the ratings for each factor class that were statistically combined to know the landslide hazard in the area (Süzen and Doyuran, 2004). The technique followed in the present study has utilized ‘hazard index value’ for each factor class which is calculated as a ratio of landslide that ‘did’ occurr to landslide that ‘did not’ occurr within each factor class. Later, based on these hazard index values for each factor class and the assigned weight for each factor, hazard classes were deduced.
5.3.1 Spatial database design and preparation
Landslides in the study area were identified by field surveying and through image interpretation. Each existing landslide in the area was delineated through GPS point data along the periphery and later polygons were created with the help of Google earth image. Finally, a map depicting landslide boundaries, as polygons was produced which was later utilized for analysis in GIS environment. Further, a vector to raster conversion was performed to produce 15 × 15 m pixels raster data set of past landslides in the area. Besides, a spatial database on causative factors; lithology, soil mass, slope, aspect, elevation and land use/land cover was also prepared with the help of Arc map. The various data layers that were used for statistical analysis and for preparation of landslide hazard zonation map are shown in Table 1.
Classification
Sub classification
GIS data type
Scale
Geological hazard
Past landslides
Polygon coverage
1:50,000
Causative factor maps
Lithological map
Polygon coverage
1:50,000
Soil mass
Polygon coverage
1:50,000
Aspect map
Grid
30 × 30
Slope map
Grid
30 × 30
Elevation map
Grid
30 × 30
Landuse/landcover map
Grid
30 × 30
Image data
Satellite image of + ETM
Grid
30 × 30
In order to prepare the landslide hazard evaluation spatial data sets for all 6 causative factors were prepared. The lithological map of the present study area has been prepared from the Geological Map compiled by Geological Survey of Ethiopia 1973 (GSE, 2011). Suitable modification to this map was made through a field survey and appropriate digitization was done with the help of the satellite image. This map was prepared at a scale of 1:50,000. The digital elevation model (DEM), of the study area, at a resolution of 30 m was obtained from the ASTER data set. This DEM was utilized to extract slope, aspect and elevation of the study area. Further, land use and land cover map and soil mass map was prepared by utilizing Landsat + ETM satellite image through supervised classification.
5.3.2 Hazard analysis by probability method
Landslides generally occur as a result of instability conditions that may be induced due to a combined effect of various causative factors. Thus, it is reasonable to assume that future landslides in a given area may occur if similar type of conditions will re-occur that has led to the past landslides in the area (Raghuvanshi et al., 2015). Such a quantitative relationship between past landslides and different causative factors may be deduced with the help of frequency ratio (Eq. (1)) (Lee and Min, 2001).
The frequency ratio is defined as
The probabilistic approach followed in the present study has utilized the relationship between the past landslides in the area and each of the possible causative factors involved. If the “frequency ratio” is above unity, the given class of a particular causative factor will represent a strong relationship with the past landslide whereas, if this “frequency ratio” is less than unity, the given class of a causative factor will demonstrate a low relationship with the past landslide. Thus, the probability method utilizes the “frequency ratio” to represent quantitative relationship between each causative factor class and the past landslides in the area (Lee and Min, 2001).
In order to apply the probabilistic method the spatial data sets on 6 causative factors were prepared and processed so that it can be used in the GIS environment. Later, based on the frequency ratio of various considered classes of the causative factors, rating layers were prepared. The frequency ratio for various causative factor classes is presented in Table 2.
Causative factors and corresponding factor class
Landslides did not occurr
Landslides occurred
Hazard index (b/a)
Percent landslide occurrence
Count
Ratio (a) (%)
Count
Ratio (b) (%)
(a) Lithology
Limestone
1808
5.43
377
6
1.1
3%
Sandstone
691
2.07
109
1.6
0.77
2%
Gypsum
160
0.5
31
0.4
0.8
3%
(b) Soil mass
Alluvial
25,655
77
1938
30
0.38
16%
Colluvium Basaltic origin
1621
5
194
3
0.6
11%
Colluvium limestone origin
3318
10
3813
59
6
65%
Total
33,253
100
6462
100
−
100%
(c) Slope (degree)
0–5
583
2
356
6
3
5
5–14
1016
3
1283
20
6.67
11.7
14–25
221
1
3054
47
47
82
25–35
14,620
44
1138
18
0.41
0.8
35–45
14,082
42
532
8
0.19
0.3
>45
2731
8
99
1
0.13
0.2
Total
33,253
100
6462
100
−
100%
(d) Aspect
Flat
62
0.19
0
0
0
0%
N
2818
8.5
1673
25.89
3.04
46%
NE
9000
27.06
2275
35.2
1.30
18%
E
8022
24.12
862
13.34
0.55
8%
SE
3674
11.05
96
1.49
0.13
2%
S
1462
4.39
0
0
0
0%
SW
762
2.29
0
0
0
0%
W
2516
7.56
415
6.42
0.85
9%
NW
4937
14.84
1141
17.66
1.19
17%
Total
33,253
100
6462
100
−
100%
(e) Elevation (m)
1497–1696
6505
19.56
1311
20.29
1.03
14%
1696–1821
9087
27.32
255
3.95
0.14
2%
1821–1954
3703
11.15
3393
52.50
4.70
68%
1954–2126
6239
18.76
983
15.21
0.81
11%
2126–2426
7719
23.21
520
8.05
0.35
5%
Total
33,253
100
6462
100
–
100%
(f) Landuse/landcover
Water body
192
0.58
0
0
0
0%
Bush Land
4596
13.82
747
11.56
0.84
21%
Barren Land
10,933
32.88
644
9.97
0.3
7%
Cultivated Land
9587
28.83
3913
60.55
2.10
53%
Grazing Land
7945
23.89
1158
17.92
0.75
19%
Total
33,253
100
6462
100
–
100%
5.3.2.1 Landslide hazard potential of causative factors
5.3.2.1.1 Lithology and soil mass
The hazard analysis by the probability method clearly indicates that limestone has more probability for landslide occurrence, as for limestone the hazard index value is 1.1 (Table 2). Whereas, probability of occurrence of landslide for gypsum and sandstone is comparatively low as the hazard index values are 0.8 and 0.77, respectively. Further, the colluvium material of limestone origin showed a strong relationship with landslides in the area, as the hazard index value for this is 6. This indicates that the slopes which have colluvium material of limestone origin are more susceptible to landslides in the study area. In contrast alluvial and colluvial material of basaltic origin has low probability for landslide occurrence, as the hazard index values for both materials are less than 1 (Table 2).
5.3.2.1.2 Slope
The hazard index value computation for slope factor revealed that the slope class 14–25° has maximum probability for landslide occurrence in the area, as it has demonstrated a very high value (47) of hazard index. This is followed by slope class 5–14° which has hazard index value of 6.67 (Table 2). Even slope class 0–5° also showed a probability of landslide occurrence as the hazard index value is 3. However, slope classes 25–35°, 35–45° and >45° showed low probability of landslide occurrence, as the hazard index values for all these classes are less than 1. In general, it was observed in the study area that the gentler slopes (slope inclination less than 25°) are generally formed by colluvium and alluvial material which by its general behavior is susceptible to failure. However, few landslides of different nature were also observed in steeper slopes comprising colluvium and alluvial material, overlying different bed rocks.
5.3.2.1.3 Elevation
The maximum landslide hazard in the study area was recognized in elevation class 1821–1954 m, as the hazard index value for this elevation class was computed to be 4.7. Also, elevation class 1497–1696 m showed a moderate probability of landslide occurrence with hazard index value of 1.03 (Table 2). Much of the slopes within these elevation classes in the study area are occupied by cultivated land and generally have colluvium and alluvium soils. Thus, it is reasonable to say that colluvium and alluvium soils are susceptible to landslides and agricultural practices, further induce instability to these slopes. Further, elevation above 1954 m showed less probability of landslide occurrence, as the hazard index values computed were less than 1.
5.3.2.1.4 Aspect
In the present study area North facing slopes have maximum probability of landslide occurrence, as the hazard index value is determined to be 3.04. This is followed by, slopes facing Northeast and Northwest which have hazard index values of 1.3 and 1.19, respectively. The concentration of landslides in North, North east and Northwest directions may be related to the presence of colluvium and alluvial material and to some extent to agricultural practices. Further, during inventory mapping 18 springs were mapped in the area and they showed a remarkable relationship to slope aspect and distribution of landslides in the area.
5.3.2.1.5 Land use and land cover
The maximum probability of landslide occurrence was observed in cultivated land, as the hazard index value is determined to be 2.1, whereas, bush land, barren land and grazing land showed a low probability of landslide occurrence, as the hazard index value is less than 1 (Table 2). In the present study area much of the slopes are being used as cultivated land and are covered by colluvium and alluvial soils. These soils are generally susceptible to instability. Cultivation on such soils may further make these soils prone to landslides (Raghuvanshi et al., 2014). For this reason cultivated lands in the study area showed a higher hazard index value.
5.3.3 Landslide hazard zonation
During the present study six causative factors namely; lithology, soil mass, slope, aspect, elevation and land use/land cover were considered. It was assumed that these causative factors were probably responsible for landslides in the area. By using the probability method attempt was made to establish a spatial relationship between these factors and the past landslides in the area. By using the raster calculator in ArcGIS it was deduced that the total number of cells for the entire study area was 33,253 whereas the area covered by landslides has cell numbers equal to 6462. Further, analysis between all six causative factors and landslides was made to deduce correlation ratings that is, ratio of the number of cells where landslides do not occurr to the number of cells where landslides occurred (Table 2). Further, hazard can be defined as the ratio between the areas where landslides occurred to the total area. Thus, if the hazard value for the given area is more than ‘1’ it implies a higher probability of landslide occurrence (Lee et al., 2004). Later, raster maps of all six causative factors were processed so that each of them could be normalized as per their maximum values, to have possible Hazard Index (Hji) scaled to “1” (Table 3).
Causative factors (j)
Class (i)
Weighting (Wj)
Hazard index (Hji)
Hazard index scaled to 1 (Hji)
Hazard class
Lithology
Limestone
1
1.1
1
5
Sandstone
0.77
0.7
4
Gypsum
0.8
0.72
4
Soil mass
Alluvial
1
0.38
0.06
2
Colluvium basaltic origin
0.6
0.1
2
Colluvium limestone origin
6
1
5
Slope (degree)
0–5
1
3
0.06
2
5–14
6.67
0.14
3
14–25
47
1
5
25–35
0.41
0.01
1
35–45
0.19
0.004
1
>45
0.13
0.002
1
Aspect
Flat
1
0
0
1
N
3.04
1
5
NE
1.30
0.42
4
E
0.55
0.18
3
SE
0.13
0.04
1
S
0
0
1
SW
0
0
1
W
0.85
0.28
4
NW
1.19
0.4
4
Elevation (m)
1497–1696
1
1.03
0.22
4
1696–1821
0.14
0.03
1
1821–1954
4.70
1
5
1954–2126
0.81
0.17
3
2126–2426
0.35
0.07
2
Landuse/landcover
Water body
1
0
0
1
Bush land
0.84
0.4
4
Barren land
0.3
0.14
3
Cultivated land
2.10
1
5
Grazing land
0.75
0.36
4
The hazard zonation of the present study area was prepared by using Eq. (2)
The hazard map of the study area was prepared by setting a weight equal to ‘1’ for each of the 6 causative factors (Table 3). Equal weight for all causative factors was assigned with an assumption that each of the causative factors has contributed to landslides in the area and the relative contribution of each parameter cannot be assessed in quantitative terms. Further, the maximum value of Hazard (x) at any pixel obtained from Eq. (1) was scaled, so that it must be less than or equal to 1. Thus, through Eq. (2) landslide hazard zonation map of the study area was prepared by using ‘‘raster calculator’’ tool, available in ArcGIS 9.2.
Based on field judgment and logical consideration Hazard (x) at any pixel was classified into five classes as; No hazard (NH), Low hazard (LH), Medium hazard (MH), High hazard (HH) and Very high hazard (VHH). In order to get the most suitable hazard zonation in the present study area various distributions of Hazard (x) values were made. For each such attempt overlay analysis with past landslide data was attempted. The classification of Hazard (x) values presented in Table 4 provided the most reliable validation results with the past landslide data in the present study area. Fig. 10 presents the landslide hazard zonation map of the study area.
Hazard class
Hazard index (Hji) classification
Hazard class name
1
0.0–0.05
No hazard (NH)
2
0.05–0.12
Low hazard (LH)
3
0.12–0.18
Medium hazard (MH)
4
0.18–0.75
High hazard (HH)
5
0.75–1.0
Very high hazard (VHH)
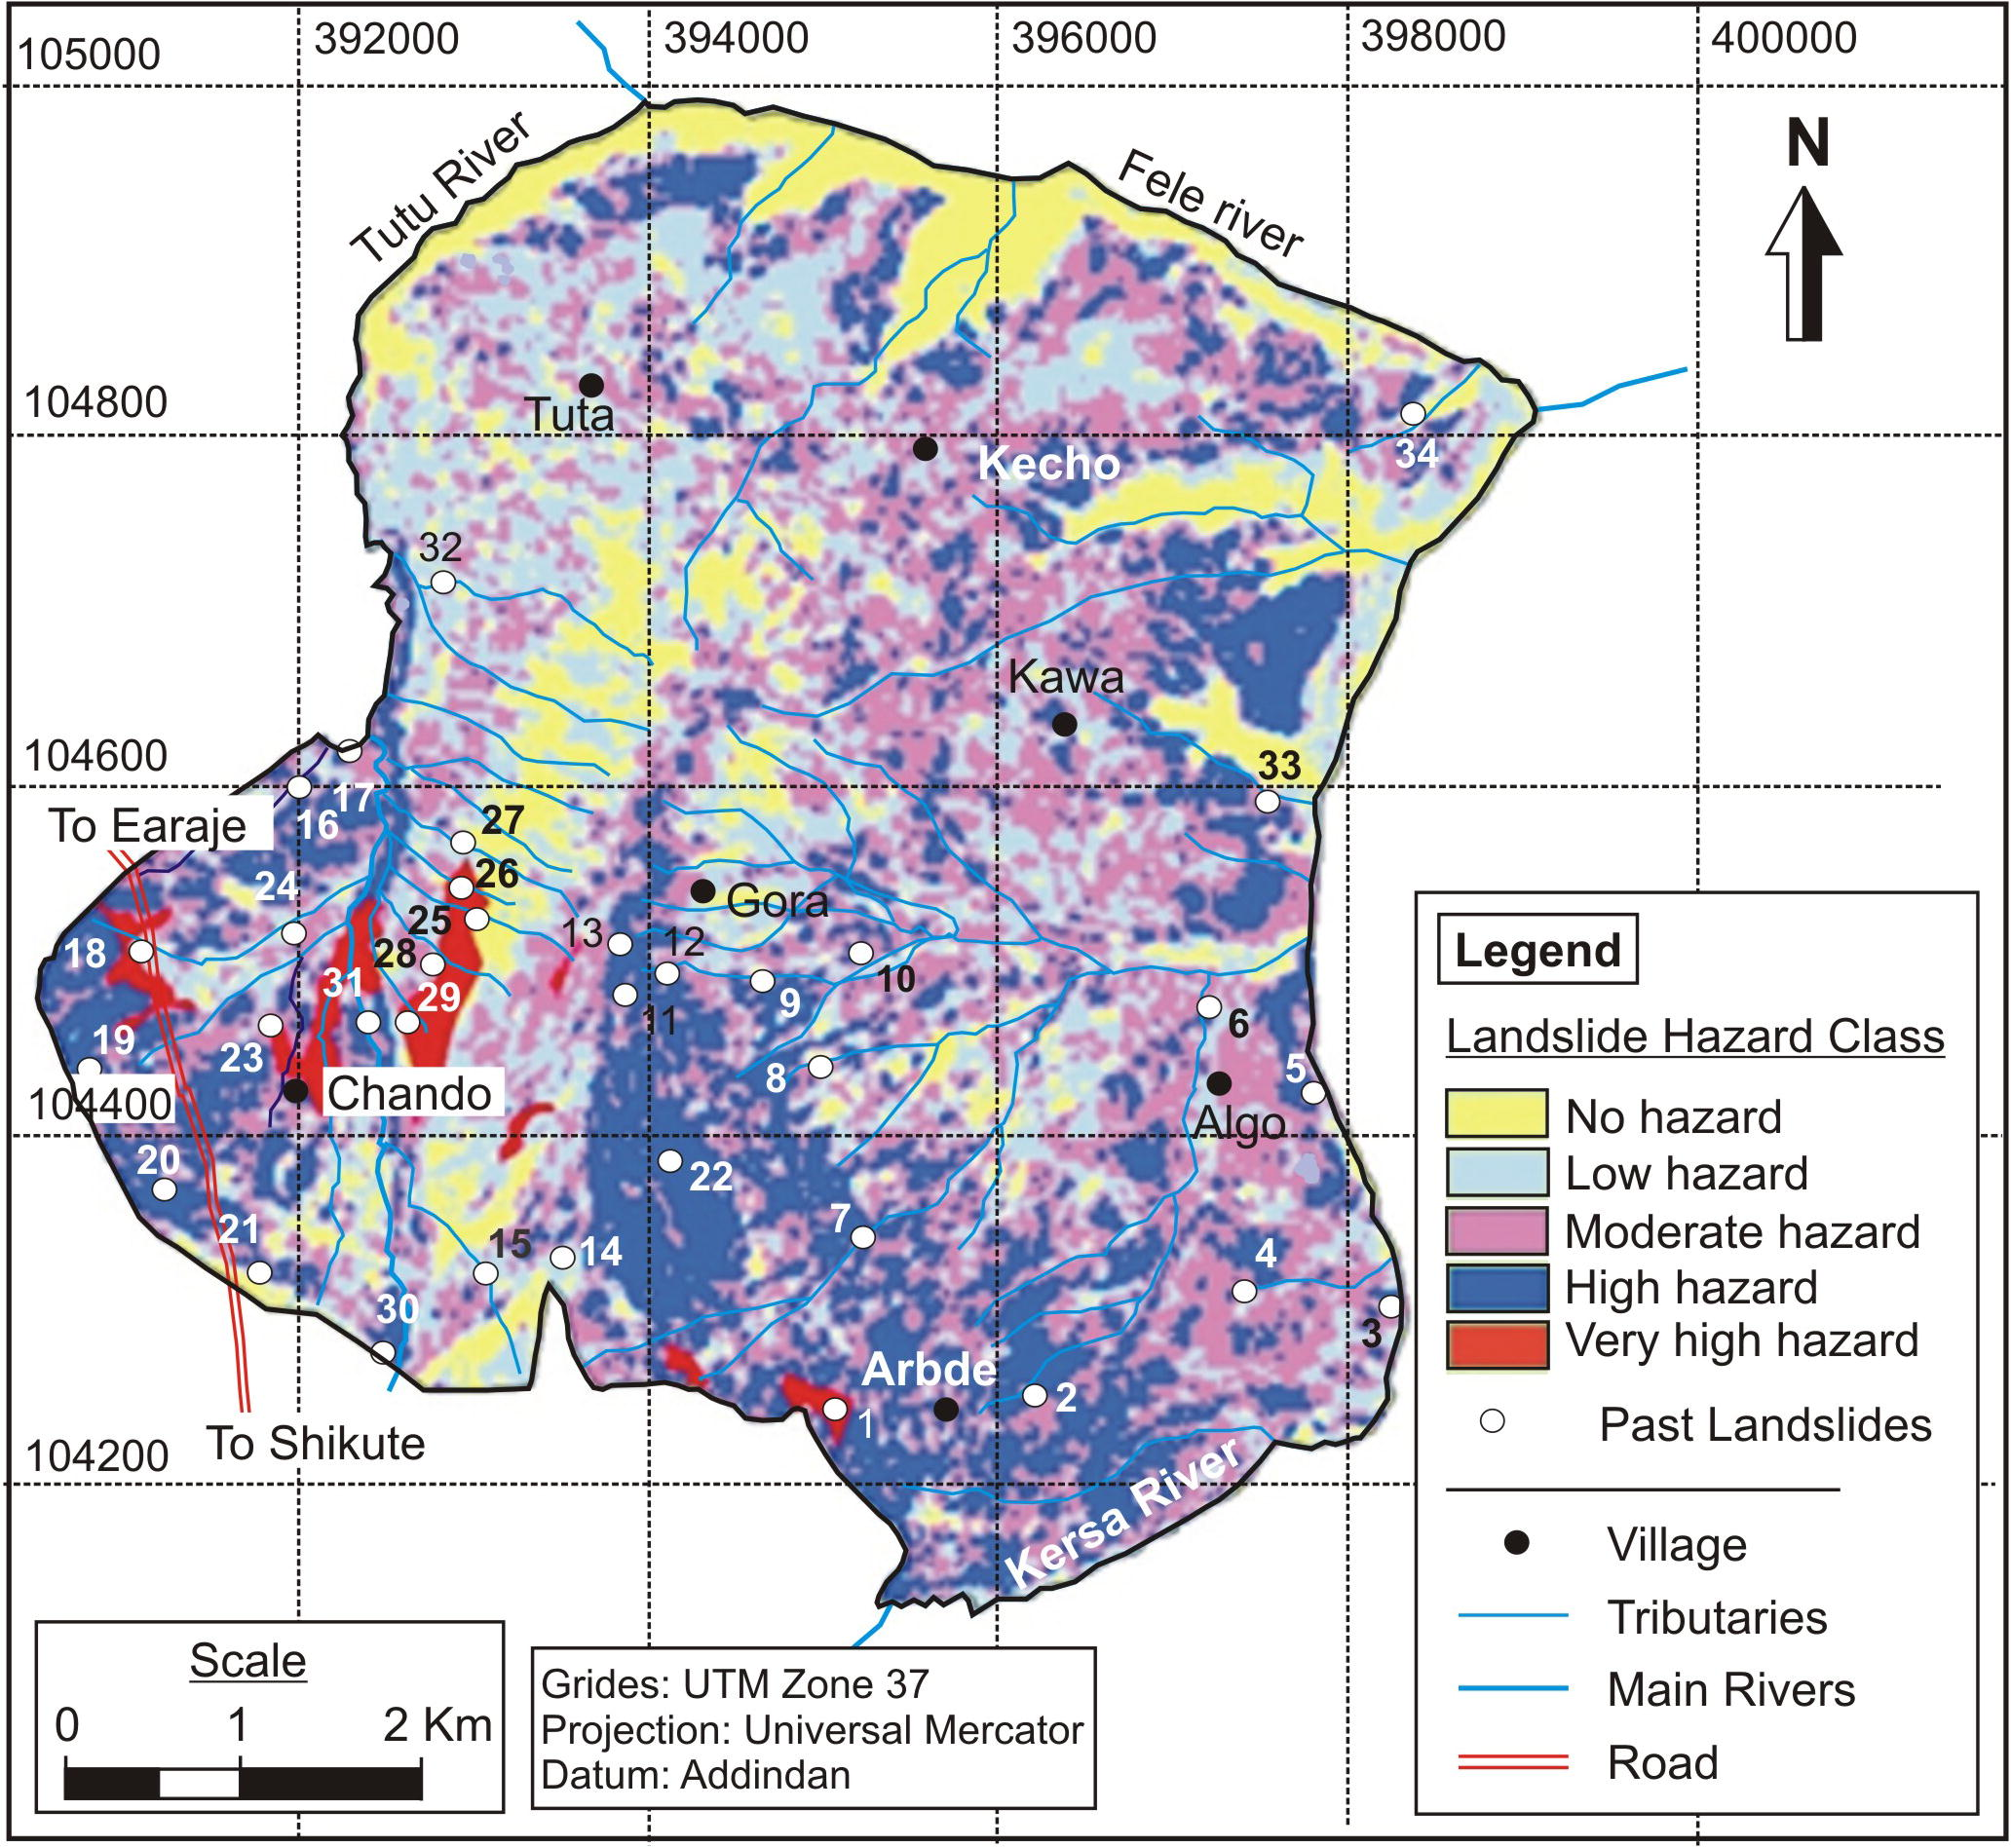
Landslide hazard zonation map.
6 Results and discussion
The landslide hazard map prepared for the present study area (Fig. 10), has revealed that 12% (5.64 km2) of the study area falls under no hazard, 27% (12.69 km2) as low hazard, 32% (15.04 km2) as moderate hazard, 21% (9.87 km2) as high hazard and the rest 8% (3.76 km2) as very high hazard. Further, perusal of Fig. 10 clearly indicates that very high hazard (VHH) zones are mainly concentrated in the southwestern regions of the study area. Similarly, high hazard (HH) zones are mainly distributed in southern and southwestern region with scattered distribution in eastern and northern regions in the study area. The moderate hazard (MH) zones have scattered distribution toward eastern and northern regions of the study area. Low hazard (LH) zones are more concentrated toward the northwestern region and scattered distribution in central and eastern regions of the study area. No hazard (NH) zones are mainly concentrated in the northern region with scattered distribution toward western and eastern regions of the study area.
The high concentration of VHH and HH zones in southwestern region is mainly related to the type of slope material present in this region; colluvial and alluvial soils, the presence of relative gentle slopes (14–25°) and presence of elevation class 1821–1954 m. The past landslide inventory data have showed that the slopes having angle in between 14–25° are most susceptible to landslides as 82% of past landslides has occurred within this slope class only. These slopes are mostly covered by alluvial and colluvium material which are most susceptible to slope instability. Further, about 68% of past landslides occurred in elevation class 1821–1954 m, thus this elevation class is also most susceptible to slope instability in the present study area.
6.1 Validation of LHZ map
An attempt was made to validate LHZ map prepared during the present study, for which overlay analysis was performed with the help of past landslide data. The overlay analysis revealed (Fig. 10) that 82% of the past landslides fall in the high hazard zone and 10% in very high hazard zone. Thus, 92% of the past landslide locations showed satisfactory agreement with the prepared LHZ map. The remaining 2% landslides fall in low hazard and 6% in moderate hazard zones. Thus, 8% of past landslides do not validate the prepared LHZ map. This is possibly due to limitation of the methodology followed in the present study as it was applied at a medium scale (1:50,000) (Ayele et al., 2014). Besides, factors such as; characteristics of discontinuities and their kinematic relation with slope, water forces within discontinuities, pore – water pressure and particle size distribution within soils etc. cannot be considered at this scale. These factors contribute to slope instability and can only be considered at a local scale (>5000) on individual slopes (Girma et al., 2015). Thus, it can safely be concluded that the prepared LHZ map has satisfactorily delineated various zones of potential landslide hazard in the study area. Further, these zones can practically be applied for regional planning and development of infrastructures in the area.
6.2 Landslide influencing causes in the study area
In general, the major causes of landslide in the study area were found to be hydrological and hydrogeological conditions, associated with gravity movements favored by typical geological and geomorphological conditions prevailing in the area. In fact these are the most common causes of instability of slopes particularly in highlands of Ethiopia (Woldearegay, 2013), of which the present study area forms a part. As per information gathered from the local respondents, the landslides in the area have been triggered solely due to heavy rainfall. Most of the landslides have occurred after heavy rainfall with high intensity, especially during or just after the rainy season, followed by an extremely dry season. Further, findings suggest that the most susceptible material responsible for landslide occurrence in the present study area is loose unconsolidated colluvium deposits forming moderately steep slopes. In general, the colluvium soils are most susceptible to instability (Raghuvanshi et al., 2014).
Inventory mapping during the present study has revealed that, five prominent types of landslides have occurred in the study area. These are; debris flow, translational, rotational, fall and complex modes of failures. Out of total 34 past landslides, 56% (19) were recognized as debris flow, 26% (9) as translational slide, 3% (1) as rotational, 12% (4) as fall and remaining 3% (1) as complex type of failure. Transitional mode of failure was observed mostly in colluvium and alluvial soil mass. Also, debris flow was observed mostly on gentle slopes mainly formed by colluvium material. Fall, Rotational and complex modes were recognized in limestone, colluviums and alluvial soils, respectively. Most of the landslides were surficial and involved alluvial and colluvium material of limestone origin. Also, some old landslides showed manifestation of reactivation, especially immediately below the cliff forming limestone in the area. Further, during the field survey it was observed that debris flow and translational mode of failures are the two predominant modes of failure which are mainly concentrated in the northern and southwestern regions of the study area. This fact was further validated with the hazard zonation as VHH and HH zones are concentrated toward the southwestern region of the study area.
The slopes having angles between 14 and 25° are most susceptible to landslides as 82% of past landslides occurred within this slope class. The slopes which have a slope angle in the range of 14–25° are mostly covered by alluvial and colluvium materials and as such these soil types are most susceptible to slope instability. Also, about 68% of past landslides have occurred in elevation class 1821–1954 m, thus this elevation class is most susceptible to slope instability. The high concentration of past landslides in this elevation class may be related to the presence of colluvium and alluvial materials on these slopes. Besides, much of the cultivated land falls within this elevation class. The distribution of past landslides in the area with respect to aspect reveals that maximum landslides occurred on slopes which are inclined toward North direction (46%), followed by Northeast (18%) and Northwest (17%) directions. The concentration of landslides in North, Northeast and Northwest directions may be related to the presence of colluvium and alluvial material and to some extent to agricultural practices. Further, springs in the area have shown remarkable relationship to aspect and distribution of landslides in the area.
The effect of groundwater on landslides was analyzed indirectly with the help of springs present in the area and the result showed a high correlation of springs with active landslide occurrences. As already stated in the previous paragraph, most of the landslides in the area are surfacial and involved alluvial and colluvium material of limestone origin. Such soil mass when saturated due to recharge of ground water from rain water may reduce its shear strength and at the same time the weight of the saturated soil mass will also be increased, thus instability of the soil mass will increase (Raghuvanshi et al., 2014; Girma et al., 2015).
In the present study area much of the slopes are being used as cultivated land and are covered by colluvium and alluvial soils. These soils are most susceptible to instability and cultivation over such soils may further make these soils prone to landslide. This fact is also validated by the presence of 53% of landslides that has occurred within cultivated land.
7 Conclusion
The present study was conducted in parts of Jeldu District in Central Ethiopia. The main aim of the present study was to evaluate landslide hazard and to prepare a landslide hazard zonation map of the study area. For this a thorough inventory of past landslides was undertaken to understand the relationship of various causative factors on past landslides and their likely contribution for landslides in the area. The causative factors that were considered in this study are; lithology, soil mass, slope, aspect, elevation and land use/land cover. As a part of the methodology followed, spatial relationship between causative factors and landslide occurrence was derived by using the probability method. In this study, GIS based statistical and probability approach was used to rate the governing parameters and later customized raster calculation was applied to develop the landslide hazard map.
The landslide hazard evaluation revealed that 12% (5.64 km2) of the study area falls under no hazard, 27% (12.69 km2) as low hazard, 32% (15.04 km2) as moderate hazard, 21% (9.87 km2) as high hazard and the rest 8% (3.76 km2) as very high hazard. Further, the validation of the LHZ map through overlay analysis revealed that 82% of the past landslides fall in the high hazard zone and 10% in very high hazard zone. Thus, 92% of the past landslide locations showed satisfactory agreement with the prepared LHZ map.
The general findings of the present study revealed that the major causes of the landslide in the present study area are hydrological and hydrogeological conditions associated with gravity movements favored by typical geological and geomorphological conditions that prevailed in the area. The landslides in the area have been triggered solely due to heavy rainfall.
Frequently occurring landslides have damaged the farmland, houses, and killed animals in the study area. Due to all these factors, some zones are potentially dangerous for any future habitation and development. Thus, there is an immediate need to implement mitigation measures in the very high hazard and high hazard zones, or such zones need to be avoided for habitation or for any future developmental activities.
Acknowledgement
The authors are thankful to the Head and staff of the School of Earth Sciences, Addis Ababa University for providing all kinds of support. The authors are also thankful to the locals residing in and around the study area for their kind support during the field data collection.
Further, we are also thankful to the anonymous esteemed reviewers whose meticulous review work has helped in improving the overall quality of the present research work.
References
- Landslide hazard evaluation and zonation mapping in mountainous terrain. Eng. Geol.. 1992;32:269-277.
- [Google Scholar]
- The effect of seasonal rainfall on landslides in the highlands of Ethiopia. Bull. Eng. Geol. Environ.. 1999;58:9-19.
- [Google Scholar]
- Slope failures in the Blue Nile basin, as seen from landscape evolution perspective. Geomorphology. 2004;61:1-22.
- [Google Scholar]
- Landslide susceptibility mapping using GIS-based weighted linear combination, the case in Tsugawa area of Agano River, Niigata Prefecture, Japan. Landslides. 2004;1:73-81.
- [Google Scholar]
- Application of remote sensing and GIS for landslide disaster management – a case from Abay Gorge, Gohatsion – Dejen section, Ethiopia. In: Singh M., Singh R.B., Hassan M.I., eds. Landscape Ecology and Water Management, Proceedings of International Geographical Union (IGU) Rohtak Conference. In: Singh M., Singh R.B., Hassan M.I., eds. Adv. Geogr. Environ. Sci.. Japan: Springer; 2014. p. :15-32.
- [Google Scholar]
- Inventory of landslides and susceptibility mapping in the Dessie area, Northern Ethiopia. Eng. Geol.. 2004;77:1-15.
- [Google Scholar]
- Rapid terrain-based mapping of some volcaniclastic flow hazard using GIS-based automated methods: a case study from southern Campania, Italy. Nat. Hazards. 2010;55:371-387.
- [CrossRef] [Google Scholar]
- A map for volcaniclastic debris flow hazards in Apennine areas surrounding the Vesuvius volcano (Italy) J. Maps 2013
- [CrossRef] [Google Scholar]
- Volcaniclastic fl ow hazard zonation in the sub-apennine vesuvian area using GIS and remote sensing. Geosphere. 2014;10
- [CrossRef] [Google Scholar]
- GIS technology in mapping landslide hazard. In: Carrara A., Guzzetti F., eds. Geographical Information System in Assessing Natural Hazard. Netherlands: Kluwer Academic Publisher; 1995. p. :135-175.
- [Google Scholar]
- An inventory-based approach to landslide susceptibility assessment and its application to the Virginio River Basin, Italy. Environ. Eng. Geosci.. 2004;3:203-216.
- [Google Scholar]
- Modelling the impact of predicted climate change on landslide frequency and magnitude in SE England. Eng. Geol.. 2000;55:205-218.
- [Google Scholar]
- Landslide hazard and risk: issues, concepts, and approach. In: Glade T., Anderson M., Crozier M., eds. Landslide Hazard and Risk. Chichester: Wiley; 2005. p. :1-40.
- [Google Scholar]
- Roadside slope failures in nepal during torrential rainfall and their mitigation. Slope Failures and Landslides: Disaster Mitigation of Debris Flows; 2006. p. :503-514.
- Terrain-based mapping of landslide susceptibility using a geographical information system: a case study. Can. Geotech. J.. 2001;38:911-923.
- [Google Scholar]
- Aspect of Climate and Water Balance in Ethiopia. Addis Ababa, Ethiopia: Addis Ababa University Press; 1977. p. :79.
- A multi-method approach to study the stability of natural slopes and landslide susceptibility mapping. Eng. Geol.. 2006;82:241-263.
- [Google Scholar]
- Landslide hazard zonation in Ada Berga District, Central Ethiopia – a GIS based statistical approach. J. Geomatics. 2015;90:25-38. (i)
- [Google Scholar]
- Unpublished, Geosciences Report on Dessie area, Addis Ababa, Ethiopia. 2011. p. :101.
- Landslide hazard evaluation: a review of current techniques and their application in a multi-scale study, central Italy. Geomorphology. 1999;31(1–4):181-216.
- [Google Scholar]
- Rock Slope Engineering (revised third ed.). London: Inst. of Mining and Metallurgy; 1981. 358 pp
- A comparative study of conventional, ANN black box, fuzzy and combined neural and fuzzy weighting procedures for landslide susceptibility zonation in Darjeeling Himalayas. Eng. Geol.. 2006;85:347-366.
- [Google Scholar]
- Geological Map of Ethiopia. In: Ministry of Mines, Energy and Water Resources, Geological Survey of Ethiopia (First edition). 1973. Addis Ababa, Ethiopia
- [Google Scholar]
- Explanation of the geological map of Ethiopia. Geol. Surv. Ethiop. Bull.. 1975;1:1-15.
- [Google Scholar]
- Statistical analysis of an earthquake-induced landslide distribution—the 1989 Loma Prieta, California event. Eng. Geol.. 2000;58:231-249.
- [Google Scholar]
- Landslide hazard spatial analysis and prediction using GIS in the Xiaojiang Watershed, Yunnan, China. Eng. Geol.. 2004;76:109-128.
- [Google Scholar]
- Statistical analysis of landslide susceptibility at Yongin, Korean. Environ. Geol.. 2001;40:1095-1113.
- [CrossRef] [Google Scholar]
- Determination and application ohf the weights for landslide Susceptibility mapping using an artificial neural network at south, Korean. Eng. Geol.. 2004;71:289-302.
- [Google Scholar]
- Landslide risk mapping: problems, limitation and developments. In: Cruden Fell, ed. Landslide Risk Assessment. Rotterdam: Balkema; 1997. p. :239-250.
- [Google Scholar]
- Exploration of the Geological Map of Ethiopia. Ethiopia, EIGS: Technical publications Team; 1996. p. :99.
- A GIS-based landslide hazard assessment by multivariate analysis Landslides. J. Jpn. Landslide Soc.. 2008;45(3):187-195.
- [Google Scholar]
- A seismic landslide susceptibility rating of geologic units based on analysis of characteristics of landslides triggered by the 17 January, 1994 Northridge, California earthquake. Eng. Geol.. 2000;58:251-270.
- [Google Scholar]
- Slope stability susceptibility evaluation parameter (SSEP) rating scheme – an approach for landslide hazard zonation. J. Afr. Earth Sci.. 2014;99:595-612.
- [Google Scholar]
- GIS based grid overlay method versus modeling approach – a comparative study for Landslide Hazard Zonation (LHZ) in Meta Robi District of West Showa Zone in Ethiopia, Egypt. J. Remote Sens. Space Sci.. 2015;18:235-250.
- [Google Scholar]
- Data driven bivariate landslide susceptibility assessment using geographical information systems: a method and application to Asarsuyu catchment, Turkey. Eng. Geol.. 2004;71:303-321.
- [Google Scholar]
- Landslide Types and Processes. In: Turner A.K., Schuster R.L., eds. Landslides: Investigation and Mitigation, Transportation Research Board Special Report 247. Washington, D.C: National Academy Press, National Research Council; 1996.
- [Google Scholar]
- Spatial forecast of landslides in three gorges based on spatial data mining. Sensors. 2009;9:2035-2061.
- [Google Scholar]
- Review of the occurrences and influencing factors of landslides in the highlands of Ethiopia. Momona Ethiop. J. Sci. (MEJS). 2013;5(1):3-31.
- [Google Scholar]


