Translate this page into:
Modification of commercial activated carbon for the removal of 2,4-dichlorophenol from simulated wastewater
⁎Corresponding author. Tel.: +60 88 320000x3222; fax: +60 88 320348. anis_zaman@ums.edu.my (S.M. Anisuzzaman),
-
Received: ,
Accepted: ,
This article was originally published by Elsevier and was migrated to Scientific Scholar after the change of Publisher.
Abstract
In this study, modification of commercial activated carbon (AC) has been examined for the removal of 2,4-dichlorophenol (2,4-DCP) from aqueous solutions. The modified process involves impregnation of phosphoric acid at ratios of 0.6–2.4 followed by 500 °C and 700 °C for 2 h. The effect of different impregnation ratios and activation temperatures was studied. Physical and chemical characterization of modified AC was conducted including percentage yield, moisture content, ash content, pH, morphology study and functional groups. The adsorption of 2,4-DCP by modified AC was also investigated. Various tests were conducted on the unmodified AC and chemically modified AC at different contact times (5–60 min) and adsorbent dosages (0.1–0.9 g). Results revealed that the modified AC (AC2) prepared with impregnation ratio, Xp value of 1.2 at 500 °C for 2 h was found to have the highest percentage removal of 2,4-DCP (50 ppm), which is 93.63%. The modified AC showed better capability to adsorb 2,4-DCP from aqueous solutions, the percentage removal was improved to 20.40%. Elovich and intraparticle diffusion kinetic models were used to test the adsorption kinetics. The adsorption of 2,4-DCP proved to fit better in the intraparticle diffusion model compared to Elovich equation. The mechanism of the adsorption process was determined by the intraparticle model.
Keywords
Adsorption
2,4-Dichlorophenol
Activated carbon
Wastewater
1 Introduction
Awareness of the water pollution has been a major concern for environmentalists worldwide. Phenolic compounds are the most common water pollutants which include a wide variety of organic chemicals (Nevskaia et al., 1999). This is due to phenols and its derivative used as intermediates in the synthesis of dyes, pesticides, explosives, insecticides and others (Rodriguez-Mirasol et al., 2004). Phenolic waste disposal into waterways affects not only human beings but also flora and fauna as well (Alam et al., 2009). In virtue of the high toxicity and poor biodegradability of phenols, it is necessary to remove them before discharging it into water bodies (Wang et al., 2011).
Various treatment technologies are applied to remove organic pollutants. Techniques used include adsorption, chemical reaction, filtration, ion-exchange, coagulation/flocculation, reverse osmosis, electrodialysis, and others (Hameed et al., 2009; Mohan et al., 2008). Mohanty et al. (2005), stated that adsorption onto the surface of activated carbon (AC) is the most widely used method for the removal of phenol from wastewater. Generally, AC plays an important role in water treatments and serves as a contaminant removal media (Nevskaia et al., 1999). Besides, Gong et al. (2007) also stated that AC has been used as an adsorbent for decades to remove contaminants from industrial wastewater. AC is commonly applied in removing toxic pollutants like phenols and its derivative which act as a vital group of refractory organic compounds that are present in industrial wastewater (Rodriguez-Mirasol et al., 2004). AC is also well known for the effectiveness in removing organic chemicals from wastewater (Krishnaiah et al., 2013; Monser and Adhoum, 2002).
AC can be manufactured from any types of carbonaceous materials. In commercial practice, the most common raw materials used are coal, peat, lignite, wood, coconut shell, and agricultural by-products (Anisuzzaman et al., in press; Baccar et al., 2009; Girgis and Ishak, 1999; Yacob and Al Swaidan, 2012). The useful characteristics of AC are high surface area, microporous structure, pore volume, great adsorption capacity, effective regeneration, and chemical nature of their surface (Attia et al., 2008; Karagoz et al., 2008; Momcilovic et al., 2011; Tham et al., 2011). Due to high porosity of AC, they are commonly used in industrial purification and chemical recovery operations (Teng et al., 1998). Modification and impregnation techniques were applied to increase surface adsorption and removal capacity and add selectivity to carbon (Monser and Adhoum, 2002). There are two processes in modifying AC, which are physical activation and chemical activation. The physical method involves two pyrolysis stage processes of precursor, which are in inert atmosphere, and activation of the solid residue product at high temperatures (Budinova et al., 2006). According to Budinova et al. (2006), traditional chemical treatment by using phosphoric acid (H3PO4) activation consists of impregnation of the raw material with water solution of acid and continued by pyrolysis in inert atmosphere at temperatures between 350 °C and 600 °C. The benefits of using chemical treatment are the low temperature needed in the process, and shorter treatment time. As there is only one single step needed, and the global yield is greater because the burn-off char is not required (Budinova et al., 2006; Mohanty et al., 2005).
Chemical activation by using H3PO4 has long been known and used in the production of AC in industry (Puziy et al., 2002). According to Teng et al. (1998), H3PO4 and zinc chloride (ZnCl2) are more common among numerous dehydrating agents. However, they mentioned that ZnCl2 will produce contaminant of zinc compounds, thus it is not preferable. Moreover, as ZnCl2 will cause problems of corrosion, inefficient chemical recovery and environment pollution, H3PO4 is the better chemical treatment (Baccar et al., 2009). The usage of H3PO4 in place of ZnCl2 is also studied by Benadjemia et al. (2011). Moreover, H3PO4 activation has advantages over the traditional thermal activation scheme as it undergoes one pyrolysis step at lower temperature (400–600 °C), outcomes with a higher carbon yield (35–50%), and mostly impregnation can be recovered by multi-stage extraction (Girgis et al., 2007).
This study is focused on modifying commercial AC by using chemical treatment. The parameters that were studied are the impregnation ratios and activation temperature toward the removal of 2,4-dichlorophenol (2,4-DCP). The characterization of modified AC (MAC) was conducted by using several instruments including Scanning Electron Microscope (SEM), Fourier Transform Infrared (FTIR) Spectroscopy. Low temperature nitrogen adsorption isotherms were used to estimate the BET surface area and pore size, volume and distribution of the selected AC samples. UV–vis spectrophotometer was used to detect the residual concentration of 2,4-DCP from the extracted samples while the reaction kinetic and isotherm of adsorption of MAC in the removal of 2,4-DCP in aqueous medium was studied using Elovich and intraparticle diffusion kinetic models to understand the mechanism of adsorption by AC (Song et al. 2010).
2 Materials and methods
2.1 Preparation of AC
In this experiment, the AC AK 7080 was purchased from Kekwa Indah Sdn. Bhd, Malaysia. It is coconut shell based AC in granular form. AC made from charcoal of the hard-shell of the coconut has some inherent properties such as high microporosity, high density, low attrition loss, intrinsic hardness, low ash content, etc. The AC is transferred into a conical flask after weighting.
2.2 Impregnation using phosphoric acid (H3PO4)
In the impregnation process, 10 g of AC was impregnated with 30 mL of 20%, 40%, 60% and 80% w/v H3PO4 solution. The conical flask was enclosed with parafilm. Few holes were punched onto the parafilm in order to let the vapors evaporate. The mixture was put into Protech 721 orbital for 3 days to dissolve the solution. After drying, the product was transferred to Pyrex petridish. The petridish was weighted before use. The chewy liquid formed product was further dried in the oven at 120 °C for 24 h. Thereafter, the impregnated AC was weighted and put into the muffle furnace.
2.3 Procedure of activation
The impregnated AC was placed in Carbolite RHF 1500 muffle furnace. In this study, activation temperature is one of the parameters that are being tested. Hence, the impregnated AC is heated at 500 °C and 700 °C for 2 h. The AC was weighted again after cooled down to room temperature. After activation process, the MAC was refluxed 3 times with distilled water for 3 h. This step was done to remove metal ions, which are the inorganic impurities on the surface. Drying process was carried out again at 110 °C for 24 h.
2.4 Determination of percentage yield
The percentage of yield can be obtained by taking initial mass of the impregnated sample divided by the final mass of sample at the end of activation process by the following equation:
2.5 Determination of moisture content
The moisture content in AC was determined by using the SIRIM method (1984). About 1.0 g of AC was placed in a drying oven at 110 °C for 2 h. The AC was then cooled in a desiccator and repeatedly weighted. The equation of moisture content is as below:
2.6 Determination of ash content
After the moisture content determination, AC was then transferred to a crucible. The AC was burned in a muffle furnace at 500 °C for 4 h. Then, it was cooled in a desiccator and weighted. The equation of ash content determination is shown below (SIRIM, 1984)
2.7 Determination of pH
The pH measurement was done by using Mettler Toledo pH meter. About 1.0 g of AC was weighted in a 200 mL Erlenmeyer flask. 100 mL water was added and then heated under gentle boiling. The solution was cooled to room temperature. The solution was then diluted with water to 100 mL. Finally, it was stirred and the pH was determined immediately.
2.8 Scanning Electron Microscopy (SEM) analysis
SEM is an instrument which applied a narrow electron beam to scan over the surface of the specimen which is coated with a thin layer of metal. Secondary electron will be collected by a detector and produce a three-dimensional image on television screen. By using SEM, the morphology, pore structure, and structural changes of activated carbon can be observed (Wang et al., 2011). AC was prepared in granular form and placed at the sample placement. After the AC was coated, SEM (JEOL JSM-5610LV, Japan) was run to determine its characteristics.
2.9 Fourier Transform Infrared Spectroscopy (FTIR) analysis
In this study, commercial AC was modified using chemical treatment. Hence, changes in the functional group should be compared. Both the commercial and modified activated carbon was analyzed by FT-IR Spectroscope (FTIR-100, Perkin Elmer) to detect the surface functional group. A small amount of dry AC was crushed into powder form and tested. The spectra were recorded from 4000 to 400 cm−1 (Shaarani and Hameed, 2011).
2.10 Specific surface area and pore-distribution
The specific surface area and the pore-size distribution were determined using the Brunauer, Emmet and Teller (BET) and Barret, Joyner and Halenda (BJH) methods, respectively. The BET surface area and pore size distribution were determined from nitrogen isotherm at 77.3 K using Quanta chrome autosorb automated gas sorption instrument. Prior to analysis, the adsorbents are out gassed for 12 h under vacuum at 110 °C. The specific surface area was determined according to the BET method at the relative pressure range of 0.05–0.3.
2.11 Adsorption of 2,4-DCP onto AC
The 2,4-DCP was used as adsorbate as the targeted pollutant in this study. The 2,4-DCP (99% purity) from Acros Organic was used without further purification. 1.0 g of DCP powder was prepared and dissolved to produce a 1000 ppm DCP stock solution. The stock solution was then kept in a condition of 4 °C to maintain the stability of the content. 100 mL of 10 ppm, 20 ppm, 30 ppm, 40 ppm and 50 ppm was prepared by dilution from stock solution. The concentration of DCP was calculated using the calibration curve after obtaining the absorbance value via running a UV–vis spectrophotometer at the wavelength of peak maxima. All samples were analyzed using a quartz cuvette.
3 Results and discussion
3.1 Percentage yield
Data of impregnation ratio (Xp), percentage yield, moisture, ash content of MAC are shown in Table 1. The percentage yield of MAC is in the range of 76.52–87.65%. From Table 1, it shows that AC2 with impregnation ratio, Xp = 1.2 and 500 °C activation temperature shows the best percentage yield which is 87.65% while the lowest percentage yield is AC8 with 76.52% by using Xp = 2.4 H3PO4 and 700 °C activation temperature.
Sample
Impregnation ratio, Xp
Activation temperature, °C
Percentage yield (%)
Moisture (%)
Ash (%)
pH
AC1
0.6
500
86.72
5.6
5.4
5.4
AC2
1.2
500
87.65
5.2
5.8
5.2
AC3
1.8
500
84.68
6.4
7.4
5.3
AC4
2.4
500
83.94
8.6
15.0
5.2
AC5
0.6
700
82.55
5.4
6.8
5.6
AC6
1.2
700
81.43
6.8
7.2
5.3
AC7
1.8
700
80.96
7.4
8.6
5.3
AC8
2.4
700
76.52
9.2
15.8
5.3
Increasing impregnation ratio showed an increase in percentage yield until it reaches the optimum Xp = 1.2 at 500 °C. The purpose of H3PO4 is to inhibit the release of volatile matter and produce AC in higher yields. However, the percentage yield started to reduce when the value of Xp exceeds more than 1.2. According to Nik et al. (2006), further increase in the concentration of H3PO4 used will result in a continuous decrease in percentage yield. They have stated that H3PO4 performed as a dehydrating agent that can inhibit the formation of tar and other liquids that might fill the pores of samples during activation. The graph also illustrated a decreasing trend of percentage yield with increasing temperature from 500 °C to 700 °C. This trend is similar to the research that was done by Mohanty et al. (2005). Girgis and Ishak (1999) also further proved that activation with H3PO4 is effective at low temperature. Based on the finding by Teng et al. (1998), in the range of 600–800 °C, polyphosphoric acids will decompose or evaporate. Generally, the percentage yield is high and these data signify the ability of H3PO4 to withhold carbon and prevent the loss of volatile materials (Girgis and Ishak, 1999). Overall, percentage yield is influenced by concentration of dehydrating agent and activation temperature.
3.2 Moisture content
Moisture content is one of the factors that will influence adsorption capacity of AC. The moisture content of unmodified AC was 4.3%. As seen in Table 1, the overall moisture content is less than 10%. AC2 showed the lowest moisture content which is 5.2% and the highest is AC8 with 9.2%. As results show in Table 1 there is no significant effect of impregnation ratio and activation temperature toward the percentage of moisture content. Based on the study done by Madhavakrishnan et al. (2008), they suggested that no correlation between moisture content and adsorption power of carbon.
3.3 Ash content
Ash content is used to determine the quality of AC. The ash content for unmodified AC is 3.6% while for modified AC is in the range of 5.4–15.8% (Table 1). Table 1 shows a trend of increasing ash content with increasing concentration of dehydrating agent, H3PO4. Polyphosphates that are entrapped in the final product will depend on its availability to leaching. Therefore, high ash content (5–9%) is the result from the residual of entrapped dehydrated acid products and also acid character on the carbon products at pH 4.0–6.2 (Girgis and El-Hendawy, 2002).
3.4 pH value
The pH value of AC is mainly based on the inorganic ingredients in the source material or added during manufacture. In this study, acidic pH values were obtained. This is due to phosphorus-containing compounds such as polyphosphates, which may form during impregnation (Puziy et al., 2002). The values are then controlled to be in the range of 5–7 by undergoing washing process with sodium hydroxide. According to Fox et al. (1973), pH value below 8 is more favorable for adsorption of 2,4-DCP.
3.5 Scanning Electron Microscopy (SEM) analysis
SEM was applied to observe the morphology and pore size of AC. Fig. 1 illustrates 1000× magnified SEM photo of unmodified AC. The surface is smooth and distributed with small pores. Some salt particles are scattered on the surface of AC due to the remaining phosphate or other metal compounds on the AC. Figs. 2 and 3 represent surface structure of MAC according to the activation temperature of 500 °C and 700 °C respectively in different magnifications. Generally, SEM observations of MAC in terms of porosity structure and size are easier and traceable. The surface of MAC is full of cavities and in a honeycomb-like structure. However, for MAC with the highest impregnation ratio form chars and no obvious pore was found on the surface as seen in Fig. 2(d). From SEM images, MAC using higher concentration of H3PO4 displayed a weak porosity surface area. Throughout the images, salt particles are scattered on the surface of AC. According to Mohanty et al. (2005), this may probably be due to the presence of remaining H3PO4 or other metal compounds on the AC. Protecting layer may be formed by excess dehydrated acid that probably prevents the effect of the surrounding atmosphere and further inhibits free formation of internal porosity (Girgis and Ishak, 1999). These particles may block 2,4-DCP to enter the pores. Mohanty et al. (2005) further suggested that the adsorption capacity of target pollutant can be increased by improving the washing procedure.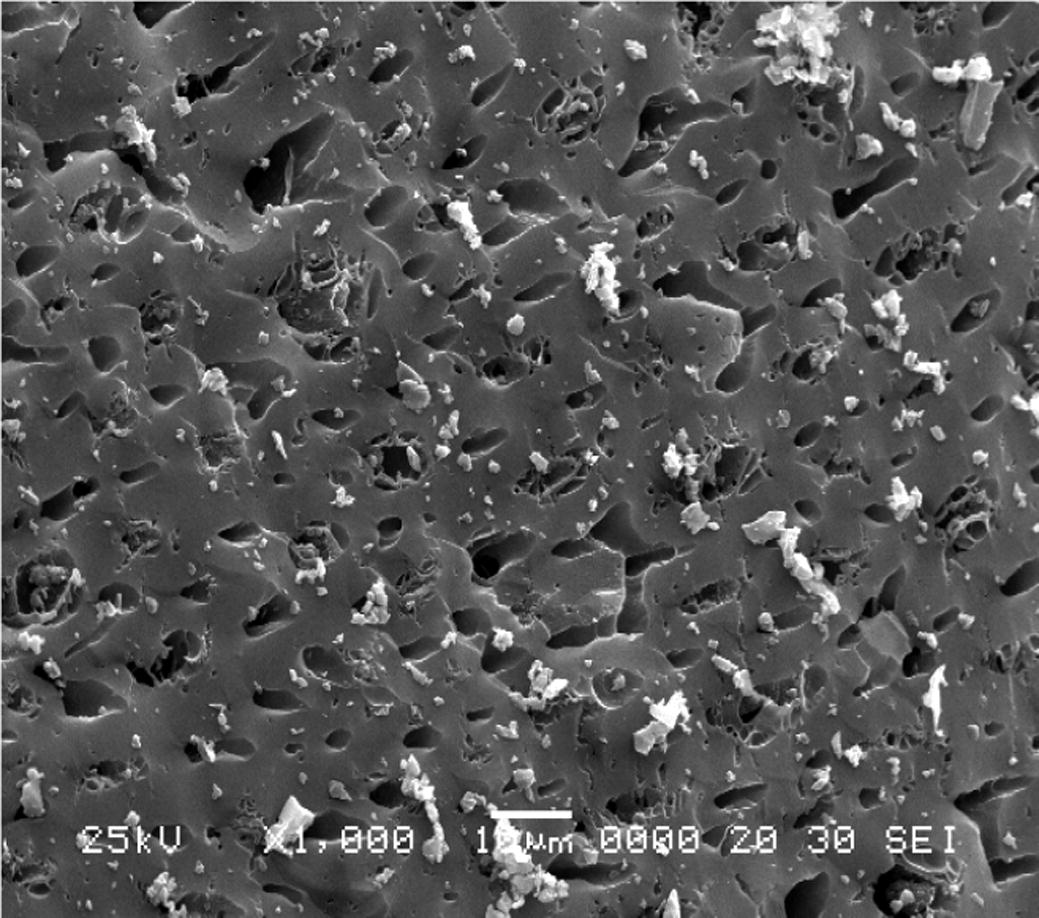
SEM image of unmodified AC at magnification of 1000×.
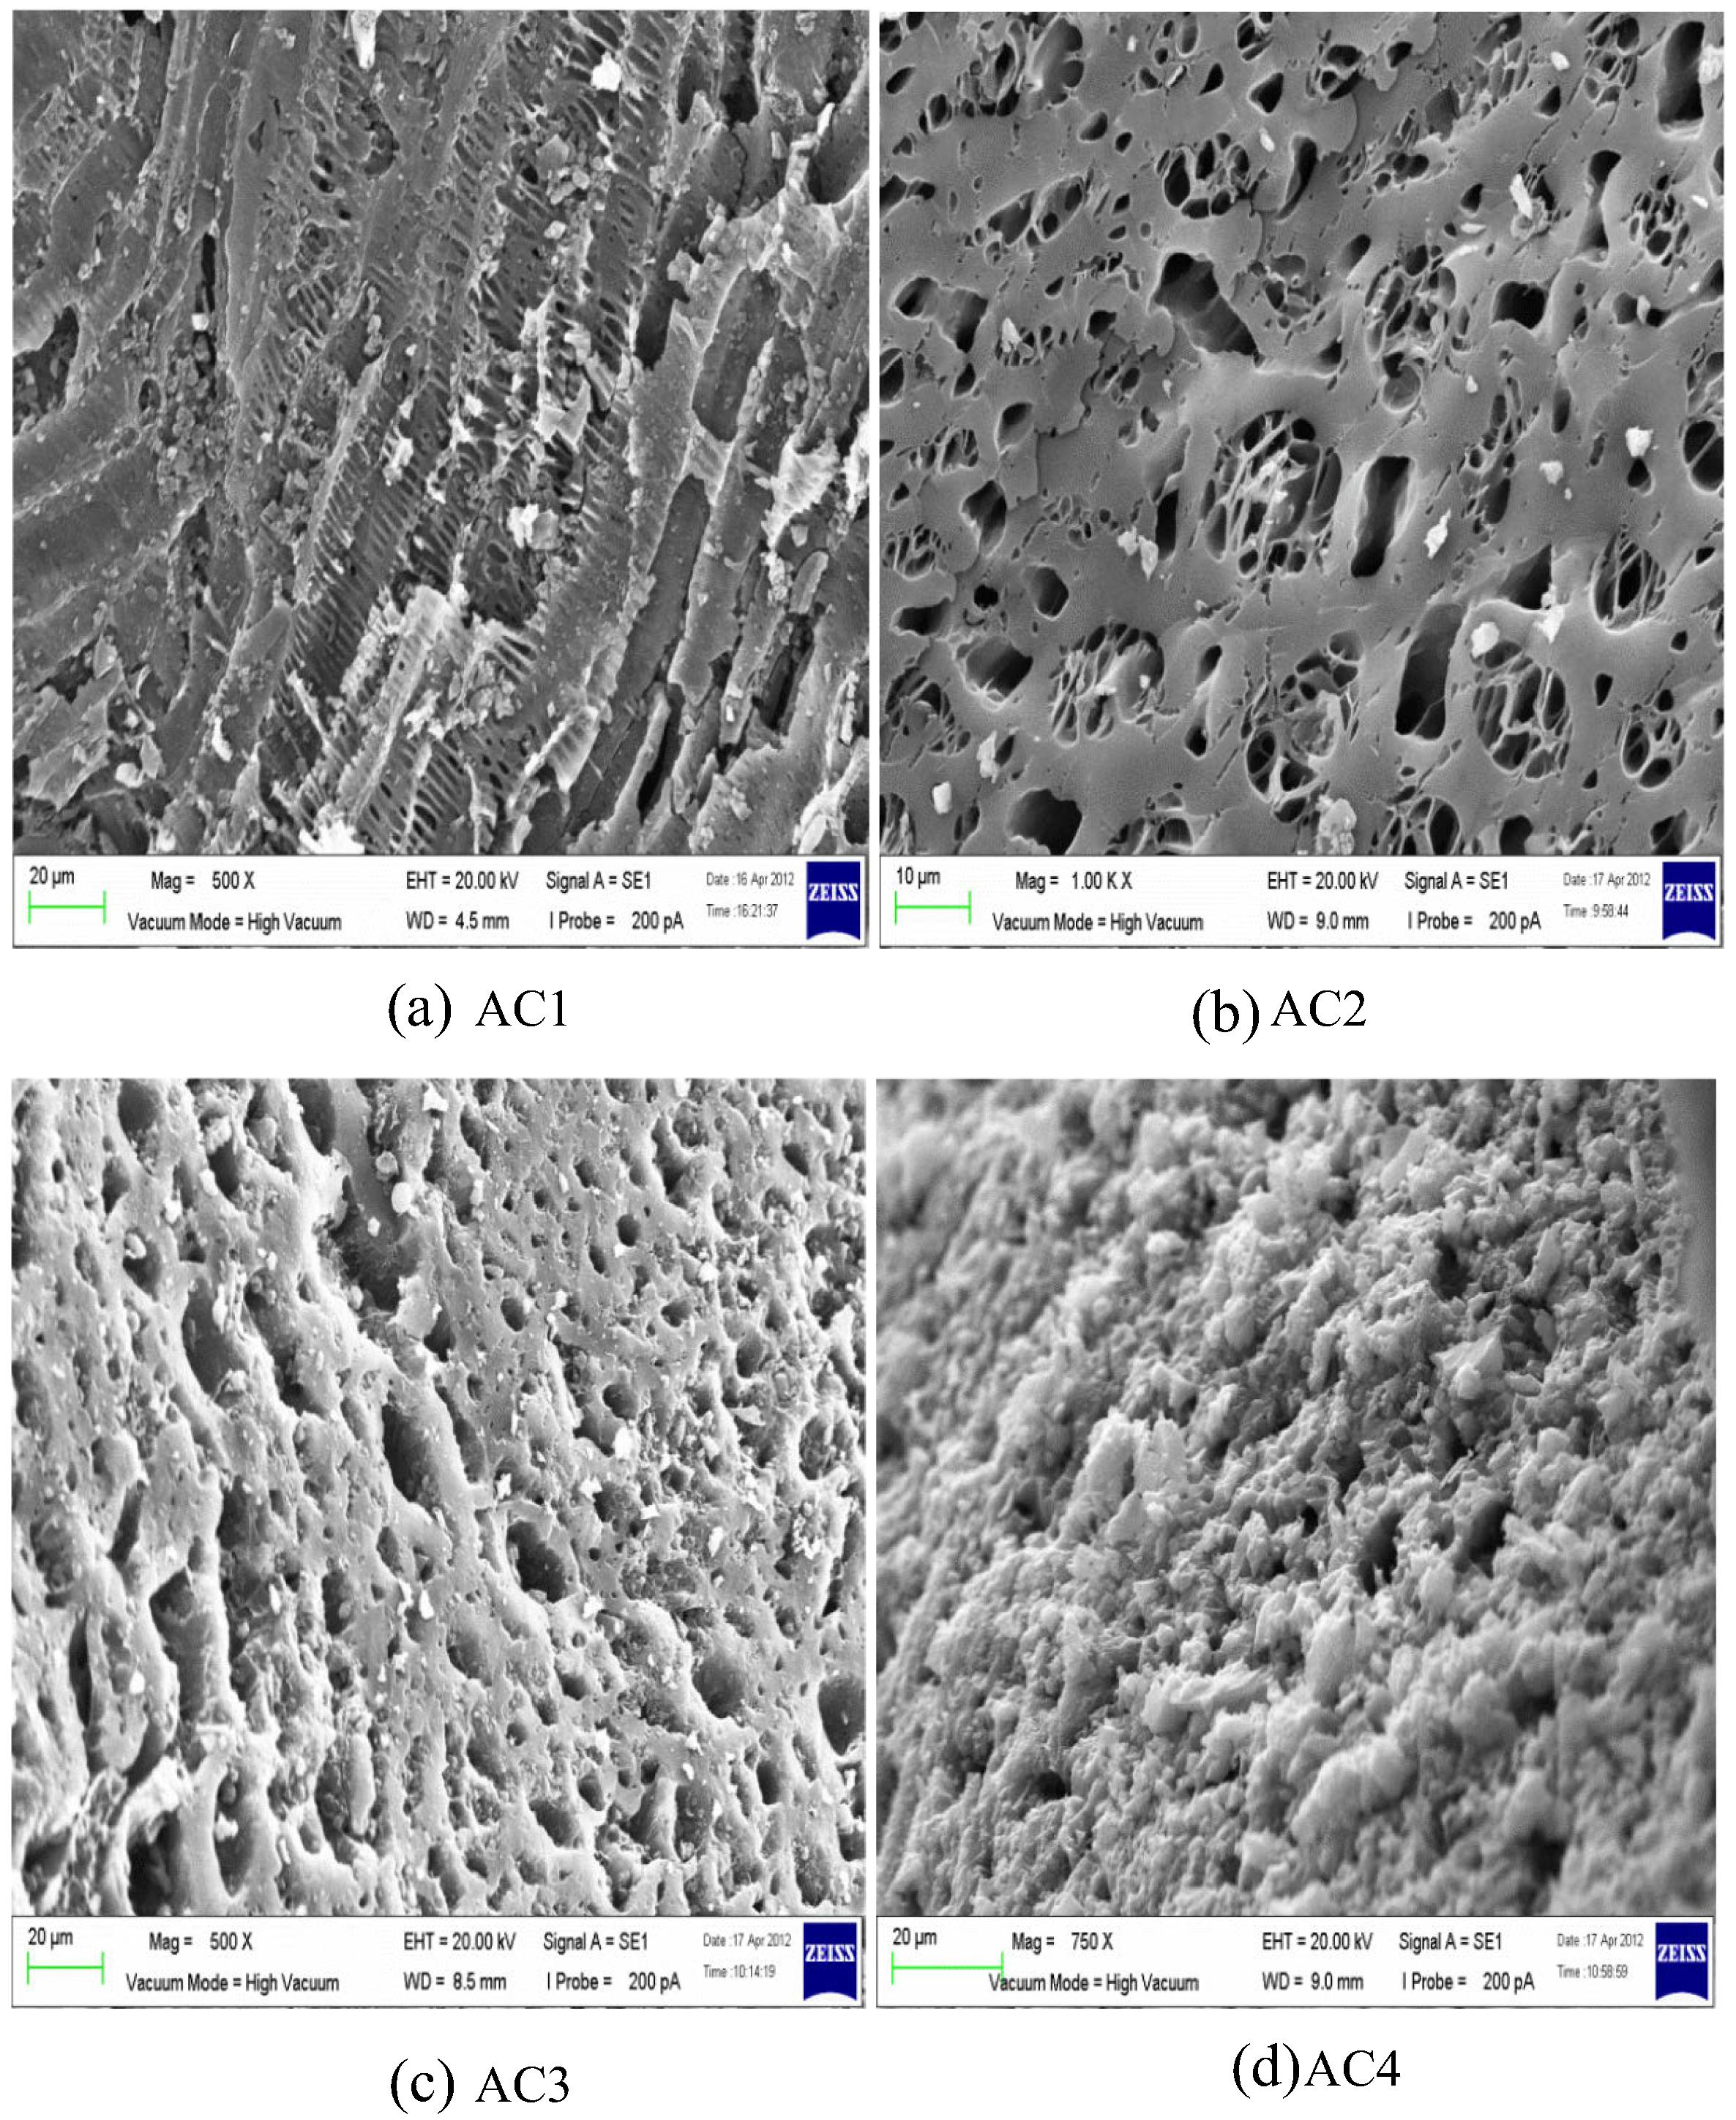
SEM image of MAC activated at 500 °C for different Xp values: (a) 0.6, 500× magnification; (b) 1.2, 1000× magnification; (c) 1.8, 500× magnification; and (d) 2.4, 750× magnification.
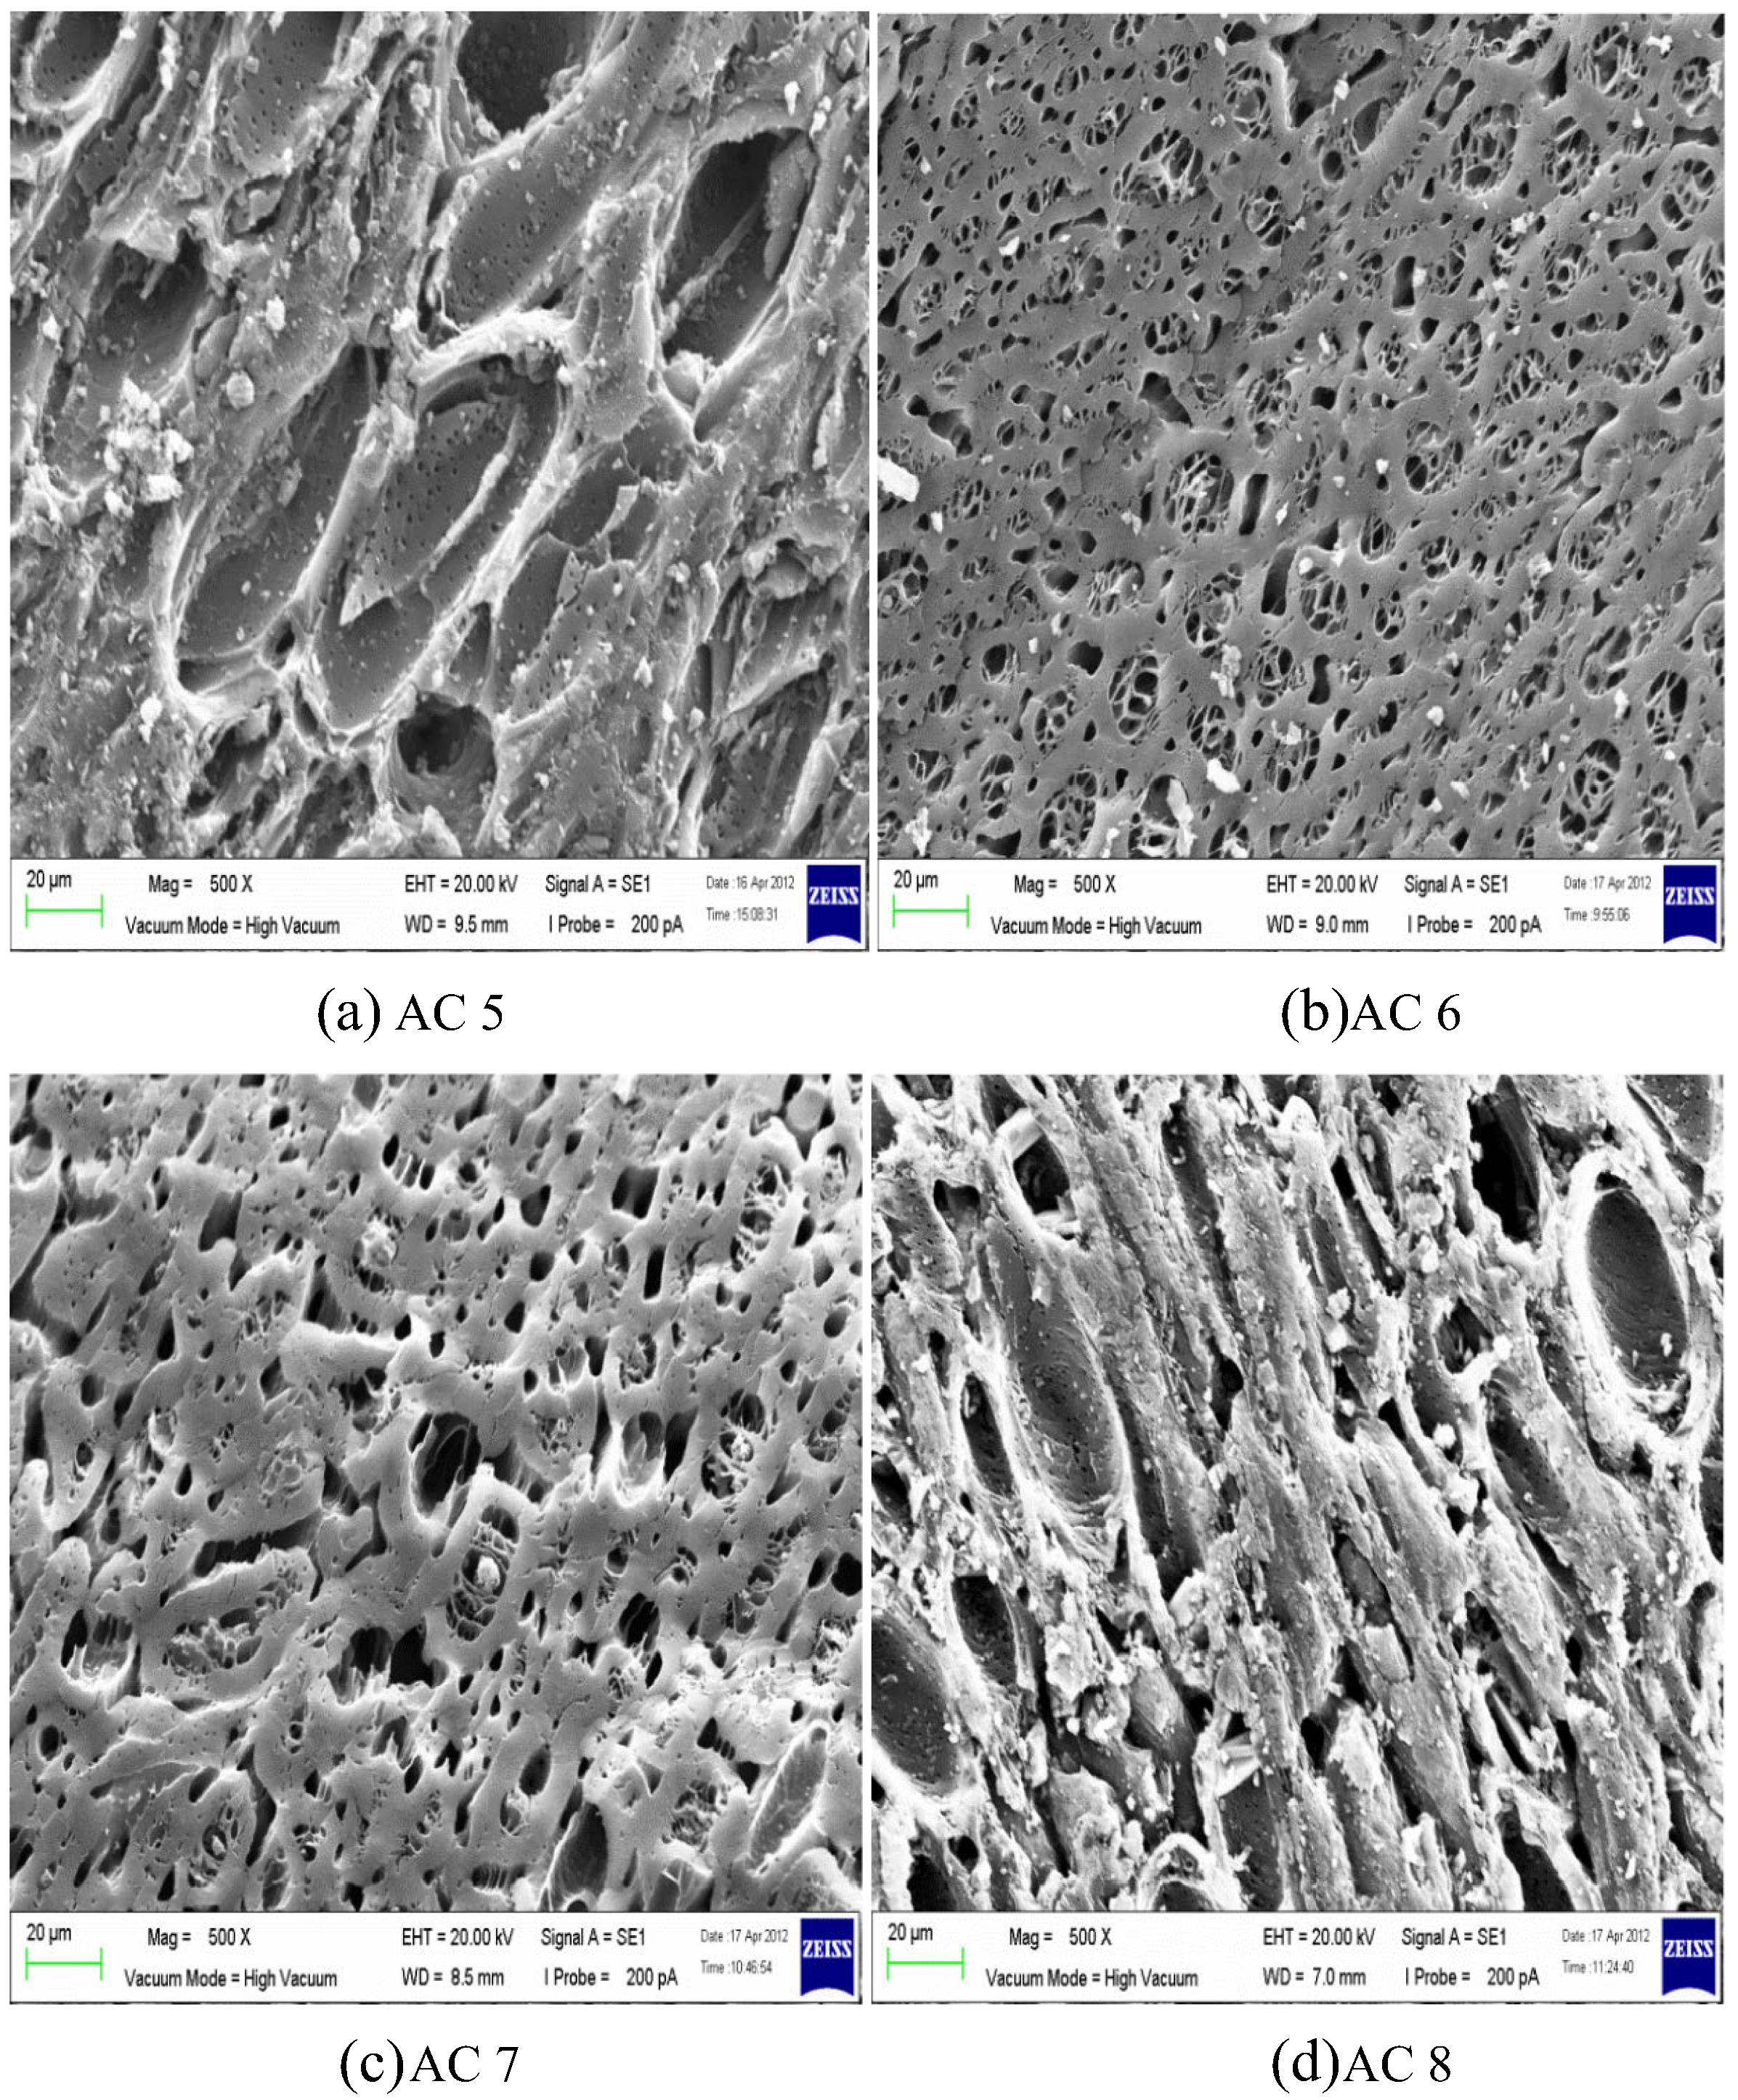
SEM image of AC activated at 700 °C for different Xp values: (a) 0.6, 500× magnification; (b) 1.2, 1000× magnification; (c) 1.8, 500× magnification; and (d) 2.4, 750× magnification.
3.6 Fourier Transform Infrared Spectroscopy (FTIR) analysis
The FTIR technique was used to characterize the structure and functional groups of MAC. Figs. 4 and 5 show the FTIR spectra of the unmodified AC and MAC at different activation temperatures, which are 500 °C and 700 °C respectively. All the spectra shared almost the similar peak area. Some peaks were detected on the spectra at bandwidths of 3800–3300 cm−1 which represent O—H stretching vibration of hydroxyl functional groups in low concentrations. Acidic treatment reduces the hydroxide groups and produces acidic functional groups on the surface of MAC (Wang et al., 2007). 3000–2800 cm−1 refers to the C—H stretching in the alkane group. A small peak at 1772 cm−1 corresponds to the C⚌O stretching vibration in carbonyls such as ketones, aldehydes, lactones and carboxylic groups (Budinova et al., 2006). 1520 cm−1 may refer to the C⚌C stretching vibration in aromatic rings (Foo and Hameed, 2009). This is due to the tars produced during depolymerization of cellulose followed by dehydration and condensation contributed to the formation of more aromatic and reactive products with some cross linking (Molina-Sabio and Rodriguez-Reinoso, 2004). A strong peak detected at 1300–1200 cm−1 is attributed to C—O—C group of stretching mode in acids, alcohols, phenols, ethers and esters (Foo and Hameed, 2009). At 980–950 cm−1, the peak is associated with P—O—C carbon asymmetric stretching. This is proven in the study of that acid phosphates formed in the samples modified using H3PO4. Budinova et al. (2006) indicated that the broad band in this range is due to the presence of phosphorous compounds in the samples. H3PO4 promotes cleavage of bond and formation of crosslinks. H3PO4 is also able to combine with organic species to form phosphate linkage, such as phosphate and polyphosphate ester based from the previous studies. Peaks in the range of 800–700 cm−1 might be due to the presence of C—H out of plane bending in benzene derivatives (Foo and Hameed, 2009). The difference between unmodified AC and MAC was a strong peak located at 2357 cm−1. This peak indicated the presence of C≡C stretching vibrations in alkyne groups (Shaarani and Hameed, 2011). Although the functional groups are similar, MAC is well developed in porosity that increases the percentage removal of 2,4-DCP compared to unmodified AC.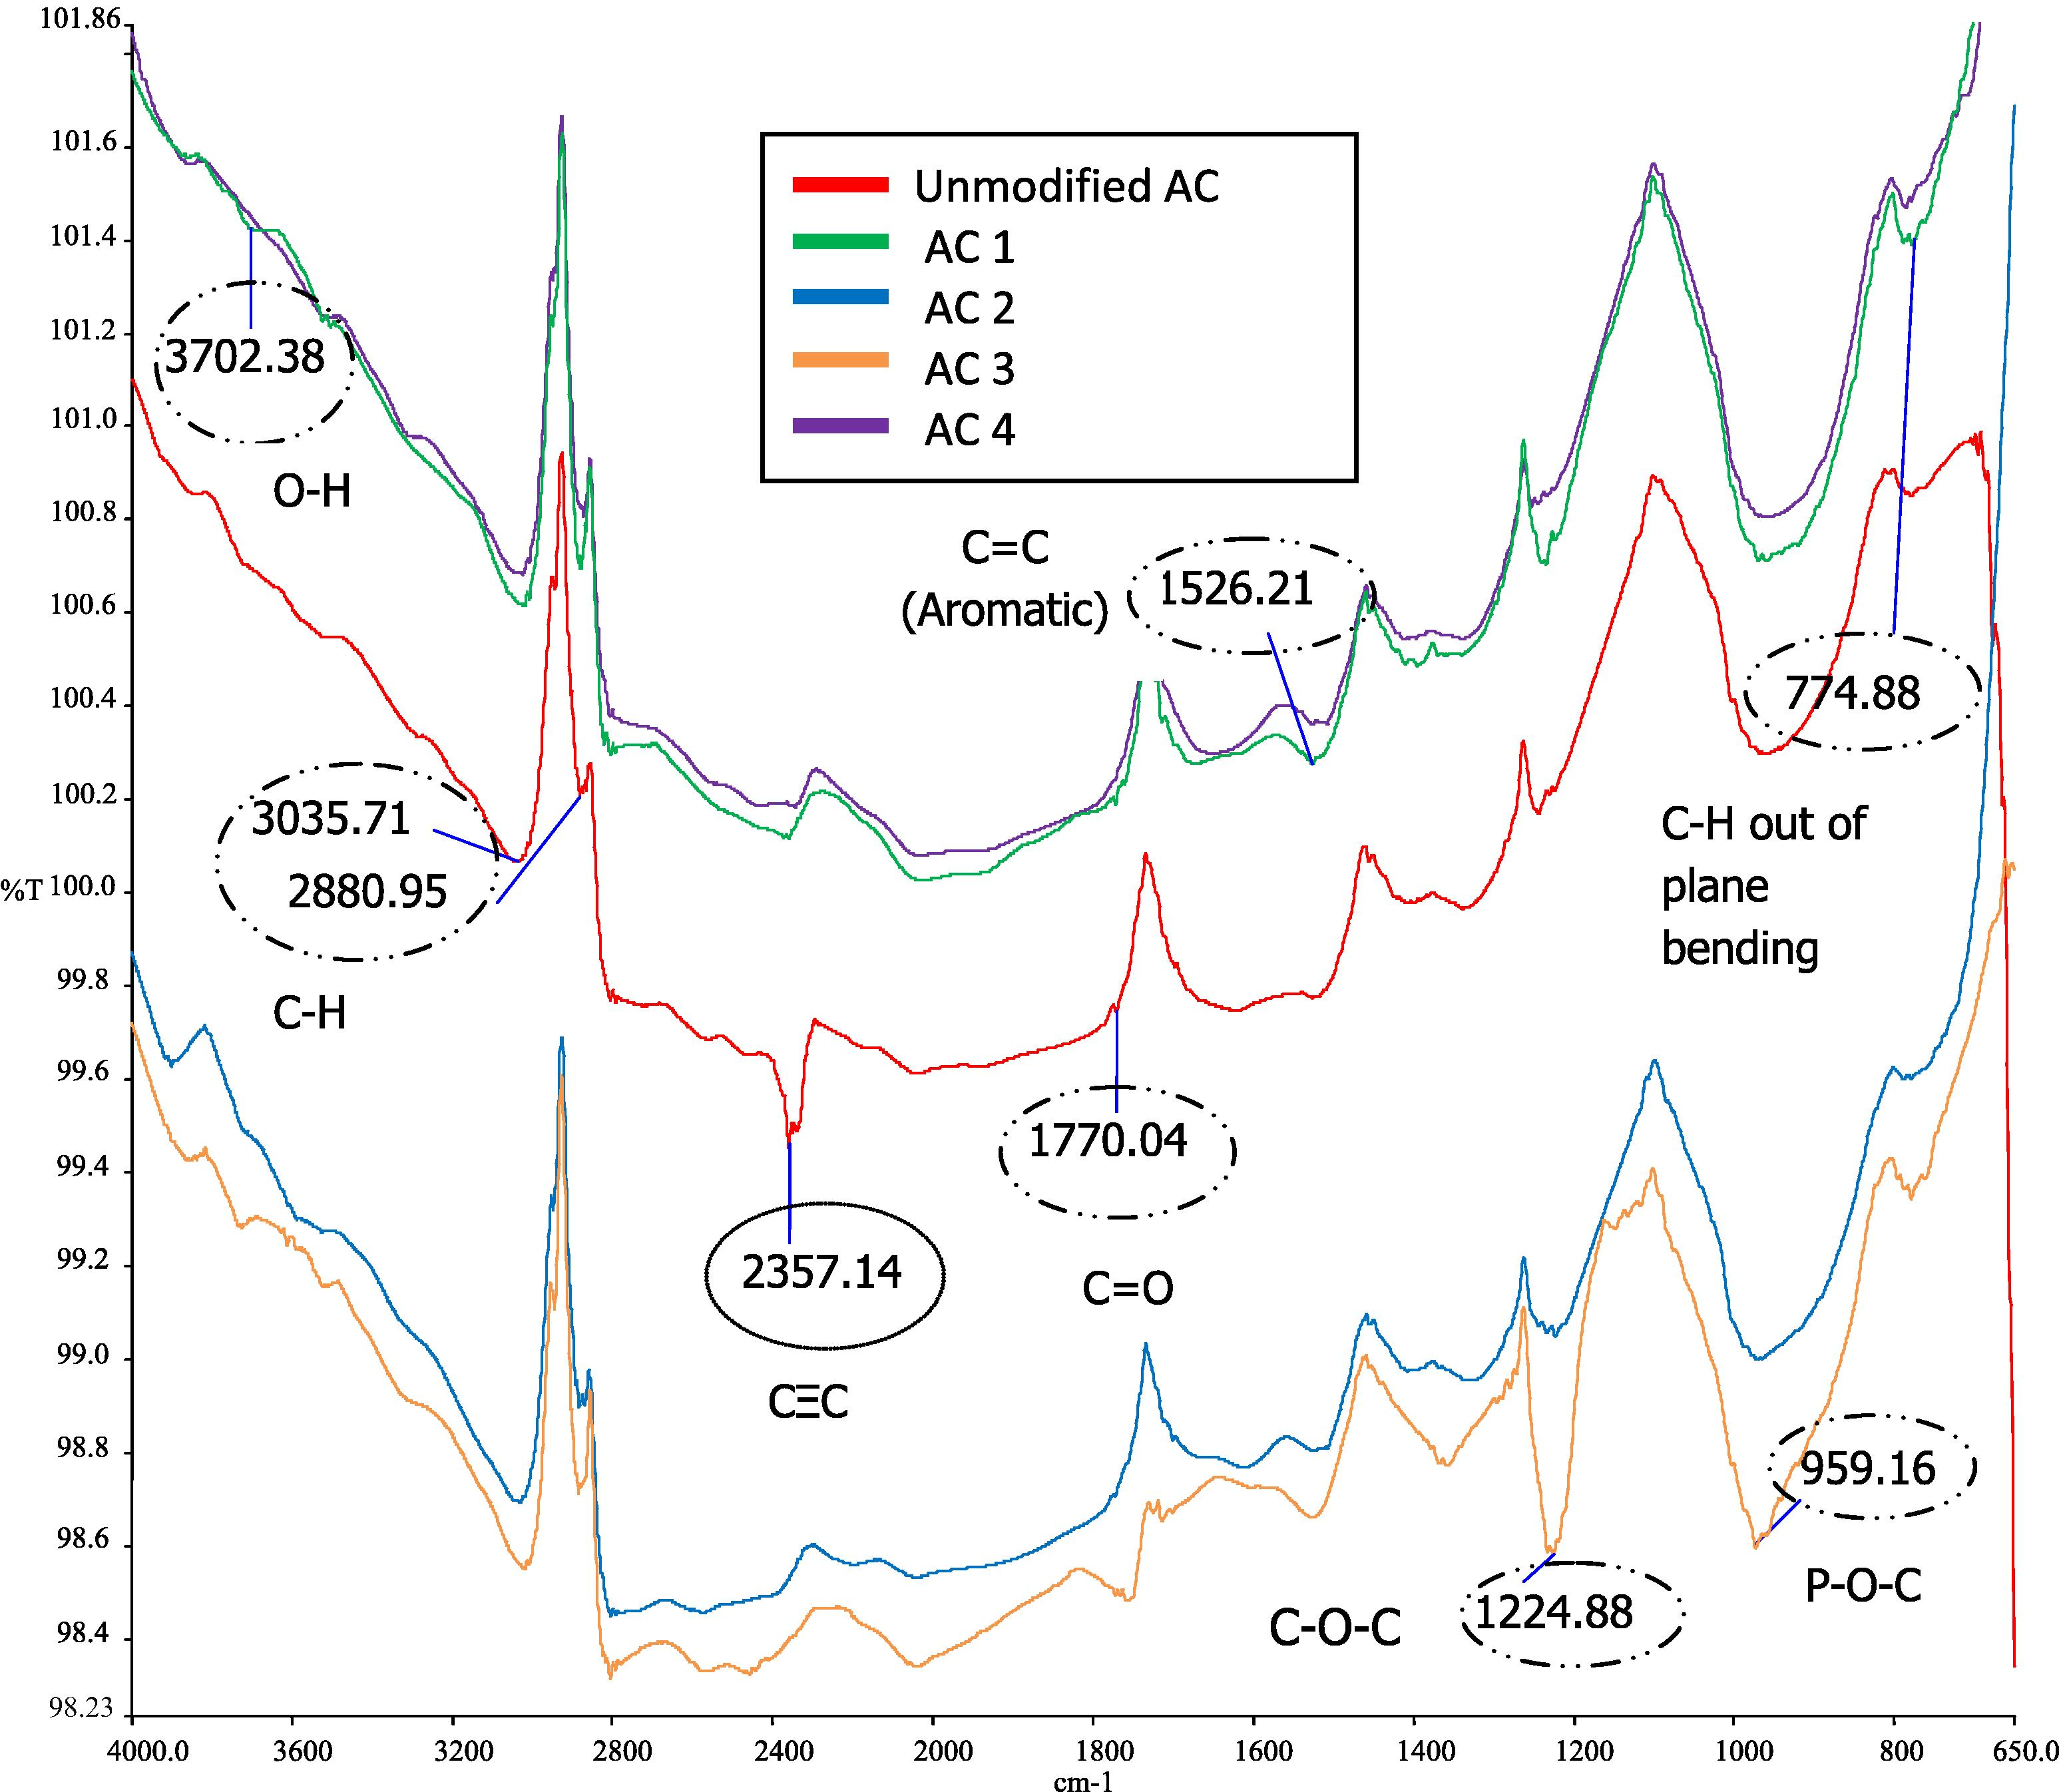
FTIR spectra of MAC at 500 °C.
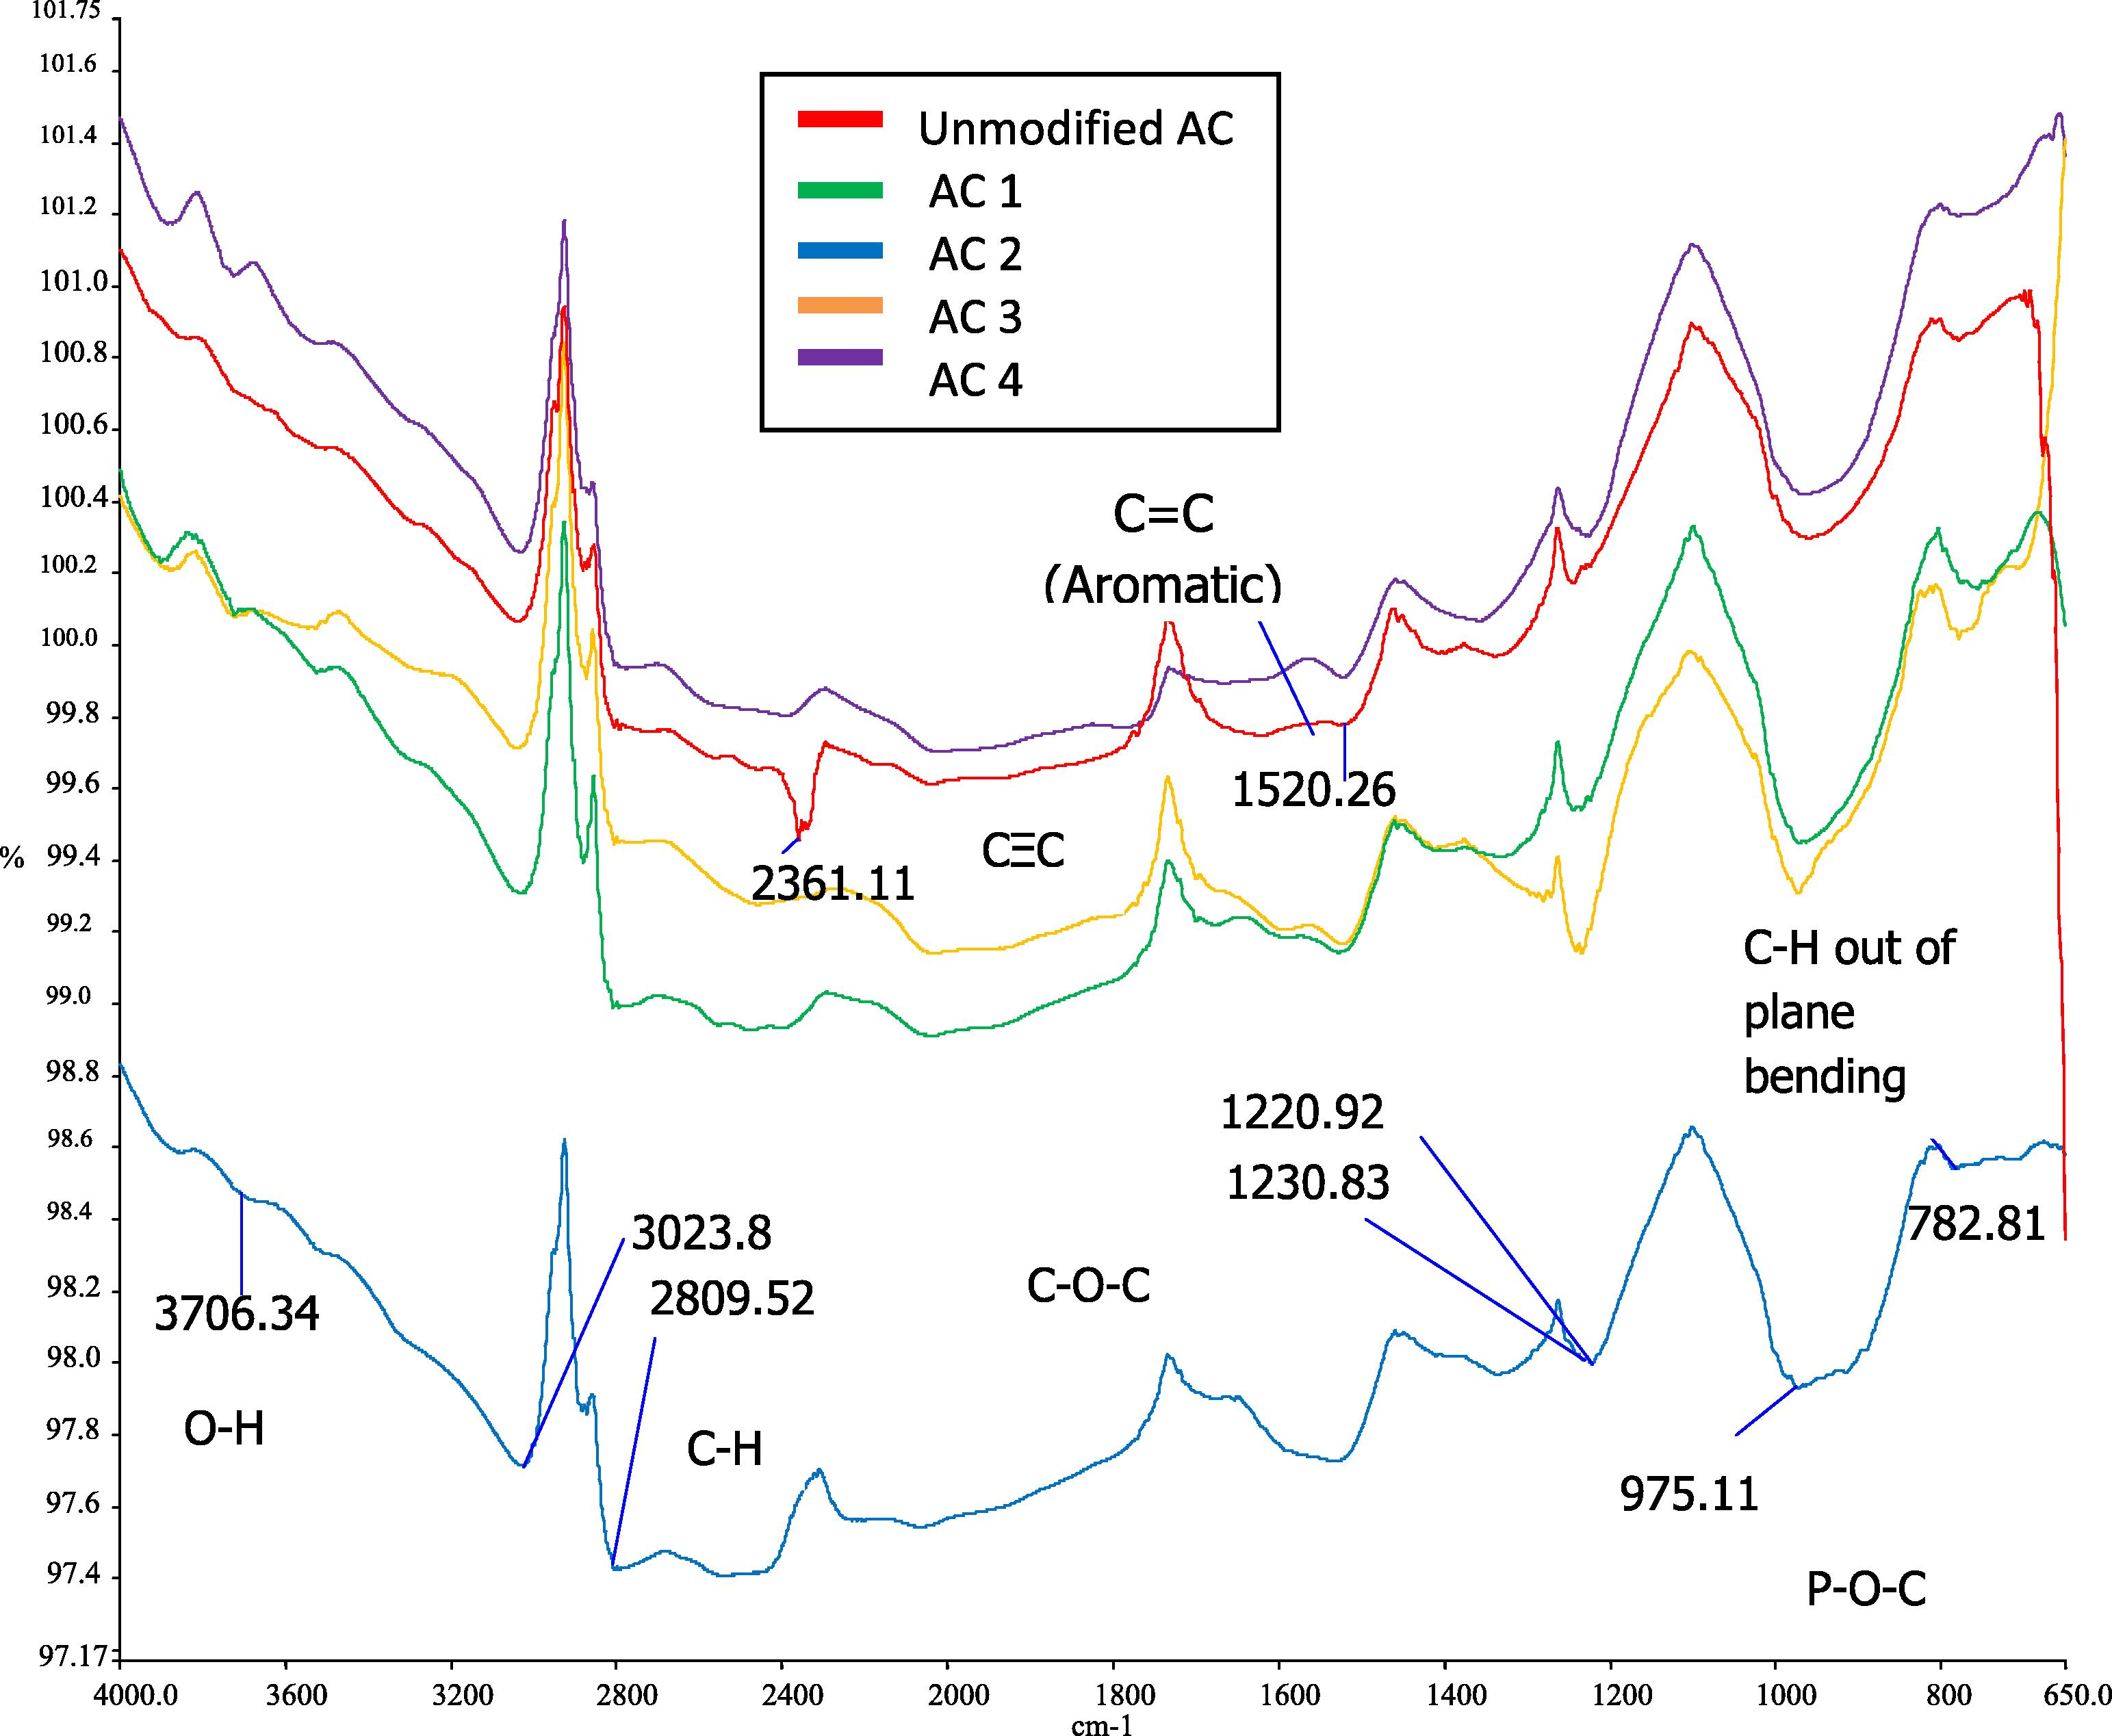
FTIR spectra of MAC at 700 °C.
3.7 Specific surface area and pore-distribution
Table 2 contains the porous and surface characteristics of MAC. Fig. 6 shows the isotherms from N2-sorption measurements of the MAC which contains specific information on the porosity of the particles at the temperature of liquid nitrogen. Type I isotherm with no hysteresis loop can be observed. This isotherm is the Langmuir isotherm type which indicates monolayer coverage with chemisorption adsorption properties. This is a typical adsorption in microporous solids.
Surface area
Langmuir surface area (m2/g)
1200
BJH method cumulative adsorption surface area (m2/g)
190
BJH method cumulative desorption surface area (m2/g)
240
Pore volume
BJH method cumulative adsorption pore volume (cm3/g)
0.078
BJH method cumulative desorption pore volume (cm3/g)
0.093
DH method cumulative adsorption pore volume (cm3/g)
0.08
DH method cumulative desorption pore volume (cm3/g)
0.095
Pore size
Average pore diameter (Å)
20.8
BJH method adsorption pore diameter (mode) (Å)
13.6
BJH method desorption pore diameter (mode) (Å)
13.2
DH method adsorption pore diameter (mode) (Å)
13.6
DH method desorption pore diameter (mode) (Å)
13.2
DR method micro pore width (Å)
15.5
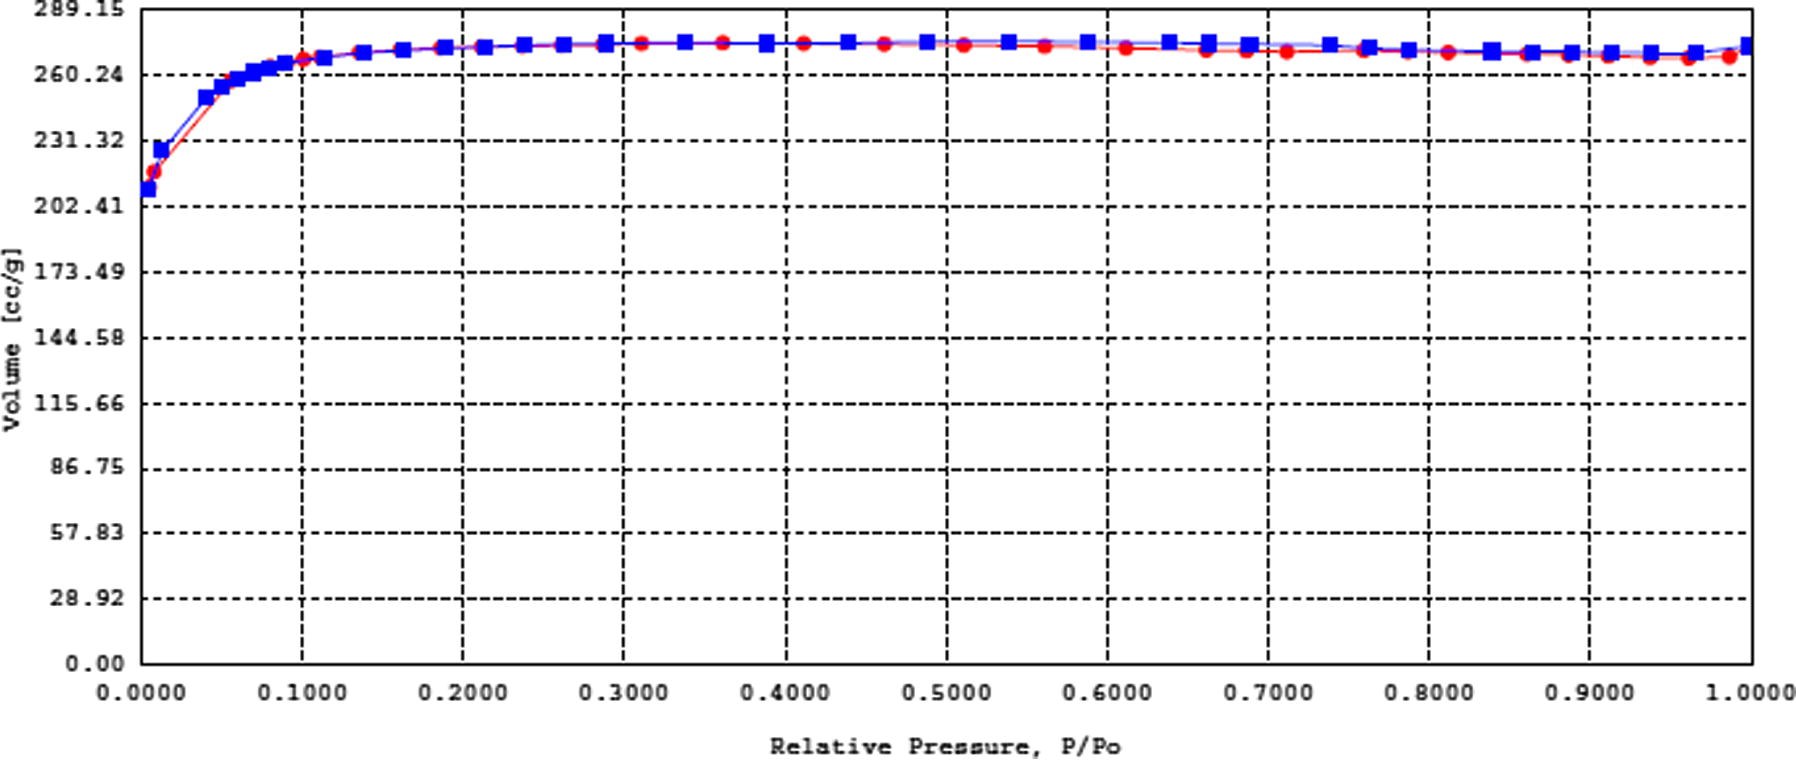
Low temperature nitrogen adsorption isotherm for MAC (AC2).
3.8 Adsorption of 2,4-DCP onto unmodified AC and MAC
The adsorption of 2,4-DCP by unmodified AC was investigated. Fig. 7(a) shows that concentration of 2,4-DCP decreases with time. Rapid adsorption process took place at first 10 min, and then slowly achieved the final concentration which is almost constant. Adsorption of 2,4-DCP onto different MAC samples has been conducted. Table 3 represents the percentage removal of different samples. Conditions were, AC dosage: 0.3 g, volume of 2,4-DCP: 0.5 L, contact time: 1 h, shaking speed: 160 rpm. AC2 with impregnation ratio of 1.2 and 500 °C treatment was the best MAC which presented the highest adsorption efficiency, 93.63% toward 2,4-DCP. 500 °C was found to be the optimum activation temperature to modify AC and generate a better adsorbent. Fig. 7(b) demonstrates the graph of 2,4-DCP concentration against contact time during adsorption. The relation can be used to determine the rate of 2,4-DCP removal. Generally, adsorption increases with increasing contact time which shared the same trend with unmodified AC. It can be summarized that the rate of MAC adsorbed 2,4-DCP is rapid at initial stage, especially at the first 5 min with more than 60% removal of 2,4-DCP concentration. Adsorption then decreases gradually and finally becomes almost constant at 50 min. At initial contact time, adsorption process is accelerated due to the availability of the pores at the surface of AC while slow pore diffusion of 2,4-DCP into the bulky AC contributed to the slow rate at the end of the adsorption (Chen et al., 2010). In order to compare the unmodified and modified AC, percentage removal of 2,4-DCP at first 5 min is shown in Fig. 8. From the figure, it is very obvious that the adsorption of MAC is much higher compared to the unmodified AC. In 50 ppm of 2,4-DCP, the percentage removal of unmodified AC is 23.11% while for MAC is 78.75%.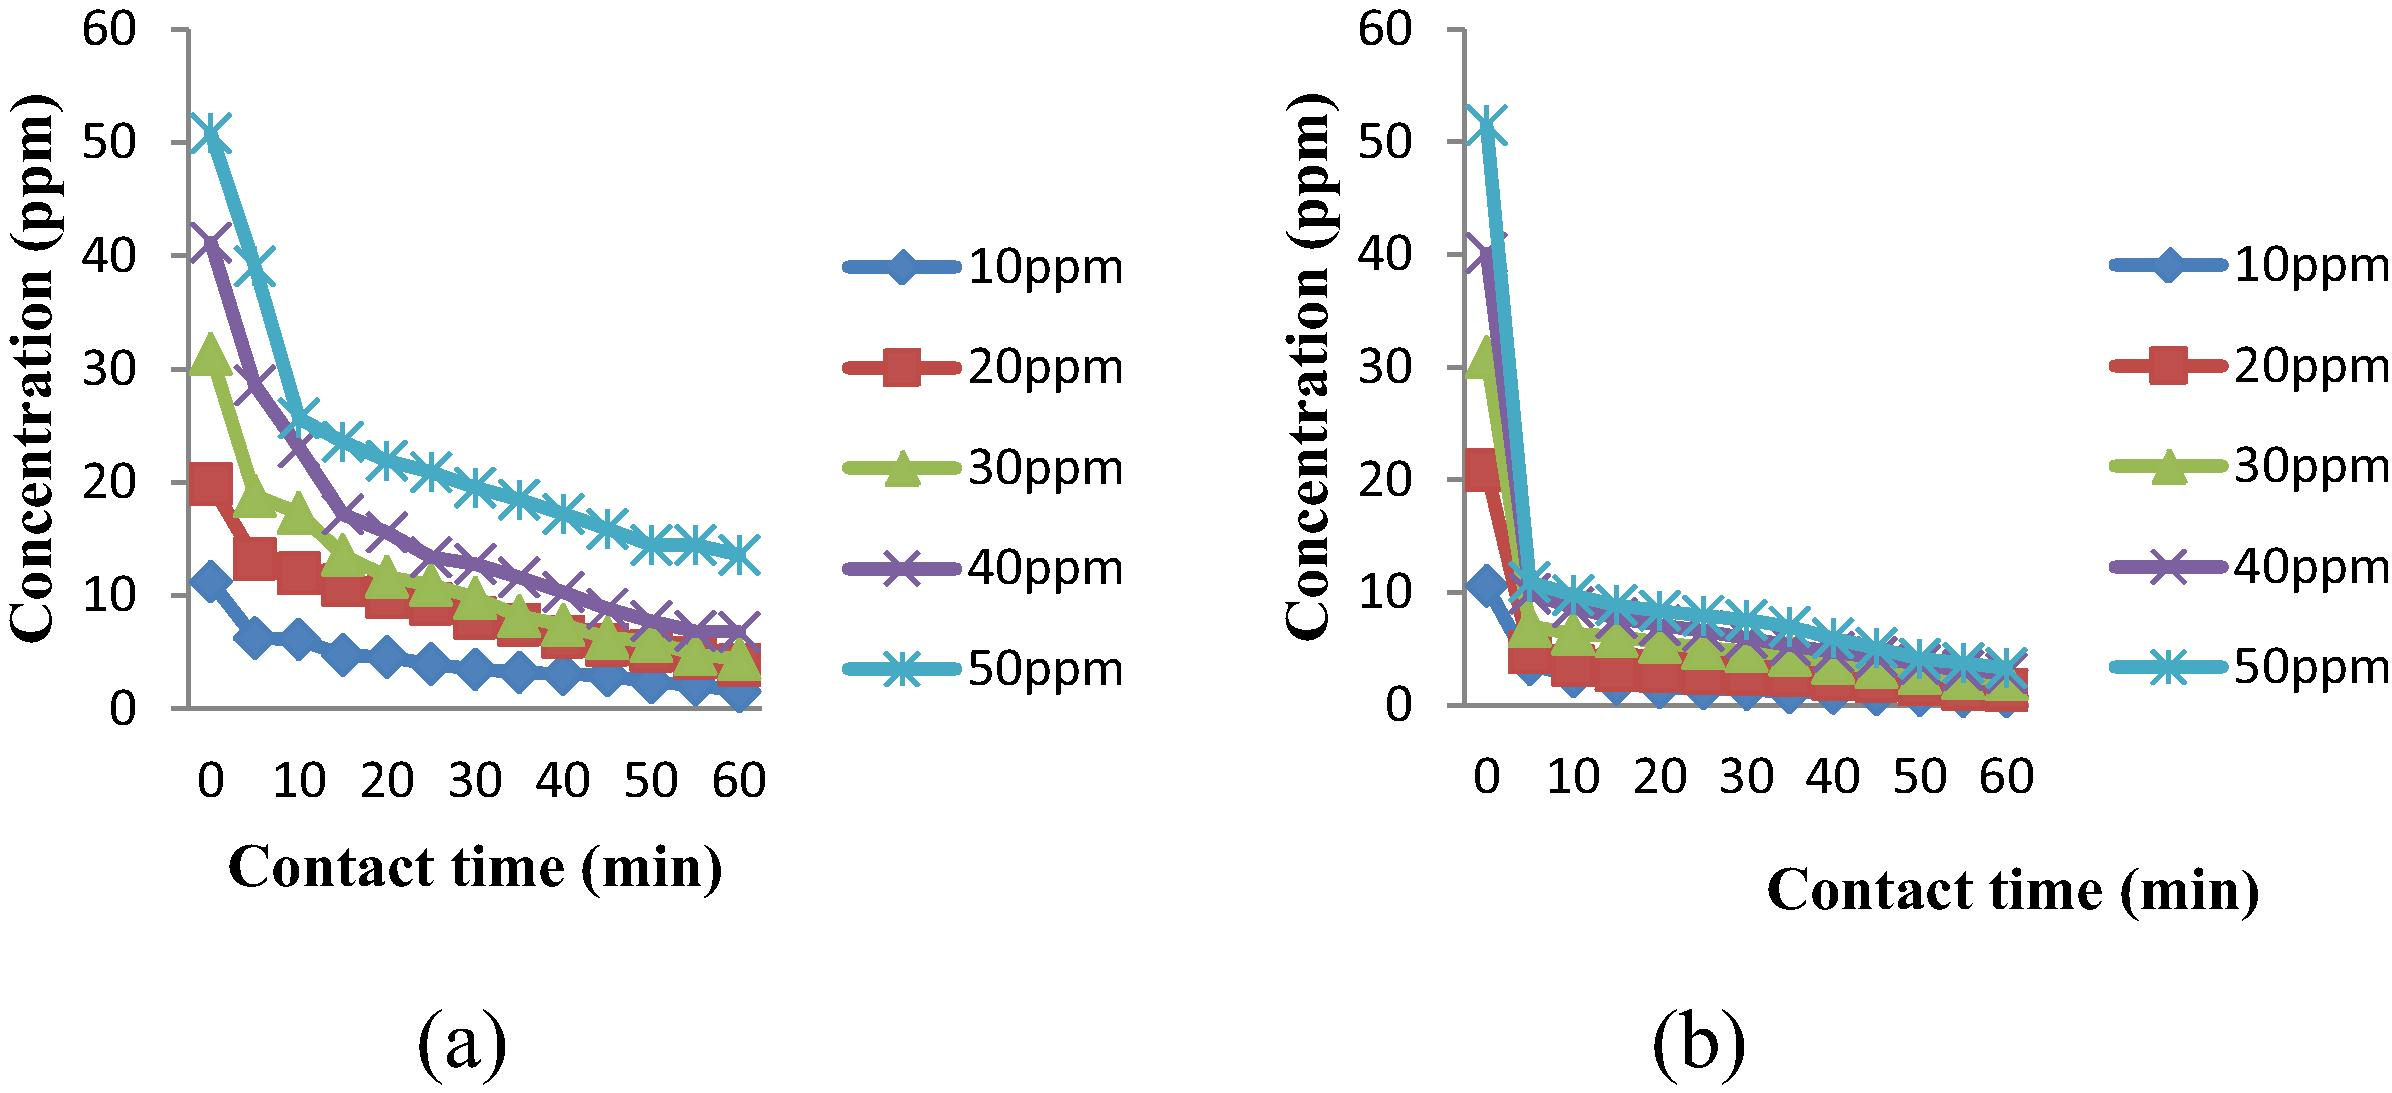
Concentration of 2,4-DCP against time plot for (a) unmodified AC (b) MAC (AC2).
Sample
Concentration of 2,4-DCP before adsorption (mg/L)
Concentration of 2,4-DCP after adsorption (mg/L)
Concentration of 2,4-DCP adsorbed (mg/g)
Percentage removal (%)
AC1
51.28
4.54
46.74
91.15
AC2
51.46
3.28
48.18
93.63
AC3
50.82
7.04
43.77
86.14
AC4
50.66
8.11
42.55
84.00
AC5
50.52
7.38
45.14
89.35
AC6
50.19
5.84
45.35
90.35
AC7
50.21
5.95
44.27
88.16
AC8
51.03
9.77
41.26
80.85
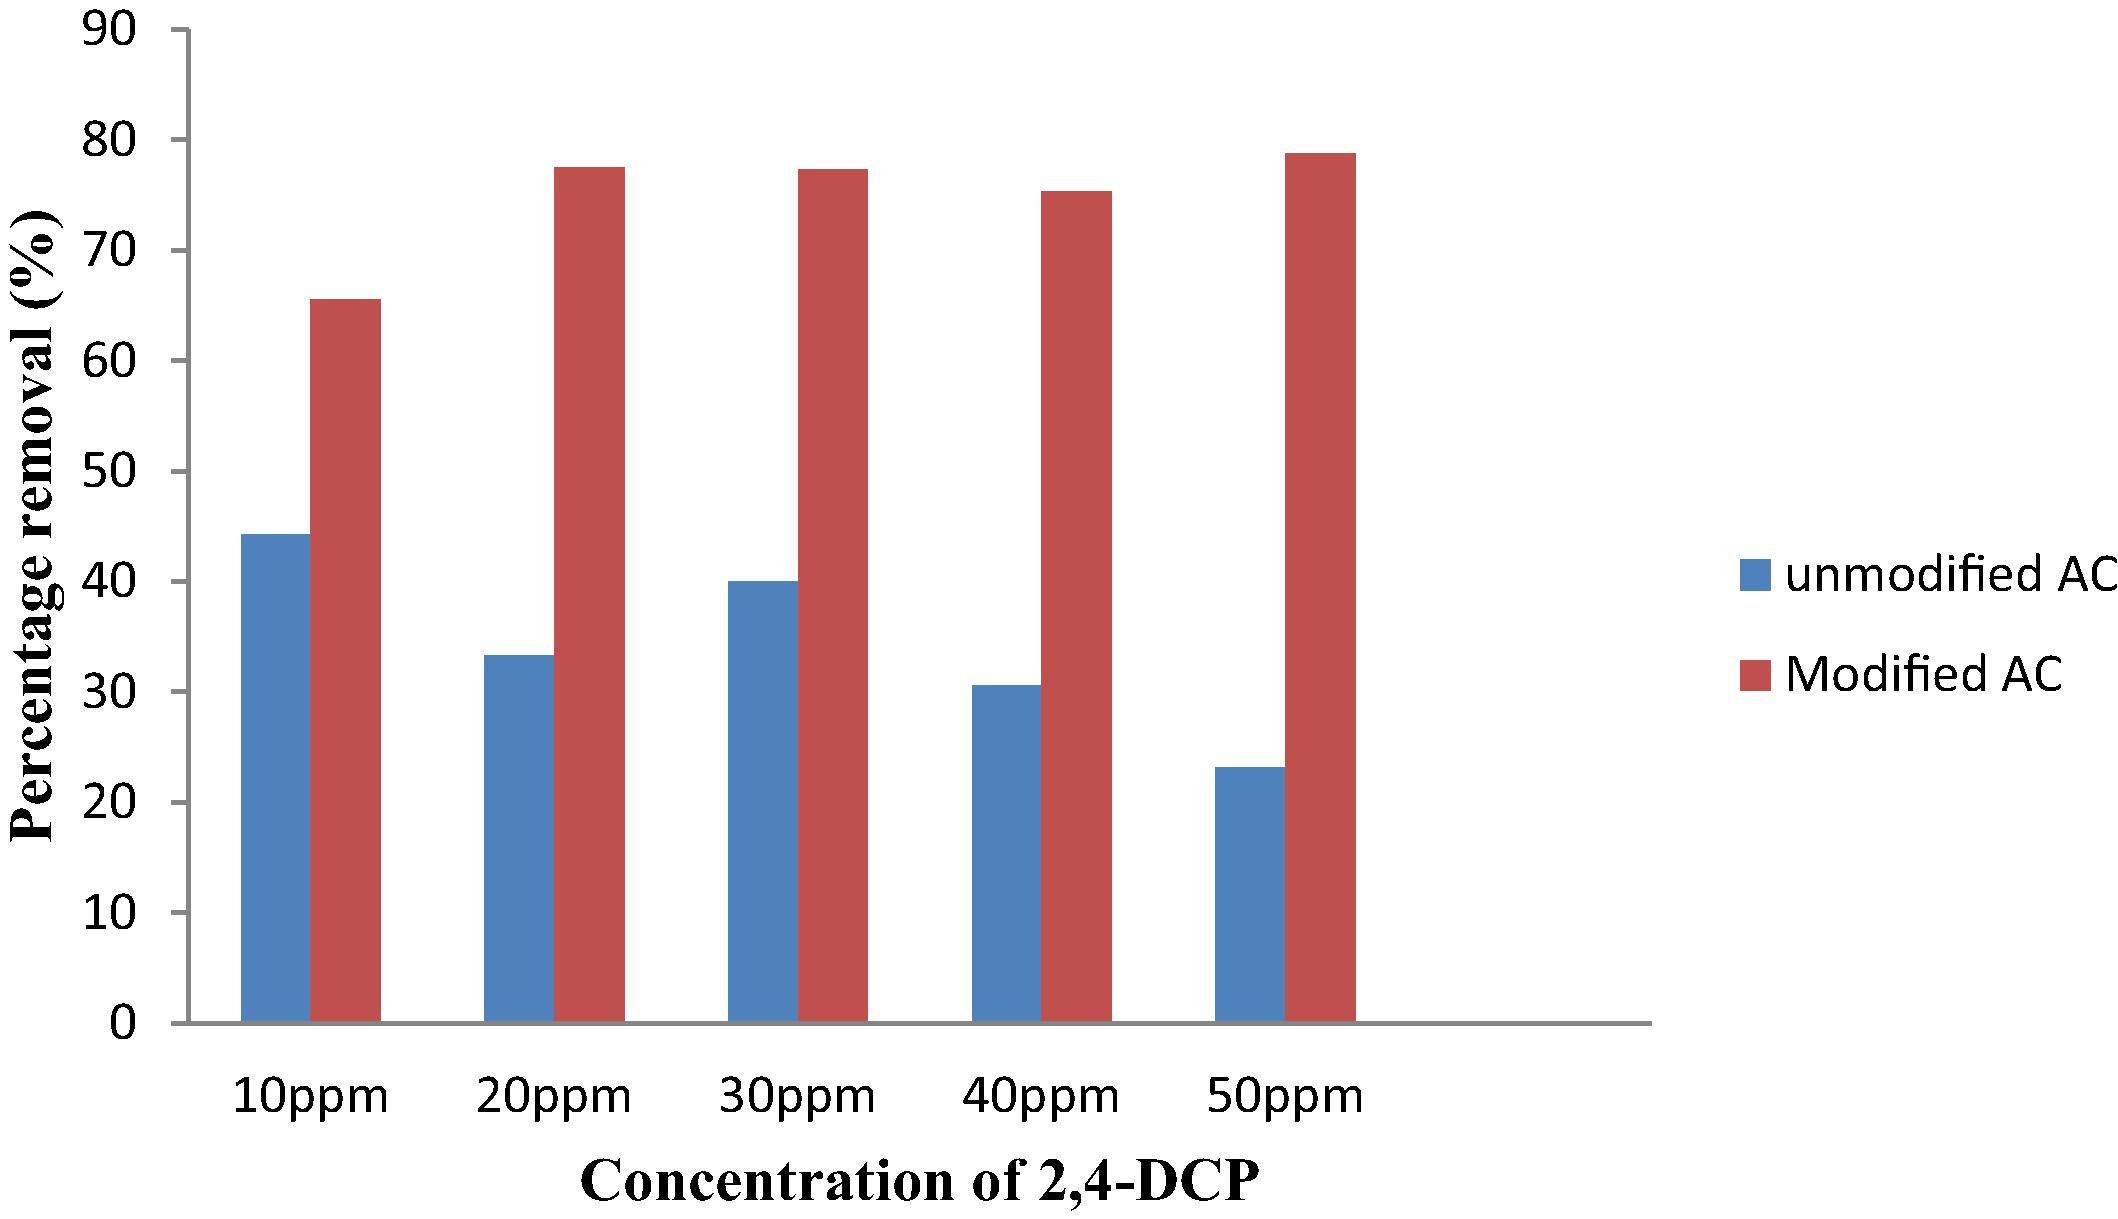
Comparison between unmodified AC and MAC (AC2) at first 5 min toward percentage removal of 2,4-DCP.
3.9 Effect of impregnation ratio on adsorption of 2,4-DCP
Impregnation with H3PO4 produces elastic particle (Molina-Sabio and Rodriguez-Reinoso, 2004). They further stated that cellulose fibers are separated by acid and produce partial depolymerization of hemicelluloses and lignin which will decrease the mechanical resistance. Hence, swelling of particle will occur. Impregnation initiates the conversion to carbon as a relatively large amount of tars can be observed at the surface of particle. The tars contributed to products with cross-linking after dehydration and condensation. During impregnation, soaking of H3PO4 brings chemical changes and structural alteration that affected adsorption process. Impregnation ratios (Xp = 0.6–2.4) are applied in this study. According to Girgis and El-Hendawy (2002), an increase in ratio will give extensive porosity. Based on the results in Table 3, the impregnation ratios are more effective at 500 °C with an optimum value of Xp = 1.2 which achieved the highest percentage removal, 93.63%. For Xp value more than 1.2, the percentage removal is decreasing. This finding is almost similar with the study done by Girgis and El-Hendawy (2002). Introduction of addition acid beyond the optimum degree of impregnation might form an insulating layer covering the particles that will reduce the activation process and the contact with the surrounding atmosphere (Girgis and El-Hendawy, 2002).
3.10 Effect of activation temperature on adsorption of 2,4-DCP
During heat treatment, chemical in the interior of the particles performed dehydrating effect. Molina-Sabio and Rodriguez-Reinoso (2004) suggested the cross-linking reactions are most important in heat treatment followed by the reduction in the release of volatile matter and tars to obtain high yields. Two activation temperatures are applied in this study, 500 °C and 700 °C for four different impregnation ratios. MAC at 500 °C showed a better adsorption toward 2,4-DCP. This trend is similar with the findings of Teng et al. (1998) and Girgis and El-Hendawy (2002). Increasing temperature expected to increase the porosity by the release of tars from the cross-linked framework formed by acid treatment. When the activation temperature is increased to 700 °C, the adsorption of 2,4-DCP is somehow decreased. Studies done by Ahmadpour and Do (1996) on preparation of AC from coal using chemical activation suggested that temperature above 500 °C attributed to the loss of weight, shrinkage in carbon structure and porosity reduction. A similar trend was obtained again when they used macadamia nutshell as the precursor to prepare AC (Ahmadpour and Do, 1997). Teng et al. (1998) stated that extensive contraction during thermal treatment collapses the porous structure.
3.11 Effect of MAC dosage on adsorption of 2,4-DCP
As AC2 has the highest removal efficiency and percentage yields, further adsorption studies of adsorption kinetic of 2,4-DCP were continued using AC2 only. Adsorbent dose is a parameter used to identify the capacity of adsorbent for a given initial concentration of 2,4-DCP (Chen et al., 2010). Table 4 represents the effect of MAC (AC2) dosage on 2,4-DCP adsorption. The trend is increasing when percentage removal increased rapidly and almost achieved a constant value after the critical dosage. The percentage removal of 2,4-DCP increased from 43.66% to 98.85% along the increase of AC dose from 0.1 g to 0.9 g. When AC dose is increasing, free sorption surface and adsorption sites also increase and thus more 2,4-DCP molecules will be adsorbed (Chen et al., 2010; Ahmaruzzaman, 2008). When AC increased to 0.3 g, there is no significant difference in percentage removal and therefore 0.3 g is suitable for adsorption of 2,4-DCP in this study.
AC dosage
Initial concentration
Final concentration
Concentration removed
Percentage removed
(g)
(mg/L)
(mg/L)
(mg/L)
(%)
0.1
51.58
29.07
22.52
43.66
0.3
50.26
5.54
44.72
88.98
0.5
50.26
3.78
46.48
92.49
0.7
51.59
2.31
49.28
95.52
0.9
50.71
0.58
50.13
98.85
3.12 Kinetics of adsorption
Adsorption kinetic refers to the rate of adsorption. Kinetic models are important to design and optimize the treatment of effluent (Theivarasu and Mylsamy, 2010). Elovich and intraparticle diffusion kinetic models were calculated to understand the mechanism of adsorption by AC. The intraparticle diffusion model was applied in the study of Bouhamed et al. (2012) to identify the diffusion mechanism. Furthermore, another study has also been done which stated that Elovich equation is generally applied to describe chemisorptions (Chen et al., 2010). Tables 5 and 6 represent R2 value of Elovich equation and kinetic parameters of the intraparticle diffusion model for different concentrations of 2,4-DCP. According to Figs. 9 and 10, adsorption of 2,4-DCP suits the intraparticle diffusion model better than Elovich equation with correlation coefficient R2 values of 0.948 and 0.812 respectively by using 50 ppm 2,4-DCP. Most of the pores present in AC2 are mesopores. As 2,4-DCP is a slightly large molecule in water treatment compared to gas state, mesopores are more dominant. From SEM image, AC2 showed larger pores produced compared to unmodified AC. The large pores created will enable the rapid diffusion of solutes (Valderrama et al., 2008). Hence, intraparticle diffusion of 2,4-DCP in aqueous solution did better in mesopores in this study. Larger intercept value produced greater surface sorption in the rate controlling step (Theivarasu and Mylsamy, 2010). Table 6 shows that the value of C increased with increasing the concentration of 2,4-DCP. When thickness of boundary layer is increased and chance of external mass transfer is decreased, internal mass transfer normally will take place (Khaled et al., 2009). It was observed that the intraparticle diffusion plot does not pass through the origin. This might be due to the difference of mass transfer in the initial and final stage of adsorption. The deviation also suggested that the pore diffusion is the only controlling step and not the film diffusion (Theivarasu and Mylsamy, 2010).
Concentration of 2,4-DCP (ppm)
R2 value of Elovich equation
10
0.838
20
0.862
30
0.764
40
0.812
50
0.812
Concentration of 2,4-DCP (ppm)
Intraparticle diffusion
Kd (mg/g min)
C (mg/g)
R2
10
0.828
12.49
0.829
20
0.846
26.81
0.783
30
1.526
36.32
0.967
40
2.164
46.35
0.967
50
2.350
61.55
0.948
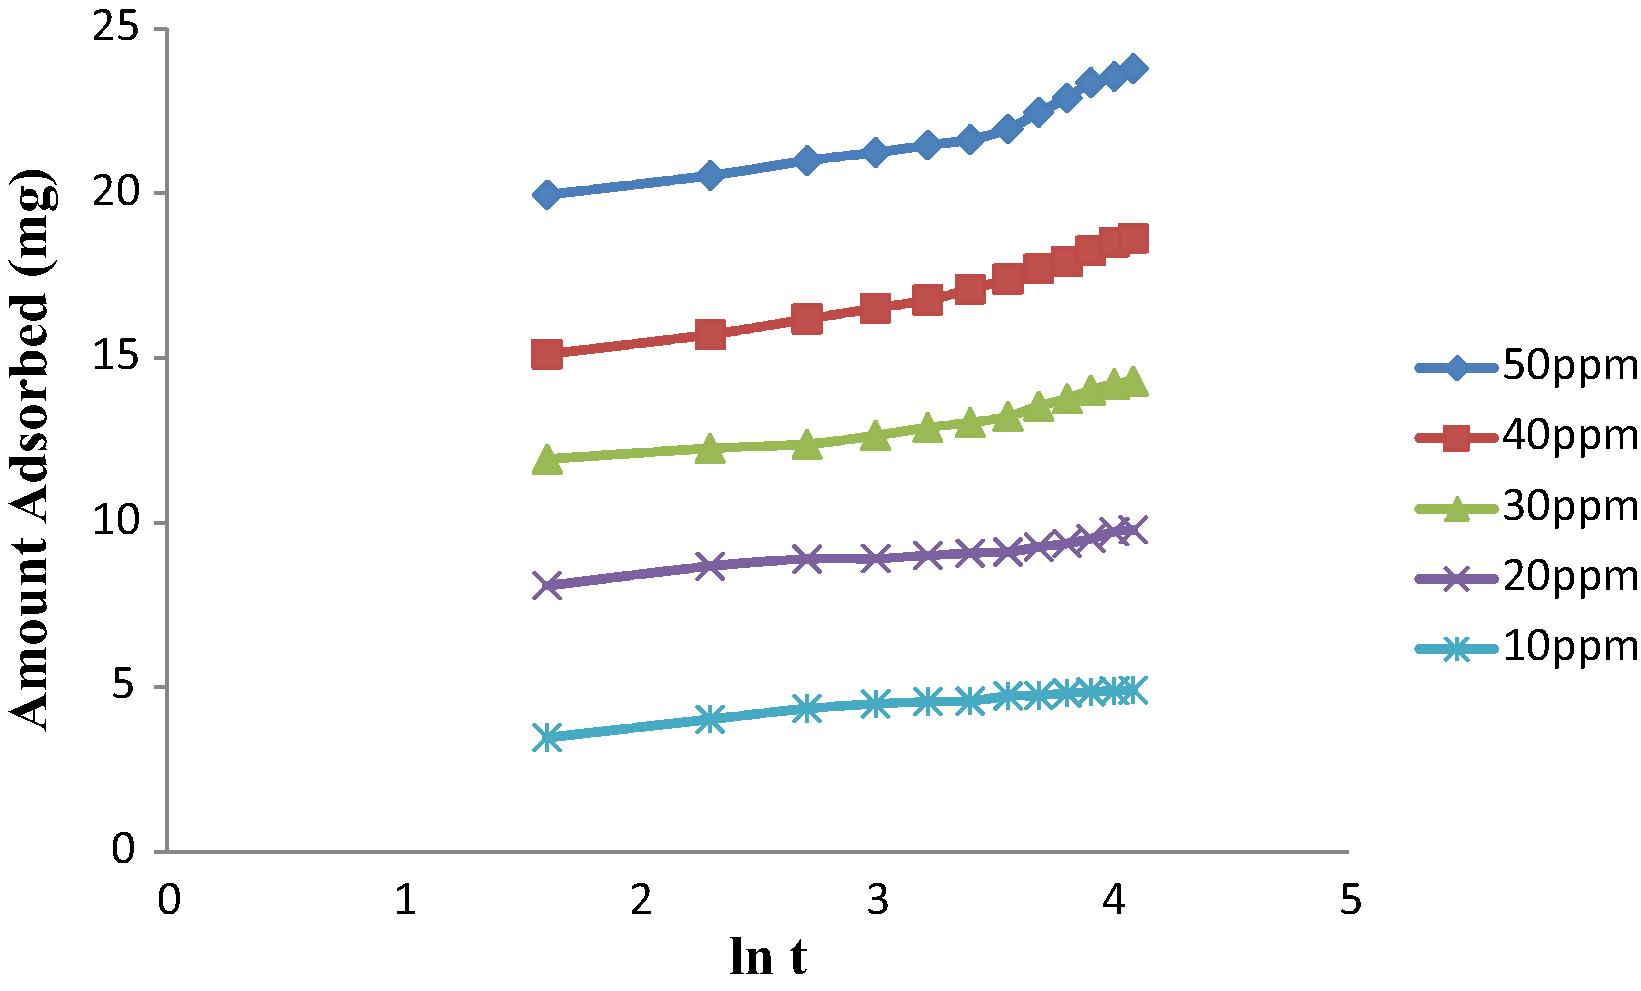
Elovich plot for the adsorption of 2,4-DCP at different concentrations onto MAC.
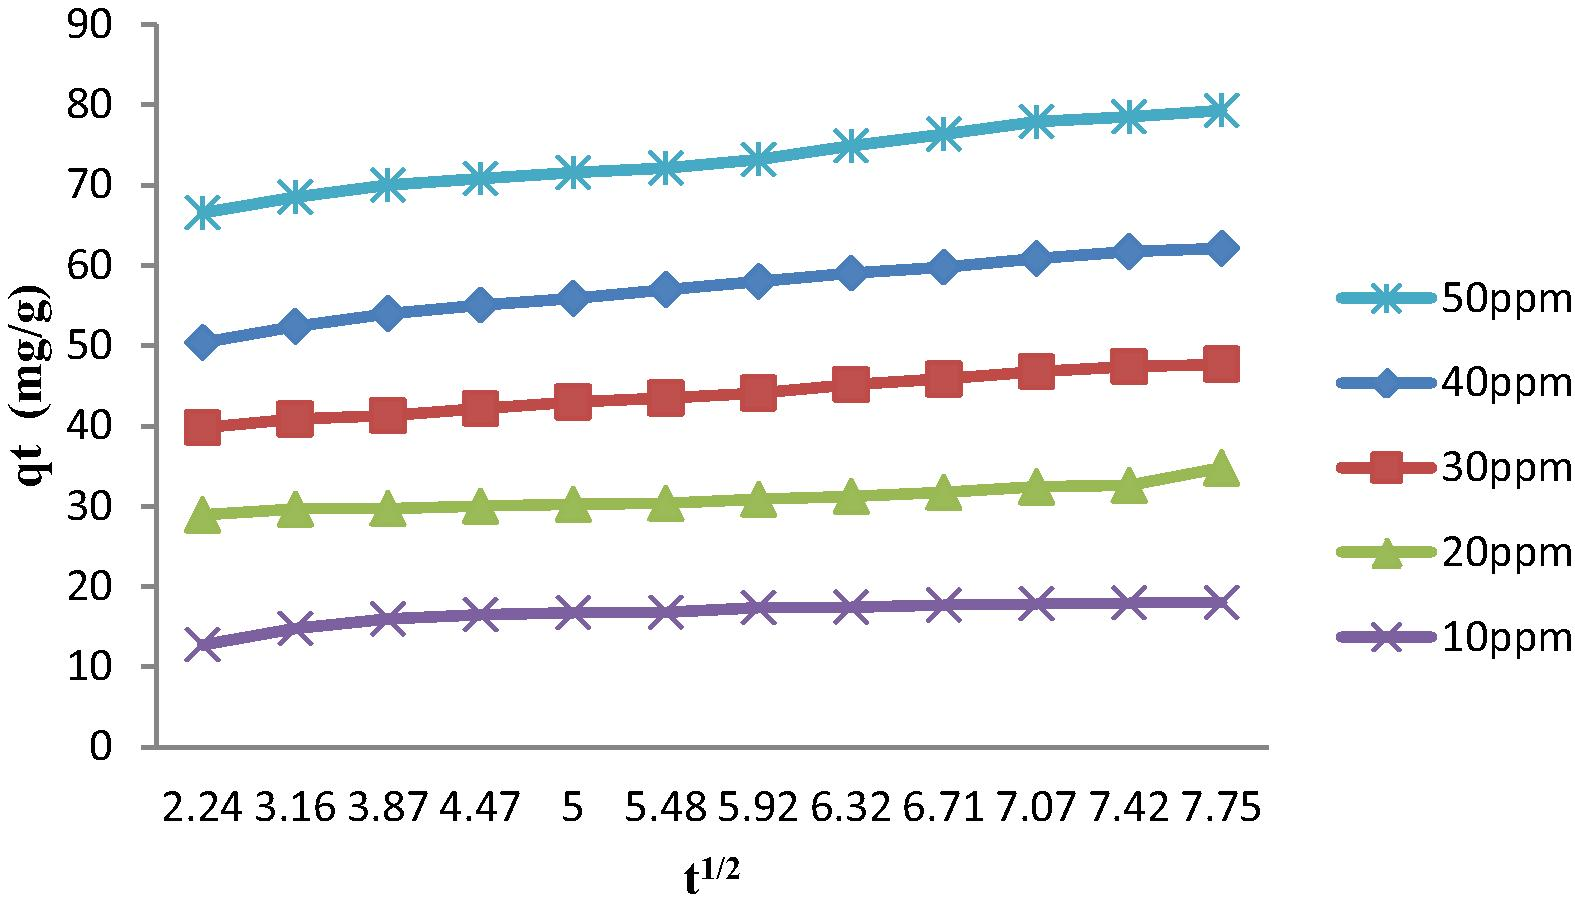
Intraparticle diffusion plot for the adsorption of 2,4-DCP at different concentrations onto MAC (AC2).
3.13 Comparison of the results from different studies
Table 7 shows the literature values of previous studies of AC using H3PO4 activation for comparison. Treatment with phosphoric acid and pyrolysis at 600 °C in inert atmosphere Same as (a) followed by steam activation at the same temperature, 600 °C Treatment with phosphoric acid and direct pyrolysis in a stream of water vapor at 700 °C BET surface area: 1360 m2/g Iodine number: 1280 mg/g Adsorption: Langmuir isotherms. BET surface area: 1000–1400 m2/g Pore volumes: 0.58–0.69 mL/g Adsorption of p-nitrophenol (PNP) and methylene blue (MB) showed values 250–435 and 310–540 mg/g, respectively BET surface area: 1200 m2/g Pore volume: 0.078 cm3/g
Reference
Precursor
Activation method
Product quality
Budinova et al. (2006)
Woody biomass birch
Adsorption capacity for Hg(II) at 293 K was 160 mg/g
Girgis et al. (2007)
Peach Stone Shells
AC derived by 50% H3PO4 and pyrolysis for 2 h at 500 °C. 5 carbons were prepared by changing gas atmosphere during thermal treatment (no external gas, flowing of nitrogen, carbon dioxide, steam or air). Additional carbon was obtained by extra-heat treatment at 800 °C of the standard carbon, for 2 h
Good adsorbents for Pb2+ ions from aqueous solutions (65–115 mg/g)
Tham et al. (2011)
Durian shell
Impregnated with different concentrations of phosphoric acid followed by carbonization at 500 °C for 20 min under nitrogen atmosphere
BET surface are: 1404 m2/g. Highest efficiency in removing toluene vapors by using 30% acid concentration at 500 °C for 20 min. Adsorption followed Freundlich model
Attia et al. (2008)
Peach stone shell
Chemical activation with H3PO4 at 500 °C under increasing acid concentrations of 30–70%. Two modified carbons prepared by concurrently passing nitrogen during pyrolysis of impregnated precursor with 50% H3PO4 at 500 °C and post-heated at 800 °C for one carbon
Excellent adsorption capacity for methylene blue (MB) appears, under equilibrium conditions, attaining values of ⩾ 400 mg/g. Best result obtained by impregnation with 70% H3PO4 and carbonized at 500 °C
Teng et al., 1998
Bituminous coal
Chemical activation: 20 g of as-received coal was mixed, by stirring, with 100 g of an aqueous solution that contained 0, 20, 40 or 85% of H3PO4 by weight at 50 or 85 °C for 1–3 h. After mixing, the coal slurry was subjected to vacuum drying at 100 °C for 24 h. The resulting samples were then carbonized in a horizontal cylindrical furnace (25 mm i.d.) in an N2 atmosphere, with a flow rate of 100 mL/min at 400–600 °C for 1–3 h
The high porosity and the large pore size of the high burn-off (65%) carbon from the combined activation suggest that treatment with H3PO4 followed by CO2 activation is suitable for producing high porosity carbons with a high proportion of mesoporosity (as high as 30%)
This work (Anisuzzaman et al.)
Coconut shell
The modified process involves impregnation of phosphoric acid at ratios of 0.6–2.4 and followed by 500 °C and 700 °C for 2 h. Various tests were conducted on the unmodified AC and chemically modified AC at different contact times (5–60 min) and adsorbent dosages (0.1–0.9 g)
Modified AC (AC 2) prepared with impregnation ratio, Xp value of 1.2 at 500 °C for 2 h was found to have the highest percentage removal of 2,4-DCP (50 ppm), which is 93.63%. The 2,4-DCP adsorption by MAC (AC2) suited better in the intraparticle diffusion model with 0.948 of correlation coefficient
4 Conclusion
Increase in impregnation ratio increases the ash content and percentage yield until it reaches the optimum value. For activation temperature, higher ash content results when the temperature is increased from 500 °C to 700 °C. However, lower percentage yields of MAC are obtained when the activation temperature is increased. The average moisture content of the MAC is in the range of 5.2–9.2%. The pH of MAC is in the range of 5–6. SEM displayed the honeycomb-like structure of the MAC. Whereas, FTIR showed the presence of —OH, C⚌O, C—O and C—C groups. AC2 prepared with impregnation ratio, Xp value of 1.2 at 500 °C for 2 h was found to have the highest percentage removal of 2,4-DCP (50 ppm) which achieved 93.63%. The MAC showed better capability to adsorb 2,4-DCP from aqueous solutions with an increase in percentage removal of 20.40%. Elovich and intraparticle diffusion kinetic models were used to test the adsorption kinetics. The 2,4-DCP adsorption by MAC (AC2) suited better in the intraparticle diffusion model with 0.948 of correlation coefficient.
Acknowledgements
This study was fully supported by the Centre of Research & Innovation, Universiti Malaysia Sabah (Grant No. SBK0058-SG-2013) and is gratefully acknowledged.
References
- The preparation of activated carbons from coal by chemical activation and physical activation. Carbon. 1996;34:471-479.
- [Google Scholar]
- The preparation of activated carbon from macadamia nutshell by chemical activation. Carbon. 1997;35:1723-1732.
- [Google Scholar]
- Adsorption of phenolic compounds on low-cost adsorbents: a review. Adv. Colloid. Interface. 2008;143:48-67.
- [Google Scholar]
- The factors affecting the performance of activated carbon prepared from oil palm empty fruit bunches for adsorption of phenol. Chem. Eng. J.. 2009;155:191-198.
- [Google Scholar]
- Anisuzzaman, S.M., Joseph, C.G., Ashri, W.M.W.D., Krishnaiah, D., Ho, S.Y., in press. Preparation and characterization of activated carbon from Typha orientalis leaves. Int. J. Ind. Chem.
- Removal of methylene blue by carbons derived from peach stones by H3PO4 activation: batch and column studies. Dyes Pigm.. 2008;76:282-289.
- [Google Scholar]
- Preparation of activated carbon from Tunisian olive-waster cakes and its application for adsorption of heavy metal ions. J. Hazard. Mater.. 2009;162:1522-1529.
- [Google Scholar]
- Preparation, characterization and methylene blue adsorption of phosphoric acid activated carbons from globe artichoke leaves. Fuel Process Technol.. 2011;92:1203-1212.
- [Google Scholar]
- Adsorption removal of copper (II) from aqueous solutions on activated carbon prepared from Tunisian date stones: equilibrium, kinetics and thermodynamics. J. Taiwan Inst. Chem. Eng.. 2012;43:741-749.
- [Google Scholar]
- Characterization and application of activates carbon produced by H3PO4 and water vapor activation. Fuel Process Technol.. 2006;87:899-905.
- [Google Scholar]
- Equilibrium and kinetic studies of methyl orange and methyl violet adsorption on activated carbon derived from Phramites australis. Desalination. 2010;252:149-156.
- [Google Scholar]
- Utilization of biodiesel waste as a renewable resource for activated carbon: application to environmental problems. Renew. Sustain. Energ. Rev.. 2009;13:2495-2504.
- [Google Scholar]
- Fox, R.D., Keller, R.T., Pinamont, C.J., 1973. Recondition and reuse of organically contaminated waste sodium chloride brines. EPA-R2-73-200, U.S. Environmental Protection Agency.
- Modification in adsorption characteristics of activated carbon produced by H3PO4 under flowing gases. Colloids Surf. A. 2007;299:79-87.
- [Google Scholar]
- Porosity development in activated carbons obtained from date pits under chemical activation with phosphoric acid. Micropor. Mesopor. Mater.. 2002;52:105-117.
- [Google Scholar]
- Activated carbon from cotton stalks by impregnation with phosphoric acid. Mater. Lett.. 1999;39:107-114.
- [Google Scholar]
- Removal of basic dyes from aqueous solution by separation on phosphoric acid modified rice straw. Dyes Pigm.. 2007;73:332-337.
- [Google Scholar]
- Preparation of oil palm empty fruit bunch-based activated carbon for removal of 2,4,6-trichlorophenol: optimization using response surface methodology. J. Hazard. Mater.. 2009;164:1316-1324.
- [Google Scholar]
- Activated carbons from waste biomass by sulphuric acid activation and their use on methylene blue adsorption. Bioresour. Technol.. 2008;99:6214-6222.
- [Google Scholar]
- Removal of Direct N Blue-106 from artificial textile dye effluent using activated carbon from orange peel: adsorption isotherm and kinetic studies. J. Hazard. Mater.. 2009;165:100-110.
- [Google Scholar]
- Adsorption of 2,4,6-trichlorophenol (TCP) onto activated carbon. J. King Saud Univ. Sci.. 2013;25:251-255.
- [Google Scholar]
- Ricinus communis pericarp activated carbon used as an adsorbent for the removal of Ni(II) from aqueous solution. J. Chem.. 2008;5:761-769.
- [Google Scholar]
- Wastewater treatment using low cost activated carbons derived from agricultural byproducts – a case study. J. Hazard. Mater.. 2008;152:1045-1053.
- [Google Scholar]
- Adsorption of phenol from aqueous solutions using activated carbons prepared from Tectona grandis sawdust by ZnCl2 activation. Chem. Eng. J.. 2005;115:121-131.
- [Google Scholar]
- Role of chemical activation in the development of carbon porosity. Colloids Surf.. 2004;241:15-25.
- [Google Scholar]
- Removal of lead (II) ions from aqueous solutions by adsorption onto pine cone activated carbon. Desalination. 2011;276:53-59.
- [Google Scholar]
- Modified activated carbon for the removal of copper, zinc, chromium and cyanide from wastewater. Sep. Purif. Technol.. 2002;26:137-146.
- [Google Scholar]
- Interaction of aqueous solutions of phenol with commercial activated carbons: an adsorption and kinetic study. Carbon. 1999;37:1065-1074.
- [Google Scholar]
- Nik, W.B.W., Rahman, M.M., Yusof, A.M., Ani, F.N., Adnan, C.M.C., 2006. Production of activated carbon from palm oil shell waste and its adsorption characteristics. In: 1st International Conference on Natural Resources Engineering & Technology, Putrajaya, Malaysia.
- Synthetic carbons activated with phosphoric acid I. Surface chemistry and ion binding properties. Carbon. 2002;40:1493-1505.
- [Google Scholar]
- Removal of water pollutants with activated carbons prepared from H3PO4 activation of lignin from kraft black liquors. Water Res.. 2004;38:3043-3050.
- [Google Scholar]
- SIRIM, 1984. Specification of powdered activated carbon MS873: Standardization and Industrial Research Institute Malaysia, Kuala Lumpur.
- Ammonia-modified activated carbon for the adsorption of 2,4-dichlorophenol. Chem. Eng. J.. 2011;169:180-185.
- [Google Scholar]
- Surface modification of coconut-based activated carbon by liquid-phase oxidation and its effect on lead ion adsorption. Desalination. 2010;255:78-83.
- [Google Scholar]
- Preparation of activated carbon from bituminous coal with phosphoric acid activation. Carbon. 1998;36:1387-1395.
- [Google Scholar]
- Performances of toluene removal by activated carbon derived from durian shell. Bioresour. Technol.. 2011;102:724-728.
- [Google Scholar]
- Equilibrium and Kinetic adsorption studies of Rhodamine-B from aqueous solutions using cocoa (Theobroma cacao) shell as a new adsorbent. Int. J. Eng. Sci. Technol.. 2010;2:6284-6292.
- [Google Scholar]
- Sorption kinetics of polycyclic aromatic hydrocarbons removal using granular activated carbon: intraparticle diffusion coefficients. J. Hazard. Mater.. 2008;157:386-396.
- [Google Scholar]
- Analysis of adsorption characteristic of 2,4-dichlorophenol from aqueous solutions by activated carbon fiber. J. Hazard. Mater.. 2007;144:200-207.
- [Google Scholar]
- Adsorption of 2,4-dichlorophenol on Mn-modified activated carbon prepared from Polygonum orientale Linn. Desalination. 2011;266:175-181.
- [Google Scholar]
- Phosphoric acid effect on prepared activated carbon from Saudi Arabia’s date frond waste. Appl. Mech. Mater.. 2012;110–116:2124-2130.
- [Google Scholar]


