Ameliorative effect of vitamin E on potassium dichromate-induced hepatotoxicity in rats
*Tel.: +966 555759031 aaalshati@kku.edu.sa (Ali A. Shati)
-
Received: ,
Accepted: ,
This article was originally published by Elsevier and was migrated to Scientific Scholar after the change of Publisher.
Available online 13 December 2013
Peer review under responsibility of King Saud University.

Abstract
Hexavalent chromium [Cr (VI)]-mediated oxidative stress causes severe hepatic toxicity. This study aims to investigate the protective role of oral vitamin E administration against potassium dichromate (K2Cr2O7)-induced hepatotoxicity. Adult male rats (Rattus norvegicus, n = 24) weighing 150–180 g were used and divided into 4 groups (n = 6 per group): the control group received distilled water; control + vitamin E group received vitamin E (100 mg/kg b.w.); Cr group received K2Cr2O7 (8 mg/kg b.w.), and Cr + vitamin E group received K2Cr2O7 + vitamin E. All treatments were administered orally on a daily basis for 6 weeks.
There was a significant accumulation of Cr in the livers of the Cr group compared with the control group. In addition, exposure to K2Cr2O7 induced significant increases in the level of thiobarbituric-reactive substances (TBARS) and significant decreases in glutathione (GSH) content and superoxide dismutase (SOD) activity in the Cr group compared with the control group. Moreover, livers of the Cr group showed major histological alterations, such as severe necrosis, increased lymphocytic infiltration, and a significant decrease in the DNA content. Oral vitamin E administration concomitant with K2Cr2O7 ameliorated all these changes and resulted in normal hepatic histological and cellular contents. In conclusion, oral vitamin E administration has a hepatoprotective role against K2Cr2O7-induced hepatotoxicity in rats.
Keywords
Dichromate
Oxidative stress
Vitamin E
Histopathology
Lipid peroxidation
1 Introduction
Chromium (Cr) is a naturally occurring heavy metal commonly found in the environment in two valence states: [remark 2] trivalent Cr (III) and hexavalent Cr (VI). It is widely used in numerous industrial processes, and thus is a contaminant of many environmental systems (Bagchi et al., 2002). It is commonly used in various industries (e.g., steel, alloy, cast iron, chrome plating, paints, leather tanning, photography, and metal finishes). However, Cr (VI) compounds have been reported to be more toxic and carcinogenic than those of Cr (III) because the former can pass through cell membranes more easily than the latter (Patlolla et al., 2009). Once inside the cell, Cr (VI) is reduced to its lower oxidation states, Cr (V) and Cr (IV), and then to Cr (III) by low-molecular weight molecules, enzymatic reductants, and nonenzymatic reductants (Susa et al., 1996). These reactive chromium intermediates are capable of generating a whole spectrum of reactive oxygen species (ROS), which is an important characteristic of Cr (VI) metabolism (O’Brien et al., 2001). An excessive quantity of ROS that is generated by these reactions can cause injury to cellular proteins, lipids, and DNA, leading to a state known as oxidative stress (Liu and Shi, 2001; Sugiyama, 1992; Yam-Canul et al., 2008). Therefore, one of the most important damages caused by extraneous Cr (VI) is the massive ROS production during Cr (VI) reduction in the cell.
However, the liver is the major organ responsible for metabolism, detoxification, and secretory functions in the body. Hence, it regulates various important metabolic functions in mammalian systems (Sugiyama, 1992). Cr (VI) has been reported to cause hepatotoxicity in humans and laboratory animals primarily through an oxidative stress-mediated mechanism (Laborda et al., 1986; Soudani et al., 2011; Sugiyama, 1992). Exposure of rats to Cr induced oxidative stress with an increase in hepatic malondialdehyde (MDA) levels and a decrease in glutathione (GSH) levels. In addition, it induced a parallel decrease in glutathione peroxidase (GPx) activity and an increase in superoxide dismutase (SOD) and catalase (CAT) activities, with a decrease of liver glycogen concentration and oxidative deterioration of lipids and proteins (Garcia-Nino et al., 2013; Soudani et al., 2011). Considering the high sensitivity of the liver to Cr (VI)-related insult, preventive intervention is a major concern.
Vitamin E has received wide attention due to its reported hepatoprotective effects in animals, which is primarily due to its ability to attenuate the induced oxidative stress in various tissues by reducing MDA levels; restoring the levels of GSH, SOD, and CAT and the recovery of impaired hepatic cells (Bharrhan et al., 2010).
Many studies have reported the antioxidant protective effect of vitamin E against several metals that induced hepatotoxicity, including copper, lead, sodium fluoride, cadmium, mercury, and ferrous sulfate (Al-Attar, 2011; Chinoy et al., 2004; Gaurav et al., 2010; Osfor et al., 2010). The protective effect of vitamin E against Cr-induced hepatotoxicity was reported in a study where the authors investigated the direct protective effect of vitamin E on Cr (VI)-induced cytotoxicity and lipid peroxidation in primary cultures of rat hepatocytes (Susa et al., 1996). Susa et al. (1996) reported that such protective effects may be associated with the levels of nonenzymatic instead of enzymatic antioxidants. However, this study was conducted on primary cultures of rat hepatocytes, and to our knowledge, no study has been conducted on the protective effects of oral administration of vitamin E against Cr-induced hepatotoxicity in living organisms. Therefore, the current study aimed to determine whether oral administration of vitamin E would have protective effects against Cr-induced hepatic injury, oxidative stress, and hepatic structural changes in rats.
2 Materials and methods
2.1 Chemicals
Cr as potassium dichromate (K2Cr2O7) was obtained from Sigma–Aldrich, St. Louis, MO, USA, dissolved in distilled water to form a stock solution of 10 mg/ml, and diluted further according to the dose required per rat. Vitamin E [α-tocopheryl acetate, natural (1 mg/ml)] was purchased from BDH, England and was diluted in olive oil to a final concentration of 100 mg/ml which was used further in the experimental procedure according to selected dose per weight of rats. All other chemicals and reagents were purchased from Sigma–Aldrich, St. Louis, MO, USA.
2.2 Experimental animals
This study was conducted at the laboratories of the biology department at King Khalid University, Abha, KSA with the approval of the Ethics Committee of the College of Science at King Khalid University. Furthermore, the study followed the international guidelines for the care and use of laboratory animals. Adult male rats (Rattus norvegicus) 6–8-week old (150–180 g) used in this study were obtained from the experimental animal unit at the faculty of science at King Khalid University, Abha, KSA. Rats were fed standard rat pellets and allowed ad libitum to water during acclimatization. They were housed at a controlled ambient temperature of 25 ± 2 °C and 50 ± 10% relative humidity, with a 12-h light/dark cycle.
2.3 Experimental procedure
After a 1-week adaptation period, the rats were randomly divided into 4 groups of 6 rats each: the control group, received 1 ml of distilled water; control + vitamin E group, received 100 mg/kg b.w. of vitamin E; Cr group, received 8 mg/kg b.w. K2Cr2O7; Cr + vitamin E group, received concomitant doses of K2Cr2O7 (8 mg/kg b.w.) and vitamin E (100 mg/kg b.w.). All treatments were orally administered on a daily basis for 6 weeks. Dose selection and mode of administration of both K2Cr2O7 and vitamin E were based on previous studies (Susa et al., 1996). Six hours after the last treatment on Day 42, rats from all groups were anesthetized with light diethyl ether. Blood samples (1 ml) were collected using a 1-ml syringe directly from the heart using the ventricular puncture method into plain 3-ml untreated glass tubes and were allowed to clot for 15 min at room temperature. Samples were centrifuged at 4000 rpm for 10 min to separate and obtain the serum, which was used to determine the serum Cr levels, then all rats were sacrificed by decapitation. Parts of their livers were fixed in 10% neutral-buffered formalin for histopathological and histochemical analyses. Other parts of their livers were removed and transferred to a Petri dish, where they were washed with phosphate–buffered saline (PBS). PBS (pH 7.4) contained 0.16 mg/ml of heparin, and washes were performed to remove any red blood cells (erythrocytes) and clots. Then the tissue was homogenized in the appropriate buffer for determination of the biochemical parameters.
2.4 Biochemical analysis
Lipid peroxidation was estimated by measuring the thiobarbituric-reactive substances (TBARS) as malondialdehyde in liver homogenate using the method of Ohkawa et al. (1979). The activity of superoxide dismutase (SOD) in sera was assayed according to Nishikimi et al. (1972). Activity of reduced glutathione (GSH) was measured using the method of (Ellman, 1959). Cr concentration was estimated in the liver tissues and sera using atomic absorption according to the method described previously (Shirley et al., 1949). DNA content in the liver homogenate was estimated using the method of Dische and Schwarz (1937), which depends on the quantitative determination of nucleic acids through reacting the sugar components of the nucleic acids with diphenyl amine reagent (DPA).
2.5 Histopathological studies
Liver sections from all groups were fixed in 10% formalin, embedded in paraffin, and dehydrated in ascending concentrations of ethyl alcohol (70–100%). Subsequently, 5-μm tissue sections were cut, mounted on slides, stained with hematoxylin and eosin (H&E) for liver histopathology, Masson trichrome stain for collagen deposition, periodic acid-Schiff (PAS) to demonstrate glycogen deposition, Mercuric bromophenol blue for protein detection, and the Feulgen reaction for DNA content (Drury et al., 1980). The sections were examined using a Leica DFC 280 light microscope.
2.6 Statistical analysis
Statistical analyses were performed using the GraphPad Prism software version 4.0 (GraphPad, San Diego, CA). Data are presented as means with their standard deviation (mean ± SD). Normality and homogeneity of the data were confirmed before ANOVA, and differences among the experimental groups were assessed by one-way ANOVA followed by Tukey’s t-test.
3 Results
3.1 TBARS level, GSH content, and SOD activity
In liver homogenates, no significant differences were observed in the TBARS levels, total GSH content, or SOD activity between the control group and control + vitamin E group (P = 0.987, P = 0.995, and P = 0.763, respectively) (Fig. 1). However, in Cr-affected rats compared with those of the control group, hepatic TBARS levels were significantly higher (P = 0.0001), whereas the total GSH content and SOD activity were significantly lower (P < 0.0001) (28.7% and 32.4%, respectively) (Fig. 1). Vitamin E administration as a concomitant dose with K2Cr2O7 resulted in an increase of 25.1% and 28.01% in SOD activity and GSH content, respectively, and in decrease of 14.2% in TBARS levels compared with the K2Cr2O7-affected group (P < 0.0001) (Fig. 1).

- Lipid peroxidation content (TBARS, A), total reduced thiol levels (B), and superoxide dismutase activity (C) in the liver homogenates of all groups. Values were considered significantly different at ∗P < 0.05. ∗: Significantly different when compared with the control group. (a) Significantly different when compared with the control + vitamin E-treated group. (b): significantly different when compared with the Cr-treated group. Control + vitamin E represents vitamin E-treated group; Cr + vitamin E represents Cr and vitamin E-treated group. Values are given as mean ± S.D. of six rats in each group.
3.2 Serum and hepatic Cr content
It was obvious that the Cr level in both serum and liver homogenates of the K2Cr2O7-affected rats was significantly higher (P = 0.0023) than Cr level in the control group (36.79 ± 4.53 ppm/100 ml vs. 21.8 ± 2.67 ppm/100 ml) (Fig. 2). In the control + vitamin E group, there was no significant difference in the levels of both serum and the hepatic Cr (P = 0.8793) when compared with the control group. Vitamin E administration in parallel with K2Cr2O7 to rats failed to reduce the increased levels of Cr in both serum and liver of the control + vitamin E group when compared with the Cr group (Fig. 2).
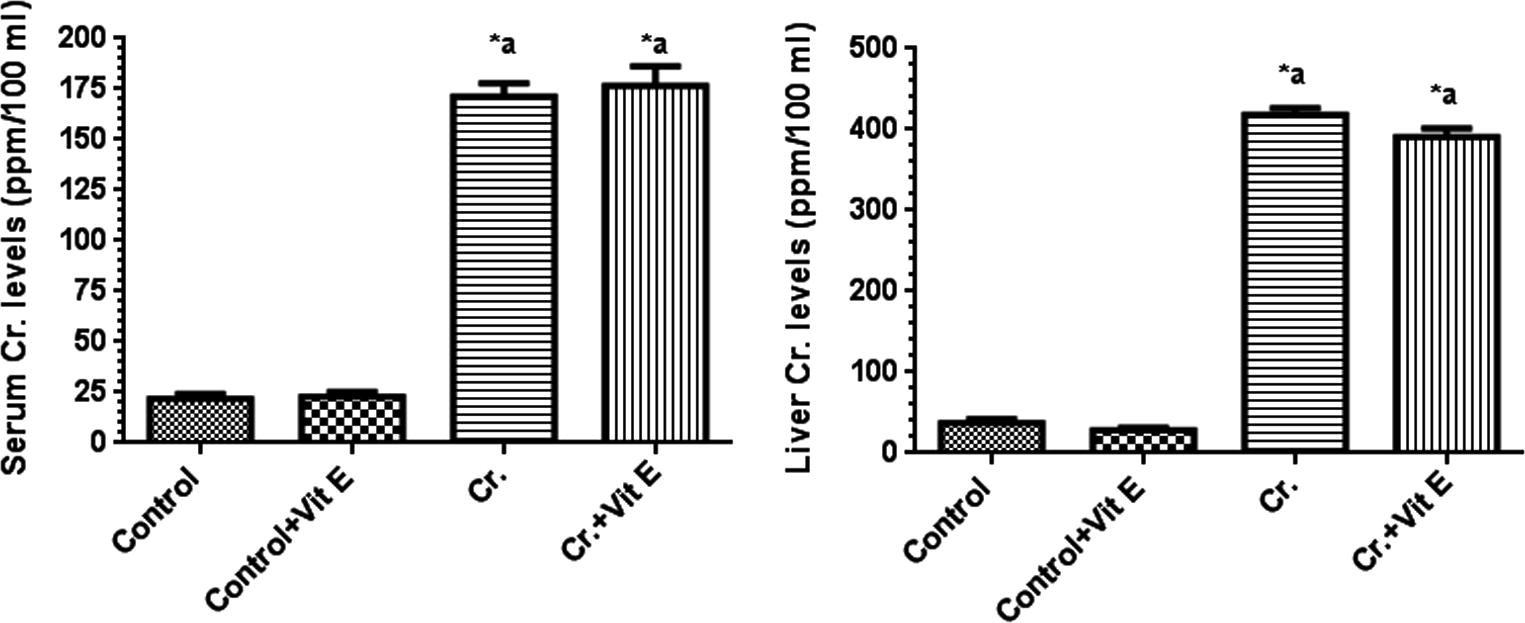
- Serum and hepatic Cr levels in all rat groups. Values were considered significantly different at P < 0.05. ∗: Significantly different when compared to control group. (a) Significantly different when compared to control + vitamin E-treated group. (b) Significantly different when compared to Cr group. Control + vitamin E represents vitamin E-treated group; Cr + vitamin E represents Cr and vitamin E-treated group. Values are given as mean ± S.D. of six rats in each group.
3.3 Nucleic acids (DNA) content
The DNA content (presented as mg/g tissue) in all rat groups are shown in Fig. 3. Vitamin E administration did not significantly affect the hepatic DNA content in the Cr + vitamin E group compared with the control group (1.03 ± 0.12 mg/g vs. 1.09 ± 0.09 mg/g). However, significant depletion of DNA content (23.3%, P = 0.0021) was reported in the Cr group compared with the control group (0.790 ± 0.06 mg/g vs. 1.09 ± 0.09 mg/g). Vitamin E concomitant treatment with Cr could ameliorate the decreased DNA content in the liver of the Cr group compared with the Cr + vitamin E group (1.02 ± 0.045 mg/g vs. 0.790 ± 0.06 mg/g) (Fig. 2).
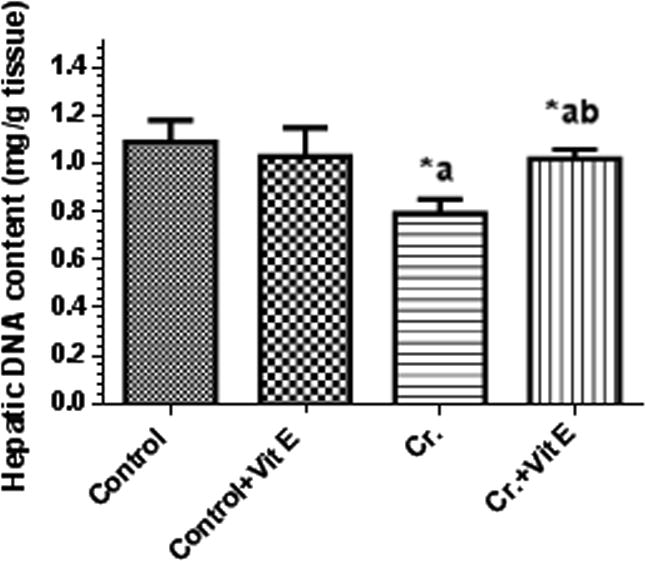
- Total hepatic DNA content in the control and all experimental rat groups. Values were considered significantly different at P < 0.05. ∗: Significantly different when compared with the control group. (a) Significantly different when compared with the control + vitamin E-treated group. (b) Significantly different when compared with the Cr-treated group. Control + vitamin E represents vitamin E-treated group; Cr + vitamin E represents Cr and vitamin E-treated group. Values are given as mean ± S.D. of six rats in each group.
3.4 Histopathological findings
The hepatic parenchyma of the control or vitamin E group had normal architecture, comprising several hepatic lobules separated from each other by very delicate connective tissue septa housing the portal triad. Each hepatic lobule contained a thin-walled central vein surrounded by hepatic cords radiating toward the periphery and separated by blood sinusoids. The hepatocytes appeared polyhedral in shape with no vacuolated cytoplasm, containing basophilic granules and central rounded vesicular nuclei (Fig. 4A and B). Cr-administered rat livers had severe liver damage, including focal necrosis, congestion of blood vessels, increased lymphocytic infiltration around blood vessels, pyknotic nuclei, karyolysis, proliferation of Kupffer cells and bile ductless, and appearance of numerous vacuoles and sinusoids as well as distortion of hepatic cells (Fig. 4C–F). These histopathological changes were improved in livers of the Cr + vitamin E group because the hepatocytes appeared with a normal pattern and the radial arrangement around the central vein was restored, although congested blood vessels were still found (Fig. 4G).
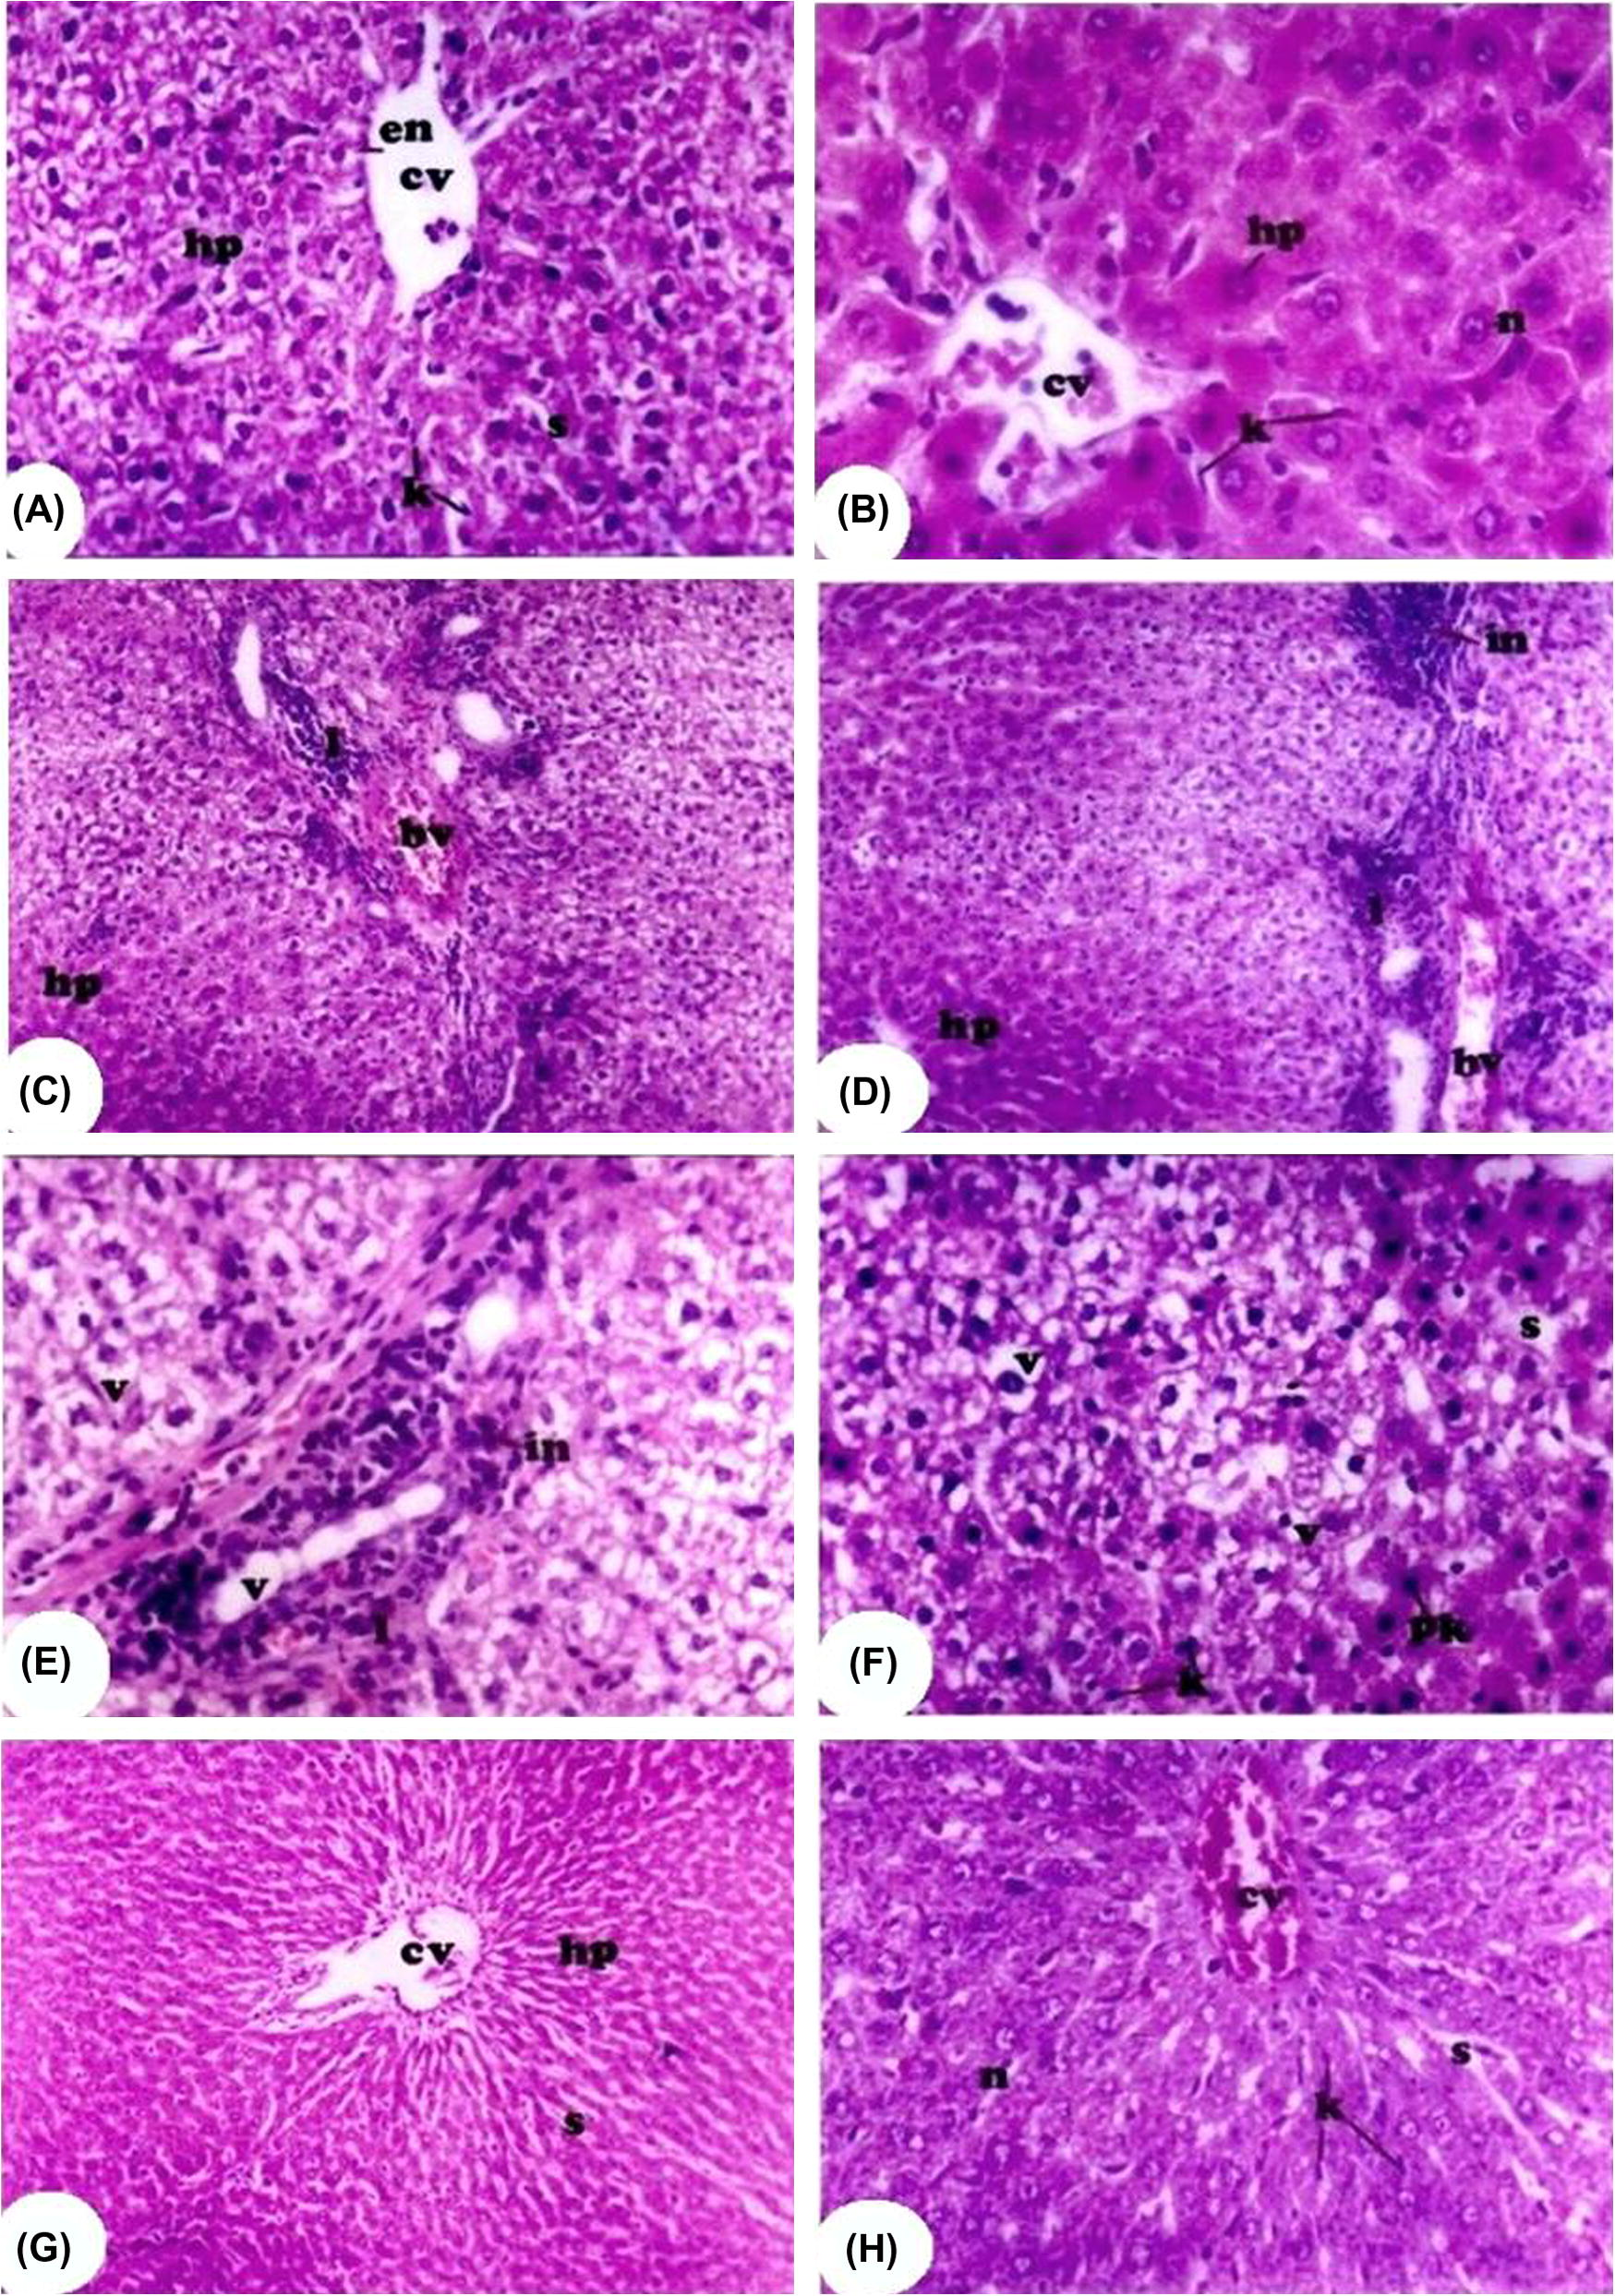
- Hematoxylin and Eosin (H&E) photomicrograph of the liver sections from all rat groups. (A and B) Represent photomicrograph from the control and control + vitamin E-treated groups, respectively, showing a well-preserved liver architecture central with central vein (cv) lined with endothelial cells (en), hepatic cells (hp) with centrally located nuclei (n), Kupffer cells (k), and narrow blood sinusoids (s). (C–F) Represent photomicrograph from Cr-treated rat displaying congested blood vessels (bv) and increased lymphocytic infiltration (l, in) and the distortion of hepatic cells (HP). Pyknotic nuclei (pk), increased Kupffer cells (k), and numerous vacuoles (v) and sinusoids (s) were also seen. (G and H) Representative photomicrographs from Cr + vitamin E-treated rats showing great recovery of the hepatocytes (hp). The hepatic cells nearly retain their radial arrangement around the central vein (cv). Numerous sinusoids (s) appeared between the hepatic cells. The presence of some congested blood vessels (CV) and hemorrhage were observed in some samples.
3.5 Glycogen histochemistry
The livers of the control and vitamin E-treated rat groups revealed that glycogen was observed in the cytoplasm of the hepatocytes as indicated by the large number of reddish-colored fine granules of different sizes (Fig. 5A and B, respectively) because of strong periodic acid-Schiff (PAS) reaction. On the other hand, oral Cr administration to rats for consecutive 6 weeks resulted in a noticeable decrease in the glycogen content as evident by the decrease in the amount of PAS-stained hepatocytes. In these livers, glycogen content displayed weak intensity of the reaction and became hardly detectable (Fig. 5C and D). However, combined administration of vitamin E and Cr strengthened the PAS reaction and resulted in a large number of reddish-colored fine granules of different sizes, indicating increased glycogen content that is similar in intensity to those observed in the control group. The strongest PAS reaction was in the hepatocytes and around the central vein (Fig. 5E and F).
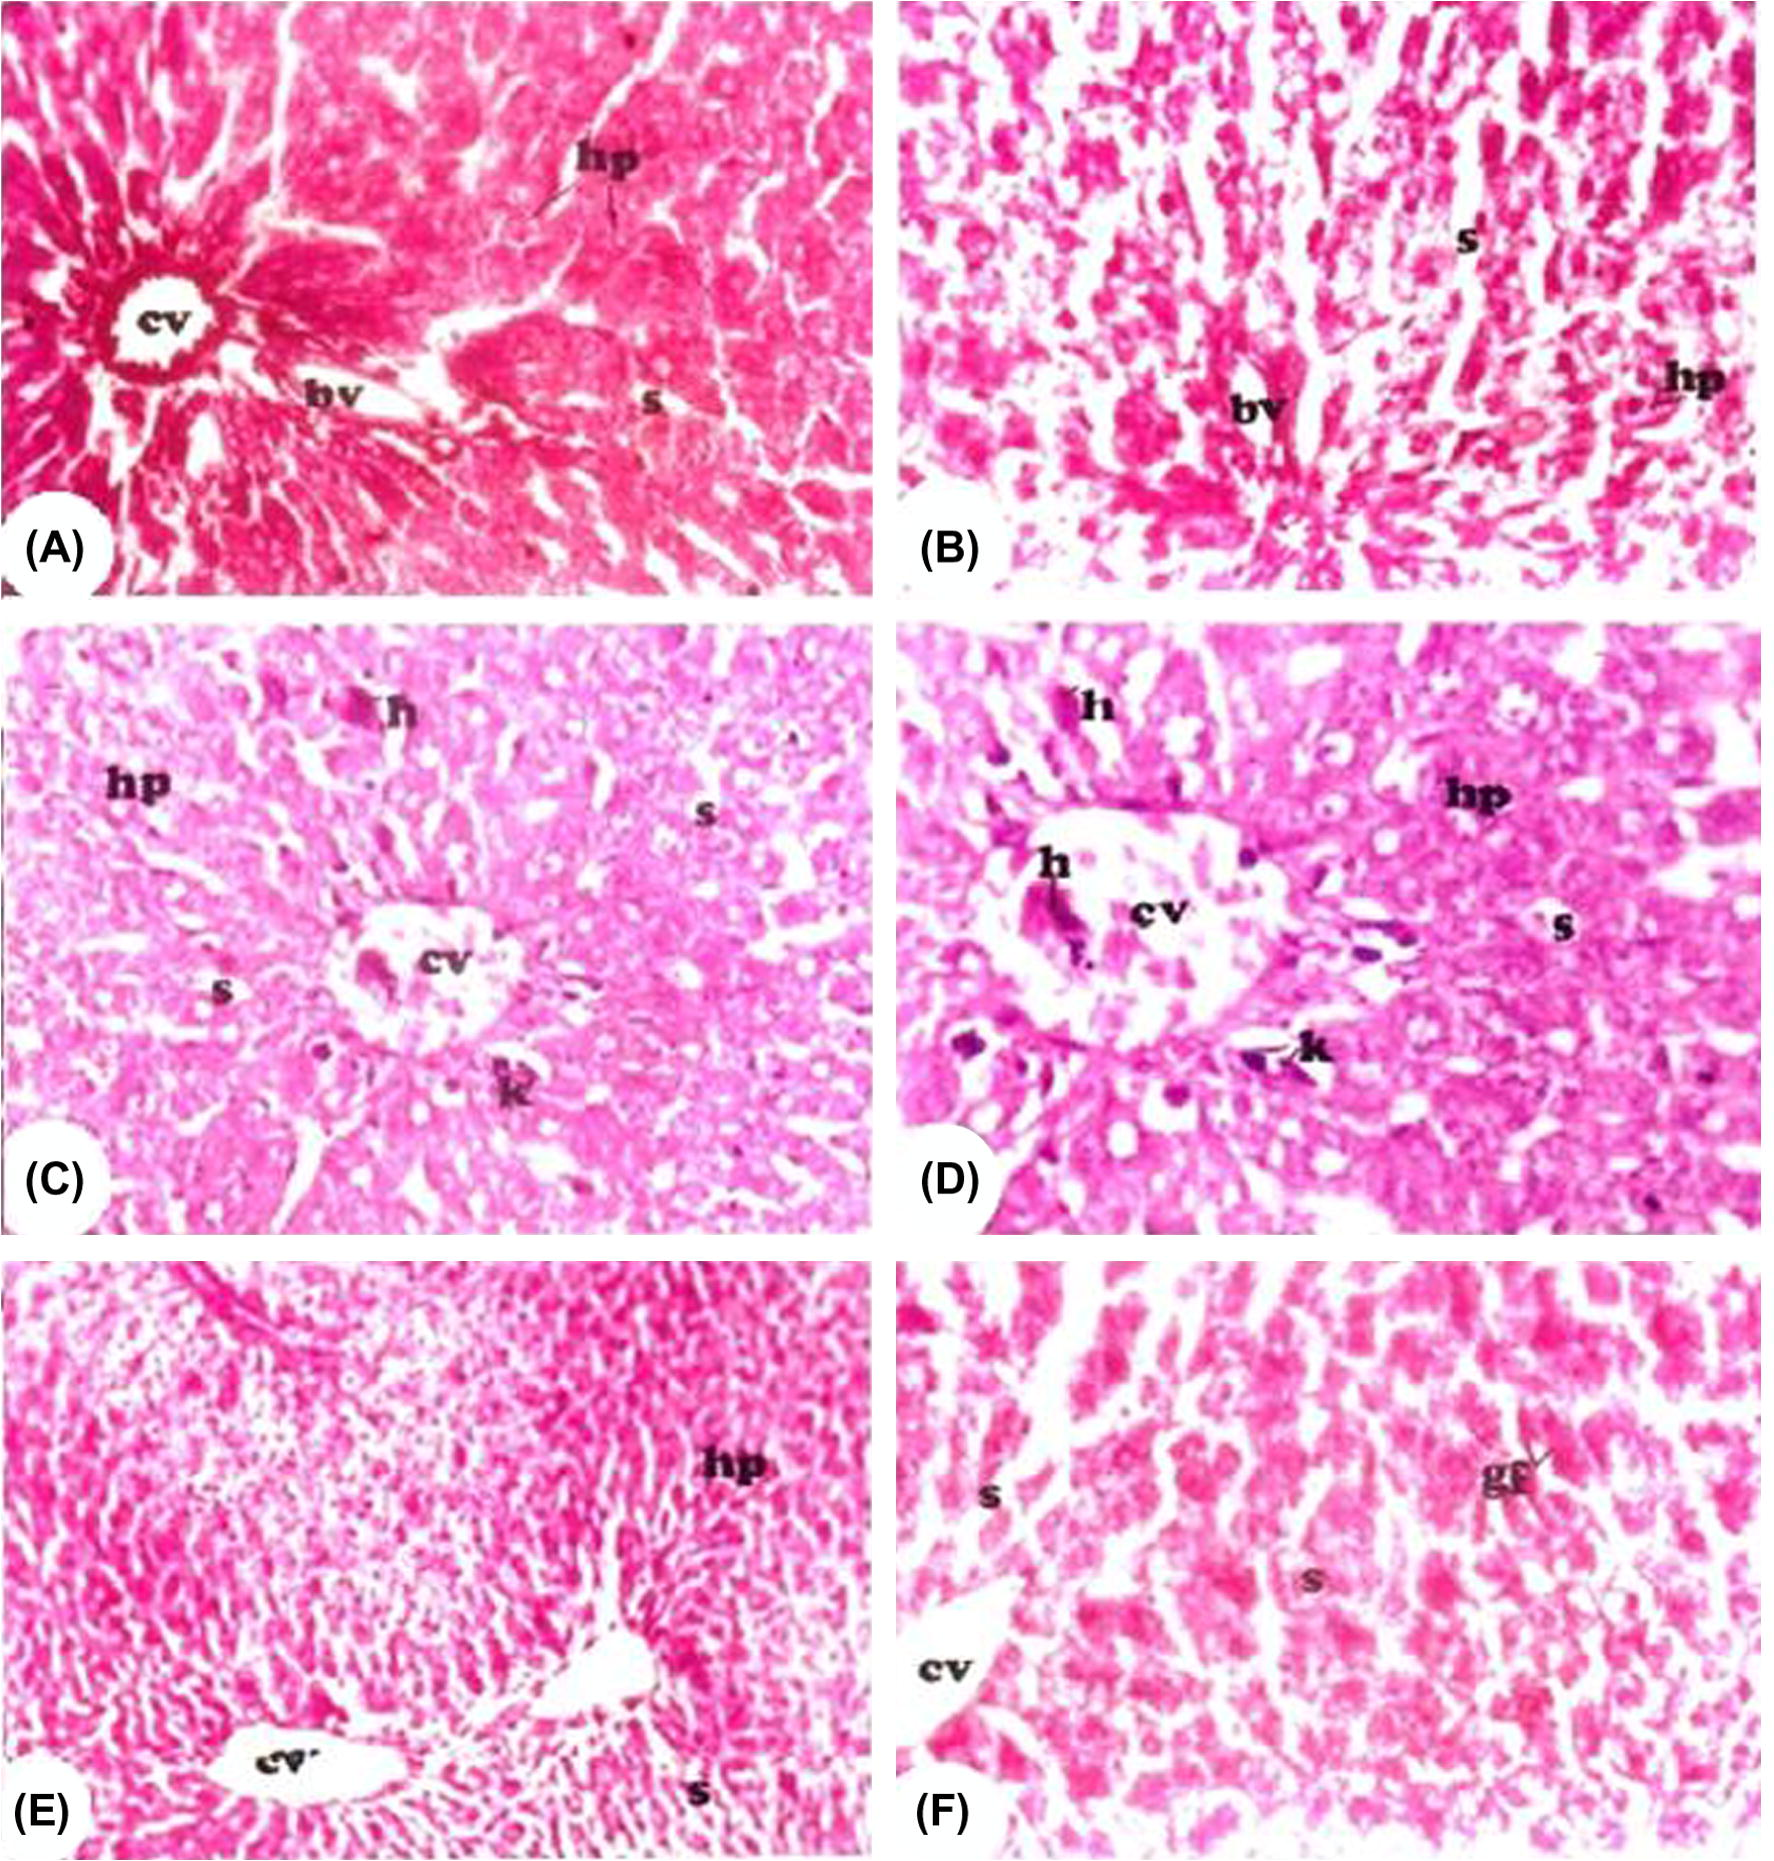
- Periodic acid-Schiff (PAS) photomicrograph of the liver sections from all rat groups for detection of glycogen deposition. (A and B) Represent photomicrograph from the control group and control + vitamin E groups, respectively, showing strong PAS-positive materials in the hepatocytes (hp). (C and D) Represent photomicrograph from Cr-treated rats showing marked inhibition of PAS-positive materials in the hepatic cells (hp). Kupffer cells (k), sinusoidal spaces (s), and hemorrhage (h) are abundant. (E and F) Representative photomicrographs from Cr + vitamin E-treated rats showing great recovery of PAS-positive materials in the liver cells. Glycogen flight (gf) and numerous sinusoidal spaces (s) are visible. cv: central vein, bv: blood vessels. Red coloration indicates positive PAS reaction.
3.6 Protein histochemistry
The control or vitamin E group livers were characterized by high concentrations of total protein content. In cellular cytoplasm, the mercury bromophenol blue (Hg–BPB) reaction was highly positive and was either in the form of bluish granules of different sizes or in a diffused state, perinuclear or peripheral in position, particularly concentrated adjacent to blood sinusoids and equally distributed. In the nucleus, the chromatic granules and the nucleoplasm were stained to a less extent and gave a diffused faint blue color (Fig. 6A and B). Total protein was found to exhibit a noticeable decrease in cytoplasms and nuclei of the liver cells in the Cr group because it showed high percentages of protein-devoid hepatocytes with cytoplasmic vacuolation and the protein remnants were primarily located on the periphery of cells, particularly around the central vein (Fig. 6C). However, oral vitamin E administration concomitant with Cr could ameliorate changes in protein content in rat livers when compared with the Cr group. The Hg–BPB reaction increased and dark blue spotted granules of protein of different sizes or in a diffused state, perinuclear or peripheral in position, particularly adjacent to blood sinusoids and equally distributed were seen in the livers of this group of rat (Fig. 6D and F).
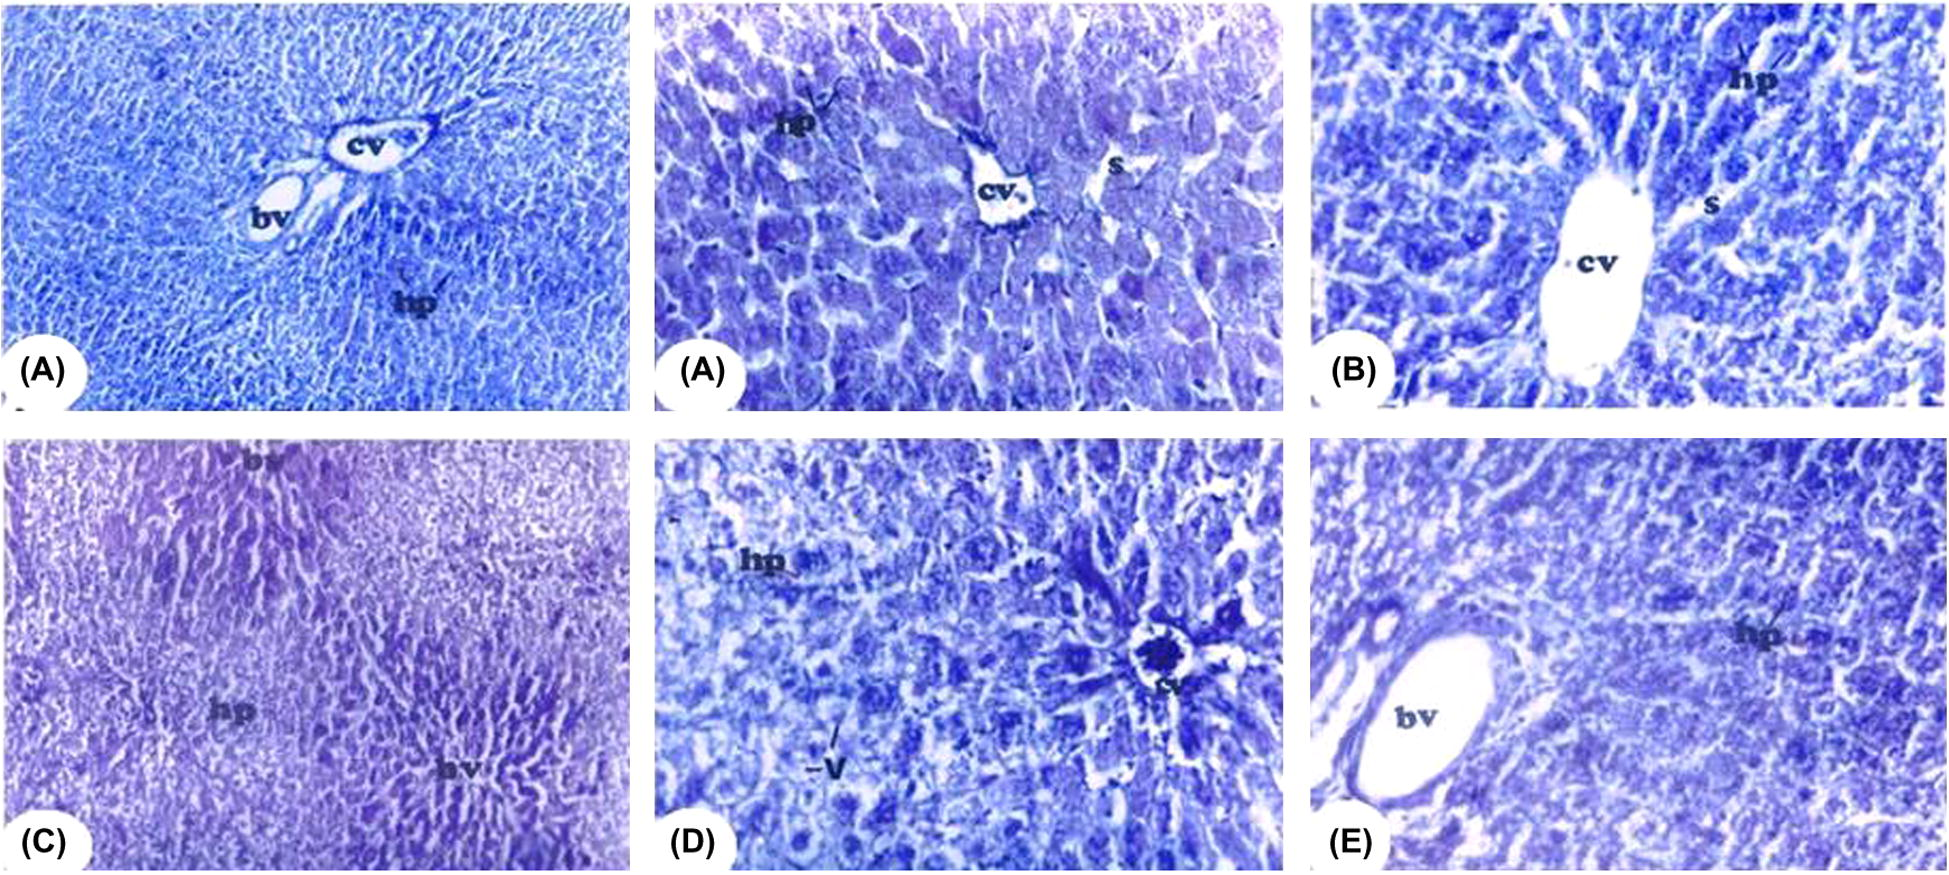
- Mercuric bromophenol blue-stained photomicrograph of a liver section from all groups for detection of protein deposition. Blue coloration indicated positive reaction. (A and B) Represent photomicrographs from the control group and control + vitamin E-treated groups, respectively, showing dark blue spotted granules of protein stained materials equally distributed in the hepatocytes (hp). (C) Represents photomicrograph from Cr-treated group and showing a pronounced decrease in protein stained materials of the hepatocytes (HP). Great loss and unequal distribution of protein stained materials are obvious. (D and E) Represent photomicrographs from Cr + vitamin E-treated rats showing marked recovery of the hepatocytes (hp) with increase in protein stained material, which is nearly equally distributed. Bv: blood vessels, s: sinusoidal spaces and v: vacuoles.
3.7 Feulgen’s reaction
To determine DNA content, liver sections were stained with Feulgen’s reaction to demonstrate DNA as a magenta color. Liver sections of the control or vitamin E-treated rat group showed normal DNA contents (Fig. 7A). The DNA content was reduced as explained by moderate magenta color and faintly stained nuclei in the hepatocytes of liver sections of the Cr group (Fig. 7B). Liver sections of Cr + vitamin E rats showed restoration of DNA content similar to that in the control group (Fig. 7C).
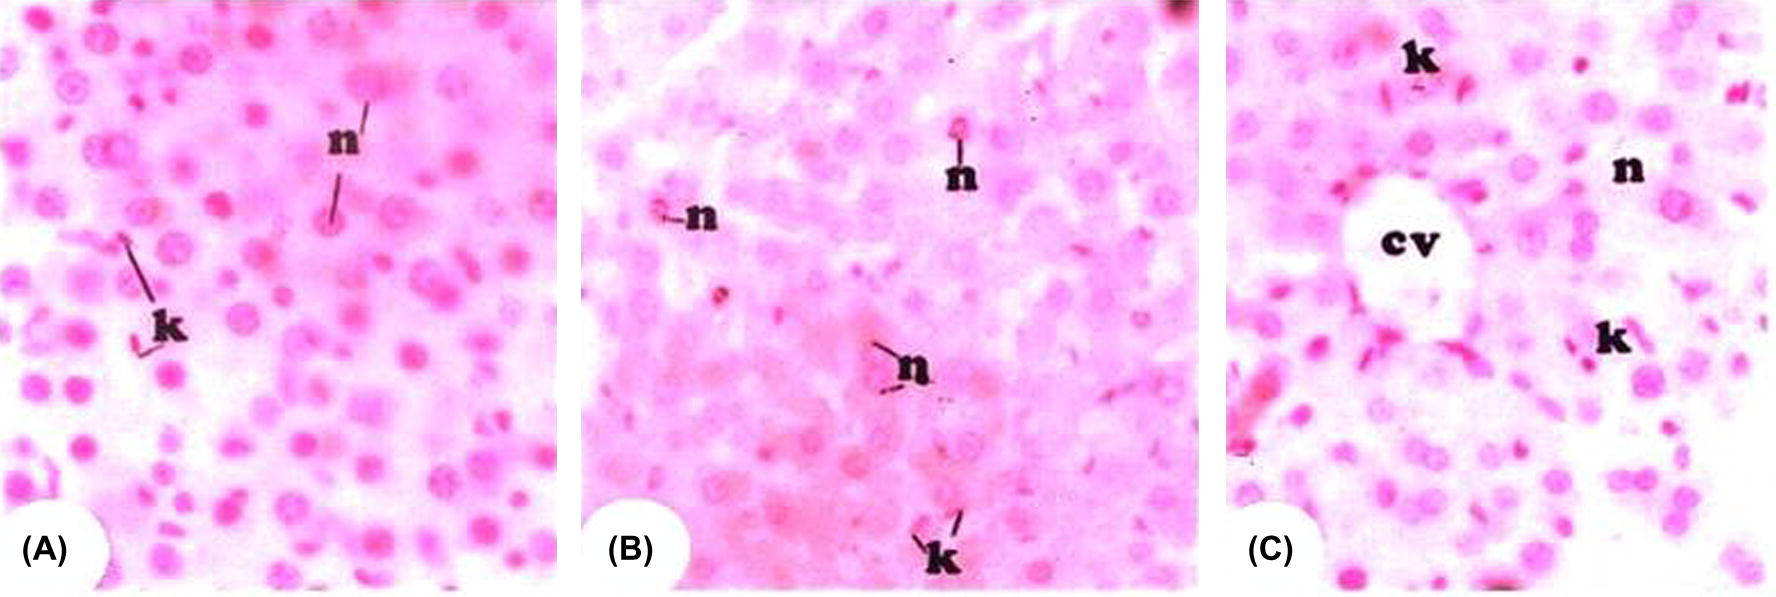
- Photomicrograph of Feulgen reaction for nuclear DNA detection in the liver sections from all groups (A) represent photomicrograph from control group displaying an intensive reaction for DNA in the nuclei (n). Kuppfer cells (k) are distinct. (B) Represents photomicrograph from Cr-treated rat showing great depletion of DNA stained materials in the nuclei (n) of the hepatocytes. Kupffer cells (k) are markedly increased. (C) Represents: photomicrograph from Cr + vitamin E-treated rats showing the great restoration of the DNA in the nuclei (n) of the heptocytes. Kupffer cells (k) are still numerous.
4 Discussion
The present study demonstrated that orally administered vitamin E could ameliorate hepatic oxidative stress and attenuate the histopathological damaging effect induced by K2Cr2O7 in the rat liver. In addition, it clearly demonstrates the protective effect of vitamin E on glycogen, protein, and DNA content of hepatocytes. The oxidation state and solubility of Cr compounds determine their toxicity. In contrast to Cr (III), which is a naturally occurring form and an essential trace element for humans and others mammals, overdoses of Cr (VI) compounds are considered highly toxic (Anjum and Shakoori, 1997). K2Cr2O7 is a hexavalent form of Cr and has been demonstrated to induce oxidative stress and is carcinogenic in nature (Bagchi et al., 1995). In various studies, it was suggested that reactive oxygen species (ROS) are involved in Cr (VI)-induced cell injury (Bagchi et al., 1995; O’Brien et al., 2001; Ueno et al., 1988). In general, Cr (VI) alone does not react with DNA in vitro or isolated nuclei (O’Brien et al., 2001). Within the cell, glutathione (GSH) rapidly forms a complex with Cr (VI), followed by a slow reduction of Cr (VI) to yield Cr (V) (O’Brien et al., 2001). In addition to GSH, a number of in vitro studies have confirmed that various other substances such as ascorbate, cysteine (Kasprzak, 2002; O’Brien et al., 2001), lipoic acid, NAD(P)H, fructose, and ribose (Liu and Shi, 2001), were capable of reducing Cr (VI). Cr (VI) reduction intermediates [Cr (V) and Cr (IV)] are very toxic as they involve ROS production (Liu and Shi, 2001). In this pathway, once formed Cr (V) can react via the Fenton reaction with H2O2, forming the hydroxyl radical (OH−) capable of causing DNA damage and tissue injury (Bagchi et al., 1997). In addition to the cellular damaging effect of the GS· radical, it can further react with other thiol molecules in oxygenated tissues to give the superoxide radical. Superoxide can further reduce Cr (VI)–Cr (V), which can then catalyze the decomposition of H2O2 thus creating more hydroxyl radicals. Cr (V) can also be reduced by cellular reductants (e.g., ascorbate, GSH) to Cr (IV), again participating in Fenton chemistry generating more hydroxyl radicals. In vivo experiments have shown that K2Cr2O7 exposition induces oxidative and nitrosative stress measured as protein carbonyl content and 3-nitrotyrosine (3-NT) immunostaining (Bagchi et al., 1997). In the current study, a similar mechanism of Cr (VI) oxidative stress-mediated hepatotoxicity may apply as administration of K2Cr2O7 caused a significant increase in MDA level and a significant decrease in the GSH level and SOD activity as markers of oxidative stress and lipid layers are destroyed. This was confirmed by the damaged liver architecture in the histopathological findings. The histopathological changes in a liver treated with K2Cr2O7 may be due to the formation of highly reactive radicals and subsequent lipid peroxidation induced by K2Cr2O7 (Bagchi et al., 1997). The accumulated hydroperoxidase can cause cytotoxicity, which is associated with the peroxidation of membrane phospholipids by lipid hydroperoxidase, the basis of hepatocellular damage. These findings are in agreement with other studies, which reported that mice treated with cadmium, mercury, showed significant decreases in liver GSH levels due to decreased antioxidant enzymes, where oxidative stress in animal tissues may cause oxidative catabolic effects leading to elevated lipid peroxidation in tissues accompanied with depletion tissue GSH (Eybl et al., 2006; Fang et al., 2002). In addition, in line with the finding of this study, Ercal et al. (2001) reported enhancement of lipid peroxidation in rat livers after heavy metal poisoning with mercury, molybdenum, copper, Cr, and manganese. Moreover, Bagchi et al. (2002) showed that chromium (VI) induces increase in hepatic mitochondrial and microsomal lipid peroxidation. In the current study, the total protein, glycogen, and DNA content underwent a significant depletion in the liver tissue of K2Cr2O7-treated rats demonstrating the toxic effect of Cr (VI). Inside the cell, Cr (VI) causes a wide variety of DNA lesions, including Cr–DNA adducts, DNA–protein crosslinks, DNA–DNA crosslinks, and direct oxidative stress-mediated DNA damage (O’Brien et al., 2001). Cr-induced DNA damage found in this study is in agreement with other studies (Ueno et al., 2001; Permenter et al., 2011). The decrease in total protein and glycogen concentration may result due to oxygen free radical generated by Cr (VI), which oxidizes proteins and lipoproteins and impairs liver structure and metabolism (Guzik et al., 2000). The reduction in total protein in animals exposed to environmental pollutants could be attributed to changes in protein and free amino acid metabolism, such as reduced protein synthesis or increased proteolytic activity or degradation (Yousef et al., 2008). In addition, decreased protein and glycogen content in response to K2Cr2O7 administration may be contributed to the harmful effect of its active metabolite. From the histopathological findings, it is clear that K2Cr2O7 could decrease total hepatic protein and glycogen content mainly through its toxic effects on the liver, either through the necrotic changes, especially of the plasma membrane, or through inhibiting the oxidative phosphorylation process and hence the availability of the energy source for protein synthesis and other metabolic processes was reported as in previous studies (Guler et al., 1994). Moreover, it was found that serum and hepatic protein of rats decreased due to the toxic effect of oxygen free radical on the thyroid and adrenal glands that leads to block of protein synthesis, while the fast breakdown occurs. This leads to an increase in free amino acids and a decrease in protein turnover (Guler et al., 1994).
Considering the adverse effect of Cr (VI) toxicity on the liver tissues, preventive intervention is of major concern. Previous studies have shown that antioxidants’ supplement could protect the liver tissues from oxidation and prevent DNA damage under various toxic conditions (Soudani et al., 2011). Among these chemical agents is vitamin E, which has drawn wide attention due to its reported hepatoprotective property against metal-induced toxicity. In this study, oral treatment of rats with vitamin E resulted in amelioration of oxidative stress parameters including TBARS levels, GSH content, and SOD activity. Furthermore, the architectures of the liver tissues were restored with significant improvements in total hepatic protein, glycogen, and DNA content. Such protective effects may be related to its antioxidant potential. Supporting this finding, Sodergren et al. (2001) concluded that both nonenzymatic and enzymatic lipid peroxidations during experimental hepatic oxidative injury were suppressed by dietary vitamin E supplementation in rats. In addition, the protective effect of vitamin E on Cr VI-induced cytotoxicity and lipid peroxidation in primary cultures of rat hepatocytes was investigated by Susa et al. (1996) where pretreatment of primary cultures of rat hepatocytes with a-tocopherol succinate for 20 h prior to exposure to K2Cr2O7 resulted in a marked decrease of Cr VI-induced cytotoxicity. Supporting the current study findings of the protective effect of vitamin E against Cr (VI)-induced hepatotoxicity, previous studies have shown a similar protective effect of vitamin E against many metal-induced hepatotoxicities such as copper, lead (Al-Attar, 2011; Osfor et al., 2010), aluminum chloride (Chinoy et al., 2004); cadmium chloride (Gaurav et al., 2010) and ferrous sulfate (Milchak and Douglas Bricker, 2002).
5 Conclusion
The results of this study suggest that oral vitamin E administration has a protective effect against Cr (VI)-induced hepatotoxicity.
References
- Vitamin E attenuates liver injury induced by exposure to lead, mercury, cadmium and copper in albino mice. Saudi J. Biol. Sci.. 2011;18:395-401.
- [Google Scholar]
- Sublethal effects of hexavalent chromium on the body growth rate and liver function enzymes of phenobarbitone-pretreated and promethazine-pretreated rabbits. J. Environ. Pathol. Toxicol. Oncol.. 1997;16:51-59.
- [Google Scholar]
- Chromium-induced excretion of urinary lipid metabolites, DNA damage, nitric oxide production, and generation of reactive oxygen species in Sprague-Dawley rats. Comp. Biochem. Physiol. C: Toxicol. Pharmacol.. 1995;110:177-187.
- [Google Scholar]
- Induction of oxidative stress by chronic administration of sodium dichromate [chromium VI] and cadmium chloride [cadmium II] to rats. Free Radical Biol. Med.. 1997;22:471-478.
- [Google Scholar]
- Cytotoxicity and oxidative mechanisms of different forms of chromium. Toxicology. 2002;180:5-22.
- [Google Scholar]
- Vitamin E supplementation modulates endotoxin-induced liver damage in a rat model. Am. J. Biomed. Sci.. 2010;2:51-62.
- [Google Scholar]
- Recovery from fluoride and aluminium induced free radical liver toxicity in mice. Fluoride. 2004;12:14-16.
- [Google Scholar]
- Carleton’s Histological Techniques. NY, USA: Oxford University Press; 1980.
- Toxic metals and oxidative stress part I: mechanisms involved in metal-induced oxidative damage. Curr. Top. Med. Chem.. 2001;1:529-539.
- [Google Scholar]
- Comparative study of natural antioxidants – curcumin, resveratrol and melatonin – in cadmium-induced oxidative damage in mice. Toxicology. 2006;225:150-156.
- [Google Scholar]
- Curcumin pretreatment prevents potassium dichromate-induced hepatotoxicity, oxidative stress, decreased respiratory complex I activity, and membrane permeability transition pore opening. Evid. Based Complement. Alternat. Med. 2013:1-19.
- [Google Scholar]
- Chronic cadmium toxicity in rats: treatment with combined administration of vitamins, amino acids, antioxidants and essential metals. J. Food Drug Anal.. 2010;18:464-470.
- [Google Scholar]
- Effect of copper on liver and bone metabolism in malnutrition. Turkish J. Pediatr.. 1994;36:205-213.
- [Google Scholar]
- Vascular superoxide production by NAD(P)H oxidase: association with endothelial dysfunction and clinical risk factors. Circ. Res.. 2000;86:E85-E90.
- [Google Scholar]
- Oxidative DNA and protein damage in metal-induced toxicity and carcinogenesis. Free Radical Biol. Med.. 2002;32:958-967.
- [Google Scholar]
- Nephrotoxic and hepatotoxic effects of chromium compounds in rats. Bull. Environ. Contam. Toxicol.. 1986;36:332-336.
- [Google Scholar]
- In vivo reduction of chromium (VI) and its related free radical generation. Mol. Cell. Biochem.. 2001;222:41-47.
- [Google Scholar]
- The effects of glutathione and vitamin E on iron toxicity in isolated rat hepatocytes. Toxicol. Lett.. 2002;126:169-177.
- [Google Scholar]
- The occurrence of superoxide anion in the reaction of reduced phenazine methosulfate and molecular oxygen. Biochem. Biophys. Res. Commun.. 1972;46:849-854.
- [Google Scholar]
- Effects of glutathione on chromium-induced DNA crosslinking and DNA polymerase arrest. Mol. Cell. Biochem.. 2001;222:173-182.
- [Google Scholar]
- Assay for lipid peroxides in animal tissues by thiobarbituric acid reaction. Anal. Biochem.. 1979;95:351-358.
- [Google Scholar]
- Effect of alpha lipoic acid and vitamin E on heavy metals intoxication in male albino rats. J. Am. Sci.. 2010;6:6-63.
- [Google Scholar]
- Oxidative stress, DNA damage, and antioxidant enzyme activity induced by hexavalent chromium in Sprague-Dawley rats. Environ. Toxicol.. 2009;24:66-73.
- [Google Scholar]
- Exposure to nickel, chromium, or cadmium causes distinct changes in the gene expression patterns of a rat liver derived cell line. PLoSOne. 2011;6 [Remark 7]
- [Google Scholar]
- Vitamin E reduces lipid peroxidation in experimental hepatotoxicity in rats. Eur. J. Nutr.. 2001;40:10-16.
- [Google Scholar]
- Effects of selenium on chromium (VI)-induced hepatotoxicity in adult rats. Exp. Toxicol. Pathol.. 2011;63:541-548.
- [Google Scholar]
- Role of physiological antioxidants in chromium(VI)-induced cellular injury. Free Radical Biol. Med.. 1992;12:397-407.
- [Google Scholar]
- Protective effect of vitamin E on chromium (VI)-induced cytotoxicity and lipid peroxidation in primary cultures of rat hepatocytes. Arch. Toxicol.. 1996;71:20-24.
- [Google Scholar]
- Effect of chromium on lipid peroxidation in isolated rat hepatocytes. Nihon Juigaku Zasshi∗∗. 1988;50:45-52.
- [Google Scholar]
- Detection of dichromate (VI)-induced DNA strand breaks and formation of paramagnetic chromium in multiple mouse organs. Toxicol. Appl. Pharmacol.. 2001;170:56-62.
- [Google Scholar]
- Nordihydroguaiaretic acid attenuates potassium dichromate-induced oxidative stress and nephrotoxicity. Food Chem. Toxicol.. 2008;46:1089-1096.
- [Google Scholar]
- Sodium arsenite induced biochemical perturbations in rats: ameliorating effect of curcumin. Food Chem. Toxicol.. 2008;46:3506-3511.
- [Google Scholar]


