Translate this page into:
Hydrochemical characterization and quality appraisal of groundwater from Pungar sub basin, Tamilnadu, India
*Corresponding author. Tel.: +91 413 2654424; fax: +91 413 2655008 moorthy_ks@yahoo.com (K. Srinivasamoorthy)
-
Received: ,
Accepted: ,
This article was originally published by Elsevier and was migrated to Scientific Scholar after the change of Publisher.
Peer review under responsibility of King Saud University.
Available online 16 August 2013

Abstract
The Pungar sub basin is located in the central part of South India. The geology is mainly composed of Archean crystalline metamorphic complexes. Increased population and intensive agricultural activity make it imperative to assess the quality of the groundwater system to ensure long-term sustainability of the resources. A total of 87 groundwater samples were collected from bore wells for two different seasons, viz., Pre monsoon and Post monsoon and analyzed for major cations and anions. Semi-arid climate, high evaporation rate and nutrient enrichment are the key features for EC enrichment. Higher and Cl− were observed in groundwater samples. The sources of Ca2+, Mg2+, Na+ and K+ are from silicate weathering process. The facies demarcation suggests base exchanged hardened water. Gibbs plot suggests chemical weathering of rock forming minerals along with evaporation. The plot of (Ca2+ + Mg2+) versus ( ) suggests both ion exchange and reverse exchange processes. The plot of ( ) versus TZ+ shows higher cations via silicate weathering, alkaline/saline soils and residence time. The disequilibrium index for carbonate minerals point out influence of evaporation and silicate minerals favor incongruent dissolution. Mineral stability diagrams signify groundwater equilibrium with Kaolinite, Muscovite and Chlorite minerals. Comparison of groundwater quality with drinking standards and irrigation suitability standards proves that majority of water samples are suitable for drinking purpose. In general, water chemistry is guided by complex weathering process, ion exchange and influence of agricultural and sewage impact.
Keywords
Hydrogeochemistry
Ion exchange
Thermodynamics
Irrigation utility
Pungar
1 Introduction
During the past two decades, the water level in several parts of India has been falling rapidly due to an increase in extraction (Gupta and Deshpande, 2004). The number of wells drilled for irrigation for both food and cash crops have rapidly and indiscriminately increased. India’s rapidly rising population and changing lifestyles have also increased the domestic, agricultural and industrial need for water. Groundwater is an integral part of the environment, and hence cannot be looked upon in isolation. There has been a lack of adequate attention to water conservation, efficiency in water use, water re-use, groundwater recharge and ecosystem sustainability. Groundwater catastrophe is controlled by both natural and human actions. The World Health Organization (WHO) has discriminated the major factor influencing the greater population is/as lack of access to clean drinking water (Nash and McCall, 1995). Poor quality of water adversely affects the human health, and plant growth (Hem, 1991, 1985; Karanth, 1997). The quality of water is vital owing to its suitability for various purposes since it is directly linked with human welfare. Groundwater quality variation is a function of physical and chemical patterns in an area influenced by geological and anthropogenic activities (Subramani et al., 2005). Groundwater quality gets altered when it moves along its flow path from recharge to discharge areas through the processes like: evaporation, transpiration, selective uptake by vegetation, oxidation/reduction, cation exchange, dissociation of minerals, precipitation of secondary minerals, mixing of waters, leaching of fertilizers, manure and biological process (Appelo and Postma, 1993). The knowledge of hydrochemistry is essential to determine the origin of chemical composition of groundwater (Zaporozec, 1972). Importance of hydrochemistry of groundwater has led to a number of detailed studies on groundwater quality deterioration and geochemical evolution of groundwater in many parts of the globe (Anku et al., 2009; Gupta et al., 2008; Jayasena et al., 2008; Irfan and Said, 2008; Kumar et al., 2009; Kannan and Joseph, 2009; Zhang et al., 2011; Jalali, 2006, 2007; Prasanna et al., 2011; Tyagi et al., 2009; Srinivasa Gowd, 2005; Srinivasamoorthy et al., 2010; Vasanthavigar et al., 2012; Wen et al., 2005; Zuhair, 2006; Zhu et al., 2008).
The Pungar sub basin, located in one of the drought-prone districts of Southern India with meager and erratic rainfall though forms a part of the Cauvery basin, due to hard crystalline geological formations, the scenario of the groundwater regime is gloomy. The frequent failure of monsoon and increasing urbanization and agricultural practices have added to the problem for the requirement of sufficient quantum of good-quality water. Increased knowledge of geochemical processes regulating the groundwater chemical composition will lead to understand the hydrochemical systems for effective management and utilization of the groundwater resource by clarifying relations among groundwater quality and quantifying any future quality changes. So far, the geochemistry of groundwater and its suitability to drinking and agricultural rationale have not been endeavored in the present study area in great aspect; hence an effort has been made in here to exemplify water/rock interaction and anthropogenic influences on groundwater chemistry.
2 Study area
The study area, Pungar sub basin is located in NE part of Karur district, Tamilnadu, India (Fig. 1). The river Pungar rises in the southern flank of Thoppaiswamimalai located south of Karur district at the altitude of 930 m. The river course is 43.94 km long toward south east and south from Karur and joins river Cauvery at Mayanur village toward North of Karur. The study area lies between 10° 35’and 10° 56’ north latitude and 78° 07’ and 78° 23’ east longitudes covering an area of 361.9 sq.km. The climate of the sub basin is hot and semi arid and receives rain under the influence of both southwest (June–September) and northeast (October–December) monsoons. Normal annual rainfall varies from about 620 mm to 745 mm (Gopinath, 2011). The mean minimum and maximum temperature ranges from 18.7 °C to 38.56 °C. The most important economic activity is agriculture, with the chief crops raised being paddy, maize and millets. Pulses, oil seeds, bananas, citrus fruits, mangoes and grapes are also cultivated.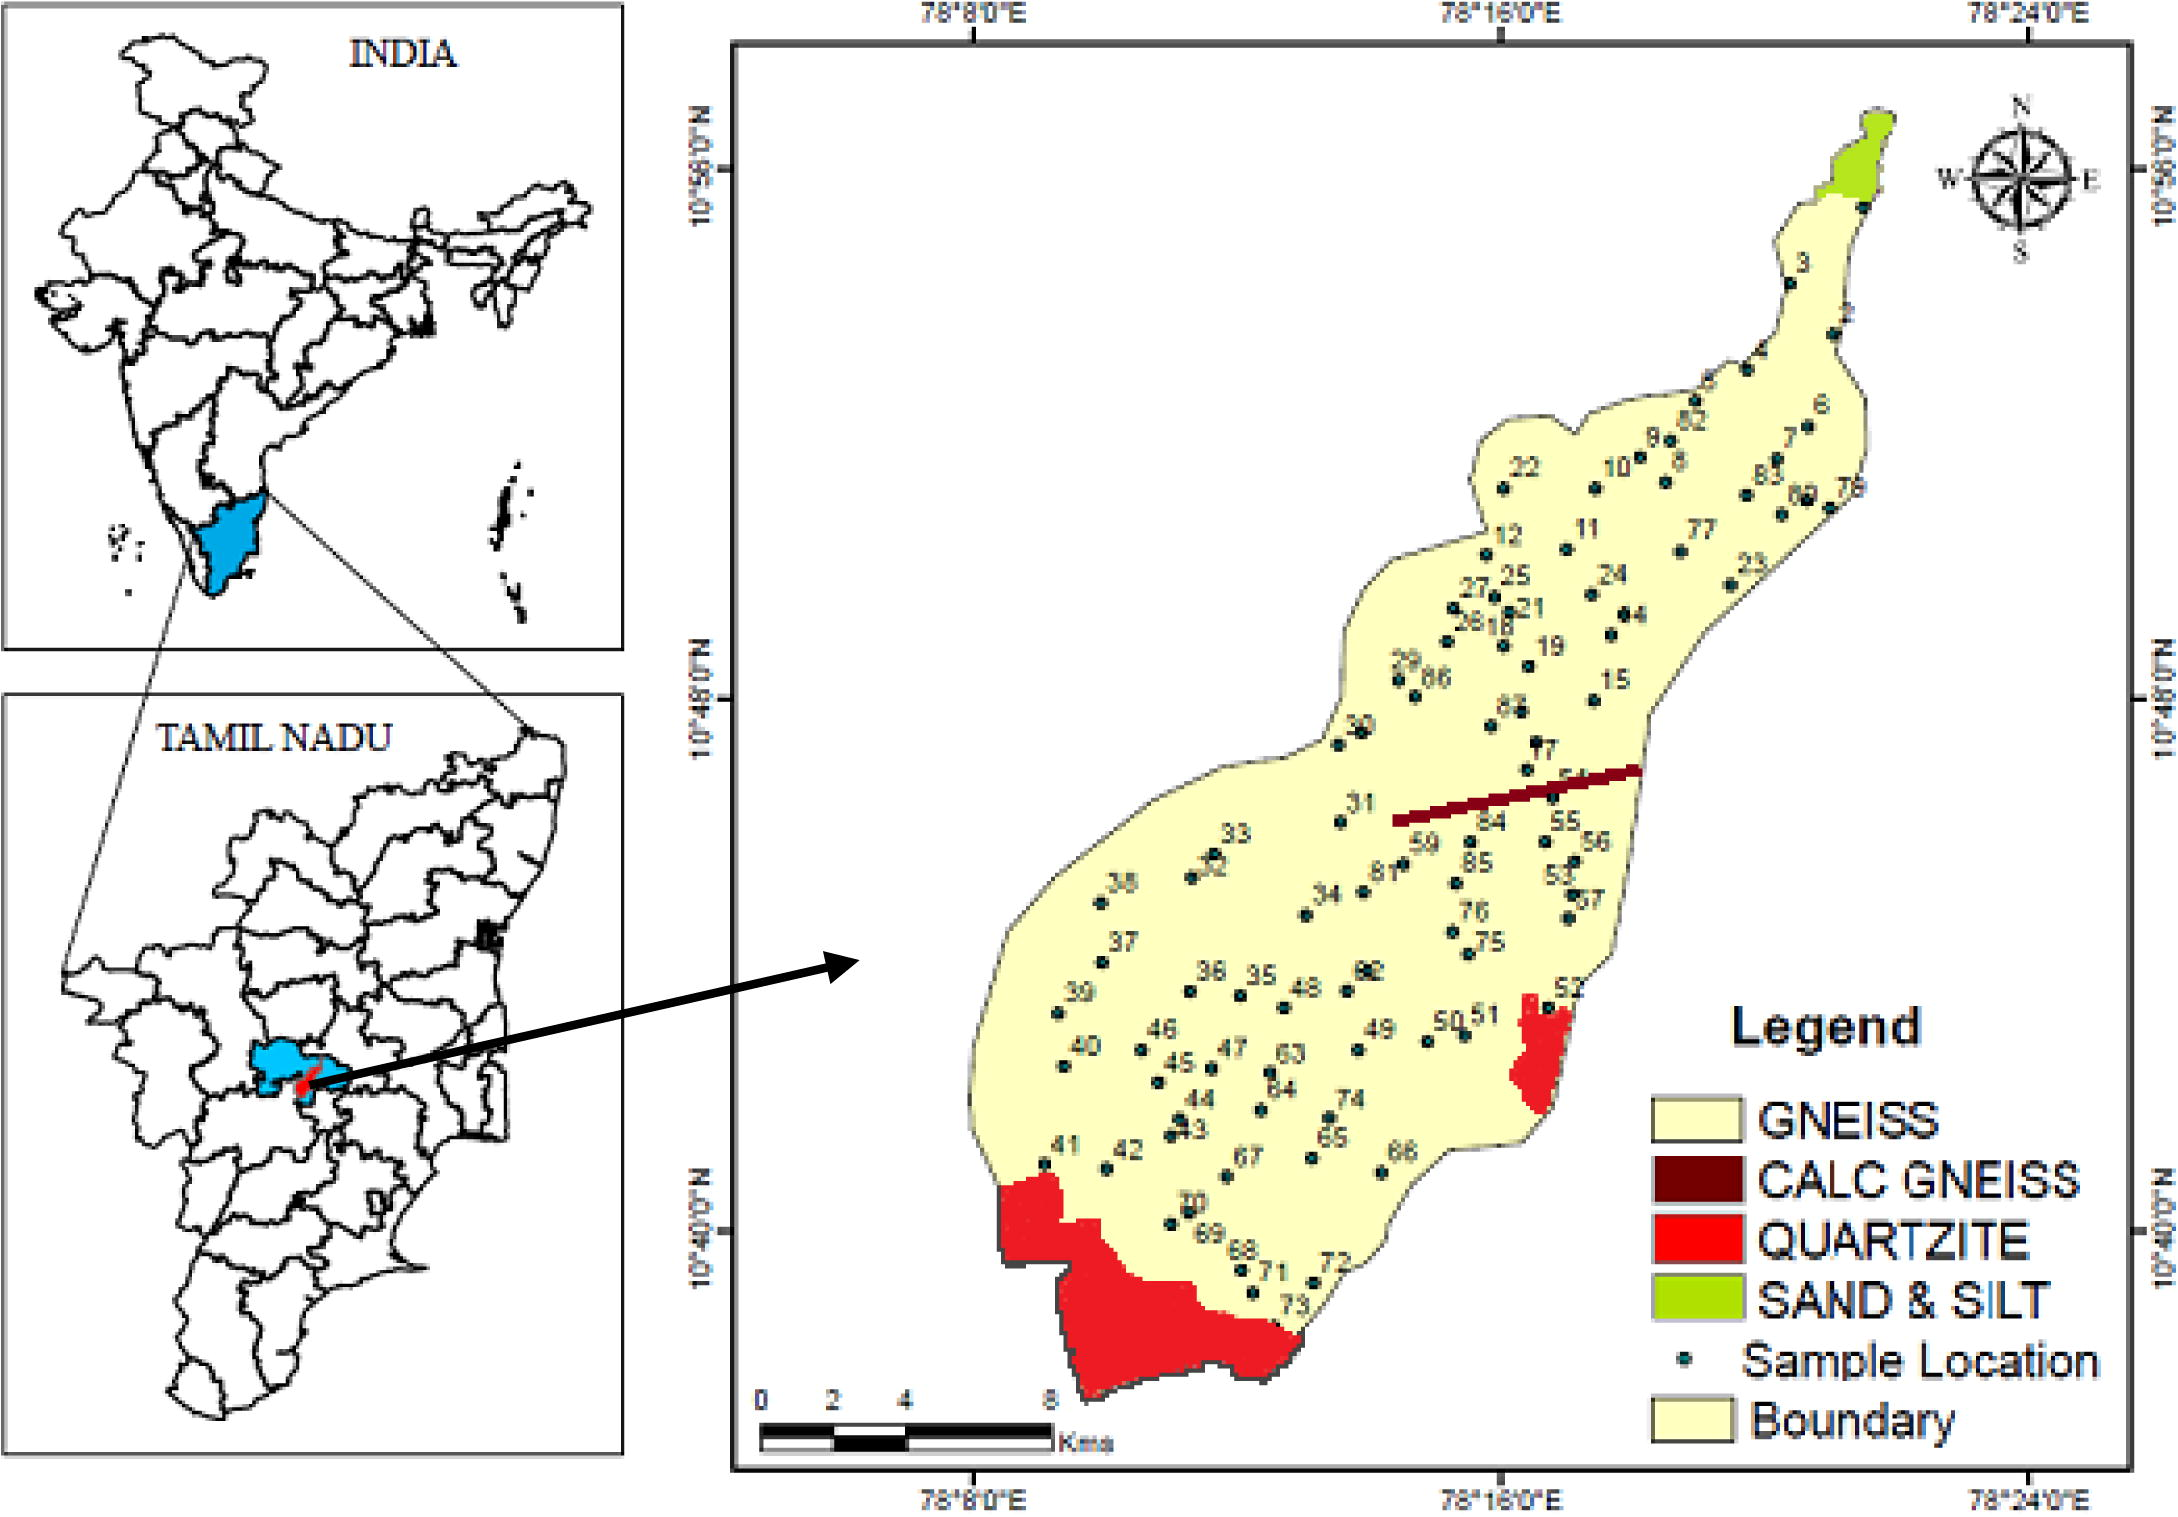
Location, Geology and groundwater sample locations of study area.
2.1 Geology and geomorphology
The study area being a hard rock terrain is geologically composed of rocks belonging to Archean, proterozoic, quaternary and recent (Fig. 1). The major rock type of the study area is peninsular gneiss followed by quartzite, calc gneiss, sand and silt deposits. Crystalline limestone, sillimanite quartzite, ferrugenous quartzite, calc gneiss and amphibolites occur as bands and lenses intervening gneisses. Drainage is sub dendritic in nature. Structural hills are restricted to the catchment part due south. Pediments are evenly distributed along the river courses and moderately buried pediments are noted below the structural hills. Majority of the study area is confined by shallow buried pediplains.
2.2 Hydrogeology
Groundwater condition in an aquifer depends on amount, duration, intensity of precipitation, depth of weathering, specific yield and general slope of formation toward drainage channels. Groundwater occurs in the weathered presidium under unconfined conditions as well as in the fractured rocks under semi confined conditions. The thickness of weathered layer irrespective of rock type ranges from 2.2 m to 50 m (Gopinath, 2011). Permeability values vary from 0.1 m/day to 50 m/day with maximum values noted near the surface water bodies, and in wells drilled in highly weathered formations. Transmissivity values range from 10.2 m2/day–524.8 m2/day. The specific capacity of the aquifers ranged from 0.50 liters per second (LPS) to 14.00 LPS. The piezometric head varied between 3.53 m and 5.34 m Below Ground Level (BGL) (May 2006) during Pre monsoon and 2.04–7.59 m BGL during post monsoon seasons. During the year 2006, higher fluctuations are noted in topographically elevated areas due south and middle stretches of the study area and along the areas of maximum urbanization and dominant agricultural activities. The fluctuation is lower along the river beds of cauvery. Development of groundwater is through open shallow wells (50–100 m BGL depth) and deep bore wells (200 m depth) (Gopinath, 2011).
3 Materials and methods
Groundwater samples were collected for two different seasons representing (August 2010–pre monsoon/PRM and January, 2011–post monsoon/POM) to broadly cover the seasonal variations. A total of 174 (87 samples per season) groundwater samples (Fig. 1) were collected in one liter acid washed, well rinsed low density polyethylene bottles with inside stopper from bore wells and analyzed for chemical parameters using the standard guidelines (APHA, 1995). The samples were collected after pumping the wells for 15–20 min and by subsequent filtering through 0.45 μm membranes. The analyzed parameters include the activity of hydrogen ion concentration (pH), electrical conductivity (EC), turbidity, total hardness (TH), total dissolved solids (TDS) and important cations like Calcium (Ca2+), magnesium (Mg2+), sodium (Na+), potassium (K+) and anions like bicarbonate ( ), Chloride (Cl−), Nitrate ( ), Phosphate ( ), Sulfate ( ) and Fluoride (F−). The pH and electrical conductivity (EC) were measured using pH and EC meters. Calcium (Ca2+) and magnesium (Mg2+) were determined titrimetrically using standard EDTA. Chloride (Cl−) was analyzed by standard titration, bicarbonate ( ) by titration with HCl, sodium (Na+) and potassium (K+) measured by flame photometry, sulfate ( ) by systronics spectrophotometer, phosphate by ascorbic acid method. Nitrate and fluoride by Consort C933 electro chemical analyzer. The dissolved silica was determined by the molybdo-silicate method. Total dissolved solids (TDS) were measured by evaporation and calculation methods (Hem, 1991). Quality control of analytical data was undertaken by routinely analyzing blanks, duplicates, and standards and by checking ion balances. The ionic charge balance error was within 5%.
4 Results and discussion
The chemical compositions of the groundwater samples were statistically analyzed, and the results are given in Table 1. Concentrations of important chemical constituents are presented in box and whisker plots (Fig. 2). Wide ranges and great standard deviations occur for most parameters, indicating chemical composition of groundwater affected by processes, including water- rock interaction and anthropogenic influences. Groundwater during PRM is subjugated by Mg2+, Na+, Ca2+, and
, Cl−, and
, which account for 96% of total cations and anions respectively. The concentrations of Mg2+, Na+, Ca2+, and K+ (based on mg l−1) correspond to on an average of 32.6%, 29.2%, 27.4% and 10.6%. The order of anion loads is
, Cl−,
,
,
and F− contributes on average (mg l−1) of 60.09%, 32.03%, 4.9%, 4.4%, 2.4%, and 0.02%. Groundwater during POM is dominated by Ca2+, Mg2+, Na+, K+ and
,
, Cl− and F− which accounts 97% of total cations and anions. The concentration of cations like Ca2+, Mg2+, Na+ and K+ recorded with averages of 48.2%, 23.2%, 22.4% and 5.9%. The order of anion profusion is
, Cl−,
,
,
and F− with contributing averages 47.6%, 6.4%, 44.4%, 13.2%, 0.02% and 0.13% respectively. Table 2 shows the range of ionic concentration in groundwater of the study area and prescribed specifications of WHO (1996) and ISI (1995). All values are in mg l−1 except pH, EC (μS cm−1) and SI. PRM Pre monsoon, POM Post monsoon, SI saturation Index.
Parameters
MIN
MAX
AVG
STD
MIN
MAX
AVG
STD
PRM
POM
Ca2+
11.99
256.00
109.14
48.34
0.62
304.00
144.60
51.29
Mg2+
21.00
945.60
102.09
120.30
0.39
169.20
70.28
30.55
Na+
34.00
342.00
121.46
44.06
8.00
191.00
67.41
47.33
K+
15.00
152.00
39.84
25.96
3.00
63.00
17.67
14.66
231.70
1183.40
612.30
170.75
15.20
671.00
345.39
112.21
0.01
38.00
5.32
8.16
0.11
0.56
0.21
0.13
Si
13.80
49.30
38.79
8.62
0.12
47.10
10.51
15.14
Cl−
70.89
992.60
326.39
218.92
102.00
987.00
321.75
173.12
0.01
126.80
24.48
26.91
6.20
15.00
9.60
1.87
2.03
345.00
50.10
57.42
10.10
133.00
46.36
29.90
F−
0.02
0.96
0.30
0.22
0.23
3.22
0.98
0.70
EC
860.00
5550.00
1505.16
1165.07
220.0
5660.00
1801.6
975.69
TDS
550.40
3552.00
938.29
745.64
435.00
3620.00
1104.97
540.77
pH
7.15
9.08
7.73
0.33
6.70
8.56
7.52
0.36
Silica SI
−3.64
−3.08
−3.21
0.12
−3.64
−3.08
−3.21
0.12
Chalcedony SI
−3.64
−3.08
−3.21
0.12
−3.64
−3.08
−3.21
0.12
Cristobalite SI
−3.64
−3.08
−3.21
0.12
−3.64
−3.08
−3.21
0.12
Log pCO2
−3.55
−1.44
−2.03
0.39
−3.27
−1.36
−2.06
0.38
Magnesite SI
−0.39
1.73
0.53
0.41
−0.72
1.12
0.05
0.41
Dolomite SI
−0.18
3.55
1.41
0.69
−1.10
2.86
0.68
0.80
Calcite SI
−0.17
1.79
0.87
0.37
−0.41
1.71
0.60
0.40
Aragonite SI
−0.31
1.65
0.72
0.37
−0.55
1.57
0.46
0.40
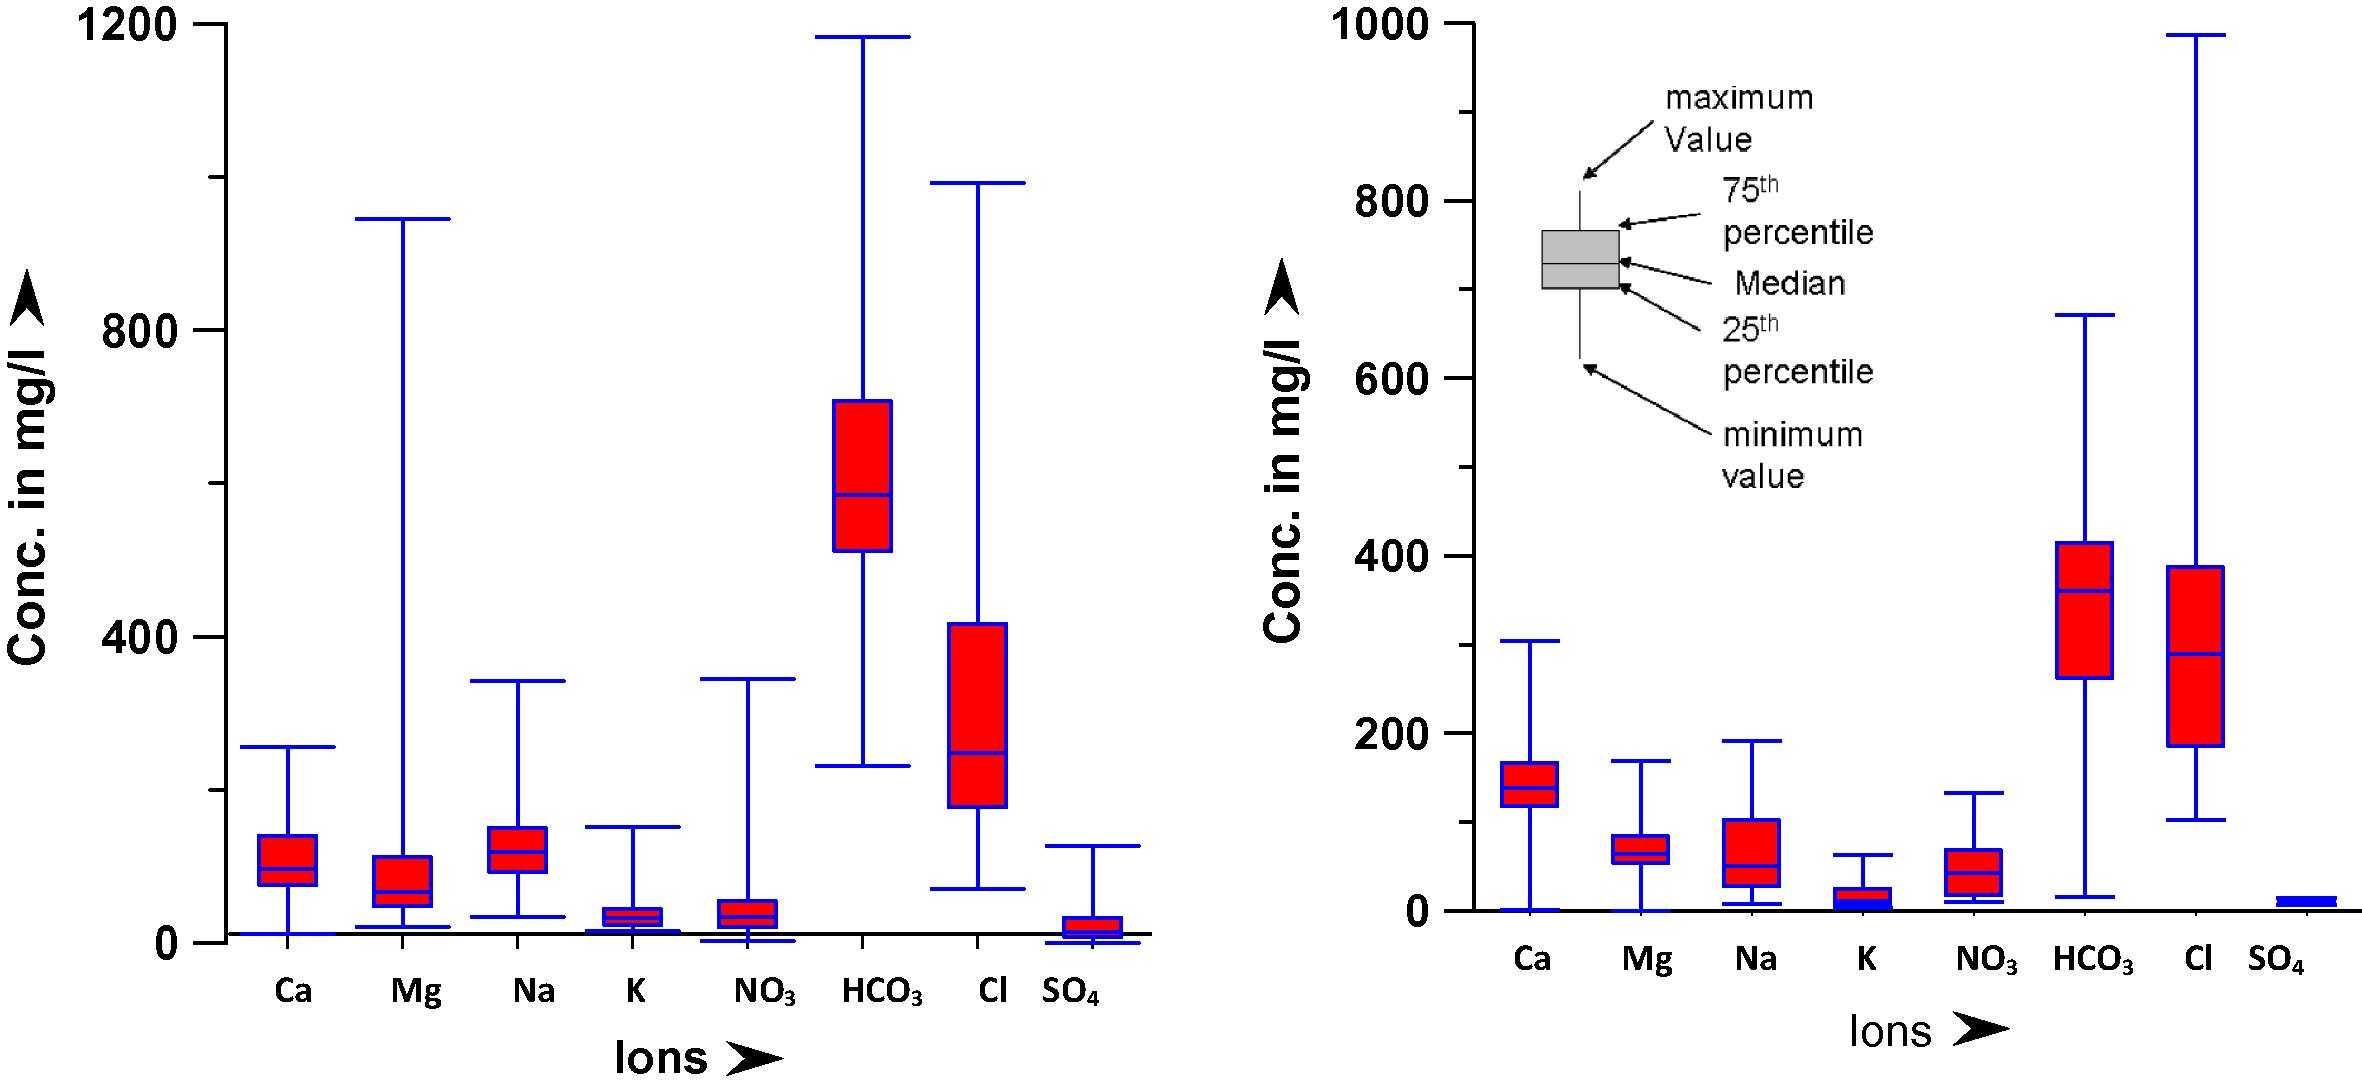
Box plot for the chemical constituents (a = PRM, b = POM).
Water quality parameters
WHO (2004)
ISI (1995)
% of Sample exceeding limita
PRM
POM
pH
6.5–8.0
6.5–9.5
13
6
EC
1,500
–
18
45
TDS
1,000
500
82
94
Ca2+
200
200
2
12
Mg2+
150
100
9
3
Na+
200
–
1
0
K+
30
–
51
20
300
600
97
63
Cl−
250
1000
49
60
250
400
0
0
50
45
29
39
F−
1.5
1.5
1
25
TH
100
150
100
100
The pH during PRM and POM ranges from 7.1 to 9.0 and 6.7 to 8.5 with an average of 7.7 and 7.5 respectively. Acidic values observed during POM may be due to the influx of rainwater of low alkalinity or influence of fertilizers in agricultures. Alkaline values were observed during PRM due to the leaching of dissolved constituents into the groundwater. The recommended values for irrigation water are from 6.5 to 8.4. Except two (Sample No.29 and 42) and three (41, 50 And 69) samples during PRM and POM, all others were within the range of irrigation water.
Electrical Conductivity has been used as a criterion for the classification of drinking and irrigation waters (Erguvanli and Yuzer, 1987). EC values during PRM and POM range from 860 μs/cm to 5550 μs/cm and 220 μs/cm to 5660 μs/cm with corresponding averages of 1505.1 μs/cm and 1801.6 μs/cm. According to WHO (1996) guidelines; the permissible limit of EC is 1400 μs/cm. Higher values (>1400 μs/cm) were noticed in 21% and 51% of the samples during PRM and POM seasons along central and northern parts of the study areas. Semi arid climate, high evaporation rate and nutrient enrichment may be responsible for the enrichment of EC.
The content of Calcium during PRM and POM ranges between 11.9–256.0 mg l−1 and 0.6 mg l−1–304.0 mg l−1. Higher concentration was noted during POM season. Magnesium during PRM and POM ranges between 21.00 mg l−1 and 945.6 mg l−1, 0.39 mg l−1 and 169.2 mg l−1. During infiltration or along the flow, groundwater may dissolve the CaCO3, and CaMg(CO3)2 present in the rocks by increasing calcium and magnesium ions in groundwater. The prolonged agricultural activities prevailing in the study area may also directly or indirectly influence mineral dissolution in groundwater (Bohlke, 2002).
Sodium values during PRM and POM range from 34.0–342.0 mg l−1 and 8.0–191.0 mg l−1. Higher concentrations are noted during PRM, may be due to contribution from silicate weathering process and dissolution of Clay, Gravel, Kanker and Feldspar (Na+ Plagioclase) and by agricultural sources. Potassium concentrations range from 15.0–152.0 mg l−1, 3.0–63.0 mg l−1 with mean value of 39.8 mg l−1 and 17.6 mg l−1 during both seasons. High potassium is confined to north, northeast, and southern parts of the study area. The source of potassium in groundwater is likely to be the weathering of K+ Feldspar and the application of synthetic fertilizers. Lower potassium in groundwater is due to its greater resistance to weathering and fixation in the form of clay minerals leading to nutrient loss (Kolahchi and Jalali, 2006).
Alkalinity of water is the measure of its capacity for neutralization. HCO3- ranges from 231.7 mg l−1 to 1183.4 mg l−1 during PRM and 15.2–671.0 mg l−1 during POM seasons. A higher concentration was noted during PRM season. Being the abundant anion in the groundwater its dissolution into the groundwater is mainly due to the dissolution of silicates and rock weathering. Contribution is also made by atmospheric CO2 and CO2 released from the organic decomposition in the soil (Subba Rao, 2002).
Chloride occurs naturally in all types of waters. Chloride ranges from 70.8–992.6 mg l−1, 102.0–987.0 mg l−1 with averages of 326.4 mg l−1 and 321.7 mg l−1 during PRM and POM seasons. Except 13% and 10% of samples, all others were within the prescribed limits of WHO (1996) (600 mg l−1). Sources of chloride in groundwater include rainwater, fertilizers and sewage water pollutants.
Phosphorous is also a component of complex synthetic fertilizers widely applied in agriculture. The in groundwater ranges between 0.01–38.0 mg l−1 and 0.1–0.5 mg l−1 with averages of 5.3 mg l−1 and 0.2 mg l−1, irrespective of seasons. A higher concentration (>5 mg l−1) is noted in 26% of samples during PRM season. An abnormal concentration (38.0 mg l−1) was noted in location No. 6 dominated by agricultural activities. During POM, all the samples recorded (<5 mg l−1) due to higher dissolved oxygen and aerobic conditions in aquifers, lower phosphate in groundwater (Elrashidi and Larsen, 1978).
Nitrate during PRM and POM varied from 2.0–345.0 mg l−1 and 10.1 mg l−1–133.3 mg l−1 with the average of 50.1 mg l−1 and 46.4 mg l−1 respectively. The highest nitrate (345.0 mg l−1) was observed during PRM and lowest (133.3 mg l−1) was noted during POM. In comparison with the WHO’s guideline (50 mg l−1) for , a total of twenty-five wells (28.4%) during PRM and thirty-four wells (38.6%) during POM are not recommended for drinking purposes (Table 2). Anomalously high (>100 mg l−1) observed during both the seasons are confined to irrigation wells located along the drainage courses, contacts of the lithologic units and in areas of higher agricultural activities. Since considerable amounts of synthetic fertilizers (225.6 kg/year) are applied during the farming seasons. The application of liquid fertilizer N-32% (N32) through fertilization is a common practice in the area, which contains 16% urea, 8% ammonium, and 8% nitrate.
Sulfate is unstable if it exceeds the maximum allowable limit of 400 mg l−1 by causing a laxative effect on the human system with the excess magnesium in groundwater. ranged from BDL to 126.8 mg l−1; 6.2 mg l−1 to 15.0 mg l−1 with averages of 24.5 mg l−1 and 9.6 mg l−1 irrespective of seasons. All the samples were within the permissible limit. The addition of sulfate to the groundwater is mainly due to the dissolution of filtering waters, leaching from fertilizers and municipal waste (Singh, 1994).
Silica in the groundwater ranges from 13.8–49.3 mg l−1, 0.1–47.1 mg l−1 with averages of 38.8 mg l−1 and 10.5 mg l−1 during PRM and POM seasons respectively. Higher silica was noted during PRM season. The existence of alkaline environment and silicate weathering from bedrock enhances the solubility of silica (Srinivasamoorthy et al., 2009).
4.1 Classification of groundwater
The term hydrochemical facies is a function of solution kinetics, rock-water interactions, geology and contamination sources used to describe the quantities of water that differ in their chemical composition. A convenient method to classify and compare water types based on ionic composition is proposed by Piper (1944) by plotting the chemical data on a trilinear diagram (Fig. 3). Four main types of water have been identified based on varying ionic concentrations: Ca2+–Mg2+–
; Ca2+–Mg2+–
–Cl−; Na+–
–Cl− and Na+–
. Majority of groundwater samples (79%) during PRM fall in the First Ca2+–Mg2+–
type of water which indicated sufficient recharge from fresh water and water with temporary hardness (Handa, 1979). Minor representations (10%) and (11%) are also noted in Ca2+–Mg2+–
–Cl− indicating water with permanent hardness and Na+–
type that deposits residual carbonate in irrigation use and causes foaming problems. During POM most of the samples (62%) fall in Ca2+–Mg2+–
type but 36% of samples represent Ca2+–Mg2+–
–Cl− type. One sample in each Na+–
and Na+–Cl− types were also noted. From the plot it is evident that there is a significant increase (26%) in the permanent hardness and fall in 10% of the samples representing temporary hardness during POM as compared to PRM samples. From the plot, alkaline earth metals (Ca2++ and Mg2+) exceed the alkalis (Na+ and K+) and weak acids (
and
) dominates strong acids (Cl− and
). Hence, alkaline earths dominate bicarbonate indicating exchange of Na+ ion with alkaline earths resulting in base exchanged hardened water (Subba Rao, 2002). These observations suggest the influence of monsoons in altering the quality of water.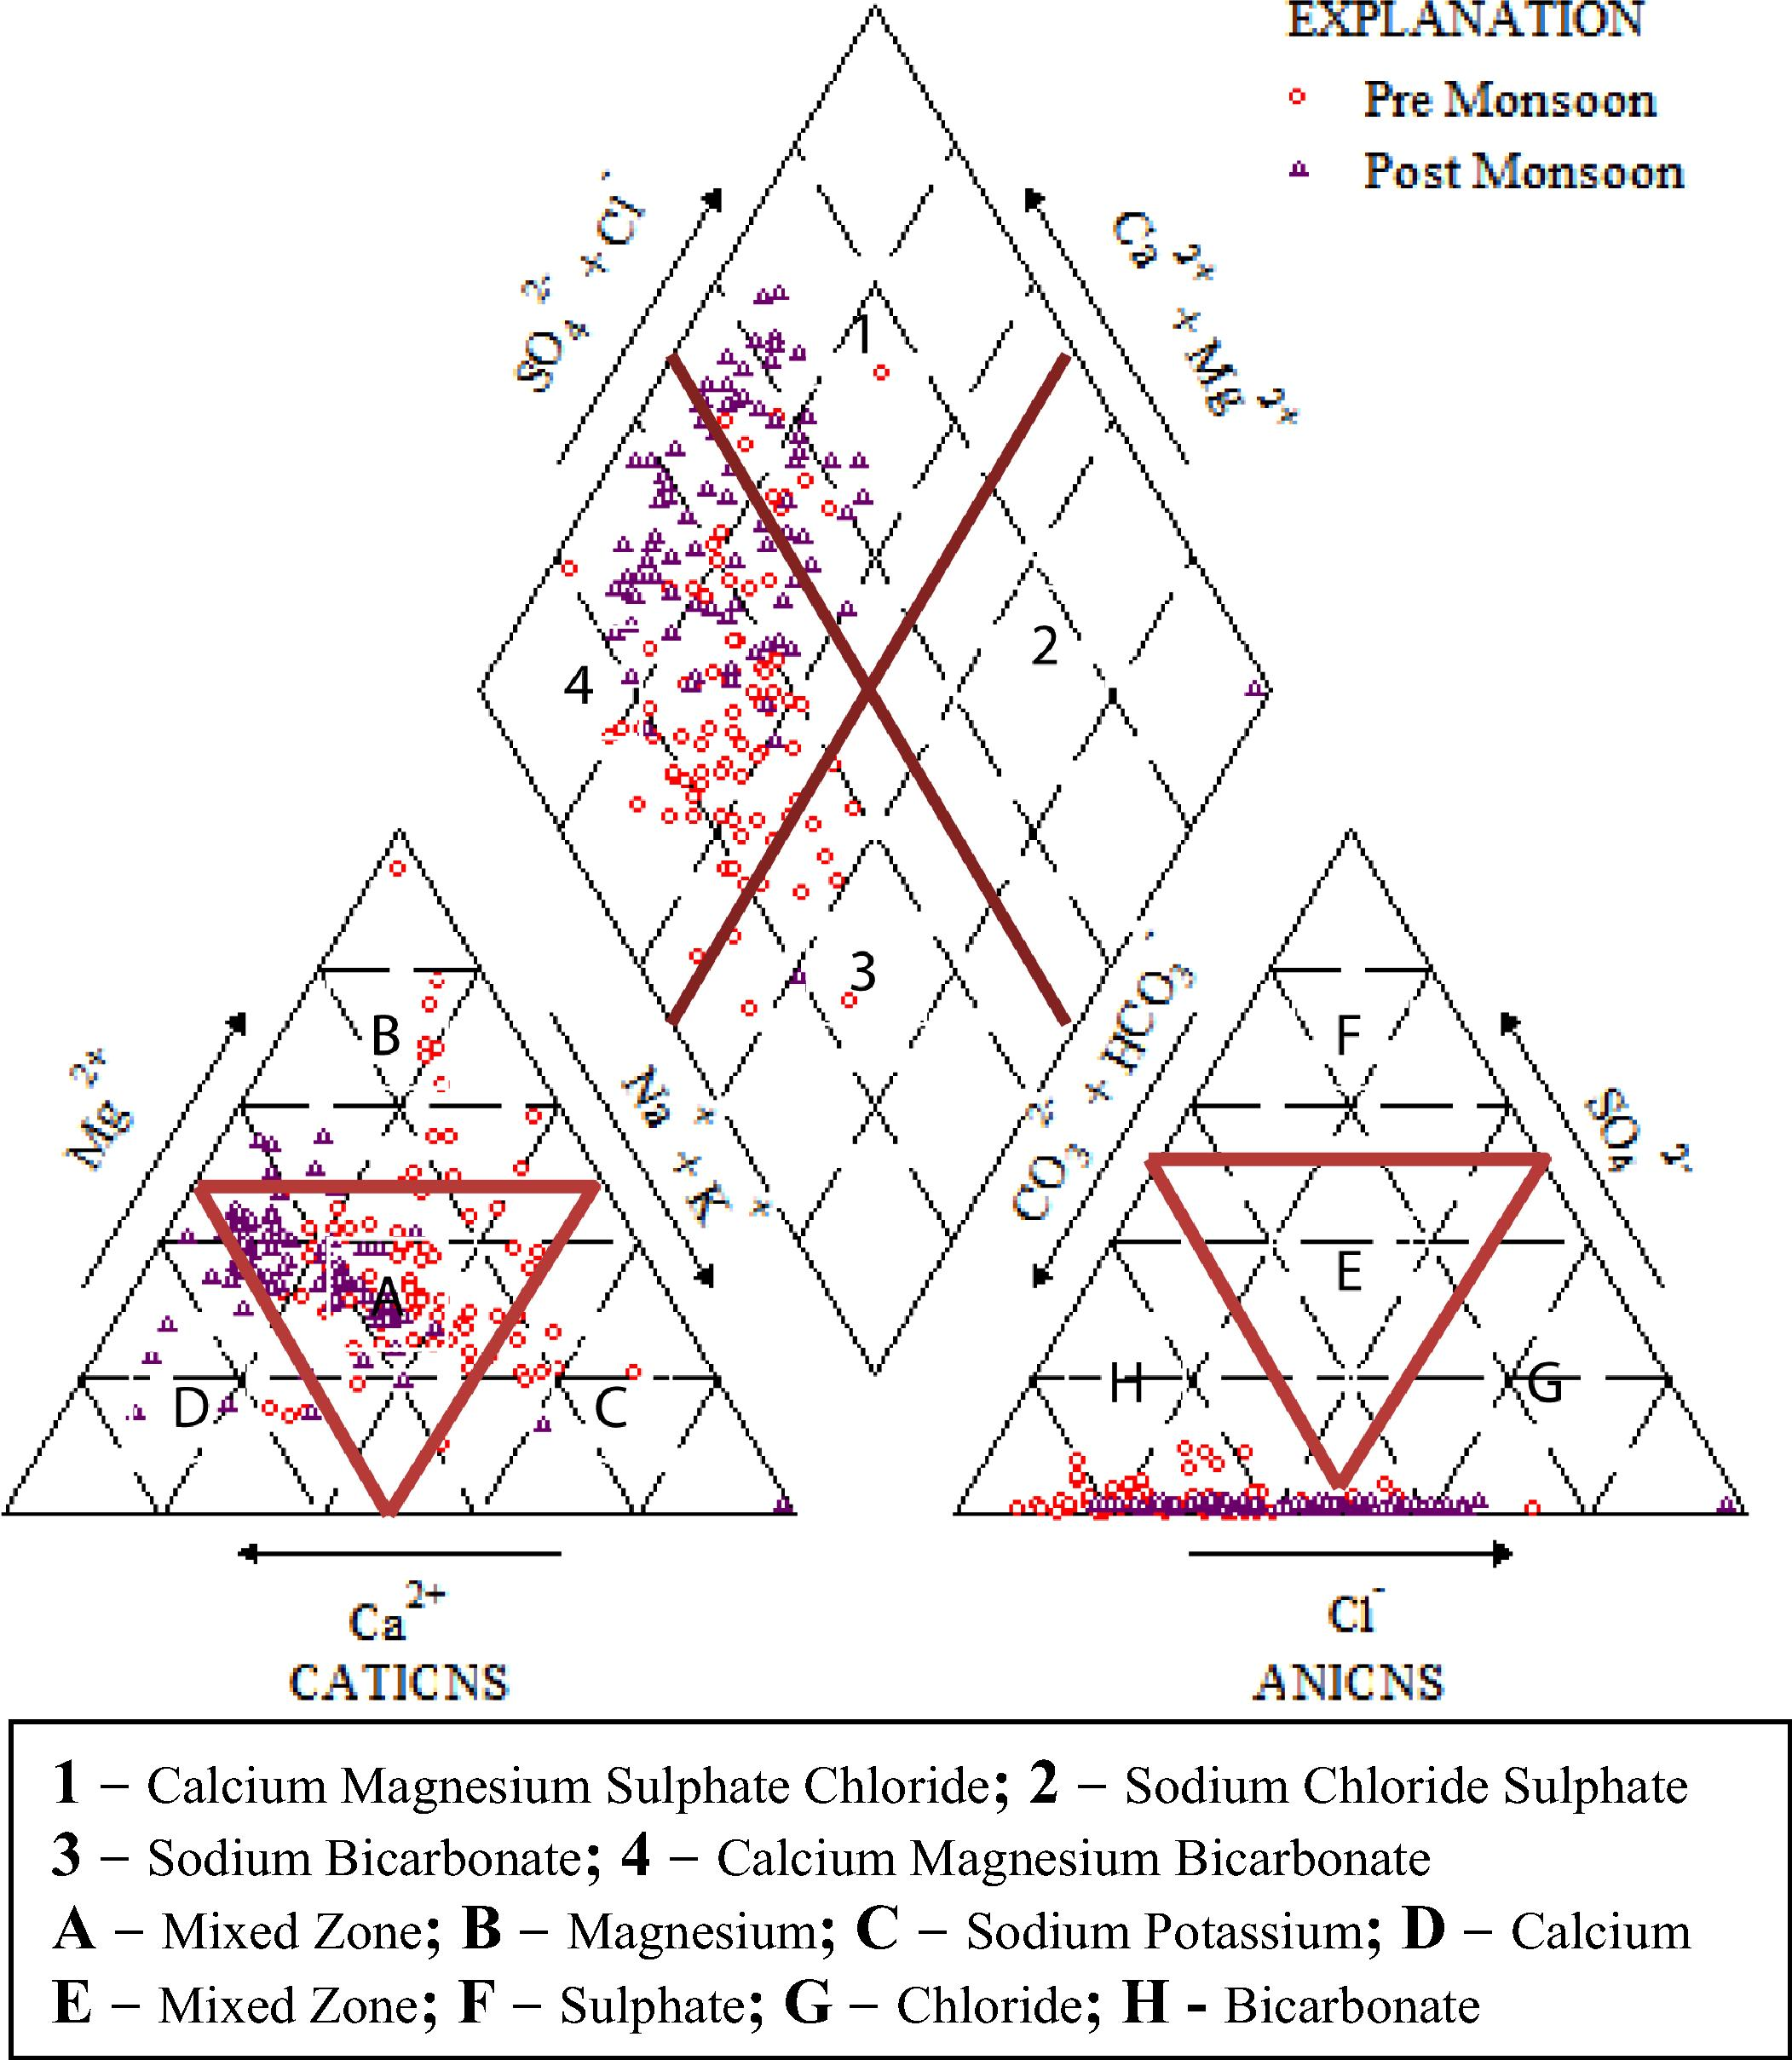
Piper diagram of the groundwater samples in the study area.
4.2 Identification of hydrogeochemical processes
Reactions between groundwater and aquifer minerals have a significant role on water quality, which are also useful to understand the genesis of groundwater (Cederstorm, 1946). The hydrogeochemical data are subjected to various conventional graphical plots to identify the hydrogeochemical processes operating in the aquifer region of study area. Some of the possible identified processes are explained below.
The ratio of Ca2+/Mg2+ has been used to determine the sources of calcium and magnesium ions into the groundwater environment (Maya and Loucks, 1995). If the Ca2+/Mg2+ ratio = 1, indicates dissolution of Dolomite and >2 reflects an effect of silicate minerals that contributes calcium and magnesium to the groundwater (Katz et al., 1998). Majority of samples (54%) during PRM season fall below 1 ratio line indicating precipitation of Ca2+ as CaCO3 which results in a decline of Ca2+ values or ion exchange process (Fig. 4a). A total of 39% of samples fall near and above the 1 ratio line indicating ion exchange with Na+ resulting in an increase of magnesium ions. A total of 7% of the samples lie above the ratio line 2, indicating the effect of silicate minerals. During POM 78% of samples fall near, and above the 1 ratio line and 14% of samples represent below 1 ratio line and less than 1% of sample represents above ratio line 2.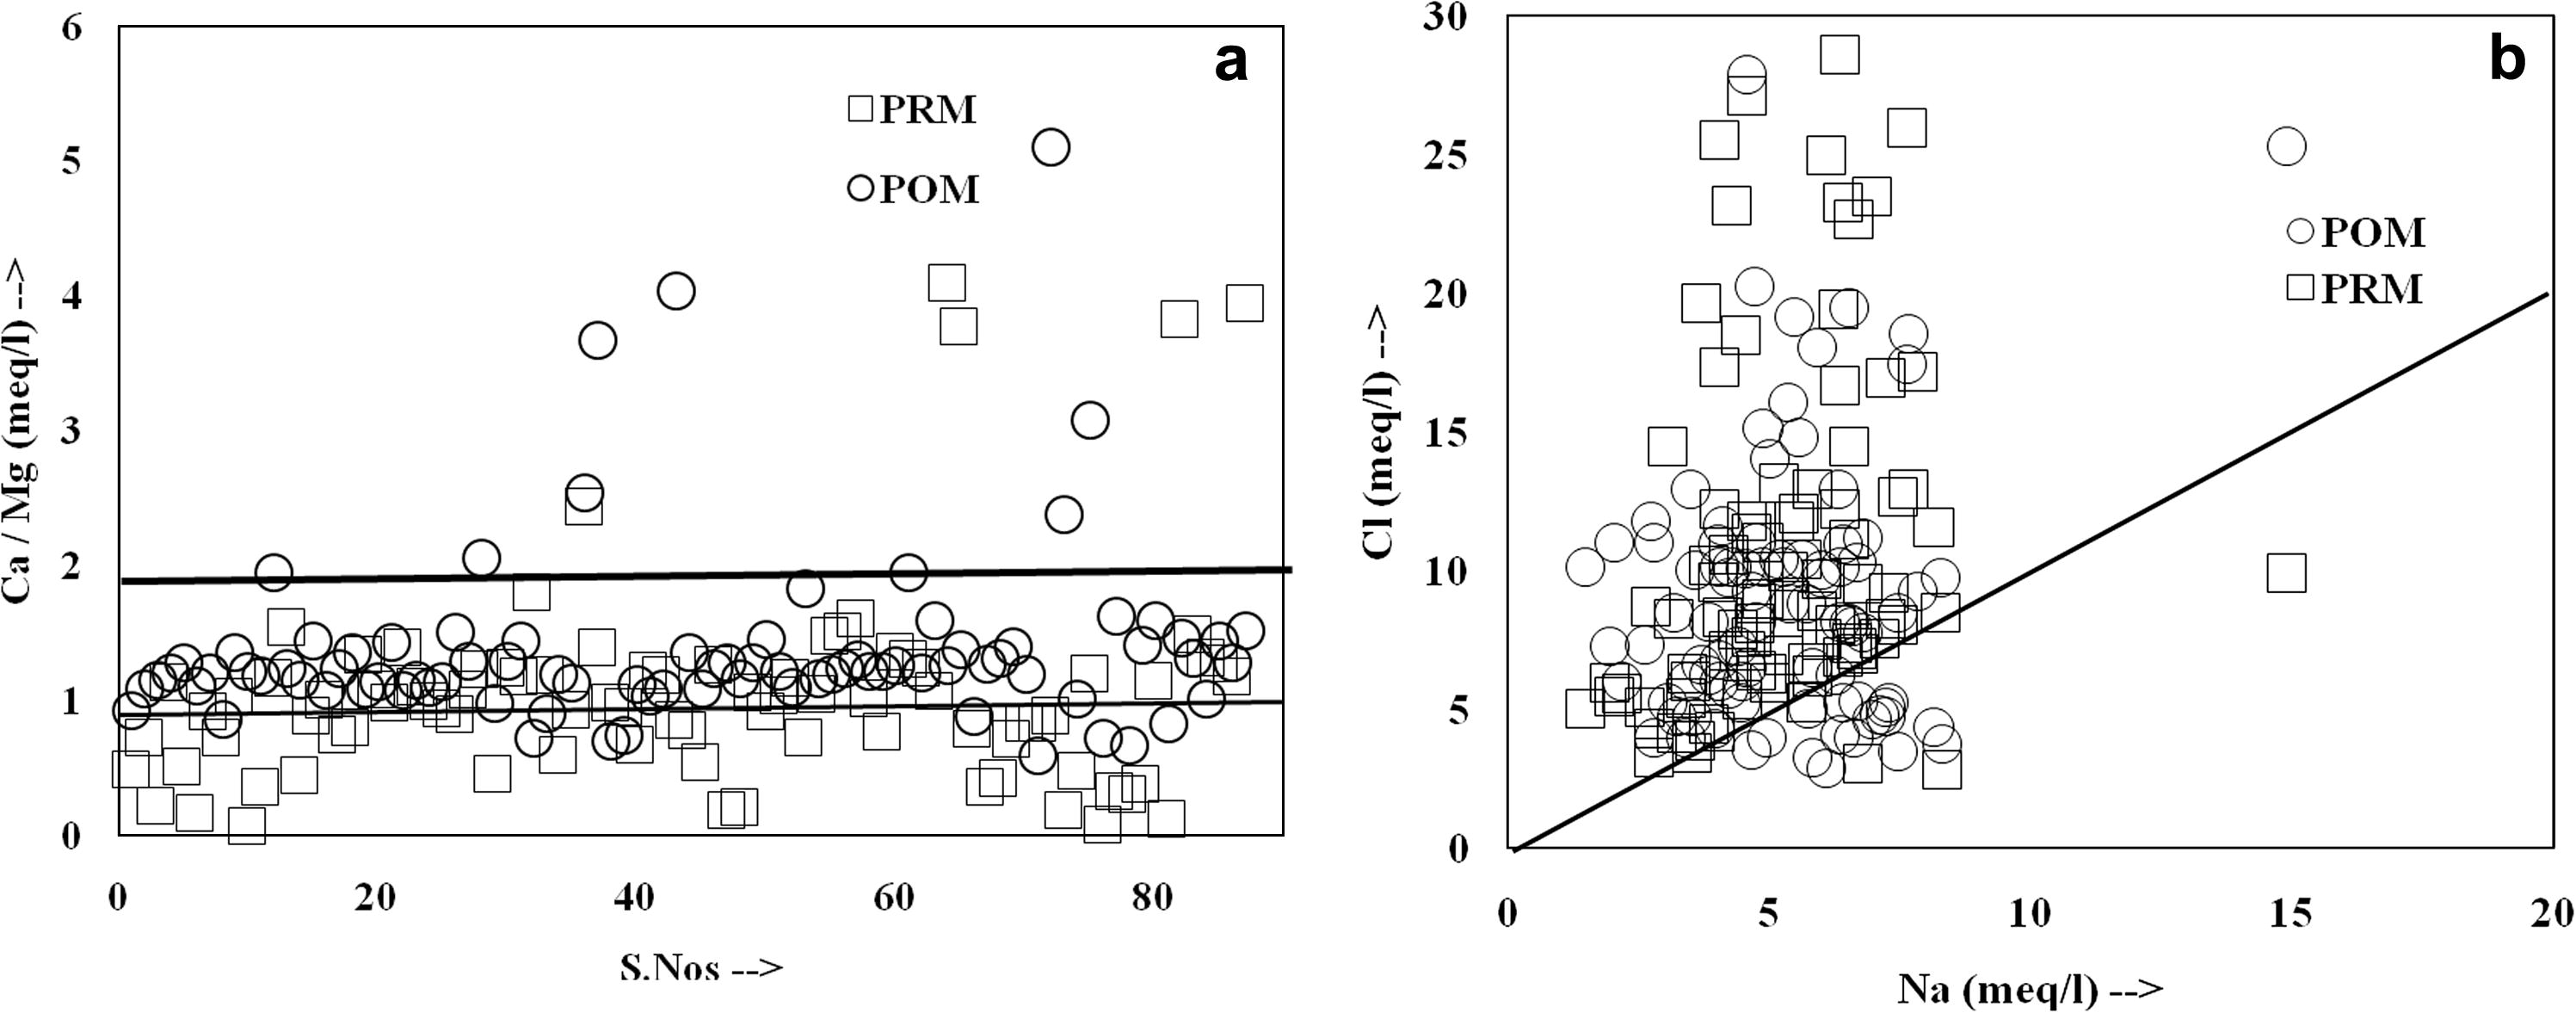
Major ion relationship: Scatter diagram of Ca2+/Mg2+ and Na+/Cl− molar ratio.
The ion exchange between the groundwater and its host environment during residence or travel process can be verified, using an index of Base Exchange (Schoeller, 1965, 1967) known as chloro-alkaline indices (CAI). When Na+ and K+ ions in water are exchanged with Mg2+ or Ca2+ ions in weathered materials, the index value will be positive indicating base exchange, whereas low salt waters give negative value indicating chloro-alkaline disequilibrium. This is also known as cation–anion exchange reaction. During this process, the host rocks are the primary sources of dissolved solids in the water (Adrian et al., 2007). The CAI during PRM point out 70% of samples favor Base Exchange hardened waters and 30% of samples designate Base Exchange softened waters. During POM all the samples favor Base Exchange hardened waters. Hence, irrespective of seasons majority of the collected water samples have higher alkaline earth than indicating base exchange- hardened water.
The Na+/Cl− ratio has been used to identify the sources of salinity in groundwater environment (Fig. 4b). A Na+/Cl− molar ratio greater than 1 reflects Na+ released from silicate weathering (Meybeck, 1987; Stallard and Edmond, 1983) due to rock water interaction via reaction: A total of 5% of samples during PRM and 17% of samples during POM reflect the above process. The remaining samples irrespective of season’s points lower Na+/Cl− ratio, due to the dominance of Cl− ions. Chloride ions are present in the groundwater as sodium chloride. Chloride content exceeding sodium may be due to the Base Exchange phenomena or due to pollution by anthropogenic activities (Jones et al., 1999). Being a granitic/gneiss terrain, possibility of chloride bearing minerals like Sodalite and Chlorapatite is negligible. Hence, chloride in groundwater is mostly due to Base Exchange of Na+ for Ca2+ and Mg2+ or due to agricultural return flow. Agricultural return flow water is characterized by higher ratios of SO42–/Cl− (>0.05) attributing to the application of gypsum fertilizers (Vengosh et al., 2002).
(Gibbs, 1970, 1971) recommended a simple plot of TDS versus the weight ratio of Na+/(Na+ + Ca2+) and Cl−/Cl− + HCO3− to differentiate the influences of rock-water interaction, evaporation and precipitation on water chemistry (Fig. 5). The data points suggest chemical weatherings of rock forming minerals and to some extent evaporation (during PRM) are dominant factors controlling the groundwater chemistry in the study area. Higher evaporation due to chemical weathering/anthropogenic activities increases the TDS and samples tend to move from rock dominance to evaporation zone (Subba Rao, 1998). This trend is prominent during PRM.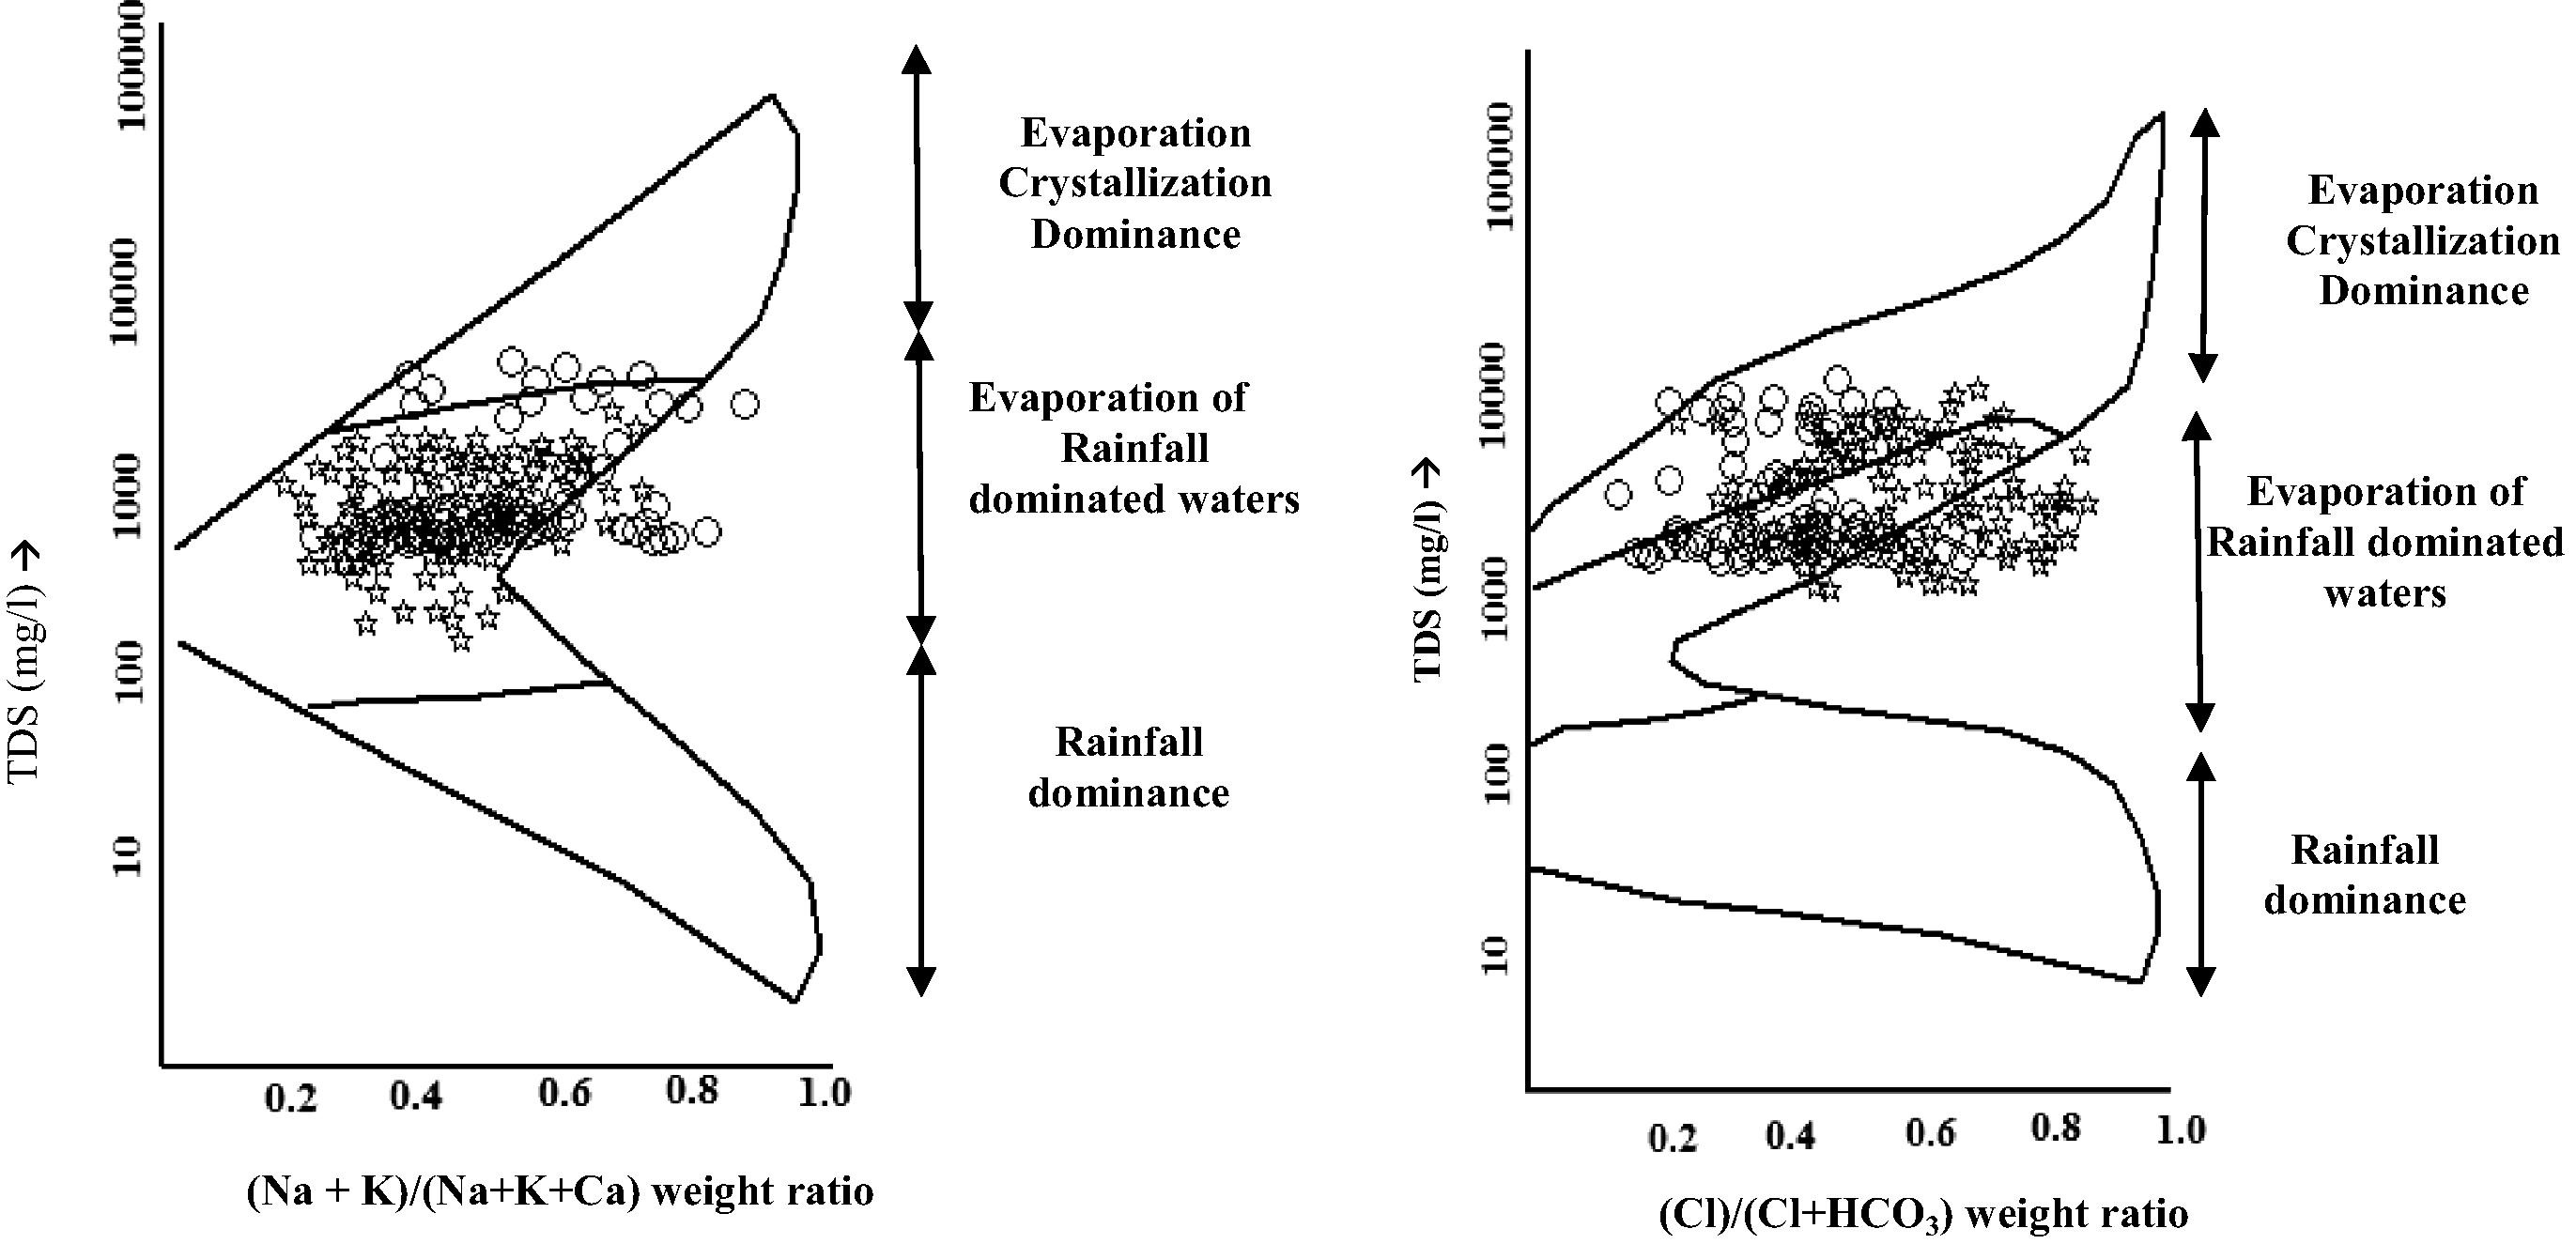
The weight ratio of Na+/(Na+ + Ca2+) and Cl−/Cl− +
.
The plot for Ca2+ + Mg2+ Vs
shows, majority of data plot (Fig. 6a) during PRM and POM fall above the equiline (1:1) suggesting an excess of alkaline earth elements (Ca2+ + Mg2+) over
reflecting extra sources of Ca2+ and Mg2+ ions balanced by Cl− and
and/or supplied by silicate weathering (Zhang et al., 1995). Minor representations irrespective of seasons are also noted below equiline suggesting the reaction of the feldspar minerals with carbonic acid in the presence of water, which releases
(Elango et al., 2003).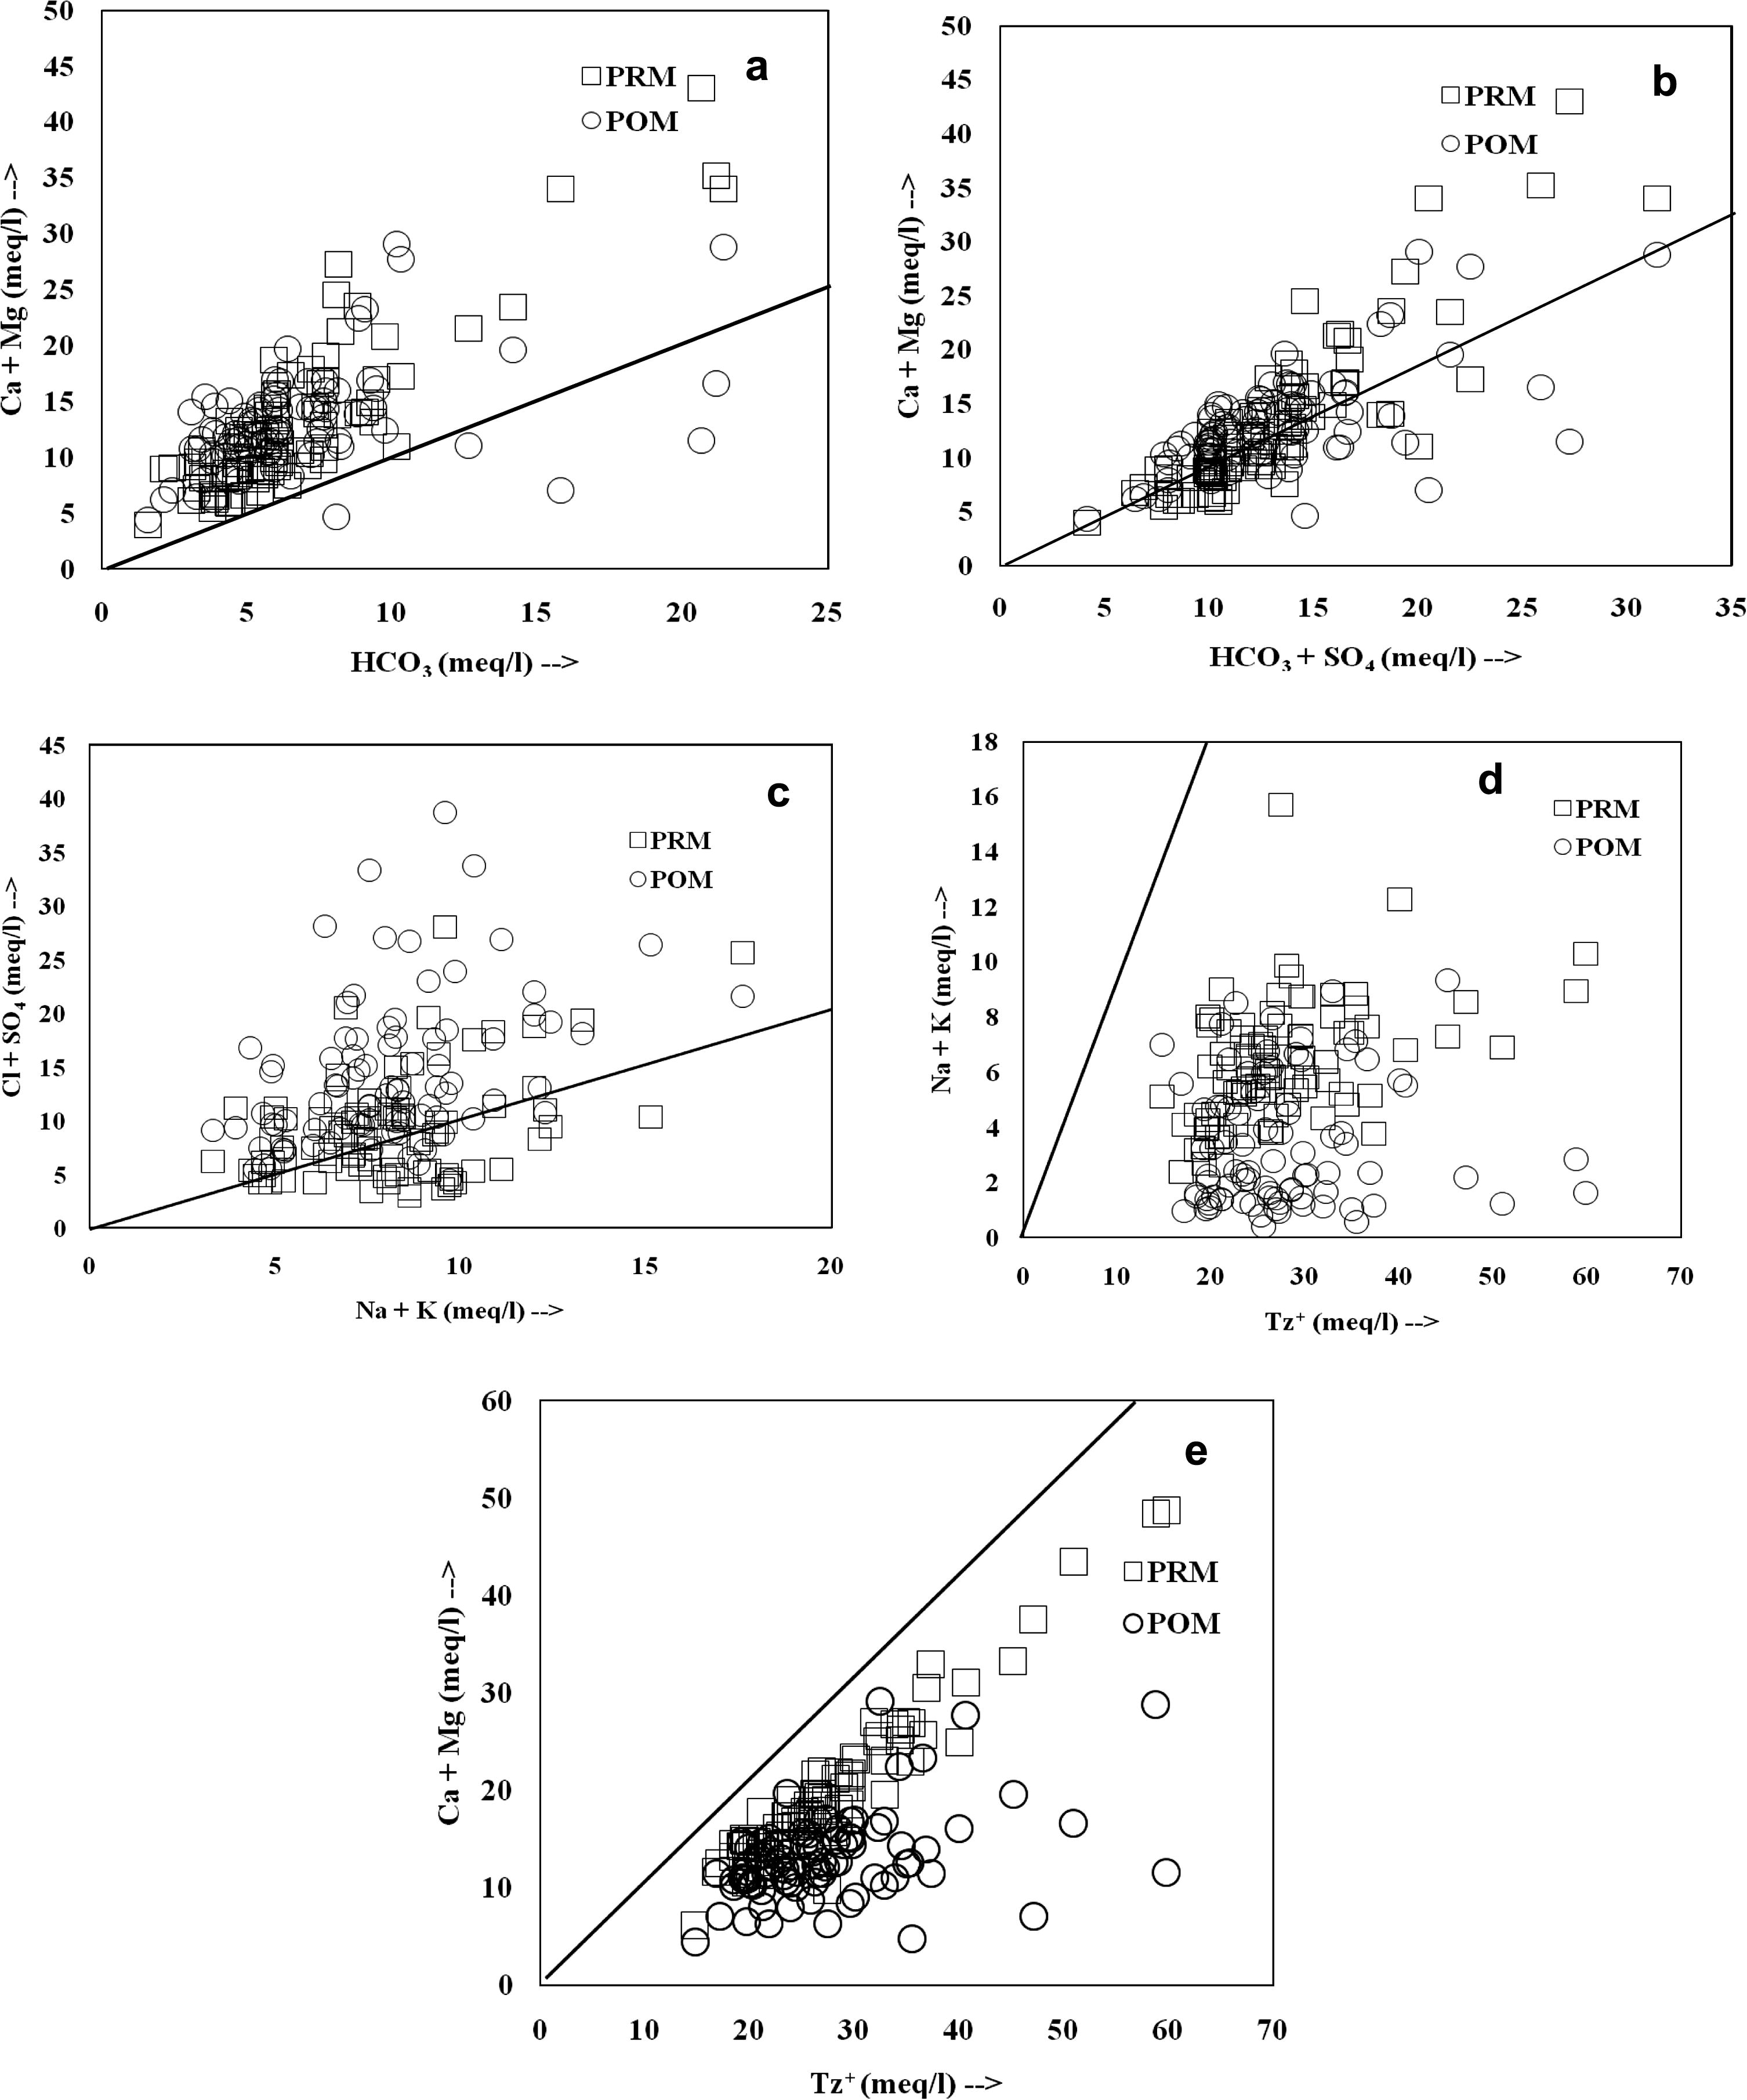
The ionic ratio plots for plot (a) Ca2++ Mg2+ Vs
, (b) Ca2+ + Mg2+ versus
, (c) Na+ + K+ versus Cl− +
, (d) (Na+ + K+) versus TZ+ and (e) (Ca2+ + Mg2+) versus TZ+.
The plot of (Ca2++Mg2+) versus ( ) is used to determine the ion exchange processes (Fig. 6b). If Ion exchange is dominant the points shift to left due to an excess of (Fisher and Mulican, 1997). If reverse ion exchange is the process, the point’s shift right due to excess of Ca2+ + Mg2+ over . A total of 60% of groundwater samples during both the seasons falls left to the 1:1 line indicating reverse ion exchange process and 40% of samples irrespective of seasons falls right to the 1:1 line indicating ion exchange process dominance. The points approaching the 1:1 equiline suggest ions from weathering of silicates (Datta and Tyagi, 1996).
The Na+ + K+ plotted against Cl− + shows (Fig. 6c) majority of the groundwater samples irrespective of season plots above 1: 1 line indicating the dominance of chloride and . Since no known geological source for chloride and sulfate is observed, sources for both these ions might be derived from agricultural activities like application of fertilizers (Rajmohan and Elango, 2006). Heavy use of fertilizers results in high values of, Cl−, , and K+ (Pawar and Saikh, 1995) which is highly evident from the groundwater chemistry of the study area. Samples plotted on, near or below the 1:1 line suggest mineral dissolution as the process controlling the major-ion chemistry. Variation of Cl− and along the groundwater flow direction may be due to long history of evaporation (Sarin et al., 1989). The plot of (Na+ + K+) versus TZ+ (Fig. 6d) irrespective of seasons point out groundwater in the area has a higher ratio of Cations via Silicate weathering and alkaline/saline soils and residence time, to some extent (Stallard and Edmond, 1983).
Further, the plot of (Ca2+ + Mg2+) versus total Cations (Fig. 6e) irrespective of seasons fall below the 1:1 trend, reflect an increasing contribution of Na+ and K+ as TDS increases. The increase in alkalies also contributes to greater Cl− + indicating its sources from soils as and (Subba Rao, 2002). Higher Na+ in groundwater is attributed to silicate weathering (Singh and Hasnain, 1999). Minor representations irrespective of seasons are also noted above the trend line indicating the atmospheric CO2 and CO2 released from the organic decomposition in the soil and partly by abundance of minerals like alkaline earth silicates (Subba Rao, 2002).
4.3 Mode of weathering and cation exchange
The weathering of rocks is due to its interaction with the atmosphere and hydrosphere. The HCO3-/SiO2 ratio is used to demarcate the dominant weathering activity (Hounslow, 1995) in a proposed study area. Silica will not be released by dissolving carbonate, whereas silicate weathering will release a considerable amount of silica in water. Hence, the water with shows dominant silicate weathering, while waters with suggest carbonate weathering (Hounslow, 1995). Accordingly, in the study majority of the samples revealed silicate weathering, and minor representations are also noted in carbonate weathering.
4.4 Mineral saturation index
The minerals in the groundwater and its reactivity can be predicted using the saturation index (SI) and activity diagrams rather than analyzing the solid phase mineralogy (Deutsch, 1997). The SI of a given mineral is defined in Equation as (Garrels and Mackenzie, 1967): Where IAP is the ion activity product of the solution and Ks is the solubility product of the mineral.
A positive SI value point to supersaturation and a tendency for the mineral to precipitate from the groundwater, whereas a negative SI pointed toward undersaturation tending the minerals to dissolve into groundwater. The SI values within a range of ±0.5 for a given mineral can be interpreted as representing apparent equilibrium in groundwater, which designate the tendency of mineral neither to dissolve into, nor precipitate from, groundwater (Srinivasamoorthy et al., 2008). The thermodynamic data used in this computation are those contained in the default database of the ‘WATEQ4F’ for Windows. In the present study, SI of carbonate minerals like aragonite, calcite, dolomite and magnesite and silicate minerals like chalcedony, christobalite and quartz were represented and categorized for two seasons.
The concentrations of carbonates are caused by the CO2 present in the soil zone formed by the weathering of rock materials due to alternate wet and dry conditions. The log pCO2 values in groundwater range from −3.5 to −1.3 with an average of −2.02 irrespective of seasons, which is higher than the atmosphere (−3.5) indicating decay of organic matter and root respiration as sources (Njitchoua et al., 1997). Since the dissolved CO2 gas pressure of the waters is higher than that of the atmosphere; the waters are supersaturated with respect to carbonate minerals. The calculated values (Fig. 7) of SI for aragonite, calcite, dolomite and magnesite range from −0.3 to 1.6, −0.5 to 1.5 and −0.1 to 1.7, −0.4 to 1.7 and −0.1 to 3.5, −1.0 to 2.8 and −0.3 to 1.7 and −0.7 and 1.1 with averages of 0.7, 0.4 and 0.8, 0.6 and 1.4, 0.6 and 0.5, 0.04 for PRM and POM seasons respectively. In about 80% of the groundwater samples the saturation of aragonite, calcite, dolomite and magnesite was more than 0, indicating oversaturation with respect to these minerals due to evaporation, and therefore, they are precipitated (Srinivasamoorthy et al., 2008). Minor representations irrespective of seasons are also noted in the phase of undersaturation indicating the tendency of groundwater to dissolve aragonite, calcite, dolomite and magnesite. Accordingly, there is a possibility for a further increase in Ca2+, Mg2+ and
, concentration in the waters of the study area due to their further dissolution.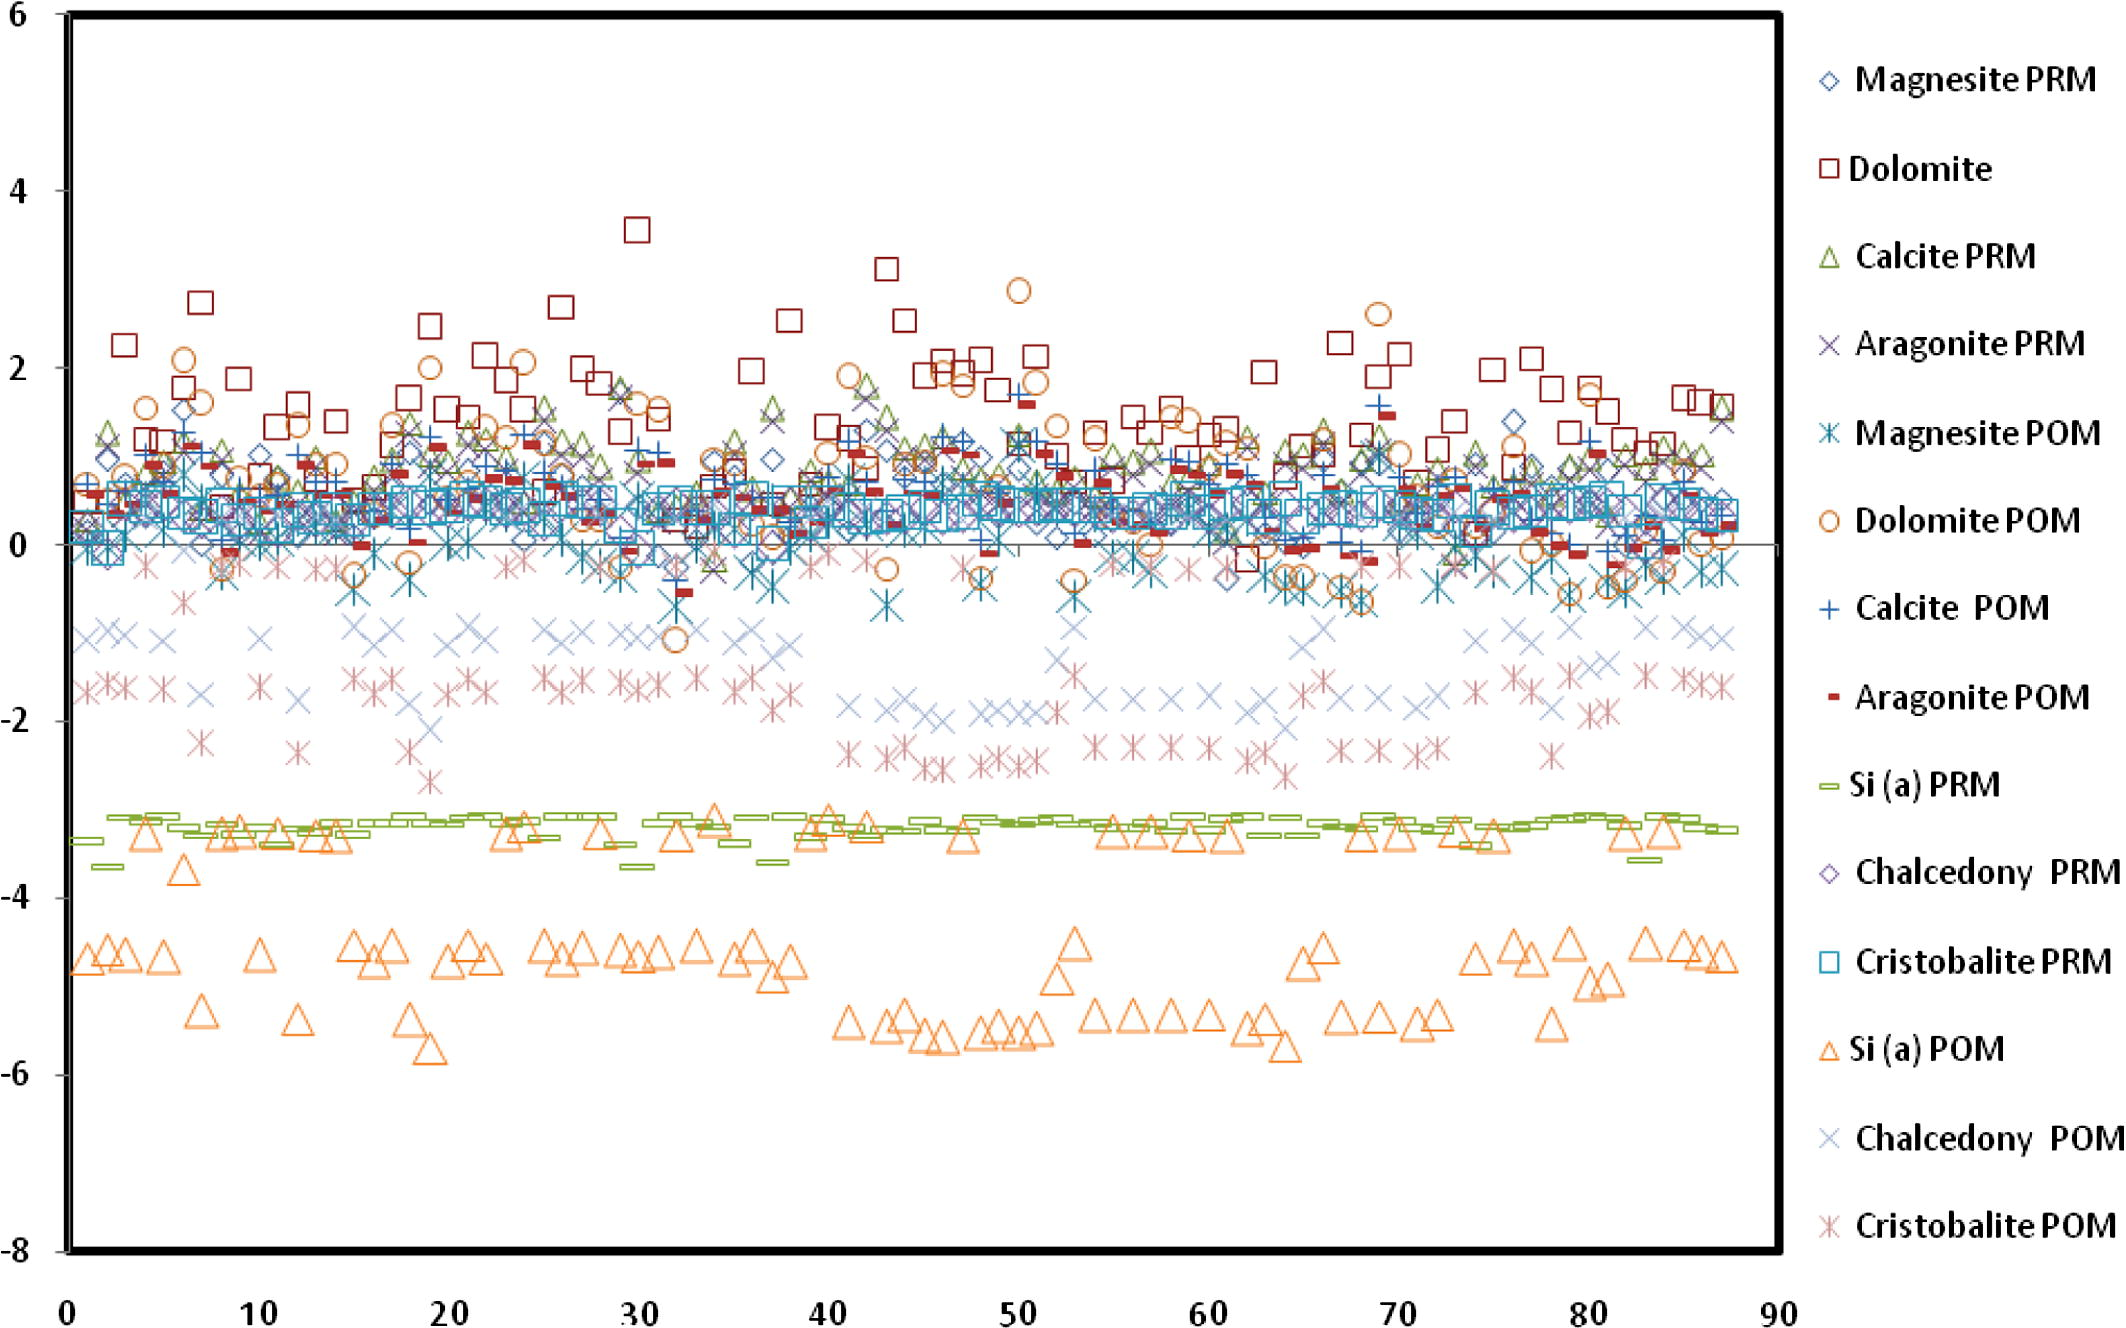
Disequilibrium indices of carbonate minerals and silicate minerals.
The disequilibrium indices of silicate minerals SiO2(a), chalcedony and cristobalite (Fig. 7) during both PRM and POM range from −3.6 to −3.08, −5.6 to −3.1 and −0.09 to 0.4, −2.1 to 0.44 and −0.05 to 0.5 and −2.1 to 0.4 with averages of −3.2, −4.4; 0.3, −0.9;0.3 and −0.8 respectively. The status of groundwater shows silica (a) and cristobalite as undersaturated and chalcedony was found to be saturated irrespective of seasons indicating the role of incongruent dissolution of silicate minerals.
4.5 Thermodynamic stability
Mineral stability diagrams are used in the field of hydrochemical research to study the silicate weathering process to demarcate the most stable silicate mineral phases in the natural waters (Garrels and Christ, 1965; Stumm and Morgan, 1996). Interaction between rocks and groundwater results in leaching of ions into the groundwater systems. Due to the interactions, different end members of mineral phases are outlined depending upon the residence time of the water, climatic conditions and groundwater flow. The silicate stability diagrams for (Na+)/H+, (K+)/H+, (Ca2+)/H+, and (Mg2+)/H+ for the groundwater during PRM and POM seasons are plotted on the stability diagram (Fig. 8a–d) as a function of (H4SiO4).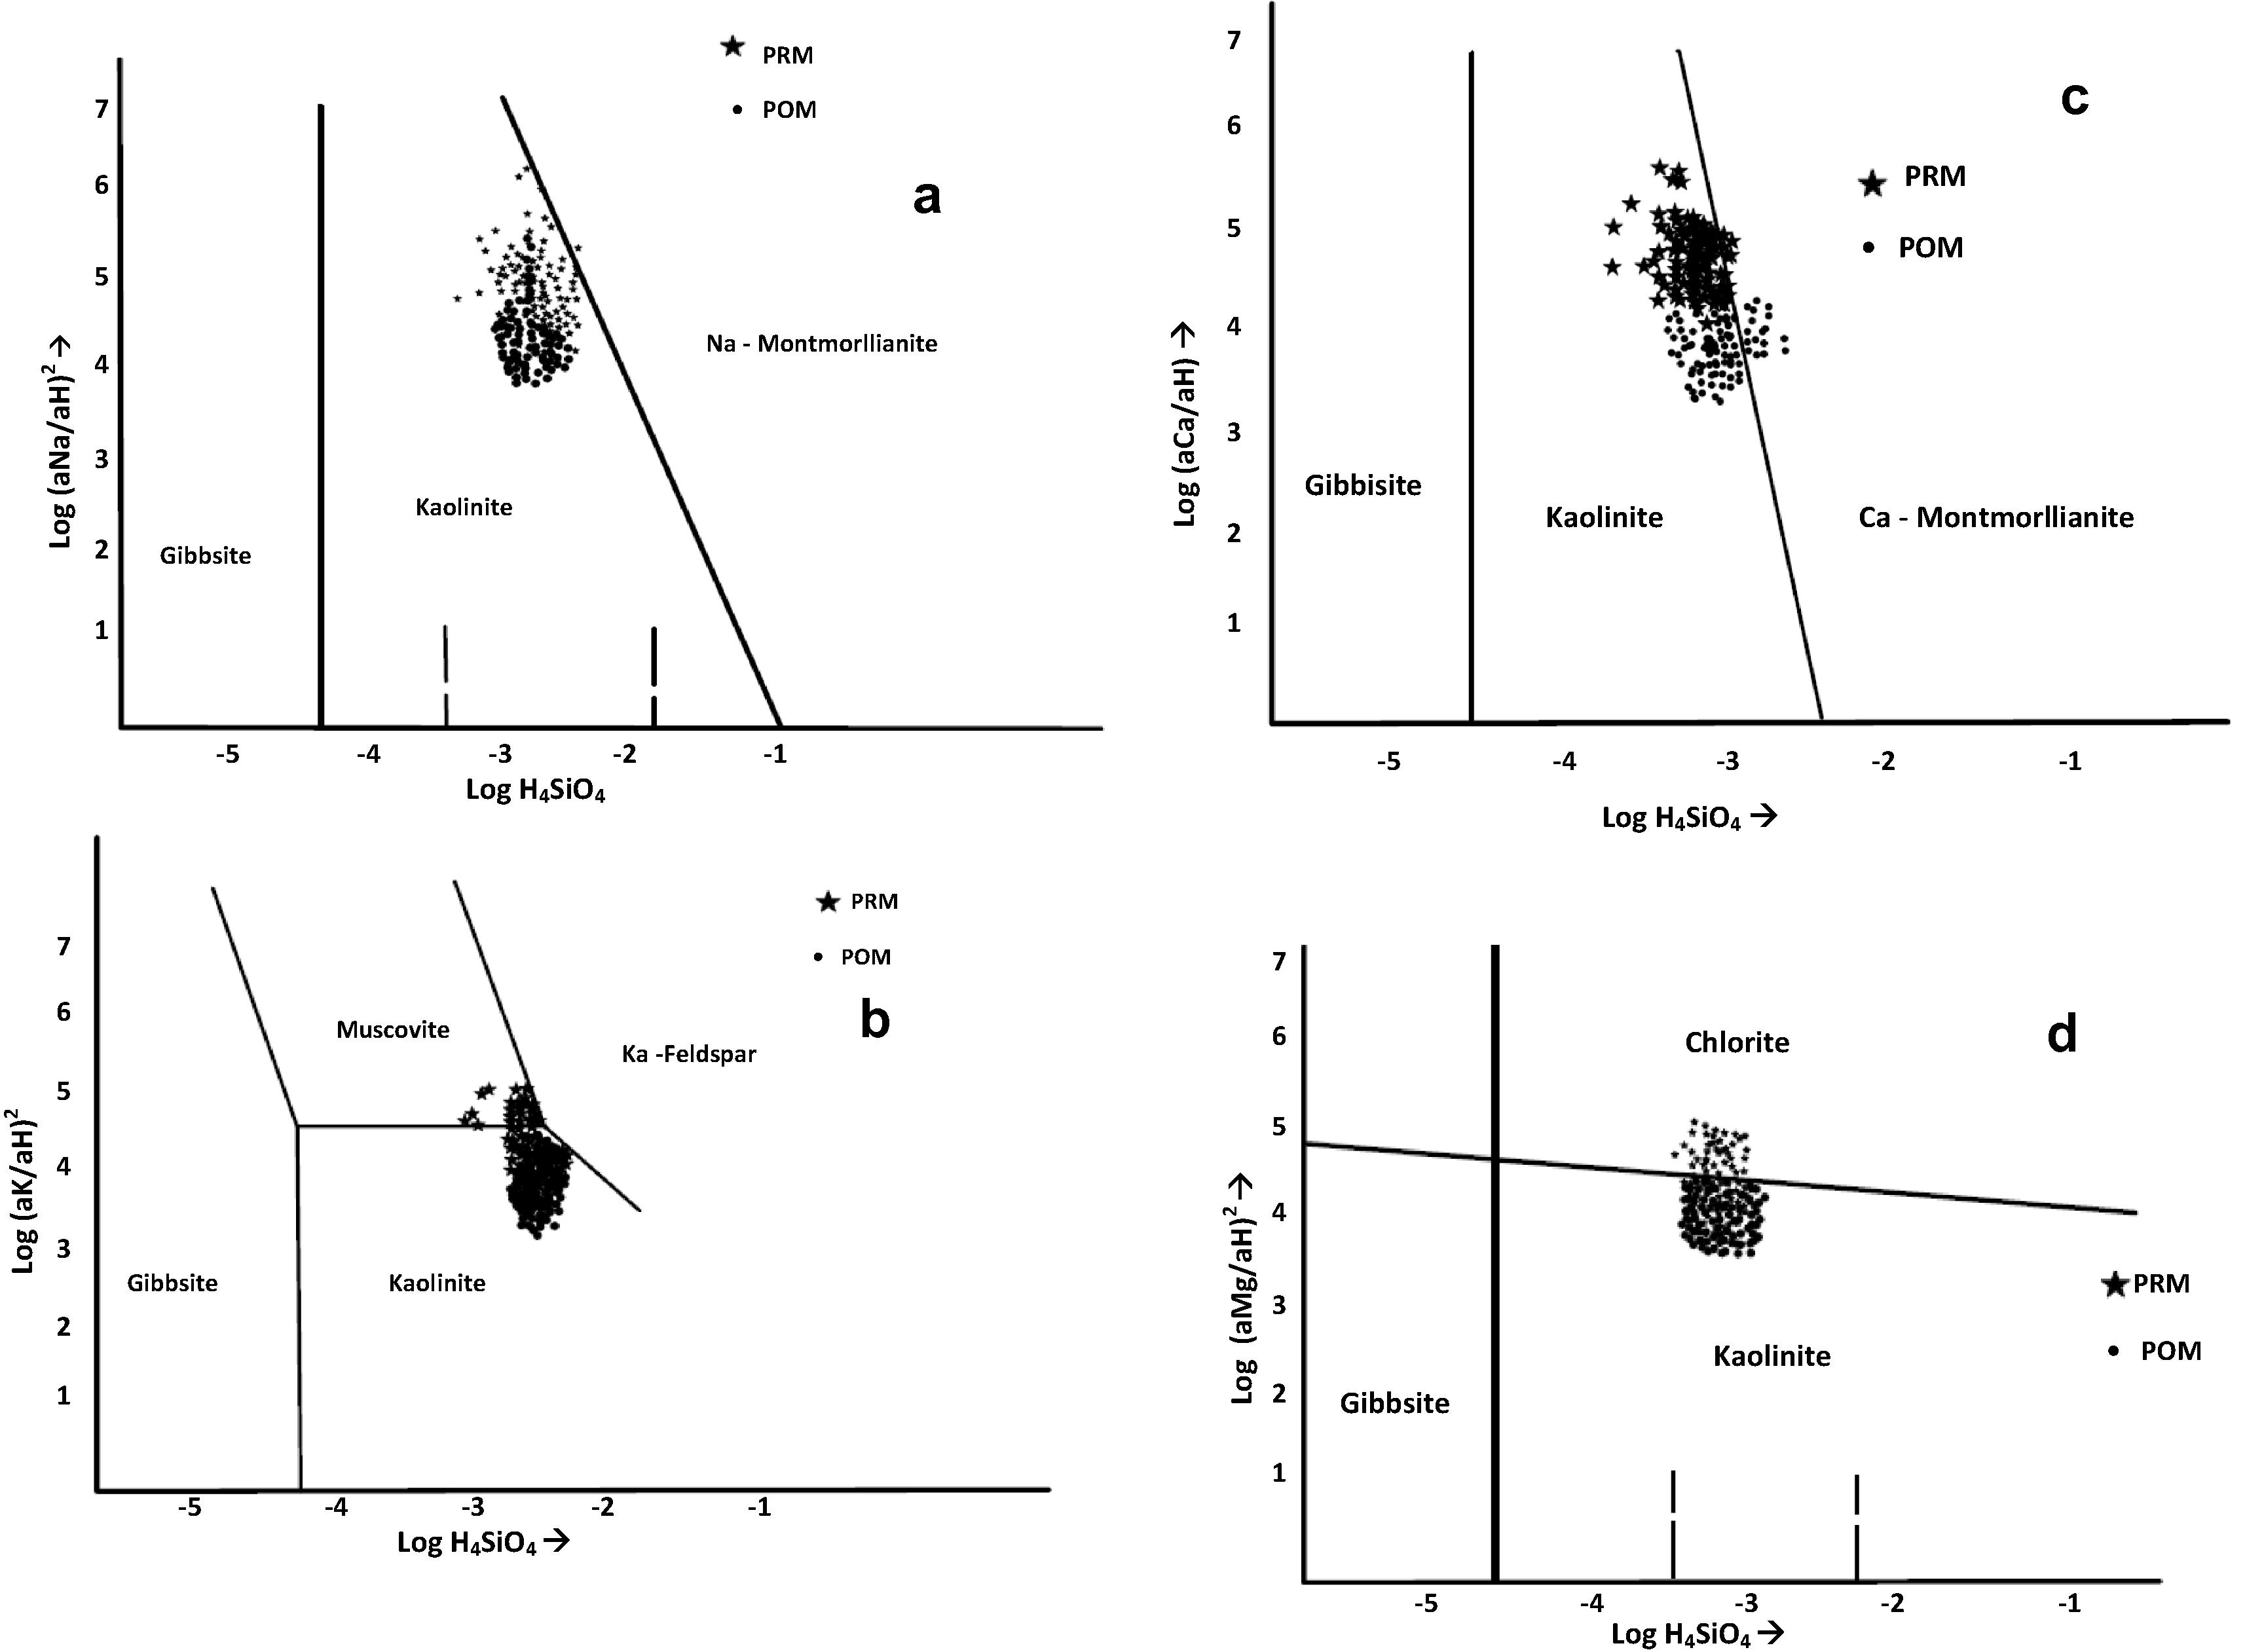
Thermodynamic stability plot for (a) Ca, (b) Mg system, (c) Na and (d) K system.
The stability plot for Na+ system (Fig. 8a) representing PRM and POM samples, fall in the kaolinite stability field indicating Na+ feldspar will dissolve incongruently to produce kaolinite and dissolved products. As the dissolution of feldspars continues the value of Si(OH)4 and [Na+]/[H] increases and water chemistry moves to Na+ montmorllianite during PRM following the reaction: In the K+ system majority of samples during PRM and POM fall in kaolinite field, and minor (Fig. 8b) representations during PRM are also noted in the muscovite field indicating incongruent dissolution of kaolinite and formation of muscovite. This is mainly due to the IAP of K+ which increases with constant pH resulting in shift of kaolinite to muscovite releasing H+ ions that combines with to form CO2 as given below:
The plot for Ca2+ irrespective of seasons (Fig. 8c) specify stability in the kaolinite field. Minor representations are noted in Ca-montmorillonite field during POM due to high Ca2+ and SiO2 contents in the samples by weathering from litho units of the study area. The semi-arid climatic condition has restricted the flow of groundwater resulting in greater interaction of silicate minerals and groundwater which favors the formation of montmorillonite, a higher silica clay mineral. Intermediate flow between these enhances the formation of gibbsite and kaolinite with low silicate content.
In plot for magnesium (Fig. 8 d) shift of stability from kaolinite to chlorite is noted in both the seasons indicating the formation of new clay minerals due to supply of excess cations and silica to pre-existing kaolinite from aquifer materials.
5 Irrigation water quality
Irrigation waters pumped from wells contain considerable chemical constituents derived from natural environment and man activities that may reduce crop yield and deteriorate soil fertility (Jalali, 2009). The application of irrigation water to the soil introduces salts into the root zone. Plant roots take in water but absorb very little salt from the soil solution. Similarly, water evaporates from the soil surface but salts remain behind. The processes result in a gradual accumulation of salts in the root zone affecting the plants by creating salinity hazard, water deficiency and toxicity (Jalali, 2011a). Knowledge of irrigation water quality is critical to understanding what management changes are necessary for long-term productivity (Jalali, 2011b). Besides these, irrigated agricultural crops need very good quality water. Hence to cope with such problems, it is necessary to have detailed information concerning the quality of irrigation water and its effect on soils and crops. Hence an attempt has been made in the present study to demarcate the quality of irrigation water.
5.1 Magnesium ratio (MR)
The Ca2+ and Mg2+ ions maintain a state of equilibrium in most groundwater (Hem, 1985). In equilibrium, Mg2+ in water affects the soil by making it alkaline and results in decrease of crop yield (Kumar et al., 2007a,b). The measure of the effect of magnesium in irrigated water is expressed as the magnesium ratio (Table 3). Paliwal (1972) developed an index for calculating the magnesium hazard. MR is calculated using the formula:
The MR values range from 15.49 to 72.45 and 19.54 to 83.33 mg l−1 during PRM and POM seasons respectively. During PRM 52% of samples and 21% during POM fall above the permissible limit of 50 mg l−1 indicating the unfavorable effect on crop yield and increase in soil alkalinity. Continuous use of water with high magnesium content will adversely affect crop yield and therefore suggests quick intervention (Paliwal, 1972).
Parameters
Range
Class
Number of Samples
PRM
POM
EC
<250
Excellent
0
0
250–750
Good
0
1
750–2000
Permissible
73
61
2000–3000
Doubtful
1
19
>3000
Unsuitable
13
7
Na%
<20
Excellent
8
49
20–40
Good
54
35
40–60
Permissible
24
2
60–80
Doubtful
1
1
>80
Unsuitable
0
0
MR
<50
Suitable
35
75
>50
Unsuitable
52
12
TH
<75
Soft
0
0
75–150
Moderately
0
0
150–300
Hard
3
2
>300
Very hard
84
85
RSC
<1.25
Safe
60
84
1.25–2.5
Marginally suitable
18
0
>2.5
Not suitable
9
3
SAR
<20
Excellent
87
86
20–40
Good
0
1
40–60
Permissible
0
0
60–80
Doubtful
0
0
>80
Unsuitable
0
0
KI
<1
Suitable
85
85
>1
Unsuitable
2
2
5.2 Total hardness
The temporary and permanent hardness of water are due to the action of soap in water due to the precipitation of Ca2+ and Mg2+ ions. Temporary hardness is mainly due to calcium carbonate in water that gets removed during heating. Permanent hardness is due to Ca2+ and Mg2+ ions that get removed by ion-exchange processes. Hardness of water limits its use for industrial purposes; causing scaling of pots, boilers and irrigation pipes. In some studies, a significant correlation was observed between hardness and heart diseases, in contrast a number of epidemiological studies suggest that water hardness protects against diseases (WHO, 1996). The total hardness (TH) expressed in mg l−1 is determined by Todd (1980) as. The most desirable limit for TH is 80–100 mg CaCO3/l (Freeze and Cherry, 1979). The TH ranges from 198.8–4001; 3.2–1455.3 mg l−1 with an average of 692.6 and 650.3 mg l−1 during both the seasons tending very hard water category.
5.3 Residual sodium carbonate (RSC)
The sum of carbonate and bicarbonate over the sum of calcium and magnesium in water influences the fit of groundwater for irrigation purposes. An excess sodium bicarbonate and carbonate influence the physical properties of soil by dissolution of organic matter in soil that leaves a black stain on its surface on drying (Kumar et al., 2007a and b). This excess is called RSC and determined by the formula Ragunath (1987): Where, all ionic concentrations are expressed in meq/l. RSC ranges from −25.2 to 6.9 meq/l and −23.4 to 6.9 meq/l with an average of −3.0 and −7.3 during PRM and POM respectively. From the values 18% of the samples during PRM are unsuitable for irrigation purposes. No groundwater samples were found to be unsuitable during POM may be due to the action of infiltrating rain water.
5.4 Sodium percentage (Na+%)
Sodium is an important ion used for the classification of irrigation water due to its reaction with soil that reduces its permeability. Percentage of Na+ is widely used for assessing the suitability of water for irrigation purposes (Wilcox, 1955). Na+ is expressed as percent sodium or soluble-sodium percentage (%Na+). The Na+% is calculated using the formula:
Where, all ionic concentrations are expressed in meq/l. The classification of samples is shown in Table 3. As per the (Wilcox, 1955) classification 8% and 49% of groundwater during PRM and POM represent the excellent category; 54% and 35% represent good, 24% during PRM and 2% of samples during POM represents permissible limit (Fig. 9). Each sample in both the seasons represents doubtful category and no representation is made in unsuitable limit. The effect of dilution is well observed during POM season by an increase in number of samples representing excellent category, and a decrease in samples from good and permissible category for irrigation purposes. In general higher Na+% are observed during PRM, indicating the dominance of ion exchange and weathering from lithological units of the study area.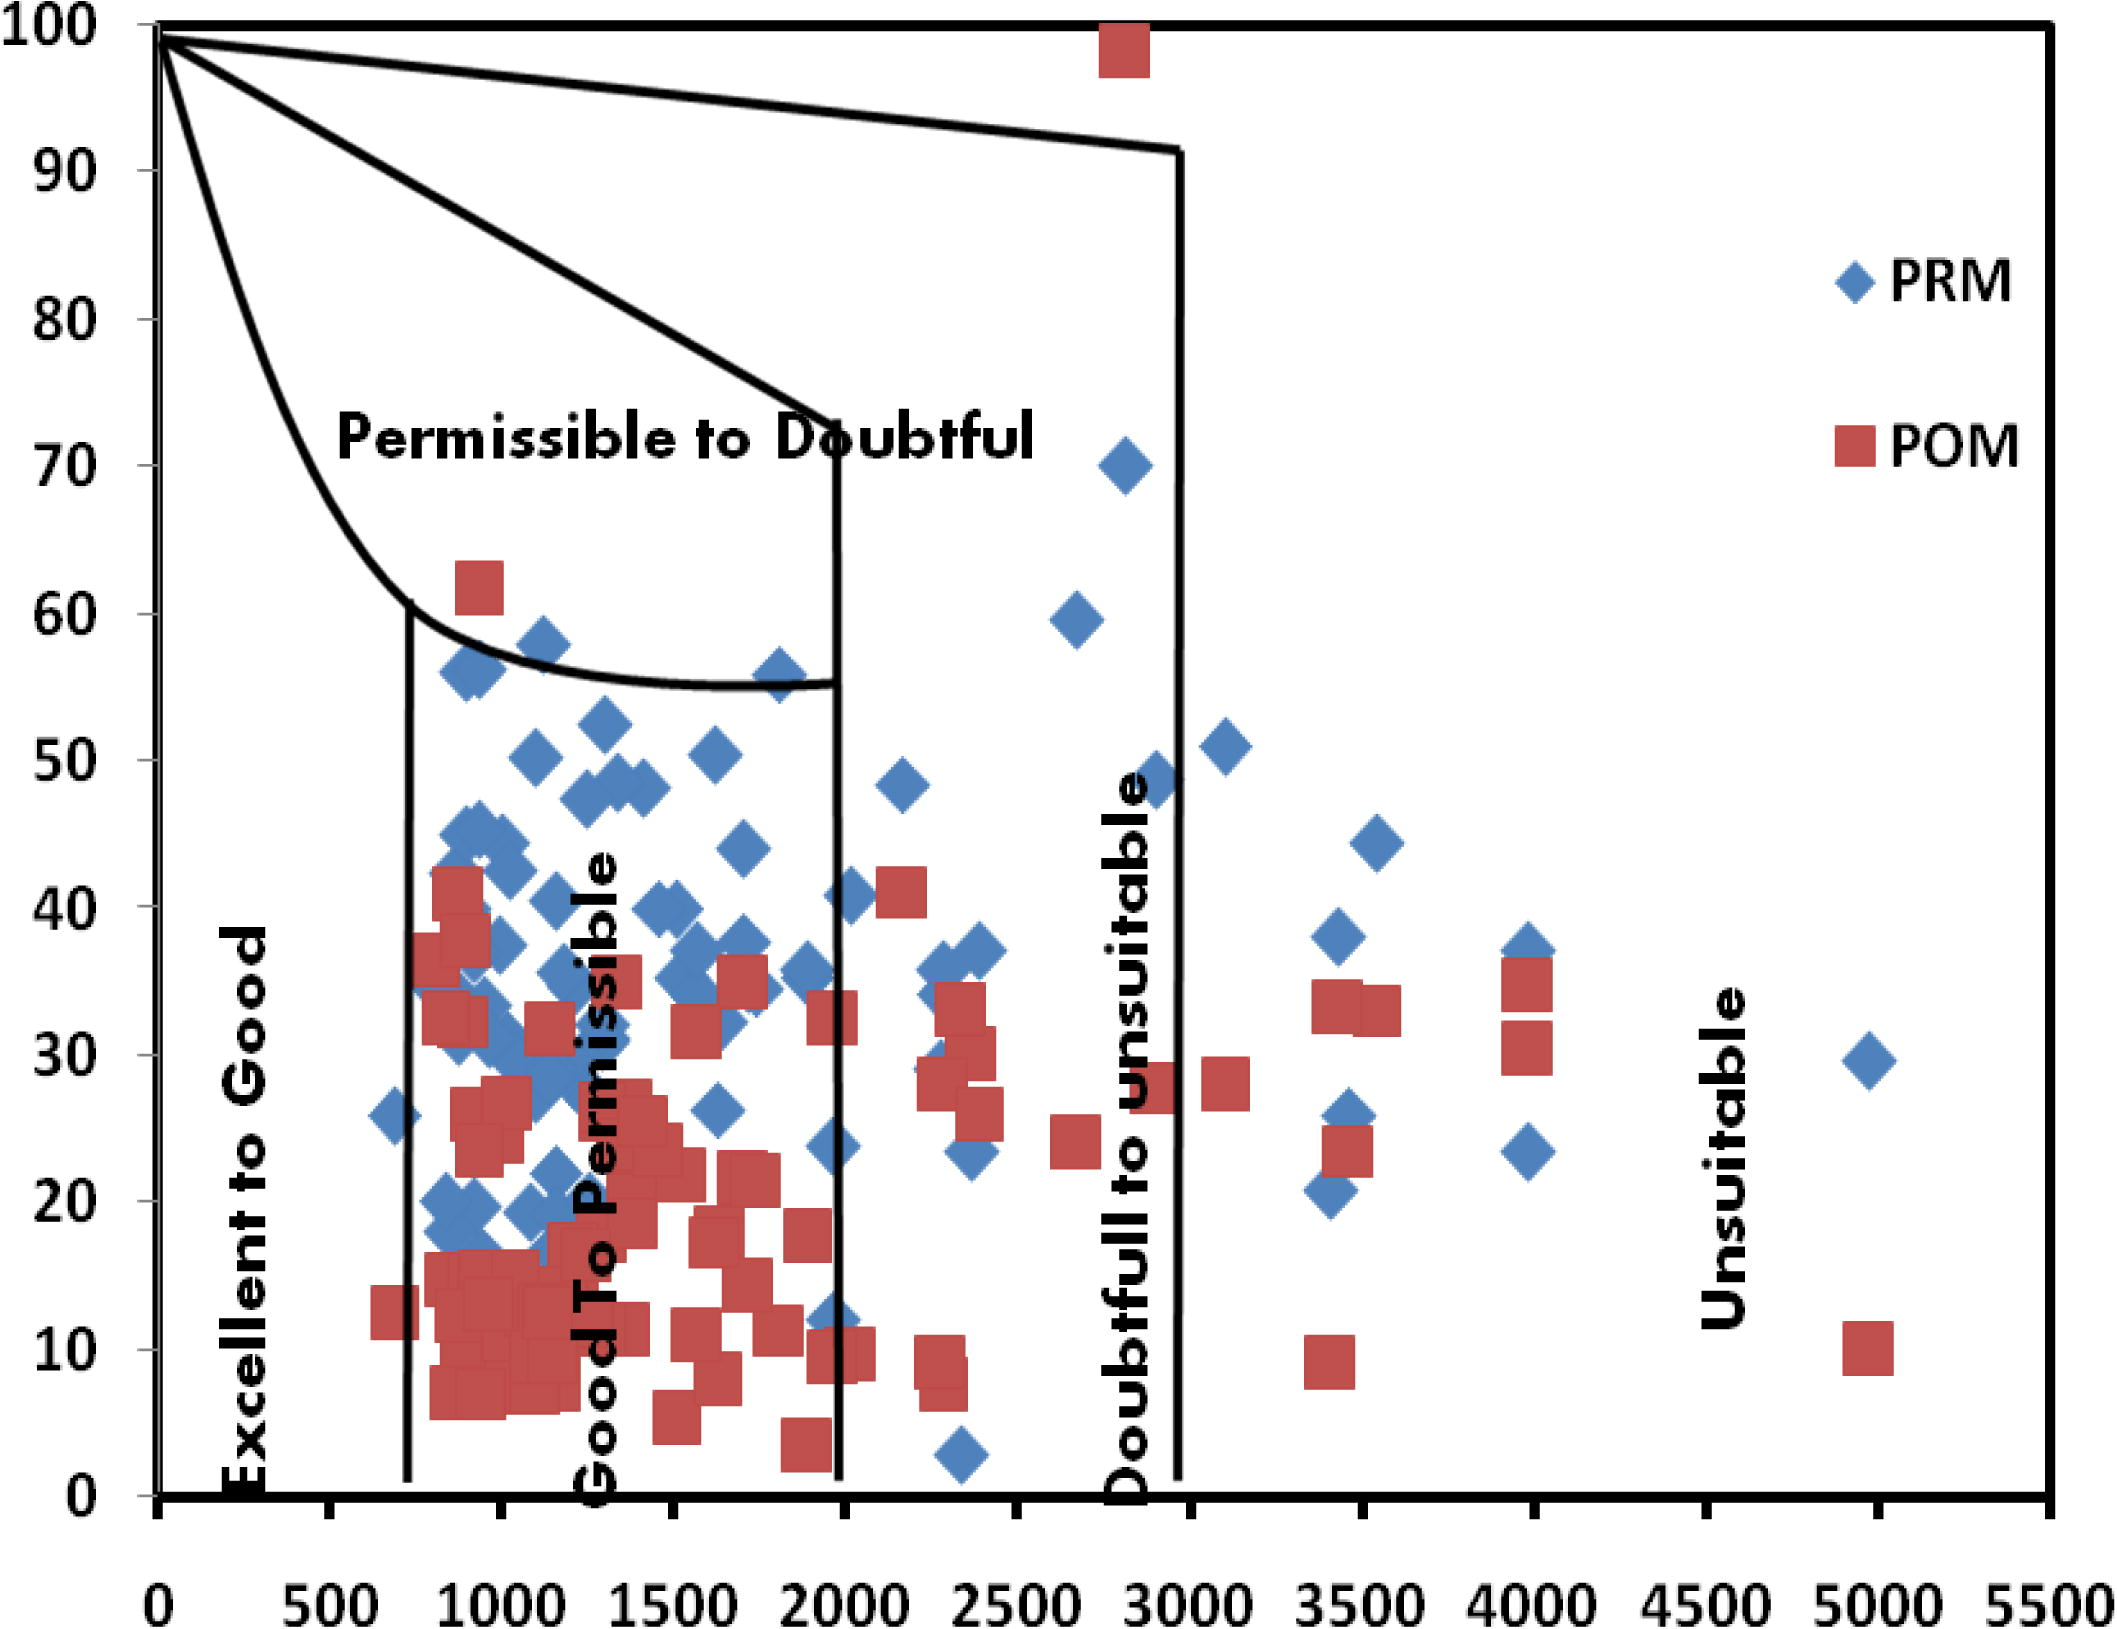
Plot of sodium percentage and electrical conductivity for classification of groundwater for irrigation uses.
5.5 Sodium adsorption ratio (SAR)
Sodium adsorption ratio also expressed as sodium content or alkali hazard is important for determining the quality of water used for irrigation purposes. Higher salinity reduces the osmotic activity of plants and prevents water from reaching the branches and leaves of plants resulting in inferior production (Deepali et al., 2010). Moreover, irrigation water with high Na+ and low Ca2+ favors ion exchange by saturation of Na+, destroys the soil structure due to dispersion of clay particles (Todd, 1980) resulting in minor production due to difficulty in cultivation (Subba Rao, 2006). The SAR is computed, using the formula (Hem, 1991) as:
Concentrations expressed in meq/l. The SAR values range from 0.2 to 5.8 and 0.2 to 22.9 during PRM and POM seasons. SAR is higher during POM season, indicating precipitation induced dissolution and leaching of salts. The analytical data plotted on the US salinity diagram (USSL, 1954) point out (Fig. 10) majority of water samples during both the seasons clusters in C3S1 zone indicating high salinity and low sodium water, which can be used for irrigation in almost all types of soil with little danger of exchangeable sodium (Kumar et al., 2007a and b). Representations are also noted in the C4S1 category indicating water suitable for plants having good salt tolerance but unsuitable for irrigation in soils with restricted drainage (Mohan et al., 2000).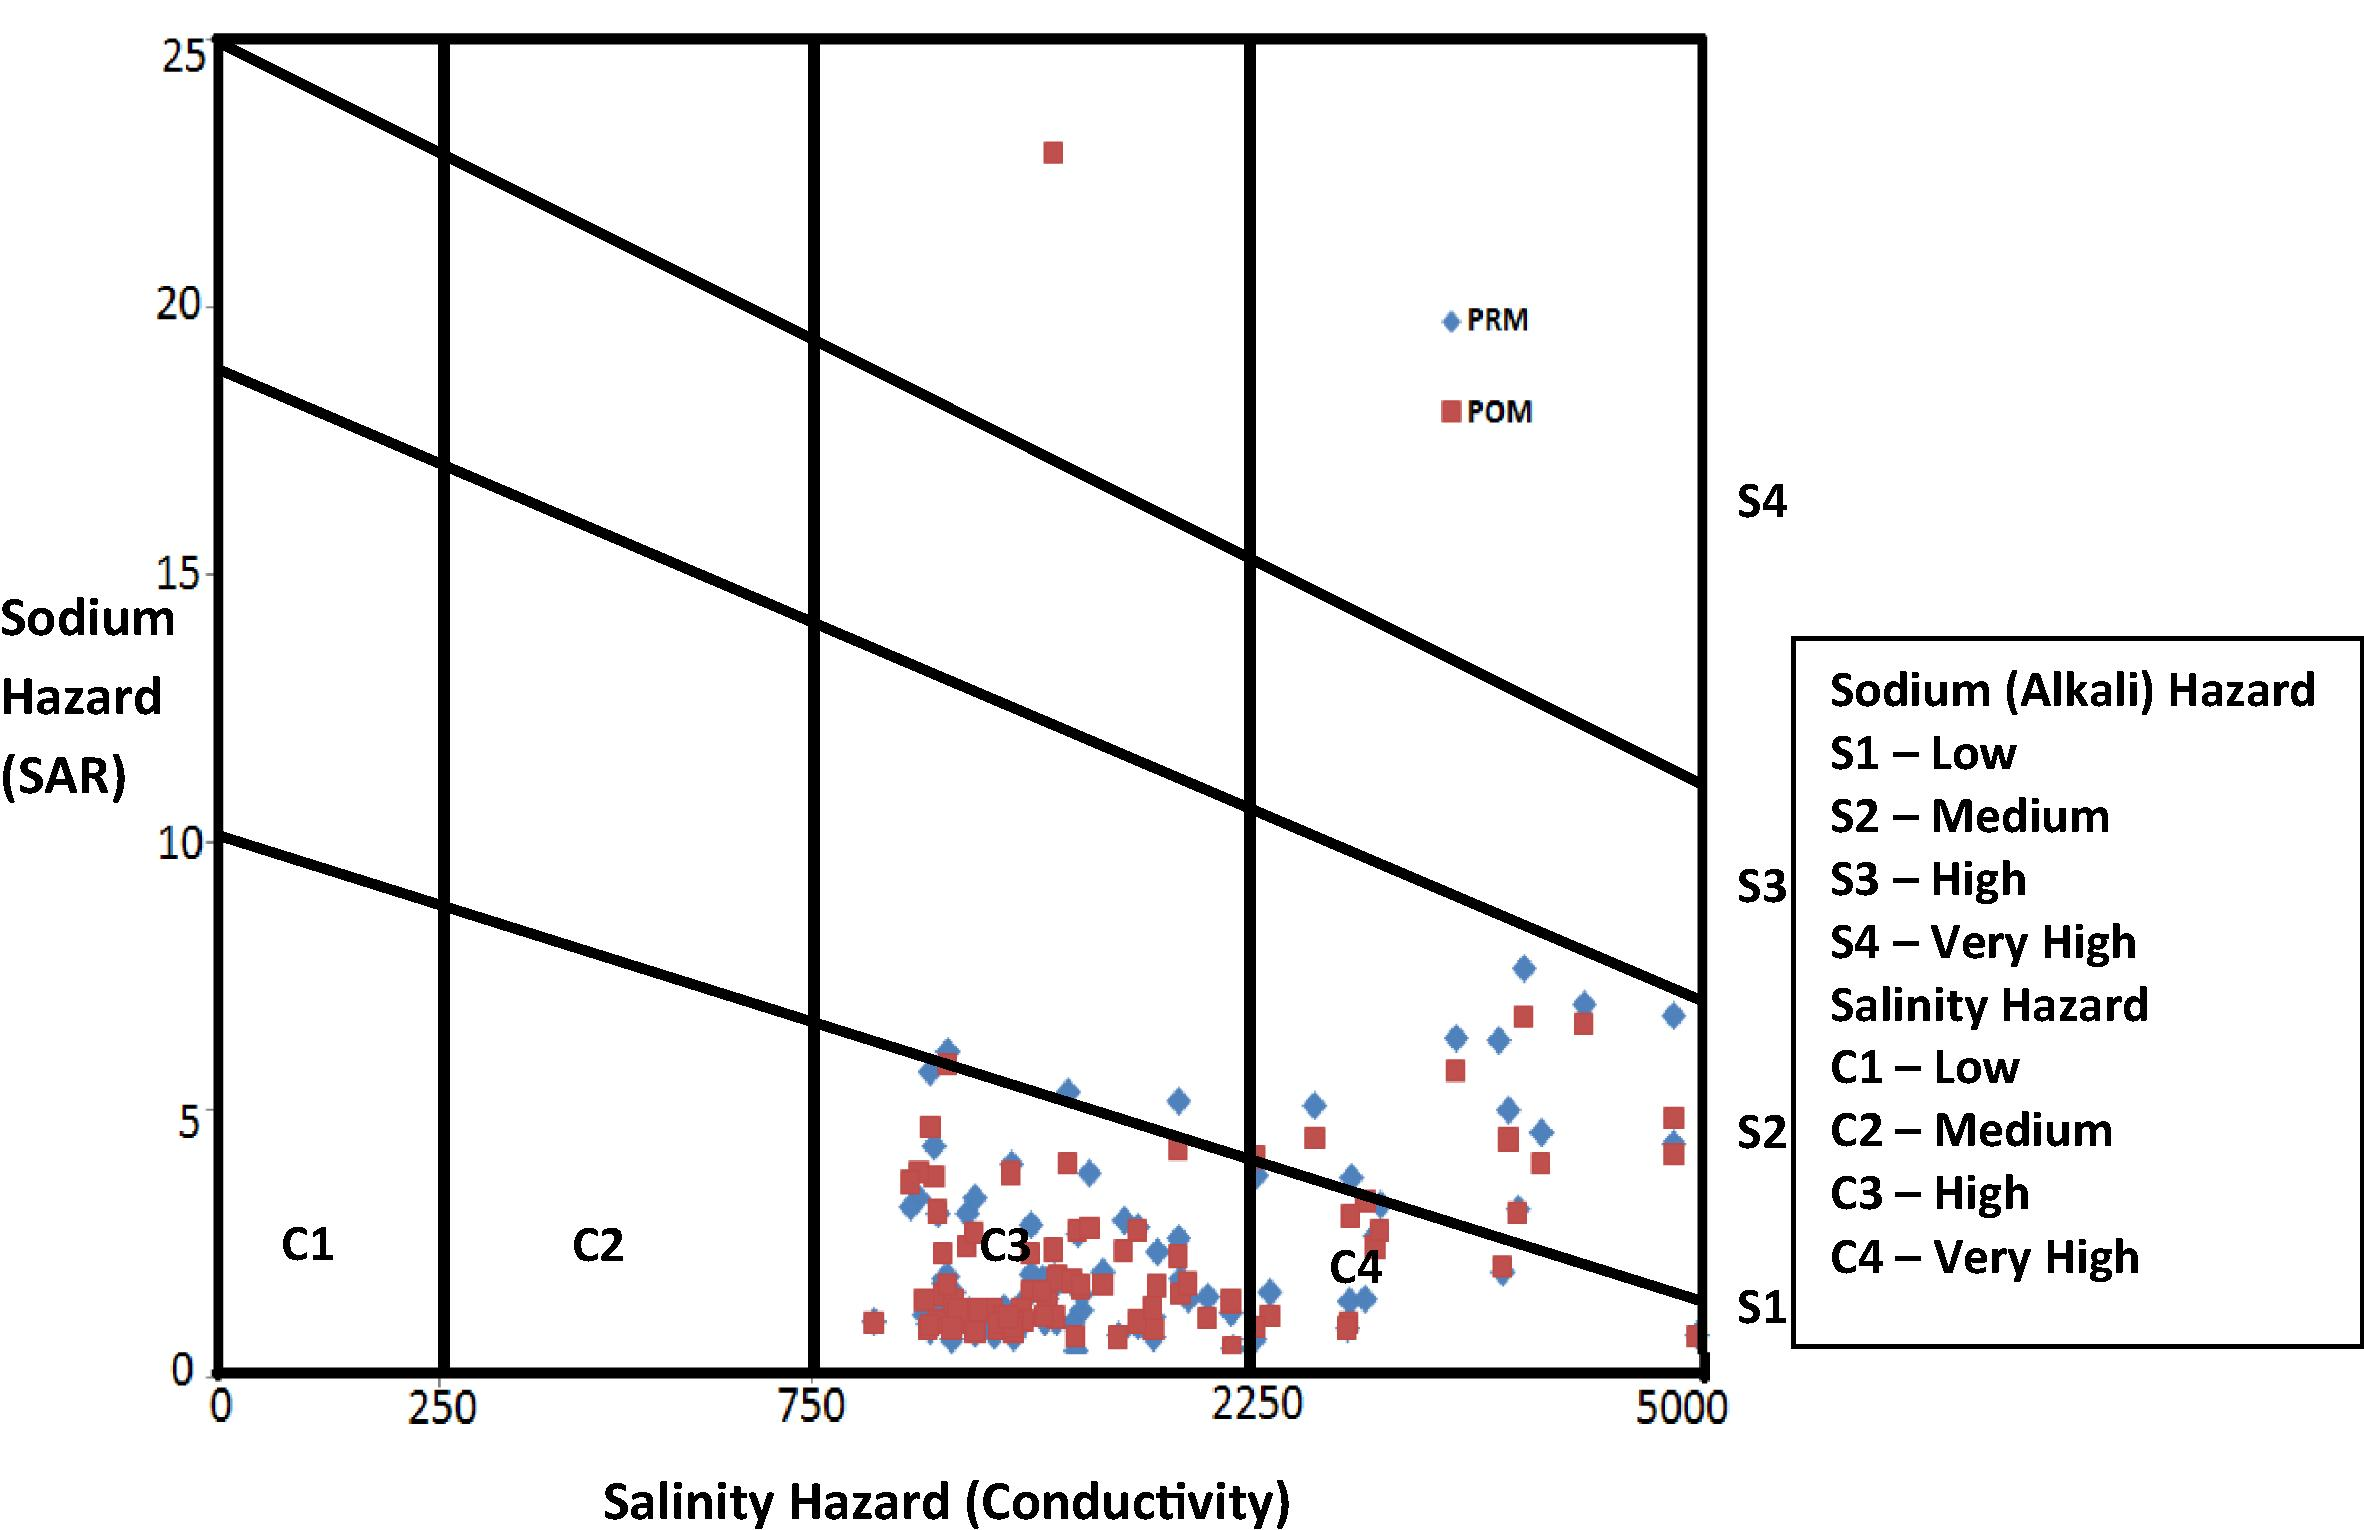
US Salinity diagram for classification of irrigation waters.
5.6 Permeability index (PI)
The permeability of soil is influenced by sodium, calcium, magnesium and bicarbonate contents in soil which also influences the quality of irrigation water on long term use. Doneen (1964) has evolved a criterion for assessing the suitability of water for irrigation based on PI, calculated by using the formula: where all the ions are expressed in meq/l. PI ranging from 5.7 to 86.0 and 13.5 to 114.9 with averages of 49.4 and 34.6 meq/l during PRM and POM, respectively. According to PI values, the groundwater samples fall in class I during both the seasons indicating water is moderate to good for irrigation purposes (Arumugam and Elangovan, 2009).
5.7 Kelly’s index (KI)
Kellys index is used for the classification of water for irrigation purposes. A KI (>1) shows an excess of sodium and KI (<2) signifies its deficit in waters (Kelly, 1940). The waters with low KI (<1) are suitable for irrigation while those with greater ratio are unsuitable (Sundaray et al., 2009). KI is calculated by the formula; where ions are expressed in meq/l. KI ranges between 0.0–1.4 and 0.0–45.5 during PRM and POM seasons. A total of 25% and 21% of samples during PRM and POM represent its suitability and rest falls above the unsuitable limit, indicating higher percentage derived from weathering of Feldspars from the litho units of the study area (Vasanthavigar et al., 2012).
5.8 Remedial measures for irrigation suitability
Saline groundwater is confined to shallow depth in irrigated areas of semi arid regions like that of the present study. High evaporation rates and poor drainage prompt for saline deposits in soils resulting from excess irrigation and gets migrated to the well screens. Surface irrigation with higher saline waters on soils of the study area leads to the buildup of salinity and sodicity problems. Hence there is a need for specialized and efficient methods of irrigation like that of micro irrigation which leads to higher productivity and lesser use of water (Dilek and Irfan, 2010). Chemical modification techniques like, field leveling, bunding, application of gypsum/pyrite as per soil requirement and rice–wheat rotation will help in reclaiming alkali/sodic soils. Another solution is maintaining deeper water tables via drainage disposal systems but still in controversy. Hence the shallow water table should be effectively utilized by sub – irrigation methods like capillary rise, that manages crop water requirements and root zone management. The other alternate is by adopting salt and sodicity tolerance crops like barley, millets, date, palm, cotton; grass species like Leptochloa fusca and Bricharia mutica and trees like Eucalyptus, Populus, Casurania and Bambusa (Tariqul Islam, 2009) will be effective for the reclamation of saline/sodicity soils.
6 Conclusion
This study provides significant information on groundwater quality in the Pungar sub basin, Tamilnadu, India. Based on EC, higher clusters of sample during PRM are unsuitable for drinking and irrigation purposes. Major ions in groundwater are within the permissible limits for drinking except in some places. The sources identified for and to groundwater are from fertilizer application. Gibbs plot suggests groundwater influenced by chemical weathering and evaporation. The ratio plot of (Ca2+ + Mg2+) versus ( ) suggests reverse ion exchange and silicate weathering as dominant process. The Na+ + K+ versus Cl− + plot suggests sources from agricultural activities, also confirmed by low Na+/Cl− ratios. Facies change demarcates both hardened and softened waters. The saturation indices of carbonate minerals favor evaporation evidenced from higher log pCO2 values and silicate minerals suggest sources from incongruent dissolution. Mineral stability diagram points groundwater is in equilibrium with clay minerals like montmorillionite, illite and chlorite due to semi-arid climatic condition and restricted groundwater flow. Higher Na% is noted during PRM. The irrigation suitability diagram shows alkaline earths dominating bicarbonate indicating base exchanged hardened water. The RSC values designate that majority of water samples represents their suitability for irrigation with few exceptions in certain locations. The PI suggests groundwater quality is moderate to good for irrigation purposes. Higher MR values suggest a continuous use of water will affect the crop growth. In general, the quality of groundwater is found to be fit for drinking and irrigational purposes in spite a few patches in the northwest and northern parts of the study area. The overall geochemistry of groundwater in the study area is controlled by natural geochemical processes like rock water interaction, evaporation, dissolution, ion exchange and anthropogenic induced activities like overexploitation of aquifers, fertilizer influences and agricultural return flow.
Acknowledgement
The authors are thankful to the Department of Science and Technology (DST) for providing necessary financial assistance for the study. The author (MG) also acknowledges the DST for granting Junior Research Fellow (JRF) position. We would like to thank two anonymous reviewers and the editor (Dr. Khaled A.S. Al-Rasheid) for their very constructive comments and suggestions on the earlier version of this manuscript.
References
- Hydrogeology and geochemical characterization of groundwater in a typical small-scale agricultural area of Japan. Journal of Asian Earth Science. 2007;29:18-28.
- [Google Scholar]
- Water quality analysis of groundwater in crystalline basement rocks, northern Ghana. Environmental Geology. 2009;58:989-997.
- [Google Scholar]
- Standard Methods for the Examination of Water and Wastewater (19th ed.). Washington, D.C: American Public Health Association; 1995.
- Geochemistry.Groundwater and Pollution. the Netherlands: Balkema, Rotterdam; 1993.
- Hydrochemical characteristics and groundwater quality assessment in Tirupur Region, Coimbatore District, Tamil Nadu, India. Environmental Geology. 2009;58:1509-1520. (doi:10.1007/s00254-008-1652-y)
- [Google Scholar]
- Groundwater recharge and agricultural contamination. Hydrogeology Journal. 2002;10:153-179.
- [Google Scholar]
- Genesis of groundwater in the coastal plain of Virginia. Environmental Geology. 1946;41:218-245.
- [Google Scholar]
- Major ion chemistry of groundwater in Delhi area: chemical weathering processes and groundwater regime. Journal of Geological Society of India. 1996;47:179-188.
- [Google Scholar]
- Geochemical characterization of groundwater from northeastern part of Nagpur urban, Central India. Environmental Earth Science. 2010;62:1419-1430.
- [CrossRef] [Google Scholar]
- Groundwater Geochemistry: Fundamentals and Application to Contamination. FL, USA: CRC, Boca Raton; 1997.
- Water Recycling and Water Management. In: Daniel M., ed. Carrey. Nova Science Publishers; 2010. p. :280.
- [Google Scholar]
- Doneen, L.D., 1964. Notes on water quality in Agriculture. Published as a Water Science and Engineering, Paper 4001, Department of Water Sciences and Engineering, University of California.
- Major ion chemistry and identification of hydrogeochemical processes of groundwater in part of Kancheepuram district, Tamil Nadu. Indian Journal of Environmental Geoscience. 2003;10(4):157-166.
- [Google Scholar]
- The effect of phosphate addition on the solubility of phosphate in soil. Plant Soil. 1978;50:585-594.
- [Google Scholar]
- Groundwater geology (hydrogeology) ITU Maden Fakültesi, Istanbul 1987:339. (in Turkish)
- [Google Scholar]
- Hydrochemical evolution of sodium-sulfate and sodium-chloride groundwater beneath the Northern Chihuahuan desert, Trans-Pecos, Rexas, USA. Hydrogeology Journal. 1997;10:455-474.
- [Google Scholar]
- Groundwater. New Jersey: Prentice Hall; 1979.
- Solutions Minerals and Equilibrium. New York: Harper and Row; 1965. 450
- Origin of the chemical compositions of some springs and lakes. In: Stumm W., ed. Equilibrium Concepts in Natural Water Systems. American Chemical Society; 1967. (pp. 222–242)
- [Google Scholar]
- Mechanism controlling world river water chemistry: evaporation-crystallization process. Science. 1971;172:871-872.
- [Google Scholar]
- Gopinath, M., 2011. Groundwater quality assessment in Pungar sub basin, Tamilnadu, India, Unpublished M.Phil., Thesis, Annamalai University.
- Water for India in 2050: first-order assessment of available options. Current Science. 2004;86:1216-1223.
- [Google Scholar]
- Geochemistry of groundwater, Burdwan district, West Bengal, India. Environmental Geology. 2008;53:1271-1282.
- [CrossRef] [Google Scholar]
- Groundwater pollution in India. In: Proceedings of National Symposium on Hydrology. India: IAHS, Publication University of Roorkee; 1979. p. :34-49.
- [Google Scholar]
- Study and interpretation of the chemical characteristics of natural waters. United States Geological Survey, Water Supply Paper 1473. Washington, D.C.: USGS; 1985.
- Study and interpretation of the chemical characteristics of natural waters. Book 2254 (third edition). Jodhpur: Scientific Publishers; 1991.
- Water Quality Data: Analysis and Interpretation. Boca Raton, FL: CRC Lewis Publishers; 1995. 86–87
- Hydrochemical characteristics and the effects of irrigation on groundwater quality in Harran Plain, GAP Project, Turkey. Environmental Geology. 2008;54:183-196.
- [CrossRef] [Google Scholar]
- Indian standard specification for drinking water. IS, 10500- 1995. New Delhi: ISI; 1995.
- Chemical characteristics of groundwater in parts of mountainous region, Alvand, Ha madan, Iran. Environmental Geology. 2006;51:433-446.
- [Google Scholar]
- Assessment of the chemical components of Famenin groundwater, western Iran. Environmental Geochemical Health. 2007;29:357-374.
- [CrossRef] [Google Scholar]
- Phosphorous concentration, solubility and species in the groundwater in a semi-arid basin, southern Malayer, western Iran. Environmental Geology. 2009;57:1011-1020.
- [Google Scholar]
- Nitrate pollution of groundwater in Toyserkan, western Iran. Environmental Earth Science. 2011;62:907-913.
- [Google Scholar]
- Hydrogeochemistry of Groundwater and Its Suitability for Drinking and Agricultural Use in Nahavand, Western Iran. Natural Resources Research. 2011;20:1.
- [CrossRef] [Google Scholar]
- Hydrogeochemistry of the groundwater flow system in a crystalline terrain: a study from the Kurunegala district, Sri Lanka. Environmental Geology. 2008;55:723-730.
- [CrossRef] [Google Scholar]
- Geochemical investigation of groundwater quality. In: Seawater intrusion in coastal aquifers—concepts∗ methods and practices. Netherlands: Kluwer; 1999. p. :1-71.
- [Google Scholar]
- Quality of Groundwater in the Shallow Aquifers of a Paddy Dominated Agricultural River Basin, Kerala, India, World Academy of Science. Engineering and Technology. 2009;52:475-493.
- [Google Scholar]
- Groundwater Assessment, Development and Management. New Delhi: Tata McGraw – Hill Publishers; 1997.
- Use of chemical and isotopic tracers to characterize the interaction between groundwater and surface water in mantled Karst. Groundwater. 1998;35:1014-1028.
- [Google Scholar]
- Permissible composition and concentration of irrigated waters. Proceedings of ASCF. 1940;66:607.
- [Google Scholar]
- Effect of water quality on the leaching of potassium from sandy soil. Journal of Arid Environment. 2006;68:624-639.
- [Google Scholar]
- A comparative evaluation of groundwater suitability for irrigation and drinking purposes in two intensively cultivated districts of Punjab, India. Environmental Geology. 2007;53:553-574.
- [Google Scholar]
- A comparative evaluation of groundwater suitability for irrigation and drinking purposes in two intensively cultivated districts of Punjab, India. Environmental Geology. 2007;53:553-574.
- [CrossRef] [Google Scholar]
- Hydrogeochemical processes in the groundwater environment of Muktsar, Punjab: conventional graphical and multivariate statistical approach. Environmental Geology. 2009;57:873-884.
- [Google Scholar]
- Solute and isotopic geochemistry and groundwater flow in the Central Wasatch Range, Utah. Journal of Hydrology. 1995;172:31-59.
- [Google Scholar]
- Global chemical weathering of surficial rocks estimated from river dissolved loads. American Journal of Science. 1987;287:401-428.
- [Google Scholar]
- Hydrochemistry and quality assessment of ground water in Naini Industrial area, Allahabad District, Uttar Pradesh. Journal of Geological Society of India. 2000;55:77-89.
- [Google Scholar]
- Groundwater quality In: Nash H., McCall G.J.H., eds. 17th Special Report. London: Chapman and Hall; 1995.
- [Google Scholar]
- Geochemistry, origin and recharge mechanisms of groundwater from the Garoua Sandstone aquifer, northern Cameroon. Journal of Hydrology. 1997;190:123-140.
- [Google Scholar]
- Paliwal, K.V., 1972. Irrigation with saline water, Monogram no. 2 (New series). New Delhi, IARI, 198.
- Nitrate pollution of groundwater from shallow basaltic aquifers, Deccan Trap Hydrologic Province, India. Environmental Geology. 1995;25:197-204.
- [Google Scholar]
- A graphical procedure in the geochemical interpretation of water analysis. Transactions, American Geophysical Union. 1944;25:914-928.
- [Google Scholar]
- Hydrogeochemical analysis and evaluation of groundwater quality in the Gadilam river basin, Tamil Nadu, India. Journal of Earth System Sciences. 2011;120:85-98.
- [Google Scholar]
- Groundwater (second ed.). New Delhi: Wiley Eastern Ltd; 1987.
- Hydrogeochemistry and its relation to groundwater level fluctuation in the Palar and Cheyyar River basins, southern India. Hydrological Process. 2006;20:2415-2427.
- [Google Scholar]
- Major ion chemistry of the Ganga-Brahmaputra river system: Weathering processes and fluxes to the Bay of the Bengal. Geochimica Cosmochimica acta. 1989;53:997-1009.
- [Google Scholar]
- Hydrodynamique dans le karst Hydrodynamics of karst. Actes du Colloques de Doubronik. Wallingford: IAHS/UNESCO; 1965. pp. 3–20
- Geochemistry of groundwater. An international guide for research and practice. UNESCO. 1967;15:1-18. Chap
- [Google Scholar]
- Temporal changes in the chemical quality of ground water in Ludhiana area. Current Science. 1994;66:375-378.
- [Google Scholar]
- Environmental geochemistry of Damodar river basin East coast of India. Environmental Geology. 1999;37(1):124-136.
- [Google Scholar]
- Assessment of groundwater quality for drinking and irrigation purposes: a case study of Peddavanka watershed Anantapur District, Andhra Pradesh, India. Environmental Geology. 2005;48:702-712.
- [CrossRef] [Google Scholar]
- Identification of major sources controlling groundwater chemistry from a hard rock terrain—a case study from Mettur Taluk, Salem district, Tamilnadu, India. Journal of Earth System Sciences. 2008;117(1):1-10.
- [Google Scholar]
- Groundwater quality assessment from a hard rock terrain, salem district of Tamilnadu, India. Arabian Journal of Geosciences. 2009;4:91-102.
- [CrossRef] [Google Scholar]
- Assessment of groundwater quality with special emphasis on fluoride contamination in crystalline bed rock aquifers of Mettur region, Tamilnadu, India. Arabian Journal of Geosciences. 2010;5:83-94.
- [CrossRef] [Google Scholar]
- Geochemistry of the Amazon river. The influence of geology and weathering environment on the dissolved load. Journal of Geophysical Research. 1983;88:9671-9688.
- [Google Scholar]
- Aquatic Chemistry. New York: Wiley-Interscience; 1996.
- Groundwater quality in crystalline terrain of Guntur district, Andhra Pradesh, Visakhapatnam. Journal of Science. 1998;2(1):51-54.
- [Google Scholar]
- Geochemistry of groundwater in parts of Guntur district Andhra Pradesh, India,. Environmental Geology. 2002;41:552-562.
- [Google Scholar]
- Seasonal variation of groundwater quality in a part of Guntur district, Andhra Pradesh, India. Environmental Geology. 2006;49:413-429.
- [Google Scholar]
- Groundwater quality and its suitability for drinking and agricultural use in Chithar River Basin, Tamil Nadu, India. Environmental Geology. 2005;47:1099-1110.
- [CrossRef] [Google Scholar]
- Environmental studies on river water quality with reference to suitability for agricultural purposes: Mahanadi river estuarine system, India-a case study. Environmental Monitoring and Assessment. 2009;155:227-243.
- [CrossRef] [Google Scholar]
- Tariqul Islam, 2009. Mechanisms of salt tolerance in crop plants and salinity management, Rivers and Communities: Linking Knowledge, Policy and Practice for Community Based River Basin Management in Southwest Coastal Bangladesh, New Age.
- Ground Water Hydrology. New York: Wiley; 1980.
- Hydrochemical appraisal of groundwater and its suitability in the intensive agricultural area of Muzaffarnagar district, Uttar Pradesh, India. Environmental Geology. 2009;56:901-912.
- [CrossRef] [Google Scholar]
- Diagnosis and Improvement of Saline and Alkali Soils. United States Development Agency Handbook 60. Washington, DC: Government Printing Office; 1954. p. 147
- Characterisation and quality assessment of groundwater with a special emphasis on irrigation utility: Thirumanimuttar sub-basin, Tamil Nadu, India, Arabian. Journal of Geosciences. 2012;5:245-258.
- [CrossRef] [Google Scholar]
- A multiisotope (B, Sr, O, H, and C) and age dating (3H-3He and 14C) study of groundwater from Salinas Valley, California: hydrochemistry, dynamics, and contamination processes. Water Resources Research. 2002;38:9-1-9-17.
- [Google Scholar]
- Hydrochemical characteristics and salinity of groundwater in the Ejina Basin Northwestern China. Environmental Geology. 2005;48:665-675.
- [CrossRef] [Google Scholar]
- WHO, 1996. Guidelines for drinking water quality. Geneva 1, 53-73.
- Classification and Use of Irrigation Water. Washington: USDA; 1955. (Circular 969)
- Major element chemistry of the Huanghe (Yellow River), China: Weathering processes and chemical fluxes. Journal of Hydrology. 1995;168:173-203.
- [Google Scholar]
- Major element chemistry of the Huai River basin, China. Applied Geochemistry. 2011;26:293-300.
- [Google Scholar]
- The hydrochemical characteristics and evolution of groundwater and surface water in the Heihe River Basin, northwest China. Journal of Hydrology. 2008;16:167-182.
- [Google Scholar]
- Characterization of surface water and groundwater in the Damascus Ghotta basin: hydrochemical and environmental isotopes approaches. Environmental Geology. 2006;51:173-201.
- [CrossRef] [Google Scholar]


