Impact of Lake Nasser on the groundwater of the Nubia sandstone aquifer system in Tushka area, South Western Desert, Egypt
-
Received: ,
Accepted: ,
This article was originally published by Elsevier and was migrated to Scientific Scholar after the change of Publisher.
Available online 24 April 2010
Abstract
Lake Nasser recharges the aquifers in study area by large amount of water increasing the groundwater level upward in the study area and decreasing groundwater salinity. The main result of the current study shows that the seepage water from Lake Nasser attains 24 × 106 m3/year. Lake Nasser is located within the Abu Simbil and Sabaya Formations, which are characterized by a high hydraulic permeability and affected by E–W fault system. The groundwater is exploited from Abu Simbil and Sabaya sandstone aquifers. These aquifers exist under confined to unconfined conditions. The groundwater flows towards the north and northwest direction from Lake Nasser.
The groundwater salinity increases towards the northwest direction coinciding with groundwater flow. This water salinity is probably decreased with time. This is mainly referred to the seepage of fresh water from Lake Nasser. The same hypothetical salts are detected in the water of Lake Nasser and the aquifers indicating that the groundwater in the study area is directly recharged from Lake Nasser.
Keywords
Lake Nasser
Groundwater
Tushka
South Western Desert
Egypt
1 Introduction
Tushka area lies in the South Western Desert of Egypt (Fig. 1), occupying an area of about 4700 km2. It is located between longitudes 31°25′ and 32°00′ E and latitudes 22°20′ and 22°55′ N. This area is characterized by an extremely arid climate; showing high air temperature and a relatively short day rainless winter. It has a wide diurnal variations and almost no precipitation.
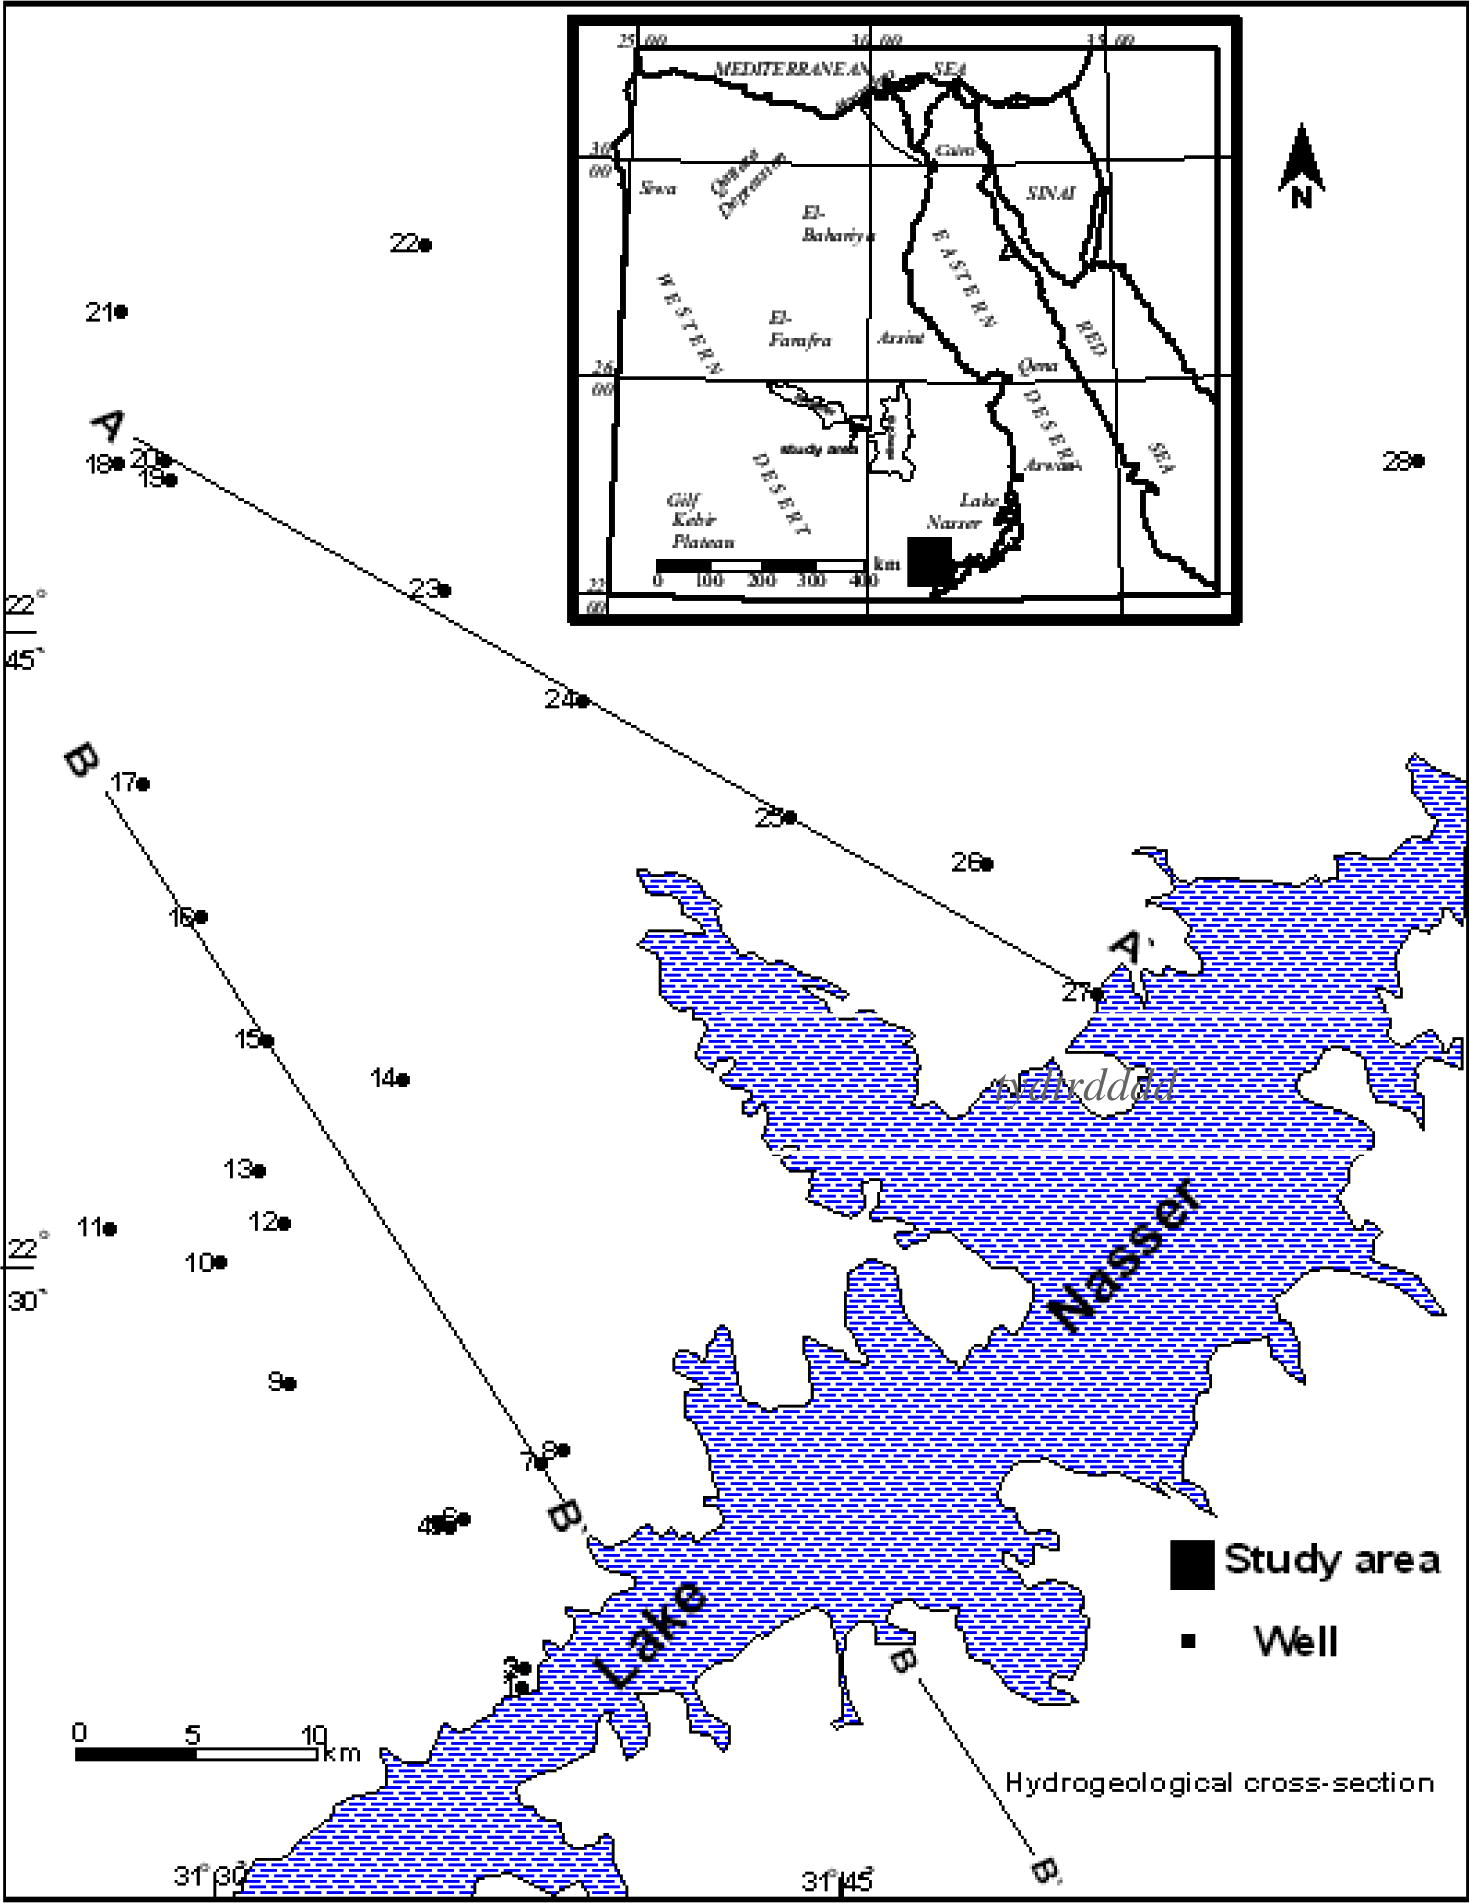
- Location and well location map of study area.
The study area lies within the most promising development zone in the Southern Western Desert, due to its renewable groundwater resource from Lake Nasser. In this promising area, Nubia sandstone aquifer represents the highest groundwater potential, showing various water qualities due to the leaching processes. This groundwater is used for the irrigation and drinking purposes.
The present study is an approach using the hydraulic parameters of the Sabaya and Abu Simbil sandstone aquifers to calculate the recharging rate from Lake Nasser. This study deals with the subsurface geology, hydrogeology and hydrochemistry of the study area.
2 Geological setting
The exposed rocks in the investigated area consist of basement and sedimentary rocks. The Precambrian basement rocks are exposed on the surface due the northwest of the study area. These rocks are recognized along the axis of Nakhlai–Aswan Uplift (Fig. 2). This uplift separates the Dakhla Basin (Kharga and Dakhla Oases) from Lake Nasser Basin (study area). The sedimentary cover is relatively thin in the northwest of the study area, where the depth to basement varies between 50 and 100 m. Kiseiba claystone Formation overlies directly the Precambrian basement rocks in this area (Ghoubachi, 2004).
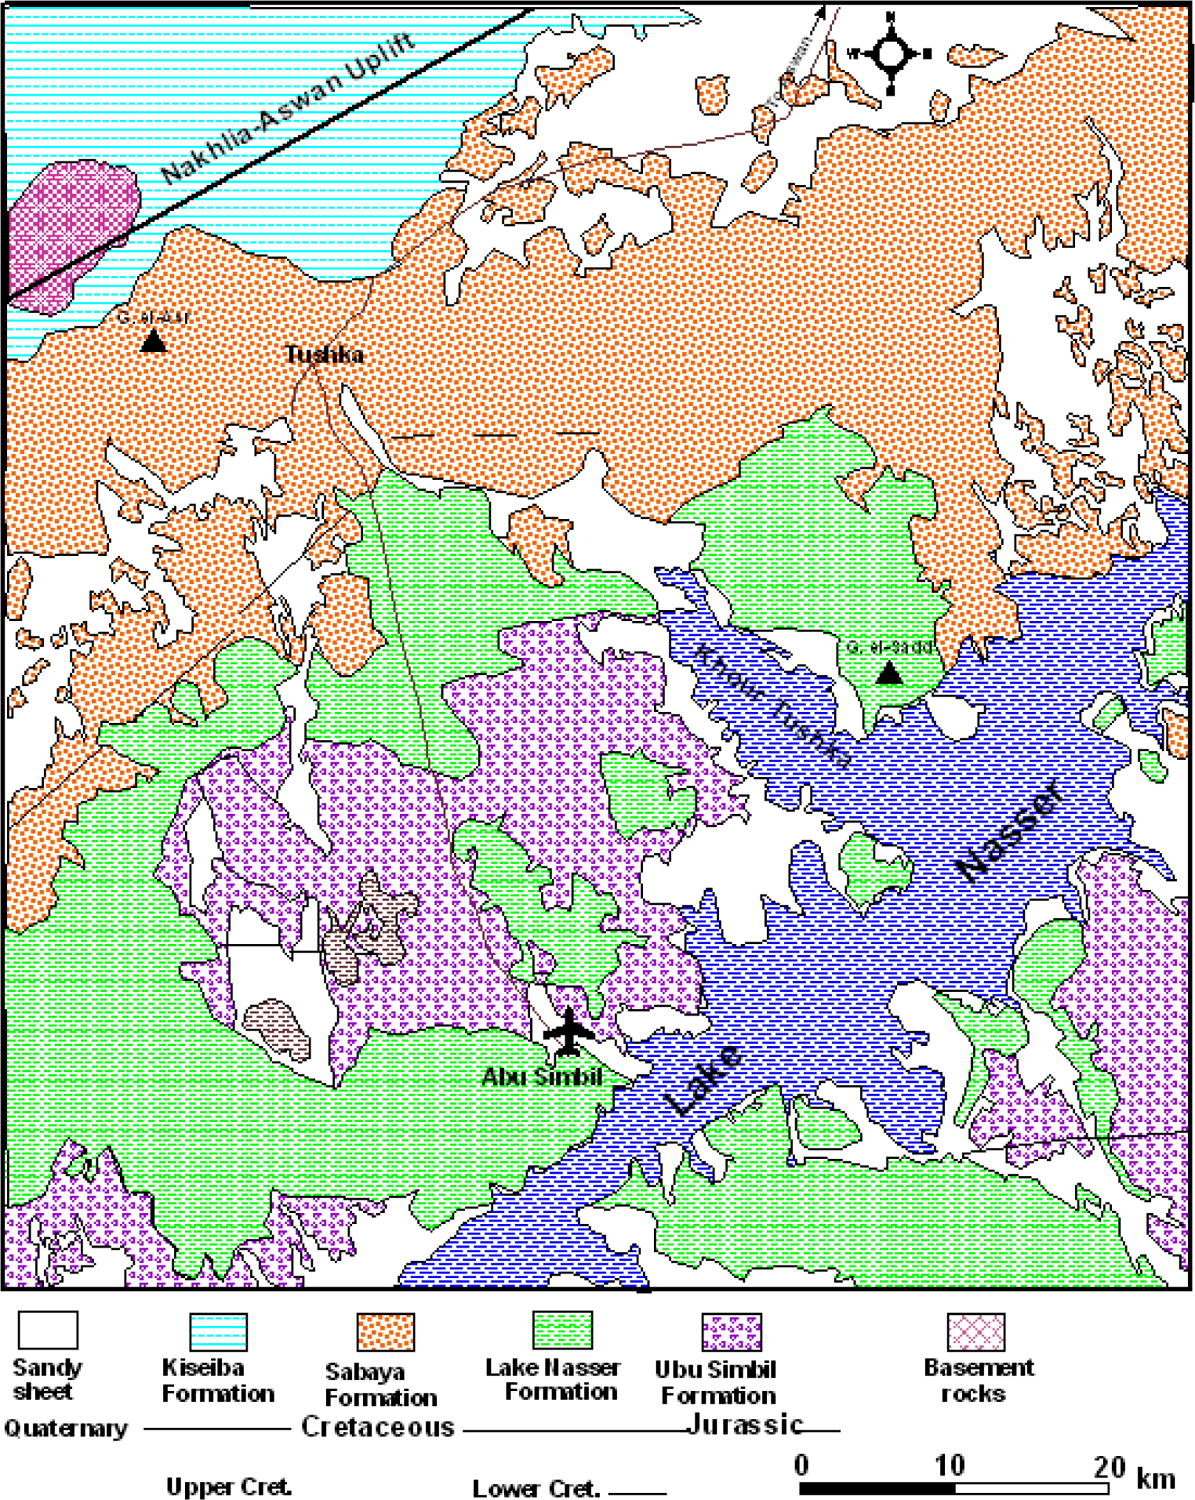
- Geological map of the study area (after CONOCO (1987)).
The basement relief map is compiled as based on the data of the drilled wells (Fig. 3). It indicates that the altitude of the basement surface varies between +20 m at northeast (Nakhlai–Aswan Uplift) to −380 m nearby the Lake Nasser (well no. 27). The map also shows that the thickness of the sedimentary cover increases towards the Lake Nasser.
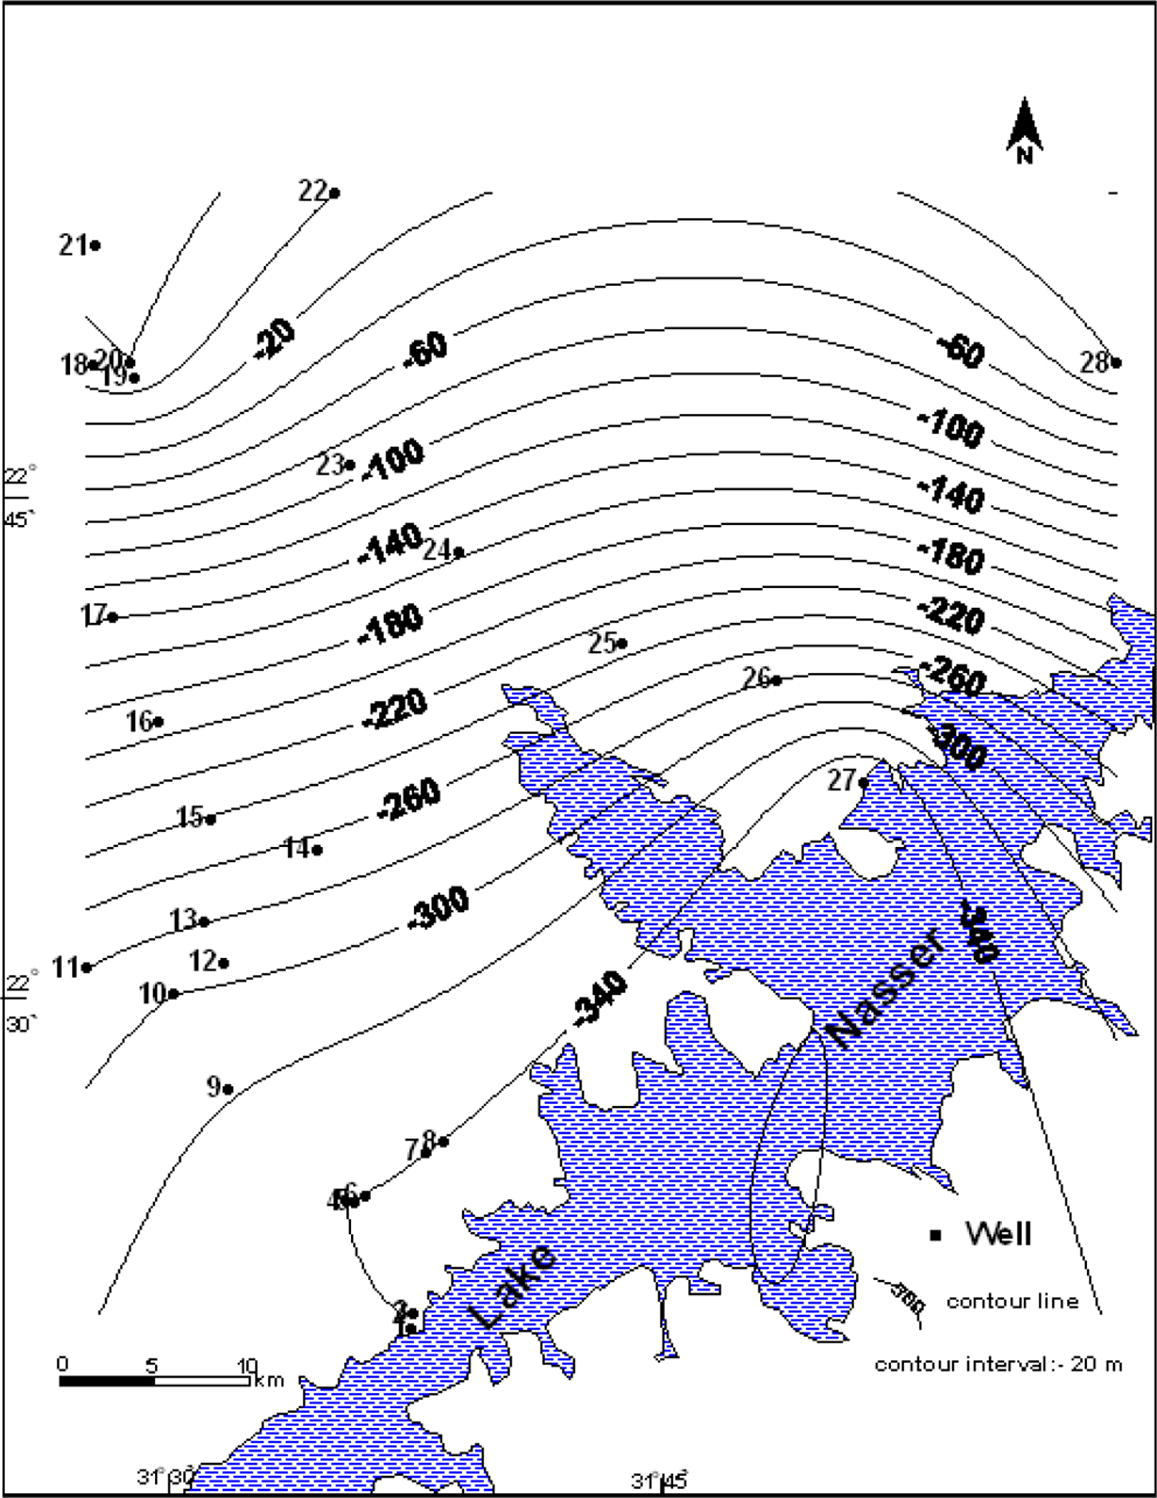
- Basement surface level contour map of the study area.
The majority of the study area is located in the Lake Nasser Basin and its surface is occupied by the Nubia sandstone sequences with some basement and basaltic outcrops. This basin is dissected by E–W and N–S faults systems. The E–W faults system plays very important role in recharging the concerned aquifer from Lake Nasser. This sedimentary succession is subdivided into the following three rock units; from base to top as the following:
Abu Simbil Formation (the oldest sedimentary unit).
Lake Nasser Formation (claystone).
Sabaya Formation.
These rock units are partly exposed on the surface of the study area (Fig. 2).
3 Hydrogeology
The Nubia sandstone aquifer is built up of two connected water bearing formations namely Sabaya and Abu Simbil. Abu Simbil water bearing formation represents the main aquifer in the study area. These aquifers are hydraulically connected with each other as a result of faulting displacement (Fig. 4). More than 150 productive wells and piezometers had been drilled, tapping Abu Simbil and Sabaya aquifers. The above-mentioned water bearing formations will be discussed from top to base as discussed in the following sections.
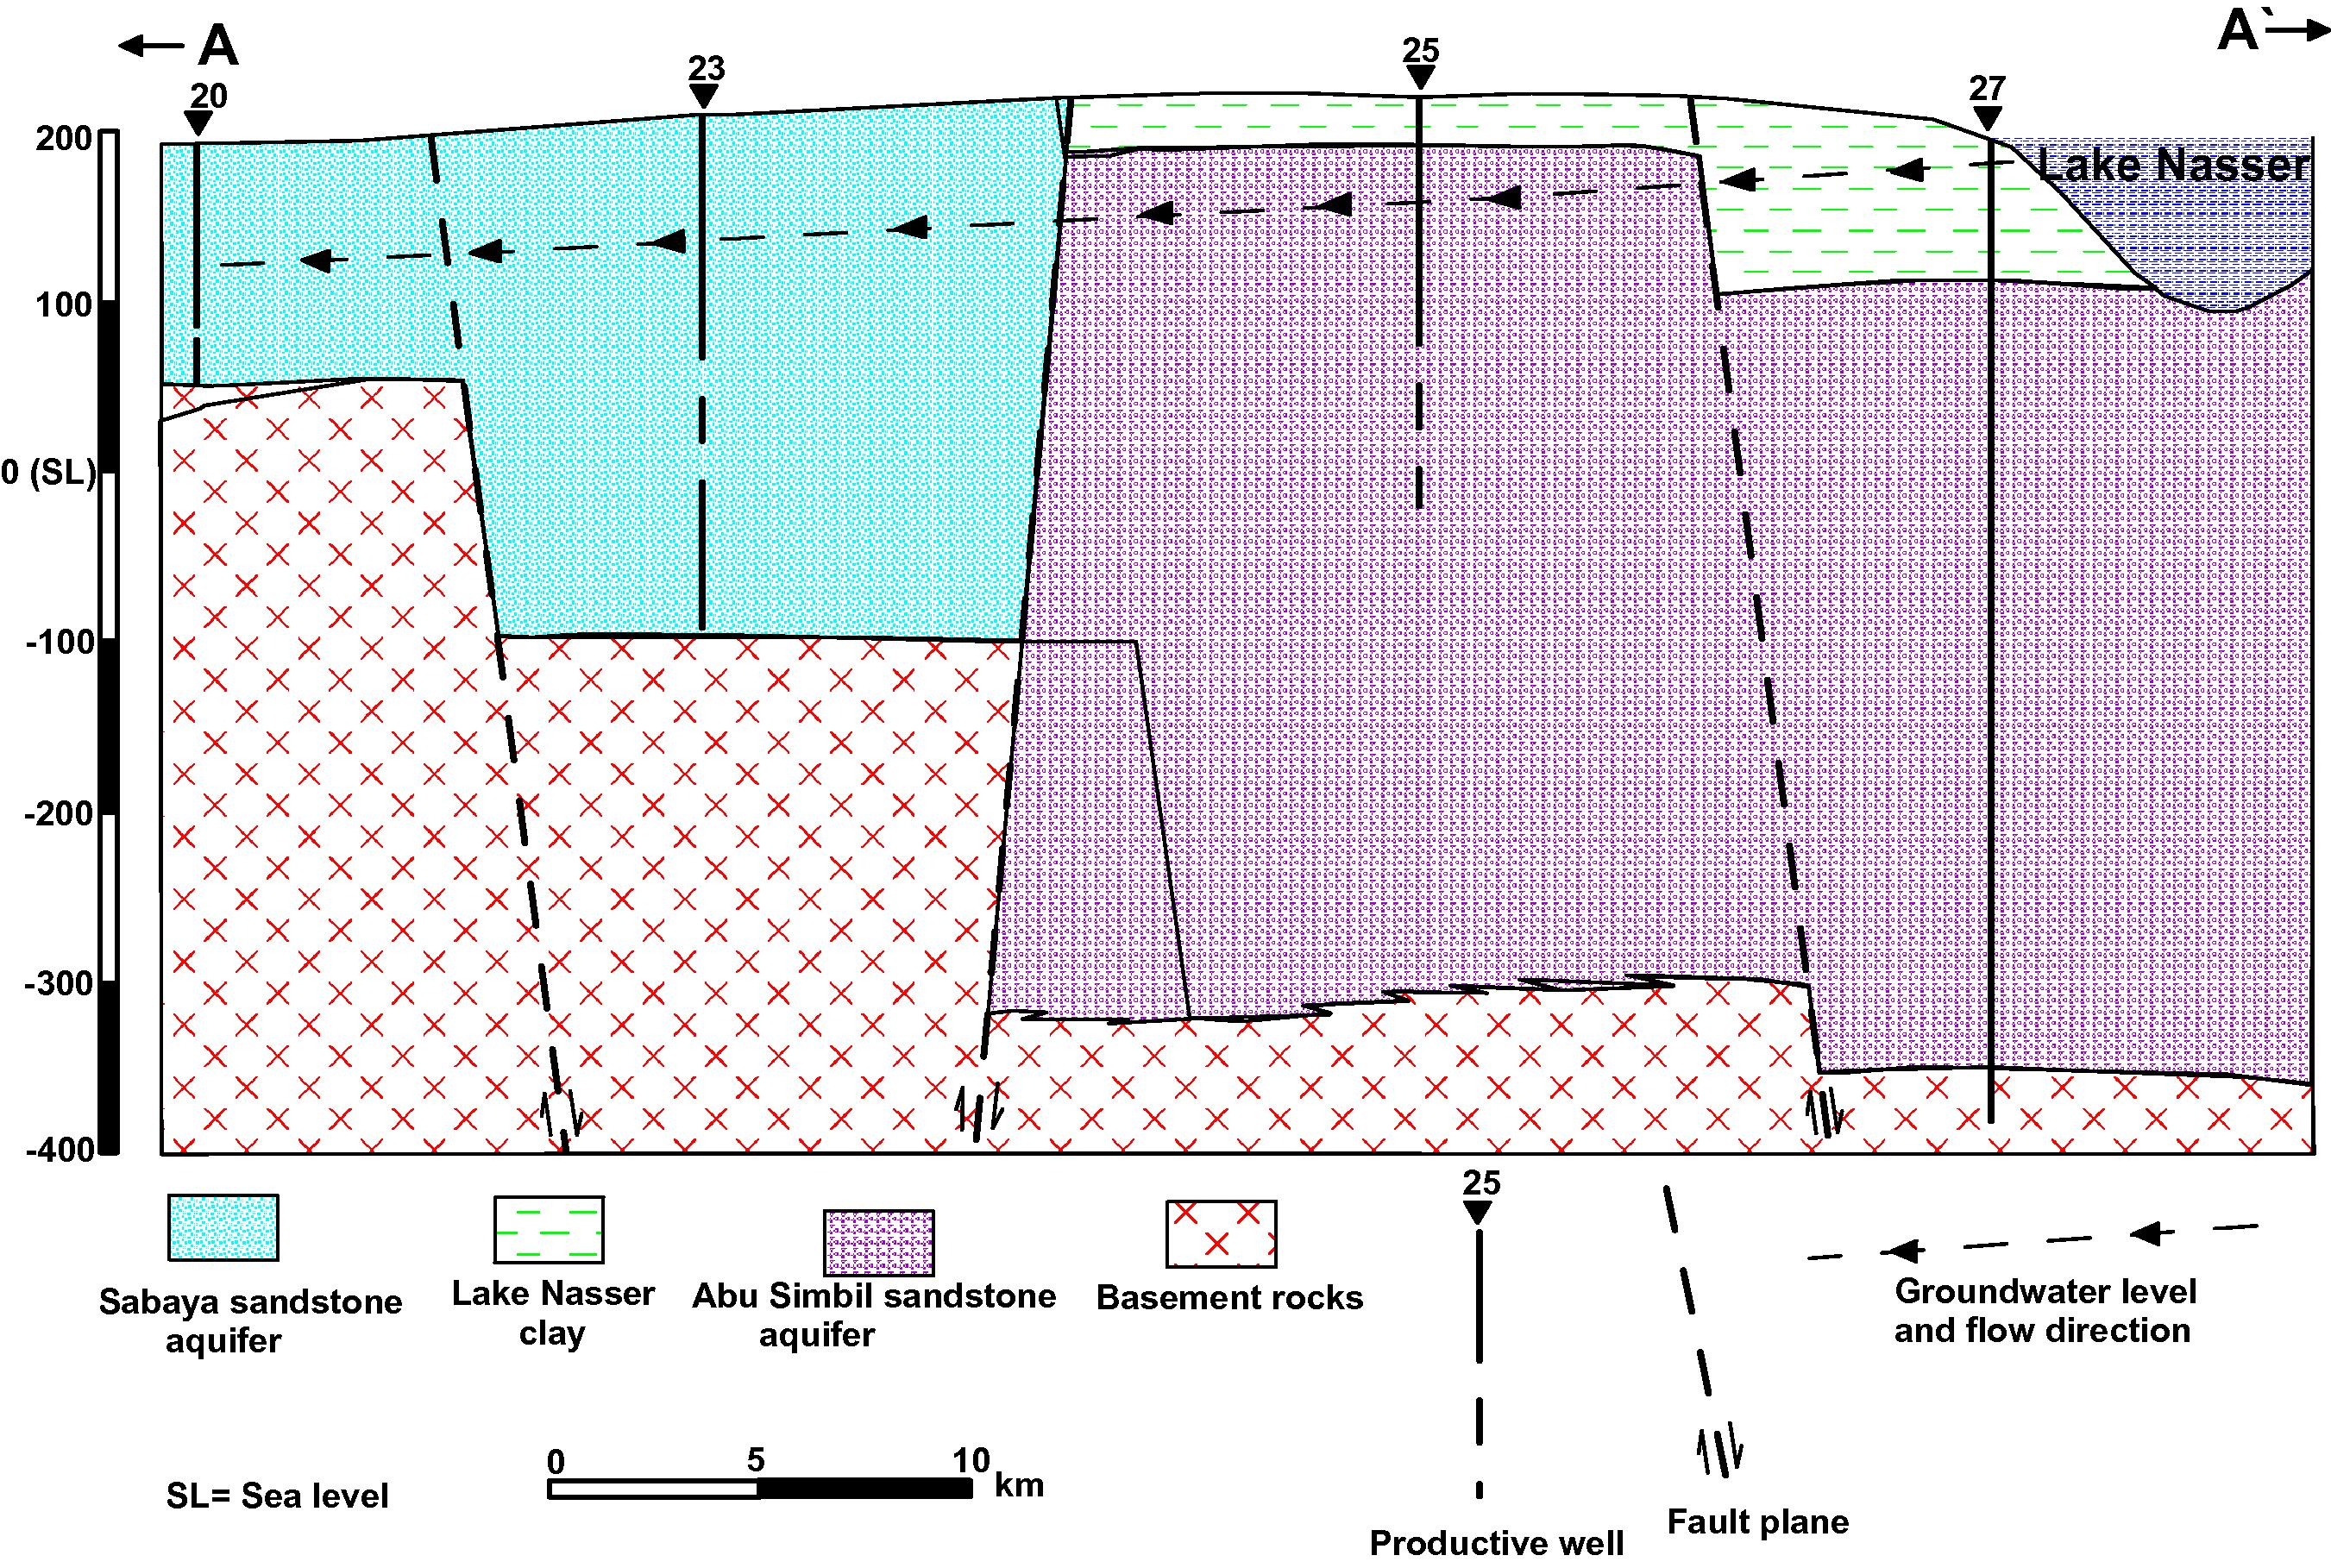
- Hydrogeological cross-section (A–A′) in study area.
3.1 Sabaya sandstone aquifer
Sabaya Formation is exposed on the surface in the study area and overlies directly the Precambrian basement rocks in the northeastern portion of the study area (Fig. 4). It is composed of fine to very coarse grained sandstone with claystone interbeds. This aquifer is hydraulically connected with Lake Nasser water at northeast of the study area. It is assigned to Albian–Cenomanian age (Schrank, 1987). The thickness of this formation varies from 169 m (well no. 20) to 235 m (well no. 23), while its saturated thickness ranges from 113 m (well no. 20) to 153 m (well no. 23) as shown in Table 1. This aquifer exists under semi-confined conditions and is hydraulically connected with Abu Simbil sandstone aquifer as a result of faulting displacement (Fig. 4).
| Well name | Well no. | Total depth (m) | Water level (masl) | Screen interval (m) | Saturated thickness (m) | T (m2/day) | Salinity (ppm) | |
|---|---|---|---|---|---|---|---|---|
| From | To | |||||||
| Water station | 1 | 112 | 80 | 110 | 91 | 228.61 | ||
| Tushka 86 | 7 | 132 | 161 | 73 | 125 | 110 | 459.22 | |
| Tushka 66 | 10 | 220 | 136.05 | 142 | 199.5 | 151.05 | 352a | 518 |
| Tushka 78 | 11 | 220 | 123.52 | 140 | 209 | 138.52 | 627a | 571 |
| Tushka 43 | 12 | 250 | 141.44 | 135 | 222 | 179.44 | 337a | 511.45 |
| Tushka 60 | 13 | 220 | 130.93 | 132 | 210.5 | 145.93 | 422a | 558.9 |
| Tushka 46 | 14 | 250 | 159.87 | 130 | 210.5 | 198.87 | 735a | 730 |
| Tushka 49 | 20 | 195 | 120.42 | 120 | 160.25 | 120.42 | 1873 | 1162.52 |
| Tushka 48 | 19 | 250 | 134.9 | 120 | 183.25 | 187.9 | 838 | 1336.68 |
| Disco 12 | 23 | 250 | 134 | 235 | 1730 | 990 | ||
| Moubarak 1 | 25 | 230 | 151.79 | 135 | 220 | 169.79 | 2313 | 595.08 |
| W2 | 27 | 553.6 | 125 | 493.59 | ||||
| Ow 8 | 28 | 224 | 138.18 | 755.97 | ||||
In the present work, the hydraulic parameters are determined as based interpretation of geophysical well logging and pumping tests. The average effective porosity of this aquifer is 26%. The transmissivity of the investigated aquifer ranges from 365 m2/day (well no. 22) to 931 m2/day (well no. 17). The average hydraulic conductivity is 4.5 m/day.
3.2 Abu Simbil sandstone aquifer
Abu Simbil Formation is partly exposed on the surface in study area at both sides of Lake Nasser (Fig. 2). It represents the oldest sedimentary rock unit in the investigated area and overlies directly the Precambrian basement rocks and underlies the Lake Nasser Formation. This aquifer belongs to Late Jurassic–Aptian age (Klitzsch, 1986). Abu Simbil Formation is mainly composed of fine to very coarse grained and granules sands and sandstone with few claystone interbeds. The estimated thickness of this aquifer in subsurface is recognized from fully penetrated wells, where it ranges from 109 m (well no. 10) to 500 m (well no. 27). The saturated thickness ranges from 91 m (well no. 1, partially penetrated) to 493.59 m (well no. 27) as shown in Table 1. It exists under semi-confined conditions (Fig. 5).
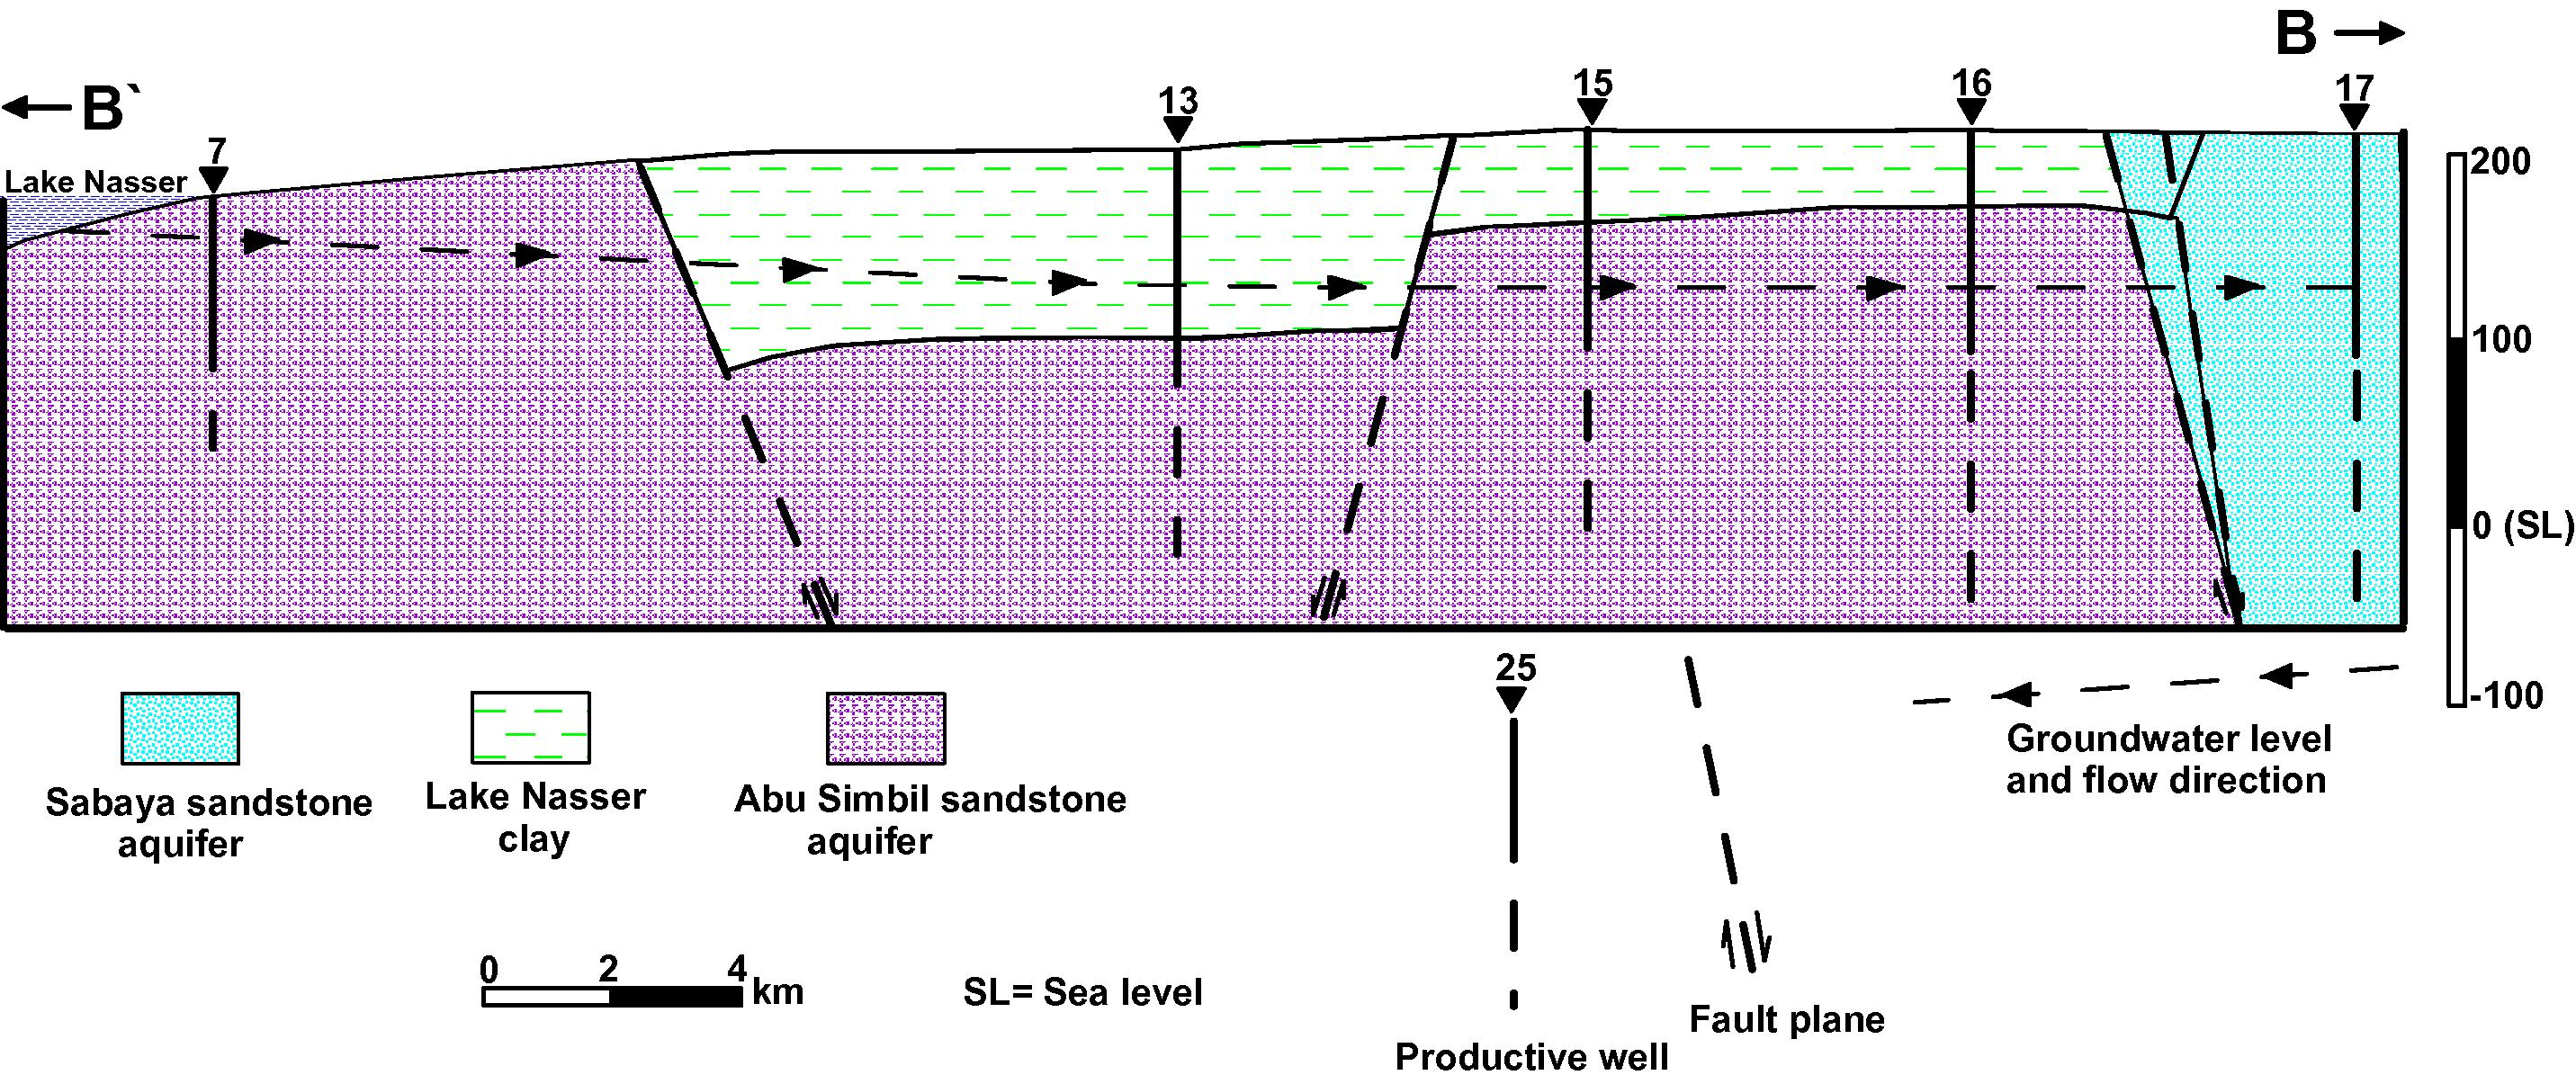
- Hydrogeological cross-section (B–B′) in study area.
In the present work, the hydraulic properties of the present are calculated based on geophysical well logging and pumping tests. The average effective porosity of this aquifer reaches 24%, which estimated by using geophysical well logging data applying Archie equations (1942). The transmissivity of the investigated aquifer ranges from 352 m2/day (well no. 10) to 2313 m2/day (well no. 25). The hydraulic conductivity varies from 1 m/day (well no. 10) to 5.8 m/day (well no. 25).
The transmissivity distribution map is compiled for the Nubia sandstone aquifer, where the aquifers in the study area are hydraulically connected (Fig. 6) revealing that the transmissivity of these aquifers increases towards the northeast direction as a function of the intensity of faulting processes.
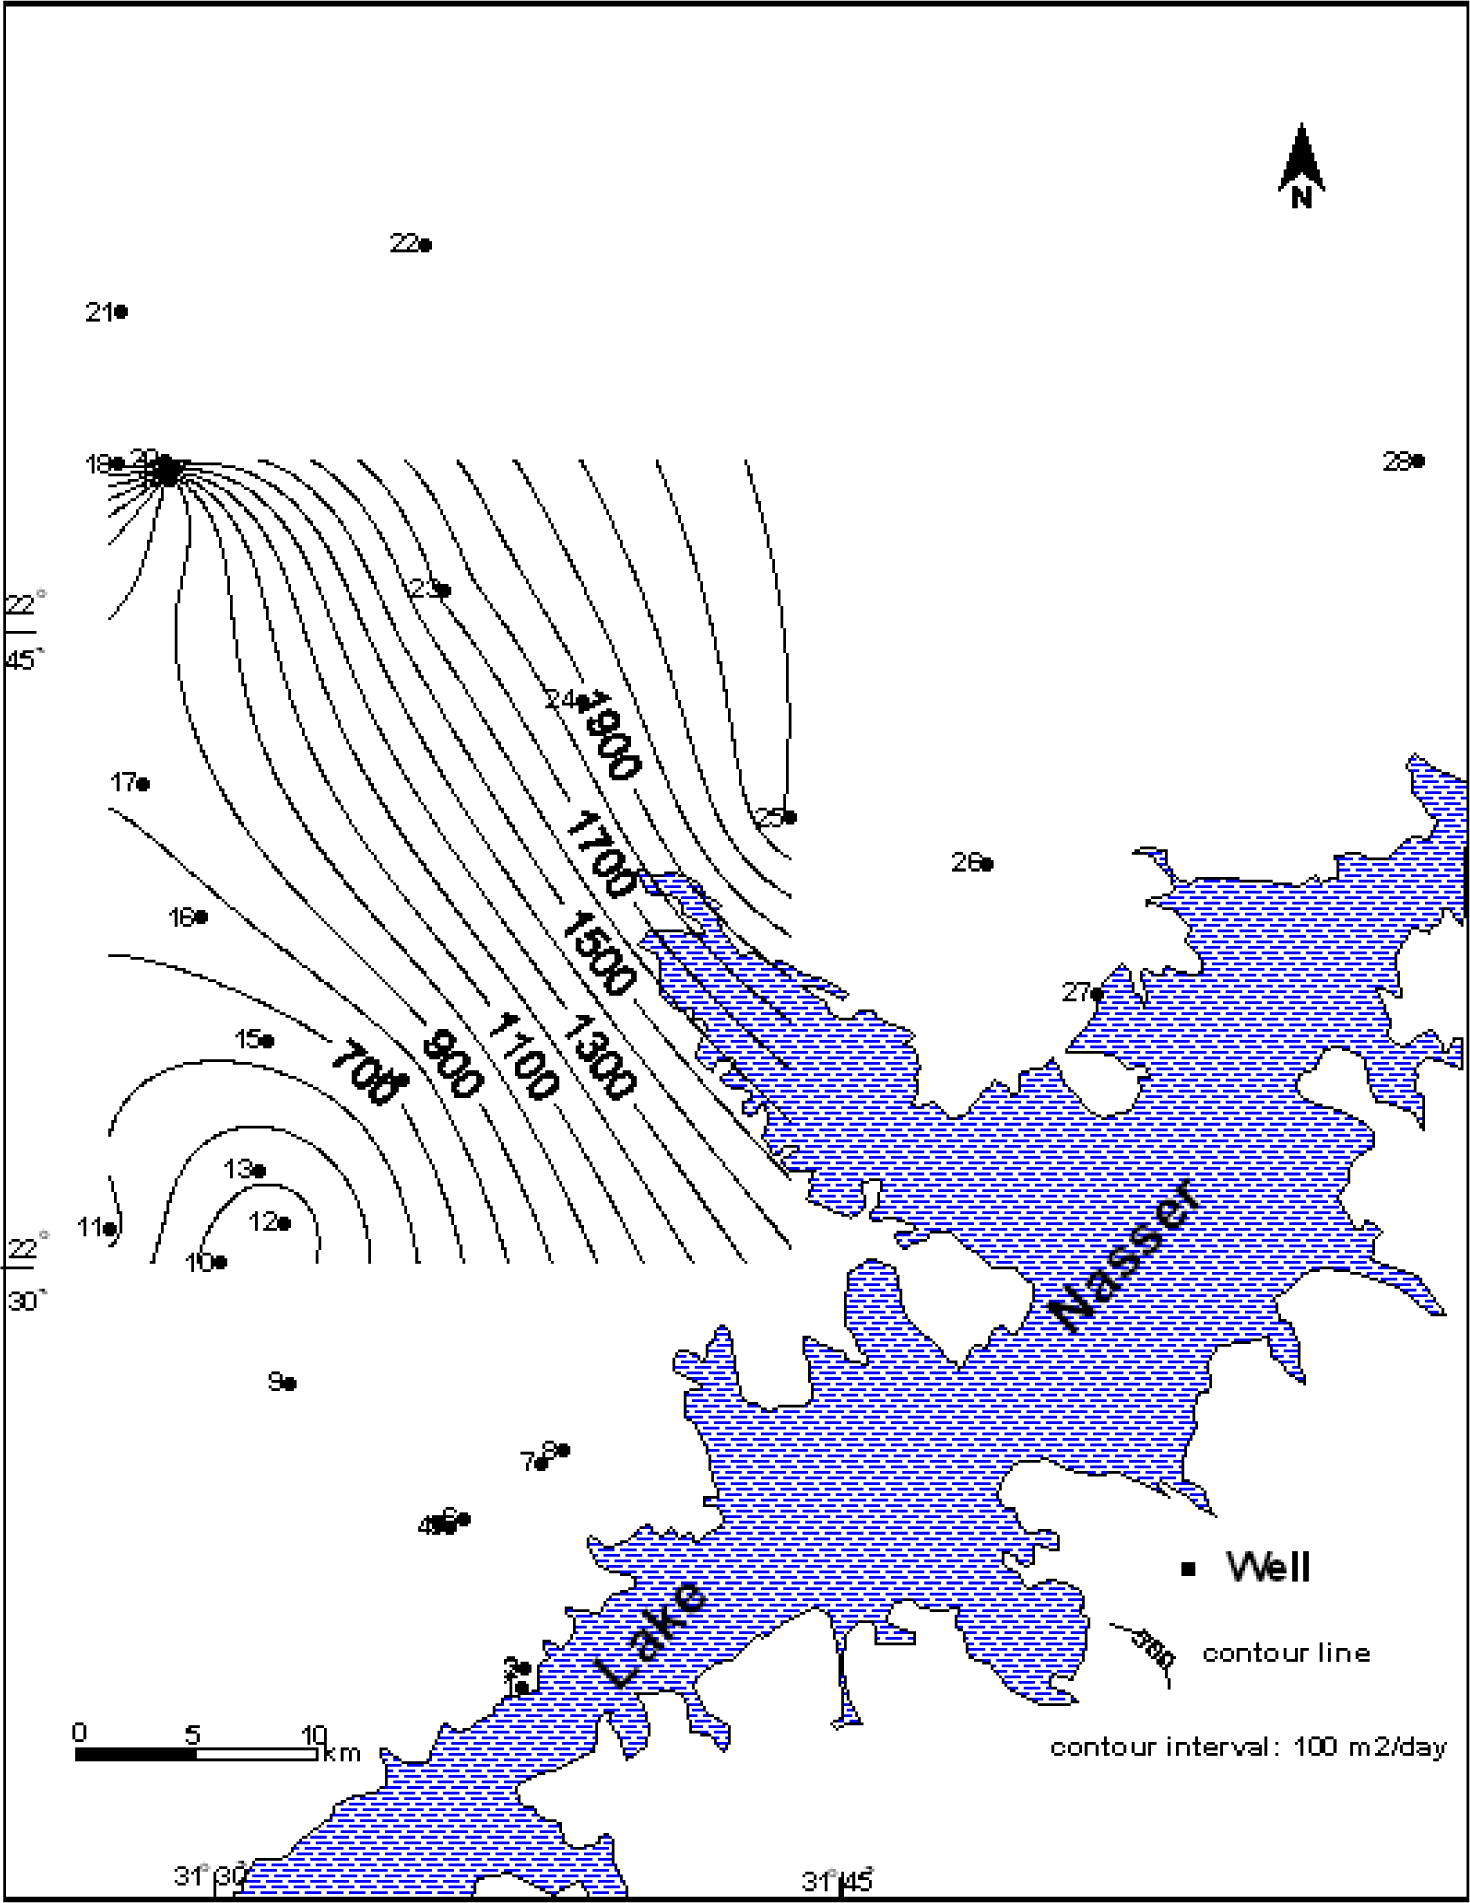
- Transmissivity distribution map of the Nubia sandstone aquifer.
3.2.1 Lake Nasser and its impact on groundwater
Lake Nasser is the southern part of Egypt. Its length is approximately 500 km, while its depth reaches 130 m. The maximum elevation of water from sea level is 183 m. Lake Nasser formed after the constructed Aswan High Dam. It is directly in contact with the high permeable Sabaya and Abu Simbil rock units.
The water level in this lake varies from 121 masl (1964) to 178 m (1978). It is declined to 158 m in 1987. The water level started to rise again reaching 182 masl at 1997 (Fig. 7). This latest rise in lake level caused the Lake Nasser waters to overflow through Khour Tushka in northwest direction and created four lakes northwest of Lake Nasser in the Tushka depression. These lakes are still found in Tushka depression, but their sizes decreased with time due to the high evaporation during summer months and lake downward.
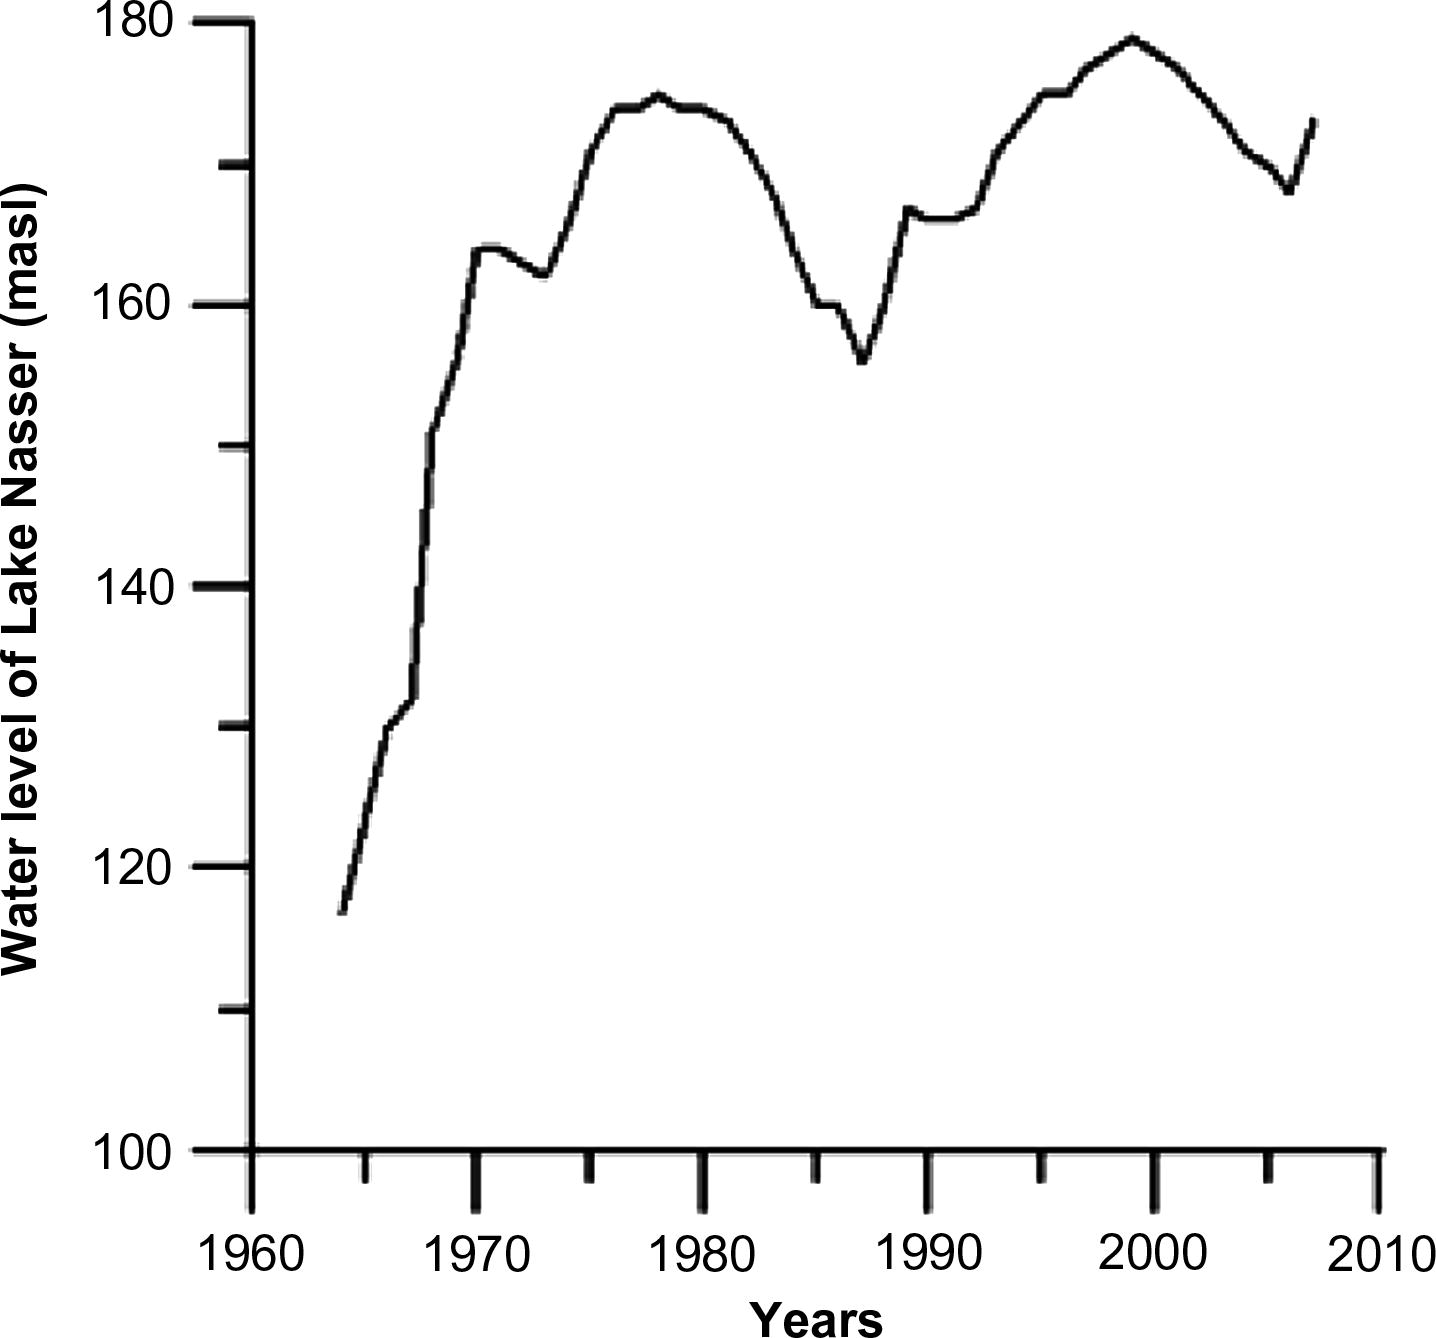
- Showing annual water level of Lake Nasser.
The water level of a piezometer lying west of Lake Nasser (well no. 27) was measured four times as follows; 31/12/1965 (during the period of constructed of High Dam), 25/10/1969, 2/12/1979 and 22/7/1996 (Ahmed, 1996). These measured water levels are reported as following, respectively; 113.2, 114.41, 164 and 168.22 masl (Fig. 8). By correlating the increasing of the groundwater levels and the water level of Lake Nasser are coincided reflecting the recharging from Lake Nasser into the Nubia sandstone aquifer. This increase reaches about 55 m through 31 year.
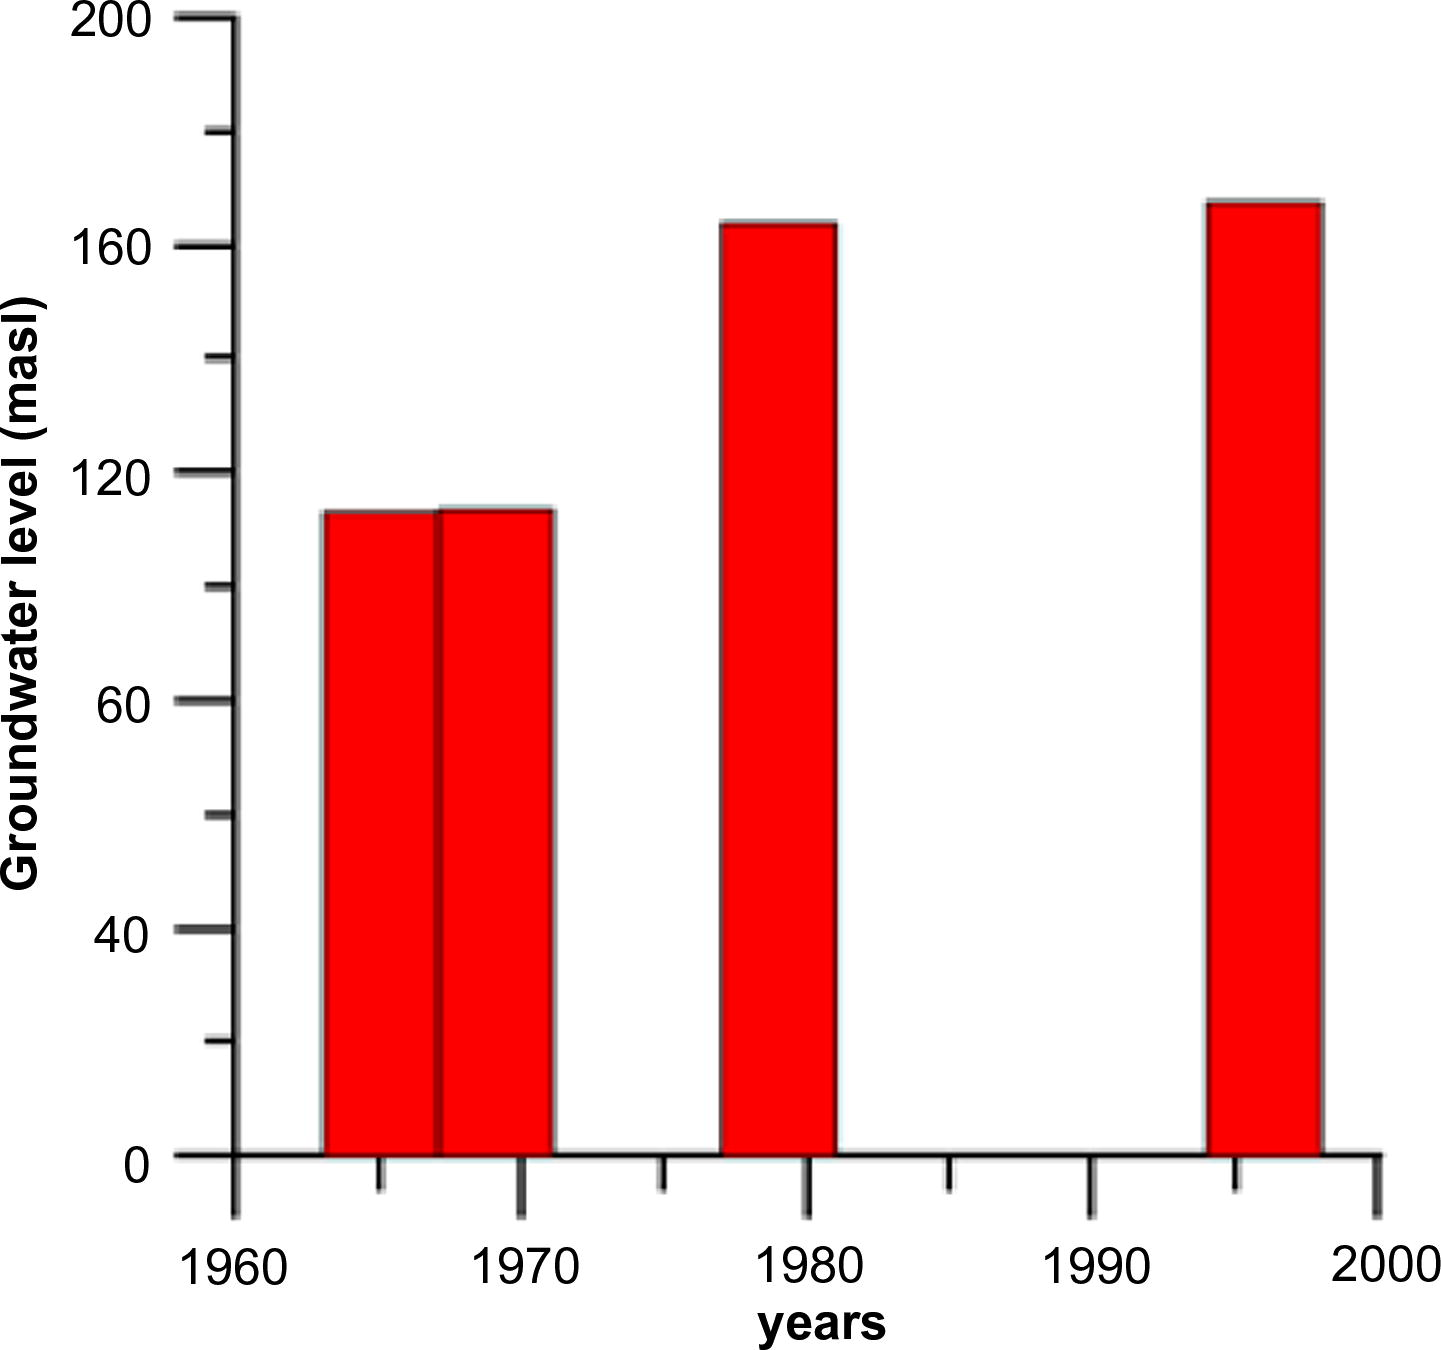
- Histogram showing annually groundwater level of well no. 27.
3.2.2 Water level and groundwater flow
In the present work, the depth to water was measured in December 2006 for some productive wells and piezometers during the field work in the investigated area. The depth to groundwater varies from 10.45 m (well no. 2) to 91.3 m (well no. 16). The depth to water increases away from the Lake Nasser due to the ground elevation.
A comparison of water level in years 2002 (by REGWA) and 2006 shows that the water level increases upward with time shown in Table 2. The average rise of groundwater level is 0.78 m/year. The hydraulic conductivity across the fault zone is assumed to be five times higher than along fault plane (Sallam, 2002). Hence, the fault systems are playing an important role in recharging the groundwater aquifers in the studied area.
| Well no. | Elevation (masl) | Water level 2006 (masl) | Water level 2002 by REGWA (masl) |
|---|---|---|---|
| 4 | 180 | 169.55 | – |
| 6 | 185 | 161.43 | – |
| 10 | 205 | 136.05 | 135 |
| 11 | 205 | 123.52 | 121.87 |
| 14 | 211 | 159.87 | 157.3 |
| 15 | 204.5 | 130.9 | 127.72 |
| 16 | 216 | 124.7 | 120.92 |
| 19 | 197 | 134.9 | 124.36 |
| 24 | 180 | 136 | 130 |
| 25 | 212 | 151.79 | 148.17 |
| 28 | 215 | 138.18 | 135.18 |
Sabaya and Abu Simbil sandstone aquifers are laterally hydraulically connected with each others by faulting displacement (Figs. 5 and 6). The groundwater level of the system ranges from 123.52 masl (well no. 11) to 169.55 m (well no. 4). The piezometric surface map and flow net (Fig. 9) indicate that the groundwater flow direction due to north and northwest. The estimated hydraulic gradient is 0.0012 m/m averagely.
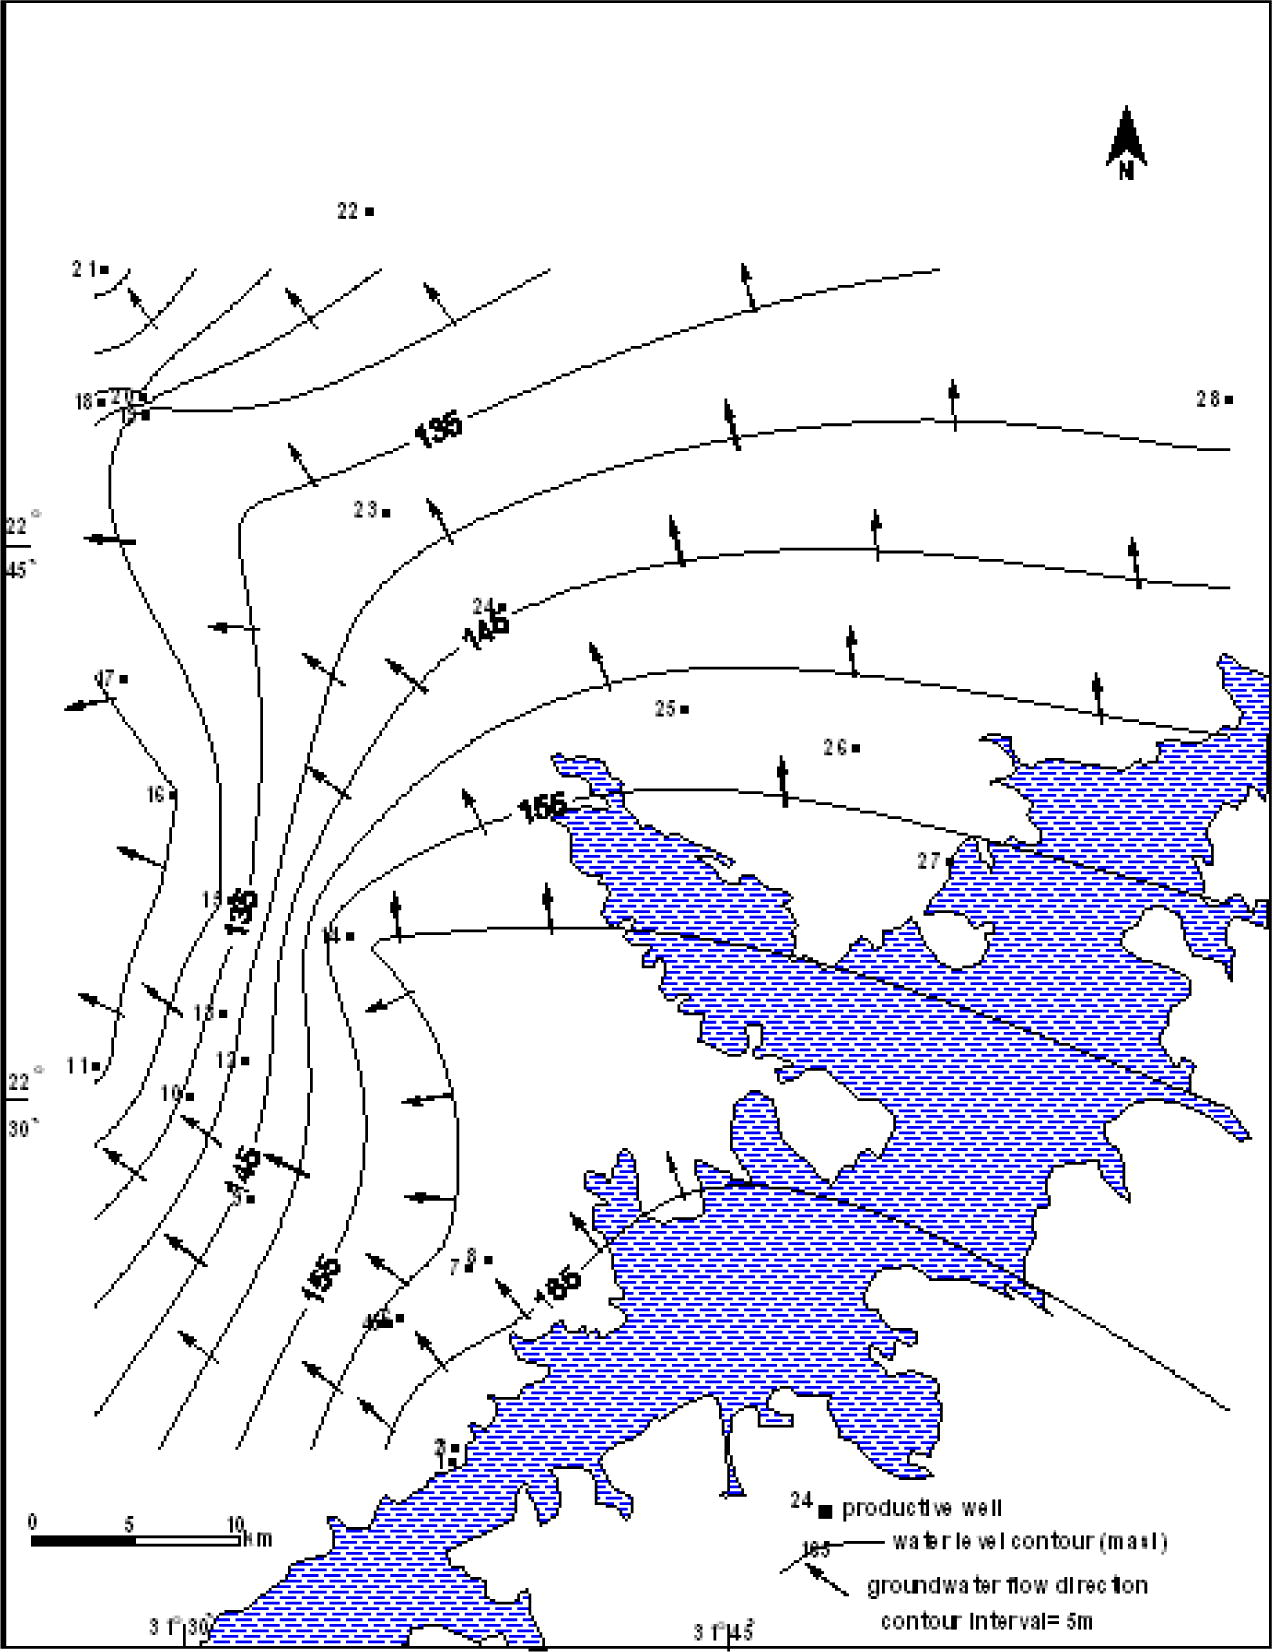
- Piezometric level map of the Nubia sandstone aquifer (December, 2006).
3.2.3 The recharging rate from Lake Nasser
As mentioned above, the Lake Nasser is hydraulically connected with the aquifers in study area. The water level contour map shows that the groundwater in study area is recharged from Lake Nasser. The present study used the hydraulic parameters (transmissivity and hydraulic gradient of the aquifer), which are essential in water seepage calculation.
Darcy’s law (1856) is applied to calculate the amount of recharge from Lake Nasser to the adjacent aquifers:
In the present work, the estimated recharge of the aquifers from Lake Nasser reaches 67 × 103 m3/day. The annually recharge from Lake Nasser attains about 24 × 106 m3/year.
4 Hydrochemistry
Groundwater samples for chemical analyses were obtained from 16 productive wells and one surface sample from Lake Nasser in Abu Simbil City. Each well was pumped at least 12 h before sampling. These groundwater samples represent the Nubia sandstone aquifers (Sabaya and in Abu Simbil) in study area. Sampling was carried out in December, 2006. The major elements Na+, K+, Ca2+ and Mg2+ ions cations, and Cl−,
| Well no. | TDS (ppm) | Ions (ppm) | ||||||
|---|---|---|---|---|---|---|---|---|
| Ca++ | Mg++ | Na+ | K+ |
|
|
Cl− | ||
| Lake | 170.85 | 36.07 | 4.86 | 12 | 8 | 100.2 | 35 | 24.82 |
| 1 | 228.61 | 54.11 | 10.94 | 13 | 7 | 195.2 | 30 | 15.96 |
| 4 | 345.92 | 68.14 | 4.86 | 45 | 4 | 122 | 92 | 70.92 |
| 5 | 448.4 | 70.14 | 8.51 | 75 | 4 | 134.2 | 135 | 88.65 |
| 7 | 459.22 | 72.14 | 7.29 | 75 | 4 | 122 | 160 | 79.79 |
| 9 | 464.53 | 72.14 | 8.51 | 70 | 6 | 122 | 160 | 86.88 |
| 12 | 511.45 | 68.14 | 13.37 | 90 | 6 | 46.4 | 165 | 95.74 |
| 13 | 558.9 | 94.19 | 9.73 | 85 | 6 | 122 | 170 | 132.98 |
| 18 | 1737.72 | 180.36 | 32.83 | 370 | 8 | 122 | 660 | 425.53 |
| 19 | 1336.68 | 148.3 | 24.32 | 285 | 7 | 97.6 | 380 | 443.26 |
| 20 | 1162.52 | 140.28 | 23.1 | 230 | 8 | 109.8 | 380 | 326.24 |
| 21 | 1098.01 | 180.36 | 26.75 | 160 | 6 | 158.6 | 330 | 315.6 |
| 22 | 577.34 | 80.16 | 12.16 | 100 | 7 | 122 | 200 | 117.02 |
| 23 | 990 | 128.26 | 17.02 | 190 | 6.5 | 122 | 300 | 287.22 |
| 24 | 646.89 | 100.2 | 7.29 | 118 | 6 | 122 | 170 | 184.4 |
| 25 | 595.08 | 88.18 | 7.29 | 110 | 4 | 109.8 | 180 | 150.71 |
| 26 | 560.08 | 70.14 | 12.16 | 105 | 6 | 97.6 | 185 | 132.98 |
4.1 Groundwater salinity
The majority of groundwater samples (16 sample) of the Nubia sandstone aquifer in the study area belong to freshwater type (<1000 ppm) according to Tood (1980). It ranges from 228.61 ppm at south (well no. 1 of Abu Simbil water station) to 990 ppm at north (well no. 23). Three groundwater samples (wells nos. 18, 20 and 19) belong to breakish water (1000–10,000 ppm) where their salinity reaches 1737.72, 1162.52 and 1336.68, respectively (Table 3). They are located in the northwest of study area. Lower groundwater salinity is recognized beside the lake. It is attributed to the seepage of fresh water from Lake Nasser. On the other hand, the higher salinity of the groundwater is attributed to the great intercalations of clay.
The groundwater salinity map for the period December, 2006 (Fig. 10) reveals an increasing of groundwater salinity towards the northwest directions coinciding with groundwater flow.
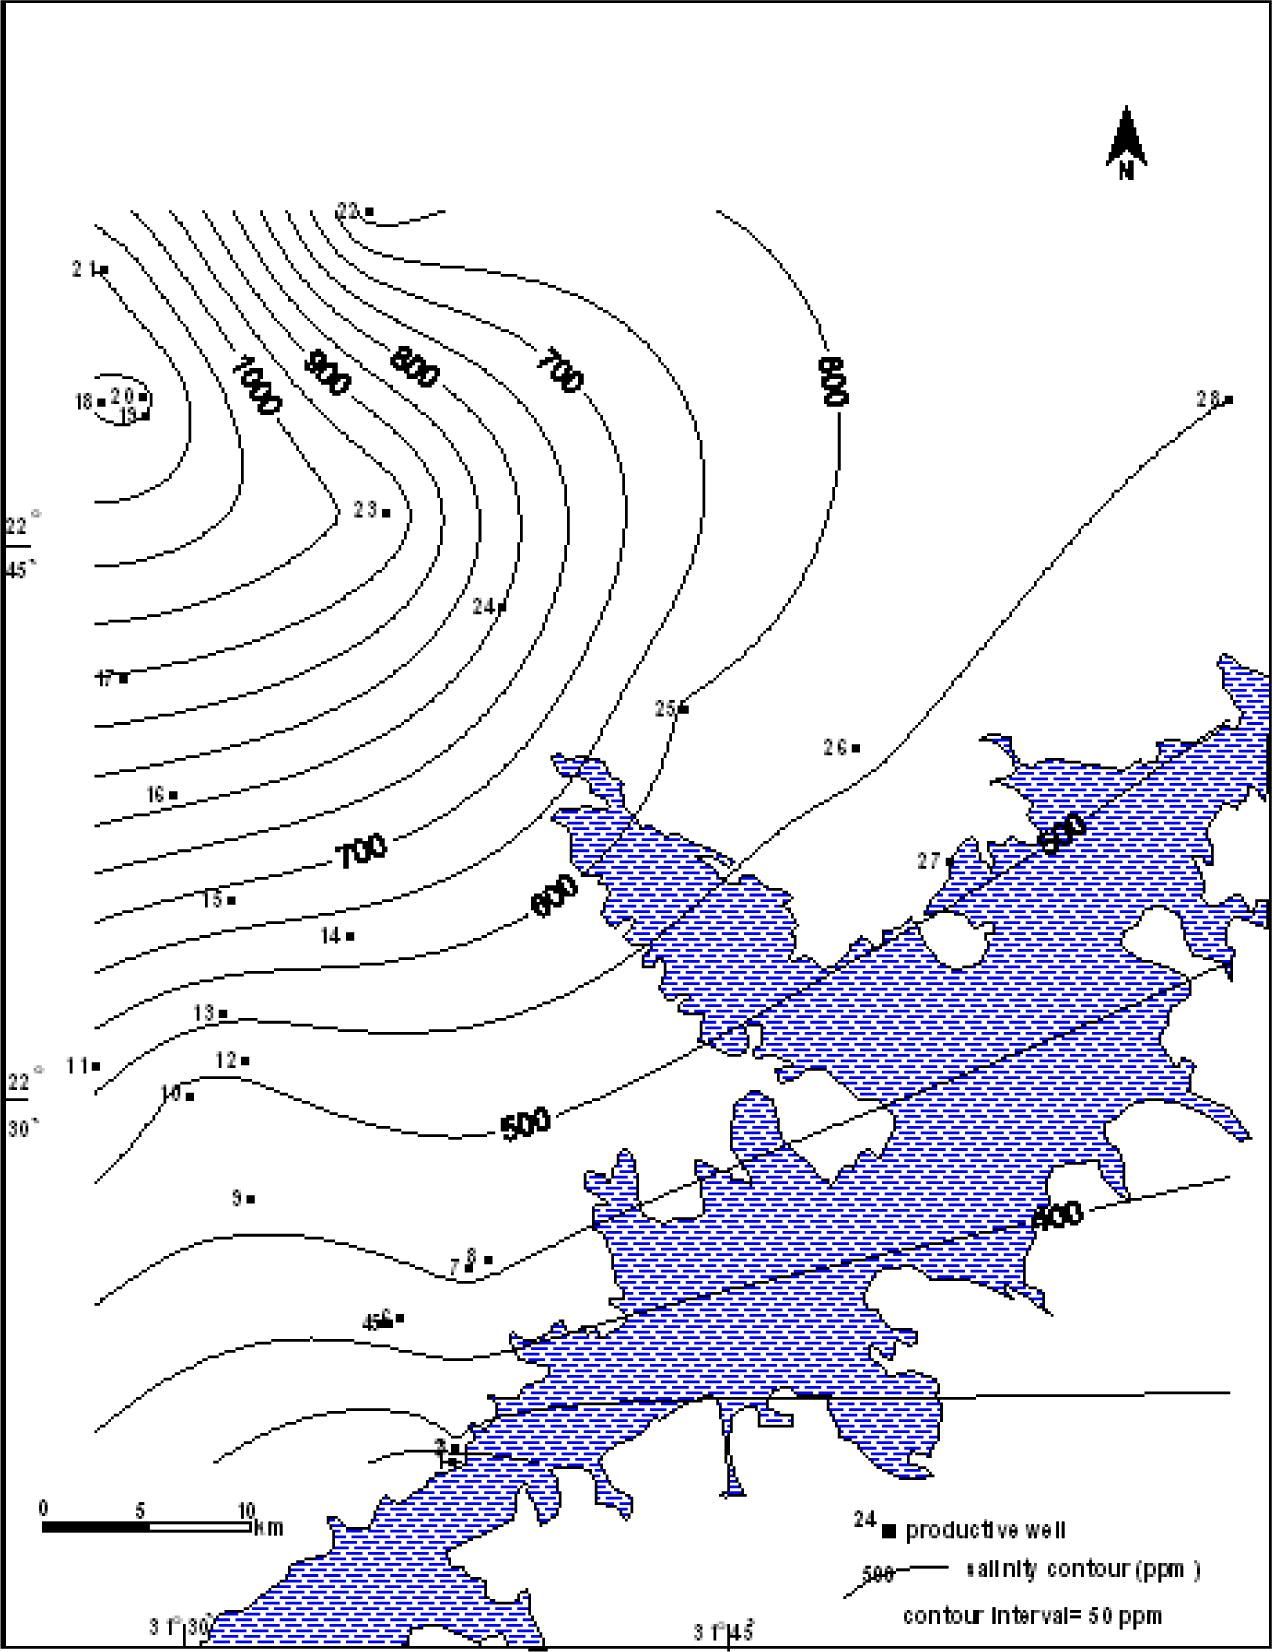
- Distribution map of the groundwater salinity of study area (December, 2006).
The correlation of the results of 2003, 2004 and 2006 for the same productive wells in study area reveals the decreasing of salinity with time (Table 4). This is referred to the seepage of the fresh water from the recharging area (Lake Nasser).
| Well no. | Groundwater salinity (ppm) | ||
|---|---|---|---|
| Shedid (2006) | Present study | ||
| 12/2003 | 4/2004 | 12/2006 | |
| 7 | 576 | 459.22 | |
| 12 | 544 | 598.4 | 511.45 |
| 18 | 2055.2 | 1888 | 1737.72 |
| 19 | 1542.4 | 1555.2 | 1336.68 |
| 20 | 1222.4 | 1353.6 | 1162.52 |
| 22 | 672 | 560.08 | |
| 23 | 1190.4 | 1024 | 990 |
| 24 | 691.2 | 755.2 | 646.89 |
| 25 | 697.6 | 640 | 595.08 |
4.2 Ion ratios
These ratios are useful in detecting the previous hydrochemical processes affecting on the water quality as leaching, mixing and ion exchange. The calculated values of some interesting hydrochemical coefficient ratios are determined. They indicate the following remarks (Table 5).
| Well no. | Hydrochemical coefficients | Hypothetical salts | ||||||
|---|---|---|---|---|---|---|---|---|
| Na/Cl | Ca/Mg | Cl–Na/Cl | NaCl | Na2SO4 | MgSO4 | CaSO4 | Ca(HCO3)2 | |
| Lake | 1.14 | 4.5 | −0.14 | 22.8 | 3.87 | 13.33 | 6.58 | 53.42 |
| 1 | 1.62 | 3 | −0.64 | 10.54 | 6.51 | 8.01 | 12.73 Mg(HCO3)2 |
62.21 |
| 4 | 1.03 | 8.5 | −0.03 | 33.84 | 1.32 | 6.82 | 24.18 | 33.84 |
| 5 | 1.34 | 5 | −0.34 | 33.29 | 11.15 | 9.26 | 17.01 | 29.29 |
| 7 | 1.49 | 6 | −0.49 | 29.68 | 14.76 | 7.94 | 21.23 | 26.39 |
| 9 | 1.3 | 5.14 | −0.3 | 30.66 | 15.11 | 8.83 | 20.37 | 25.03 |
| 12 | 1.5 | 3.09 | −0.5 | 31.65 | 15.78 | 12.85 | 11.58 | 28.14 |
| 13 | 1.03 | 5.87 | −0.03 | 40.36 | 0.81 | 8.56 | 28.74 | 21.53 |
| 18 | 1.36 | 3.33 | −0.36 | 43.24 | 14.94 | 9.65 | 24.96 | 7.21 |
| 19 | 1.01 | 3.7 | −0.01 | 56.79 | 0.42 | 9.1 | 26.42 | 7.27 |
| 20 | 1.11 | 3.68 | −0.11 | 48.65 | 4.76 | 9.95 | 27.12 | 9.52 |
| 22 | 1.37 | 4 | −0.37 | 34.88 | 12.65 | 10.49 | 20.83 | 21.15 |
| 23 | 1.04 | 4.57 | −0.04 | 49.54 | 2.4 | 8.63 | 27.2 | 12.23 |
| 24 | 1.01 | 8.57 | −0.01 | 48.42 | 0.11 | 5.51 | 27.34 | 18.62 |
| 25 | 1.15 | 7.33 | −0.15 | 43.37 | 6.02 | 6.07 | 26.22 | 18.37 |
| 26 | 1.26 | 3.5 | −0.26 | 40.76 | 10.38 | 10.86 | 21.09 | 17.39 |
4.2.1 rNa+/rCl− ratio
This ratio is more than unity in Lake Nasser water and groundwater samples. This indicates that the sodium is higher than chloride. This occurs mainly through the addition of sodium salts of terrestrial origin to groundwater. This indicates that the origin of groundwater in the study area is from seepage of water from Lake Nasser to groundwater aquifer.
4.2.2 rCa2+/rMg2+ ratio
This ratio is more than unity in groundwater and Lake Nasser samples. This is related to the nearest location of groundwater aquifer from the infiltration area (Lake Nasser).
4.2.3 (rCl−–rNa+)/rCl− (ion exchange processes)
To determine the ion exchange processes that take place in the groundwater of the study area, the Schoeller index (Schoeller, 1959) is often used. This ratio varies greatly from negative to positive value. If Na+ and K+ are exchanged in water with Mg2+ and Ca2+, the value of the ratio is positive indicating of a base-exchange phenomenon. Negative values are expected in case of active basic exchange processes, where a chloro-alkaline disequilibrium is indicated and the reaction is a cation–anion exchange reaction.
The groundwater in study area has negative values, which indicates a cation–anion exchange.
4.3 Hypothetical salts
The combination between ions reveals the formation of different varieties from salt assemblages. In the present work, the Lake Nasser surface water and groundwater in the investigated area reveal only one group of hypothetical salts combination as discussed in the following section (Table 5).
4.3.1 NaCl, Na2SO4, MgSO4, CaSO4 and Ca(HCO3)2
This assemblage has been encountered in Lake Nasser and groundwater samples. It reveals the different percentages salts assemblages due to the cation exchange between groundwater and clay beds in the aquifer. Accordingly, the same hypothetical salts of groundwater in the investigated area and Lake Nasser surface water indicate that the groundwater in the concerned area infiltrates from Lake Nasser.
4.4 Hydrochemical facies
Durov’s diagram (Durov, 1948) and expanded this diagram introduced by Burdon and Mazloum (1958) and Lloyd (1965) give more information on the hydrochemical facies and the evolution of groundwater quality when compared with other graphical methods (Lloyd and Healhcote, 1985). It helps in identifying hydrochemical facies or water types, groundwater flow direction and can indicate mixing of different water types, ion exchange and reverse ion exchange processes.
Durov’s diagram (Fig. 11) was used to help in classifying groundwater types. These types in the study area have five hydrochemical facies according to their order of importance. These types are 5, 6, 4, 1 and 9. The most dominant type is 5 and found in wells nos. 5, 7, 9, 12, 21, 22, 24 and 25. This type has no dominant anion or cation. It indicates groundwater exhibiting simple dissolution or mixing of types 1 and 2. Type 6 has sulphate and sodium ions as dominant and this indicates the probable mixing influence of types 3 and 5. This type is representing in wells nos. 18, 20, 23 and 26. Type 1 is characterized by bicarbonate and calcium ions being dominant and type 4 has sulphate and calcium ions as dominant. These types indicate recharging area (Lake Nasser area). These types (1 and 4) are recorded in wells nos. 1, 4 and 13. Type 9 (well no. 19) has chloride and sodium ions as dominant and this indicates the end point water (discharging area).
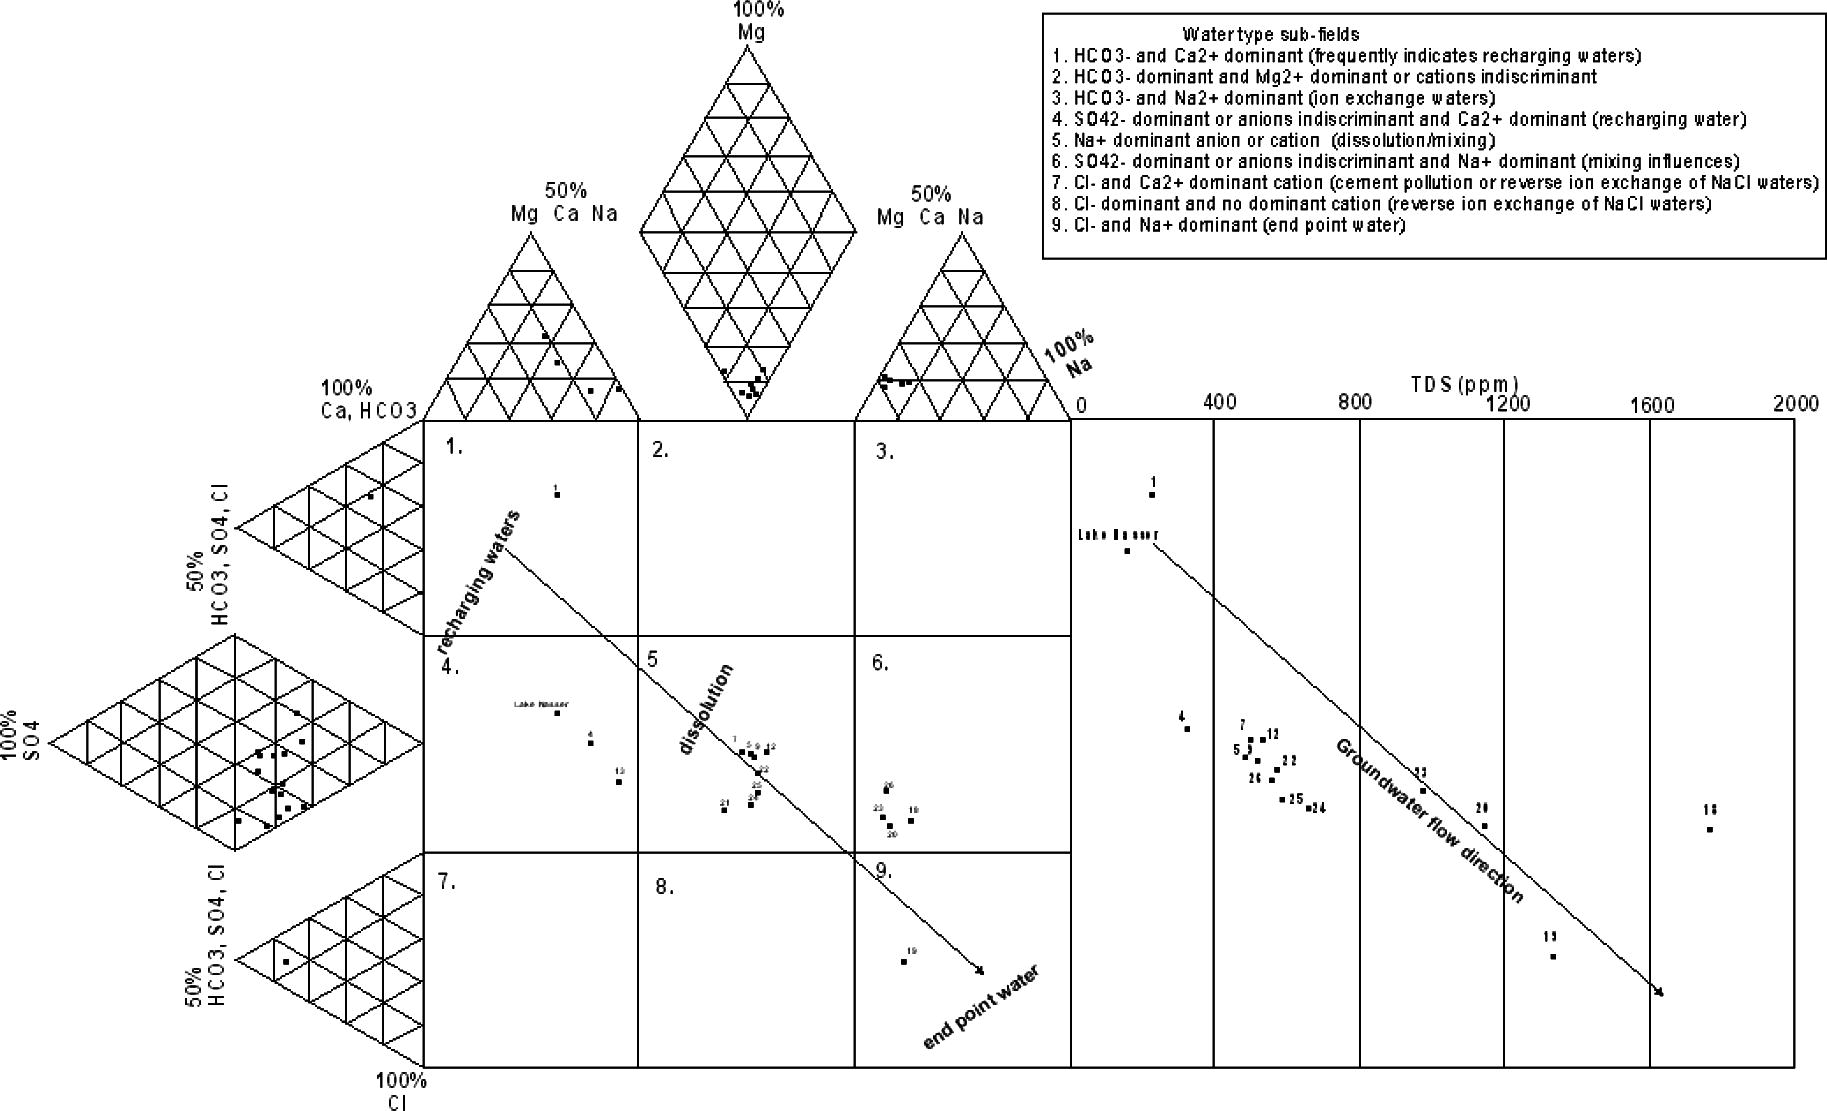
- Durov diagram (expanded) of groundwater samples.
Fig. 11 shows the spatial distribution of the different hydrochemical facies within the Nubia sandstone aquifer in study area. Recharging water was dominated by bicarbonate and calcium ions (type 1) and sulphate and calcium (type 4), and occur in southeast of the study area (Lake Nasser area). The hydrochemical facies evolves towards no dominant ion facies (types 5 and 6) in central of the study area along the mixing line. End point water (discharging area) was dominated by chloride and sodium (type 9) and occurs in northern area.
The obtained results reflect that the calcium bicarbonate and calcium sulphate water of recent recharge that comes from the Lake Nasser. The types of 5 and 6 hydrochemical facies are found in central area, where this area is characterized by mixing and dissolution of recent water from Lake Nasser and old water in Nubia sandstone aquifer. The northern area characterizes the sodium chloride of the end point water.
It is noticed that the recharging area has low groundwater salinity, while the end point water has high groundwater salinity (Fig. 11). This attributed to the groundwater salinity increases with groundwater flow direction due to the dissolution and leaching of salts.
5 Conclusion
The groundwater is exploited from Nubia sandstone aquifer whish is built up of Sabaya and Abu Simbil sandstone aquifers.
The groundwater level increases upward with the increasing of water level of Lake Nasser.
The groundwater salinity decreases with time related to the seepage of fresh water from Lake Nasser.
The amount of recharging from Lake Nasser in study area attains 24 × 106 m3/year.
The hypothetical salts in groundwater and Lake Nasser water are the same indicating that the groundwater in study area recharges directly from Lake Nasser.
References
- Ahmed, O.H., 1996. Hydrogeological and Hydrogeochemical Studies of the High Dam Lake Region and its Vicinities, South Egypt. Ph.D. Thesis, Fac. Sci., Cario Univ., Cairo, Egypt, 323p.
- The Electrical Resistivity Log as an Aid in Determining Some Reservoir Characteristics. Journal of Petroleum Technology. 1942;5:54-62.
- [Google Scholar]
- Burdon, D.J., Mazloum, S., 1958. Some chemical types of groundwater from Syria. In: UNESCO Symp. Teheran, pp. 73–90.
- Continental Oil Company (CONOCO), 1987. Geologic Map of Egypt (Scale 1:500,000): (CONOCO), NF 36 NW El-Saad El-Ali, Cairo, Egypt.
- Darcy, H., 1856. Les fontaines publiques de la ville de Dyon. V. Dalmont, Paris, 647p.
- Natural waters and graphic representation of their compositions. Dokl. Akad. Nauk SSSR. 1948;59:87-90.
- [Google Scholar]
- Ghoubachi, S.Y., 2004. Comparative Hydrogeological Studies of the Nubia Sandstone Aquifer System in East El-Oweinat and Bir El-Shab Areas, South Western Desert, Egypt. Ph.D. Thesis, Fac. Sci., Al-Azhar Univ., Cairo, 303p.
- Plate tectonic and cratonal geology in Northeast Africa (Egypt/Sudan) Geol. Rdsch.. 1986;75(3):753-768.
- [Google Scholar]
- The hydrochemical of the aquifers of northeastern Jordan. J. Hydrol.. 1965;3:319-330.
- [Google Scholar]
- Natural Inorganic Hydrochemistry in Relation to Groundwater, an Introduction. Oxford: Clarandon Press; 1985.
- Sallam, O.M., 2002. Groundwater Sustainability for Development, Tushka Area. M.Sc. Thesis, Fac. Eng., Ain Shams Univ., Cario, Egypt, 127p.
- Arid Zone Hydrology. Recent Developments. Paris: UNESCO; 1959. pp. 54–83
- Schrank, E., 1987. Paleozoic and Mesozoic palynomorphs from NE-Africa (Egypt and Sudan). Berliner geowissenschaftliche Abhandlungen, A, vol. 75. Germany, pp. 149–310.
- Shedid, M. A., 2006. Evaluation and management of groundwater resources in the area between Abu Simbel and Toshka, South Western Desert, Egypt: Ph. D. thesis, Fac. Sci., Minufiya Univ, Egypt, 192p.
- Groundwater Hydrology. New York, USA: John Wiley and Sons, Inc.; 1980. 535p


