Translate this page into:
Estimation of origin–destination matrices for mass event: A case of Macau Grand Prix
*Corresponding author. Tel.: +886 (0)3 5131219; fax: +886 (0)3 5720844 kiwong@mail.nctu.edu.tw (K.I. Wong)
This article was originally published by Elsevier and was migrated to Scientific Scholar after the change of Publisher.
Available online 30 December 2010
Abstract
Mass-event activities attracting a large number of people become important in promoting the culture of a city. The organization of a mass event requires a detailed plan of traffic control and evaluation of transport accessibility, but the design of the plan is usually empirical and received little attention in the literature. In this paper, we study a problem of origin–destination (OD) matrix estimation for the duration of mass event. The OD matrices are an important input in the transportation network analysis, but they are usually difficult and costly to obtain from survey or interviews. A two-stage procedure is proposed to estimate the OD demand matrices during the event using link traffic counts. The Macau Grand Prix motor-racing event organized annually is investigated as a case study to illustrate the performances of the model.
Keywords
Mass events
Multiclass
Origin–destination matrix estimation
Traffic assignment
1 Introduction
Mass-event activities attracting a large number of people become important in promoting the culture of a city. Such special events can be very large scale from international events such as Olympic Games to a local scale such as concert and festival parade. During the activity, the transport accessibility, such as provisions of public transport and parking spaces are some of the primary concerns to the successfulness of the event. Limited accesses of the peripheral roads to the venue by private cars are typical strategies in controlling the traffic. In practice, the problem would be very dissimilar in different events and cities, and the solutions are usually experience-based.
The traffic planning for mass events is usually empirical and this topic received little attention in the literature. For one reason, most of the events are once-off (e.g. Olympic for a few weeks), which makes the experience non-transferable and the solution coped with the local knowledge of the city. Federal Highway Administration (2003) of the US Department of Transportation has released a handbook designed to provide some guidance and has recommended practices for the management of travel associated with planned special events. The policies, regulations, impact mitigation strategies and technologies used in advanced applications for managing the travel of planned events were discussed, and a summary version of the updated report is given in Dunn (2007). The report recommended that a general feasibility study analysis should include the following steps: travel forecast, market area analysis, parking demand analysis, travel demand analysis, roadway capacity analysis and mitigation of impacts.
The city of Macau Special Administrative Region, China is a famous tourist city with over 20 million visitors in a year. Since 1967, one of the annual attracting activities for tourists is the Macau Formula three Grand Prix (GP) motor-racing held every November. It is well known for its street racing circuit “Guia Circuit” in the city, which is located at the southeast region of the Macau peninsula enveloping some buildings, such as hotels and resorts, schools, offices, residential buildings, and ferry terminal. During the periods of the event, it requires traffic management and control measures, such as temporal closure of some roads and parking spaces, and therefore, access of vehicle traffic to and from the area is restricted. There are huge impacts to the level of service of the road network and inconvenience to the local residents. A transportation network analysis approach is proposed in this study to address this issue. This addresses the guidelines in Dunn (2007), which suggested that a study analysis requires the identification of background traffic flows and capacity constraints of the network.
In the analysis of transportation network, the flow pattern in an urban network can be viewed as a result of equilibrium between transportation demand and supply. Users of the system travel with a route selection to minimize their disutility (i.e. travel cost) associated with transportation. This disutility is not fixed but depends on the usage of the system, which is a result of the behavior of other users, such as route switching. Equilibrium analysis to this problem was proposed since the seminal works of Wardrop (1952) who investigated the nature and properties of equilibrium in models of congested networks. Extensions and solution algorithms for the traffic assignment problem were given by Sheffi (1985).
The travel demand matrix is an important input in the traffic assignment problem. Traditional method to collect the OD information can make use of survey or direct measurement to record the travel characteristics of individuals, which is generally difficult and costly. An alternative approach is to estimate the OD matrix by using the observed traffic counts on links (Van Zuylen and Willumsen, 1980). As a reverse problem of the traffic assignment, the OD matrix estimation problem aims to find a matrix that, when assigned to the network, reproduces the observations of link volumes. The OD matrix estimation models can be broadly divided into traffic modeling based approaches and statistical inference based approaches (Wong et al., 2005a). The former includes the minimum information/entropy maximizing models and combined models for traffic planning (Van Zuylen and Willumsen, 1980; Bell, 1983), and the latter includes the maximum likelihood method and generalized least squares method (Cascetta, 1984; Spiess, 1987; Bell, 1991; Lo et al., 1996; Yang et al., 1992). Most of these studies assume a single vehicle class and the link choice proportions are insensitive with the changes of the OD demand. For congested network, formulations of the OD matrix estimation problem have a bi-level structure (Yang, 1995), in which the upper level sub-problem is the OD estimation model, whereas the lower level sub-problem updates the link choice proportions by solving the traffic assignment problem. With the bi-level structure, it is possible to extend the estimation process for the road network with multiple vehicle classes (Wong et al., 2005a) and public transport networks (Wong et al., 2005b). In the traffic assignment problem with multiple vehicle classes, it generally processes multiple link flow solutions, and therefore, the internal inconsistency of traffic volumes among different vehicle class has to be detected by separating the estimation process for each mode (Wong et al., 2005a).
The objective of this study is to develop a methodology to estimate the OD demand matrices during a mass-event activity. The estimated OD matrices can be useful to assist the traffic planning in deriving various control measures and its evaluation of impact to the local network. A case study using the Macau Grand Prix motor racing is used to demonstrate the proposed methodology.
The paper is organized as follows. We first introduce the notations and model formulation of the OD estimation problem proposed in the paper. We then describe the solution algorithm to estimate the OD matrices for the case of normal day, and a two-stage procedure to obtain the OD demand matrices for the special event. Finally, a case study of the Macau GP event is presented with discussions.
2 Notations and definitions
Consider a network with a set of origin zones I and a set of destination zones J. Denote an origin–destination pair, w = (i, j), as an ordered pair of origin zone i to destination zone j, and W is the set of OD zone pairs. Let M be the set of vehicle modes in the network with M = {c, mc}, where car (c) and motorcycle (mc) are considered in this study. Furthermore, let A be the set of links in the network, and A′ ∈ A be the set of observed links for normal day. Denote as the observed flows for link a and vehicle class m for normal day, and collectively we can define as the set of observed link flows for vehicle m. Let be the prior trip demand (e.g. from household survey) to the problem for OD pair w and vehicle class m, with the set notation . For the given set of prior OD matrices and observed link counts, we can determine the corresponding estimated OD matrices and and modeled link flows .
The estimated matrices are assigned to the network in accordance with the deterministic user-equilibrium traffic assignment for multiple vehicle classes. It is expected that when these matrices are assigned to the network, the modeled link flows should be close to the observed values. In the traffic assignment, the link choice proportions
that measure the ratio of a trip demand
of OD pair w for vehicle class m that would pass through link a are obtained. Collectively we can define
as the set of link choice proportions for vehicle mode m. The modeled link flows from the assignment under equilibrium can be expressed as
For the case of special event, some of the links are closed and the set of links are updated. Let
be the set of links in the network and
be the set of observed links during the event. Similarly, we can define
as the observed flows for link a and vehicle class m during the event, and collectively
as the set of observed link flows for vehicle m. A list of notations and variables are given in Table 1.
i ∈ I
Set of origin zones in the network
j ∈ J
Set of destination zones in the network
a ∈ A
Set of links in the network for normal day
Set of links in the network for special event
a ∈ A′
Set of observed links in the network for normal day, with A′ ∈ A
Set of observed links in the network for special event, with
m ∈ M
Set of vehicle modes in the network, M = {c, mc} with c for car and mc for motorcycle
w ∈ W
Set of origin–destination zone pair, and w = (i, j) for an ordered pair of origin zone i to destination zone j
Prior trip demand obtained from household survey for OD pair w and vehicle class m, with the set
Estimated trip demand for OD pair w and vehicle class m, with the set
Observed link flows of link a for vehicle class m during normal day, with the set
Observed link flows of link a for vehicle class m during the special event, with the set
Modeled link flows of link a for vehicle class m, with the set
κm
Passenger car equivalence for vehicle class m, and it is assumed that κm=c = 1.0 and κm=mc = 0.4
Link choice proportions that measures the ratio of trip demand of OD pair w for vehicle class m passing through link a, with the set
3 Model formulation
With a prior OD matrix and observed link traffic counts of selected links, a typical estimation formulation based on the entropy maximization is due to Van Zuylen and Willumsen (1980). For each vehicle class m, the model formulation can be described in the following maximization problem:
In this study, the transportation planning software package VISUM (PTV, 2009) is used for network modeling and traffic assignment, and the build in function TFlowFuzzy is adopted for the OD estimation process. The TFlowFuzzy procedure extends the above entropy maximization formulation by applying a set of upper and lower bounds on the link flows, considering that the measurements of traffic counts are subject to error and stochasticity in nature. Fuzzy is introduced with a membership function to define the bandwidth and probability for which the modeled link flows would deviate from the measurements, and therefore, a better estimation of the OD matrices for the entropy evaluation function can be determined (see Friedrich et al., 2000). The formulation with fuzzy approach for a vehicle class m is given in the following maximization problem:
4 Solution algorithm
4.1 Algorithm for the OD estimation problem
In this section, we will present a simultaneous optimization procedure for the OD estimation problem with multiple vehicle classes. It solves the maximization model presented in the previous section as well as the network equilibrium model in an iterative manner. The purpose of the iteration is to update the link choice proportions in the traffic assignment, which are assumed to be constants in the formulation Eqs. (6)–(10). It also allows for the extension for the case of multiple vehicle classes and development of solution procedures for large-scale problems (Wong et al., 2005a). The connections between the vehicle modes in the network are their interactions when sharing the same road network with traffic congestion. The amount of link flow of a vehicle mode would affect the link travel time and thus the link choices of the other modes, and a multiclass traffic assignment have to be embedded in the procedure. The steps of the algorithm are as follows using the notations of variables for the normal day estimation. The flow of the overall process is also illustrated in Fig. 1.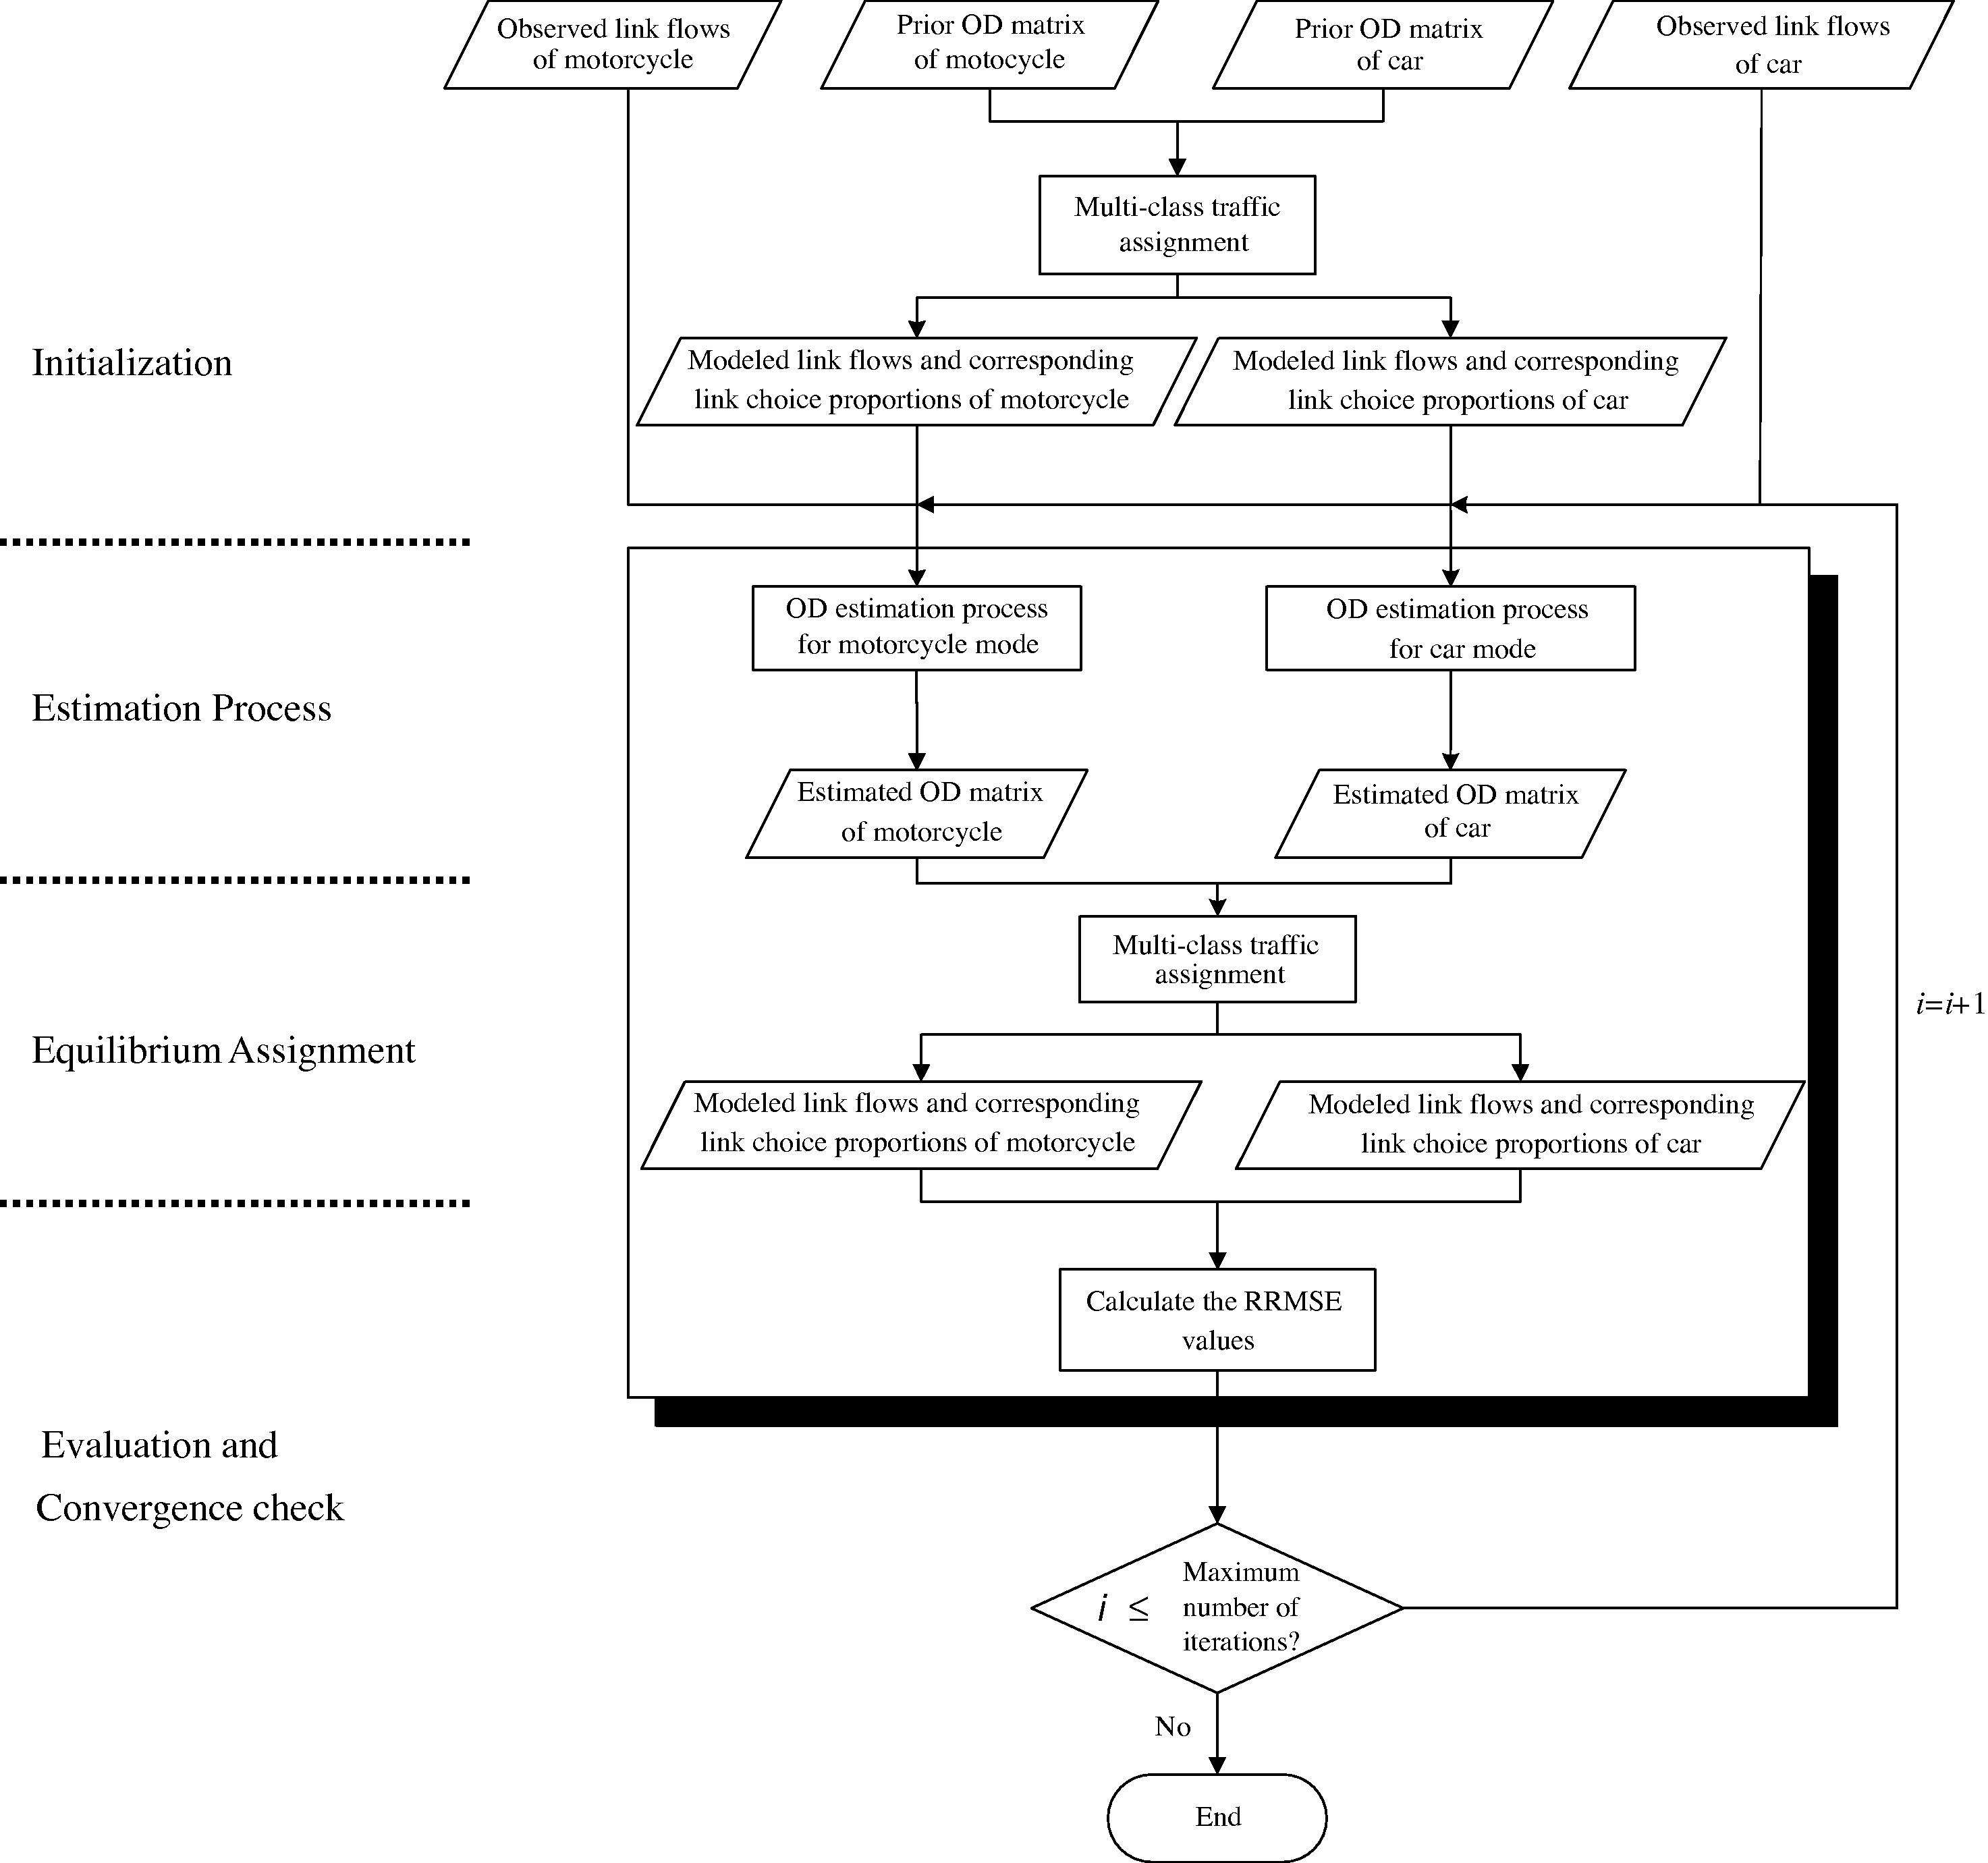
Flowchart of a multiclass OD estimation process with traffic assignment.
4.1.1 Step 1. Initialization
Set iteration number i = 1. Obtain the initial link choice proportions pm, ∀m ∈ M by assigning the prior trip matrices onto the network with the multiclass user-equilibrium traffic assignment problem.
4.1.2 Step 2. Estimation process
For each vehicle class m ∈ M, solve the maximization problem defined in Eqs. (6)–(10) for given prior OD matrix , observed link flows and link choice proportions pm to obtain the estimated OD matrix qm. The objective of the maximization problem is to minimize the discrepancies between the observed link flows and modeled values obtained by assigning the estimated OD to the network with the given link choice proportions. The entropy maximization problem with fuzzy concept was solved with the build-in function TFlowFuzzy in VISUM.
4.1.3 Step 3. Equilibrium assignment
With the estimated OD matrices qm, ∀m ∈ M, solve the multiclass user-equilibrium traffic assignment problem. That would obtain the auxiliary equilibrium link flows xm, ∀m ∈ M and update the link choice proportions pm, ∀m ∈ M. Solution algorithms for the traffic assignment problem can be found in Sheffi (1985) and Van Vliet et al. (1986).
4.1.4 Step 4. Convergence check and evaluation
The solution has converged if the change of link flows over iterations is within an acceptable error, or if the iteration number exceeds a certain preset threshold, then stops; otherwise set i = i + 1 and go to Step 2. The goodness-of-fit of the estimation can be evaluated using measurement such as Relative Root Mean Square Error (RRMSE) (to be described in Eq. (12) later).
4.2 Estimation procedure for the mass event: A two-stage procedure
The travel demand and, therefore, the traffic pattern in the network during an event would be different from those in the normal days for several reasons. The behavior of travelers would change with the announced traffic control schemes at the roads near the racing track with limited access. The local residents are familiar with these traffic controls (such as the temporal road closure) as the GP event is organized every year (Han and Ho, 2010). On the other hand, these control measures are subject to update every year, and there is a need for the event organizer to understand the corresponding changes to the travel demand.
A constraint that prevents us from using the method for normal day to estimate the situation of GP event is that it is difficult to perform a full scale survey during an event to collect link traffic counts in the network. Recall that the Macau peninsula is the old town area with many local roads, currently there are no vehicle detectors installed for the data collection purposes. Under these conditions, the advancement one can do with the model formulation is limited.
Therefore, we suggest a two-stage procedure. Stage-one is to estimate the OD matrices for normal days with the algorithm described above, using the observed traffic counts during normal day and the historical OD matrices from household survey as the model input. In Stage-two, the demand matrices during the GP event are estimated utilizing the estimated OD matrices for normal days from Stage-one as the prior matrices. The normal day traffic counting should be representative to the behavior of travelers and close to the event duration, like a pre-estimation of the OD matrices. If the OD information from household surveys is used as the prior OD, the overall result could be inaccurate as this OD demand is not adjusted against the road traffic, and we have only a limited number of observations for the event period. It is expected that using the estimated OD matrices for normal days as prior can improve the estimation performance.
The flow of the two-stage procedure is displayed in Fig. 2. Each of the “OD estimation for normal day” in Stage-one and “OD estimation for GP event” in Stage-two solves the algorithm presented in Fig. 1. The Stage-one “OD estimation for normal day” takes the household surveys data as prior OD and observed link counts for normal day as the observation, and the output of the process is the estimated OD matrices and modeled link flows for normal day. The Stage-two “OD estimation for GP event” uses the estimated OD for normal day as the prior OD demand and the link traffic counts during GP as the observations in the estimation process. It can be solved with the analogous algorithm presented in the subsection above by replacing the variable notations with the appropriate symbols for the special event.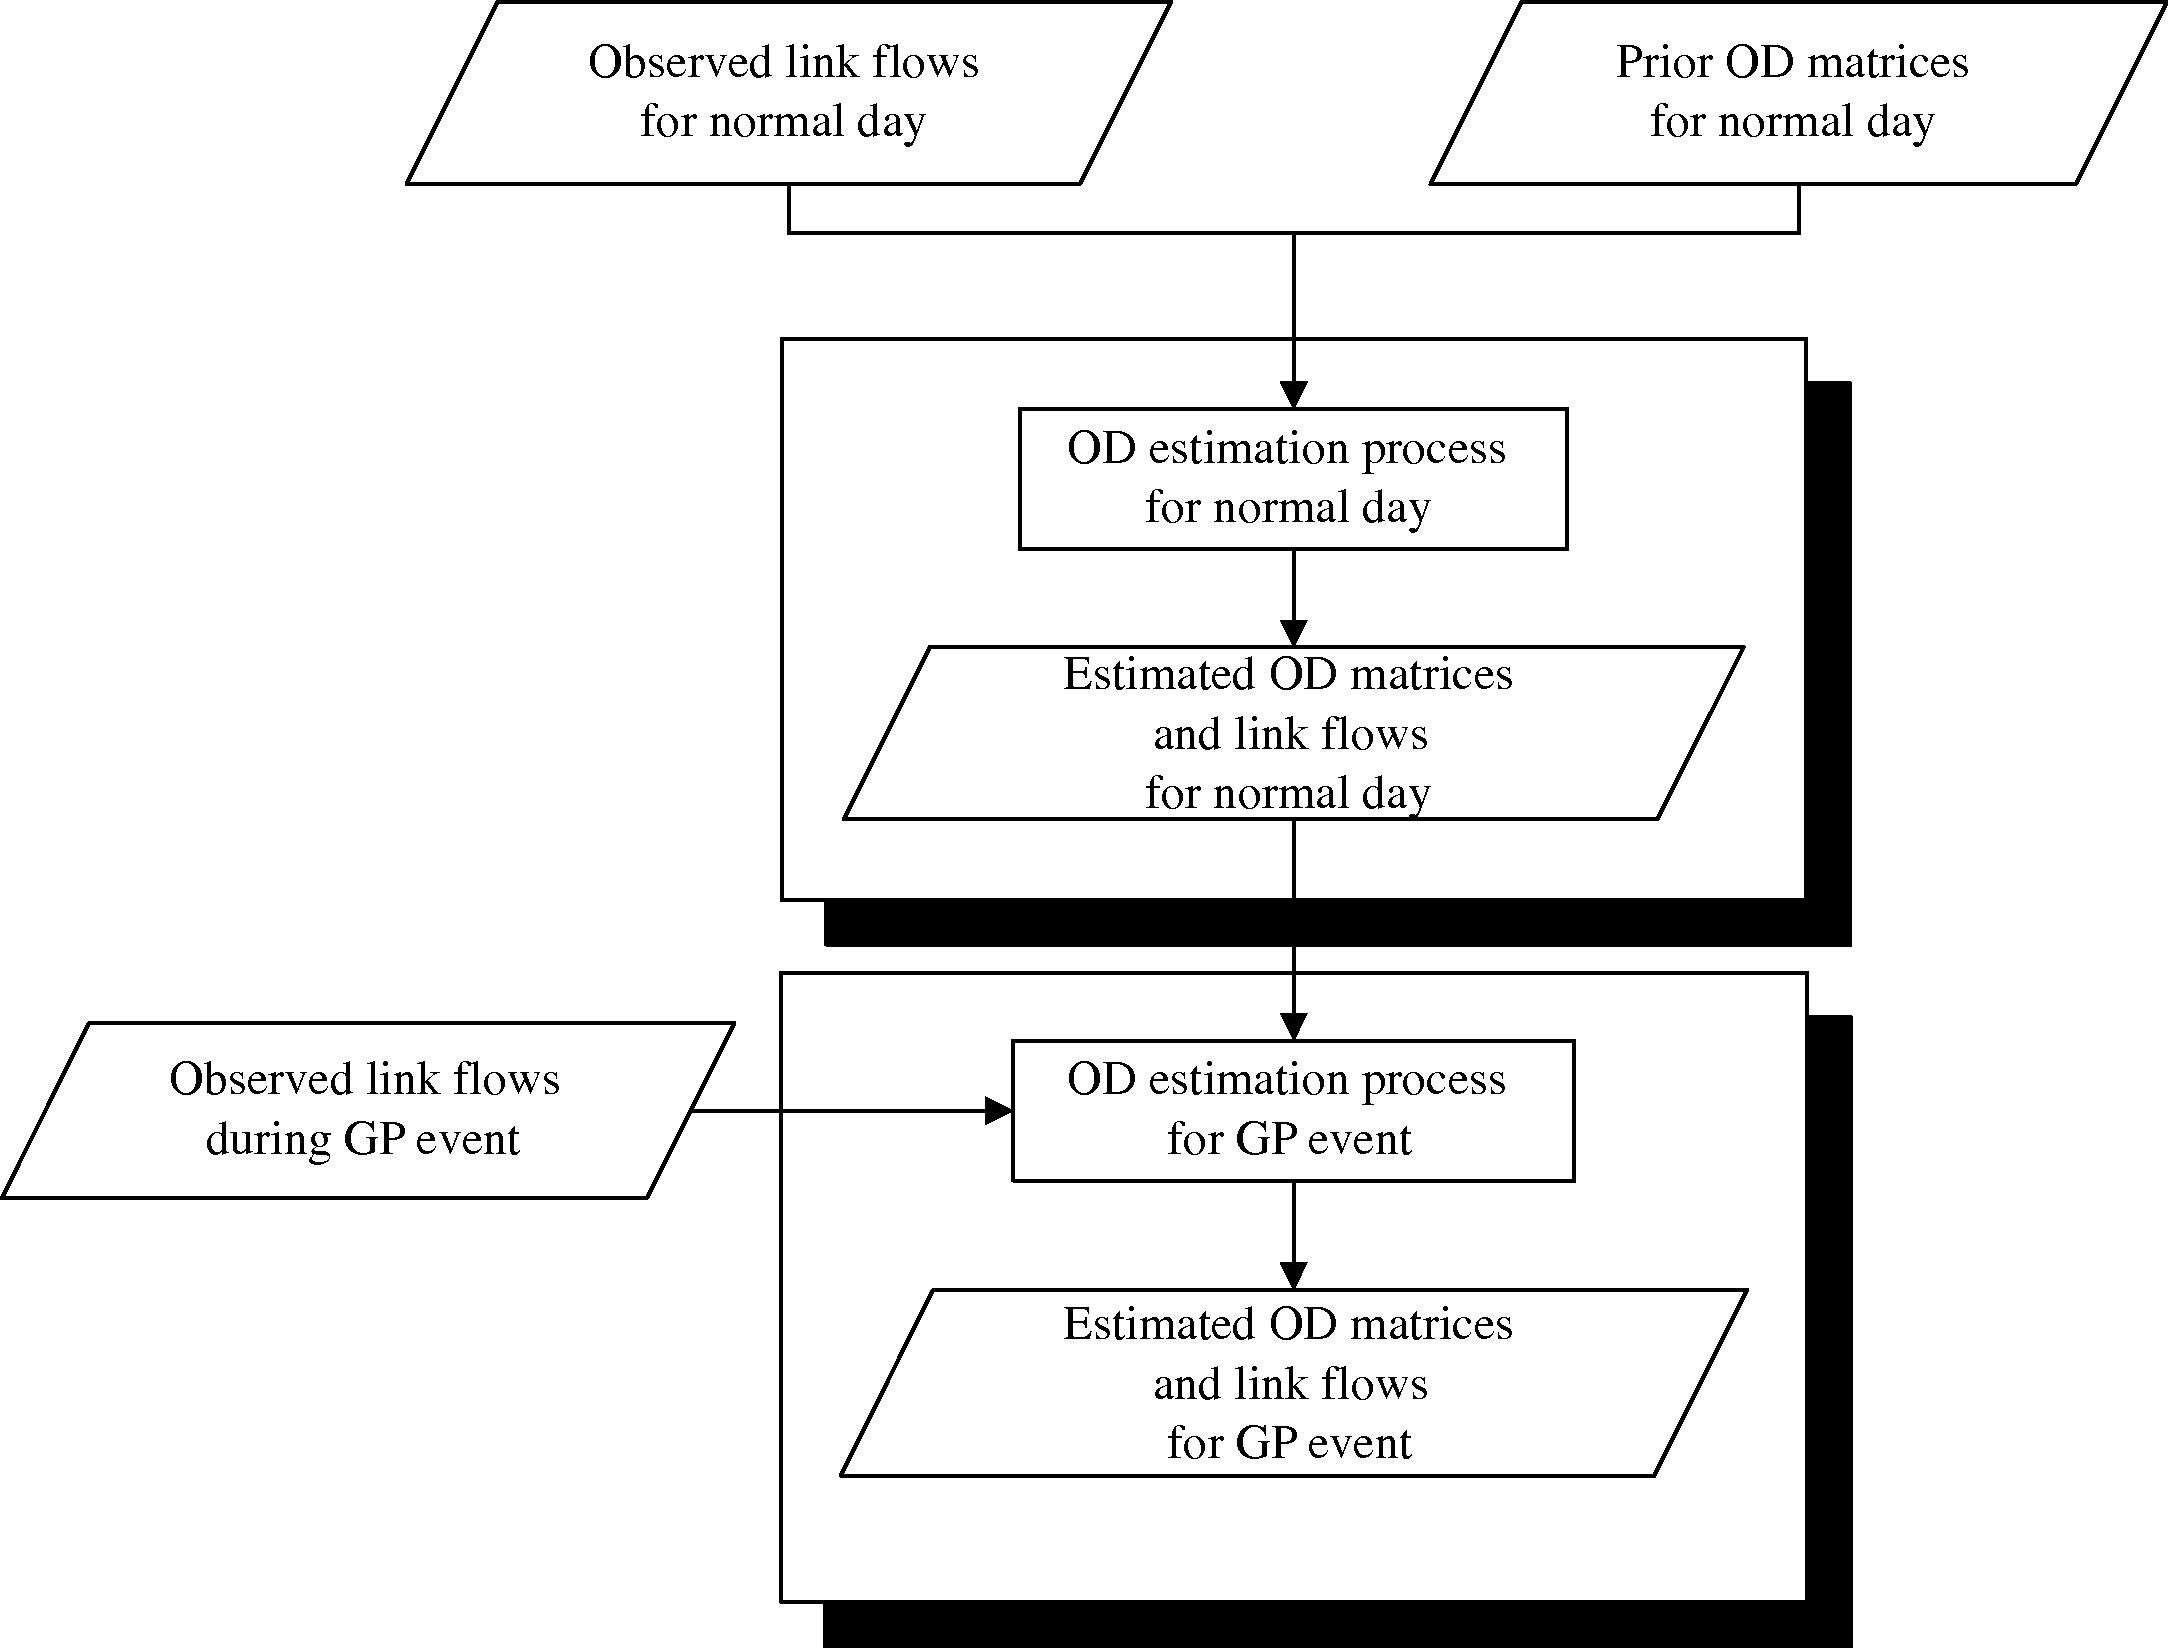
A two-stage estimation procedure for the GP event OD matrices.
5 Case study
Geographically, the city of Macau is composed of the Macau peninsula, Taipa island and Coloane island, with a total area of 29.2 km2 (see Fig. 3) and a population size of 544,600 (DSEC, 2010). The Macau peninsula and Taipa island are connected by three bridges, whereas the area between the Taipa island and Coloane island is now filled by land reclamation, now known as the Cotai area. The city centre (and old town area) is located at the Macau peninsula, with more than 86% of the population residence. Therefore, there is a large amount of traffic between the Macau peninsula and Taipa island.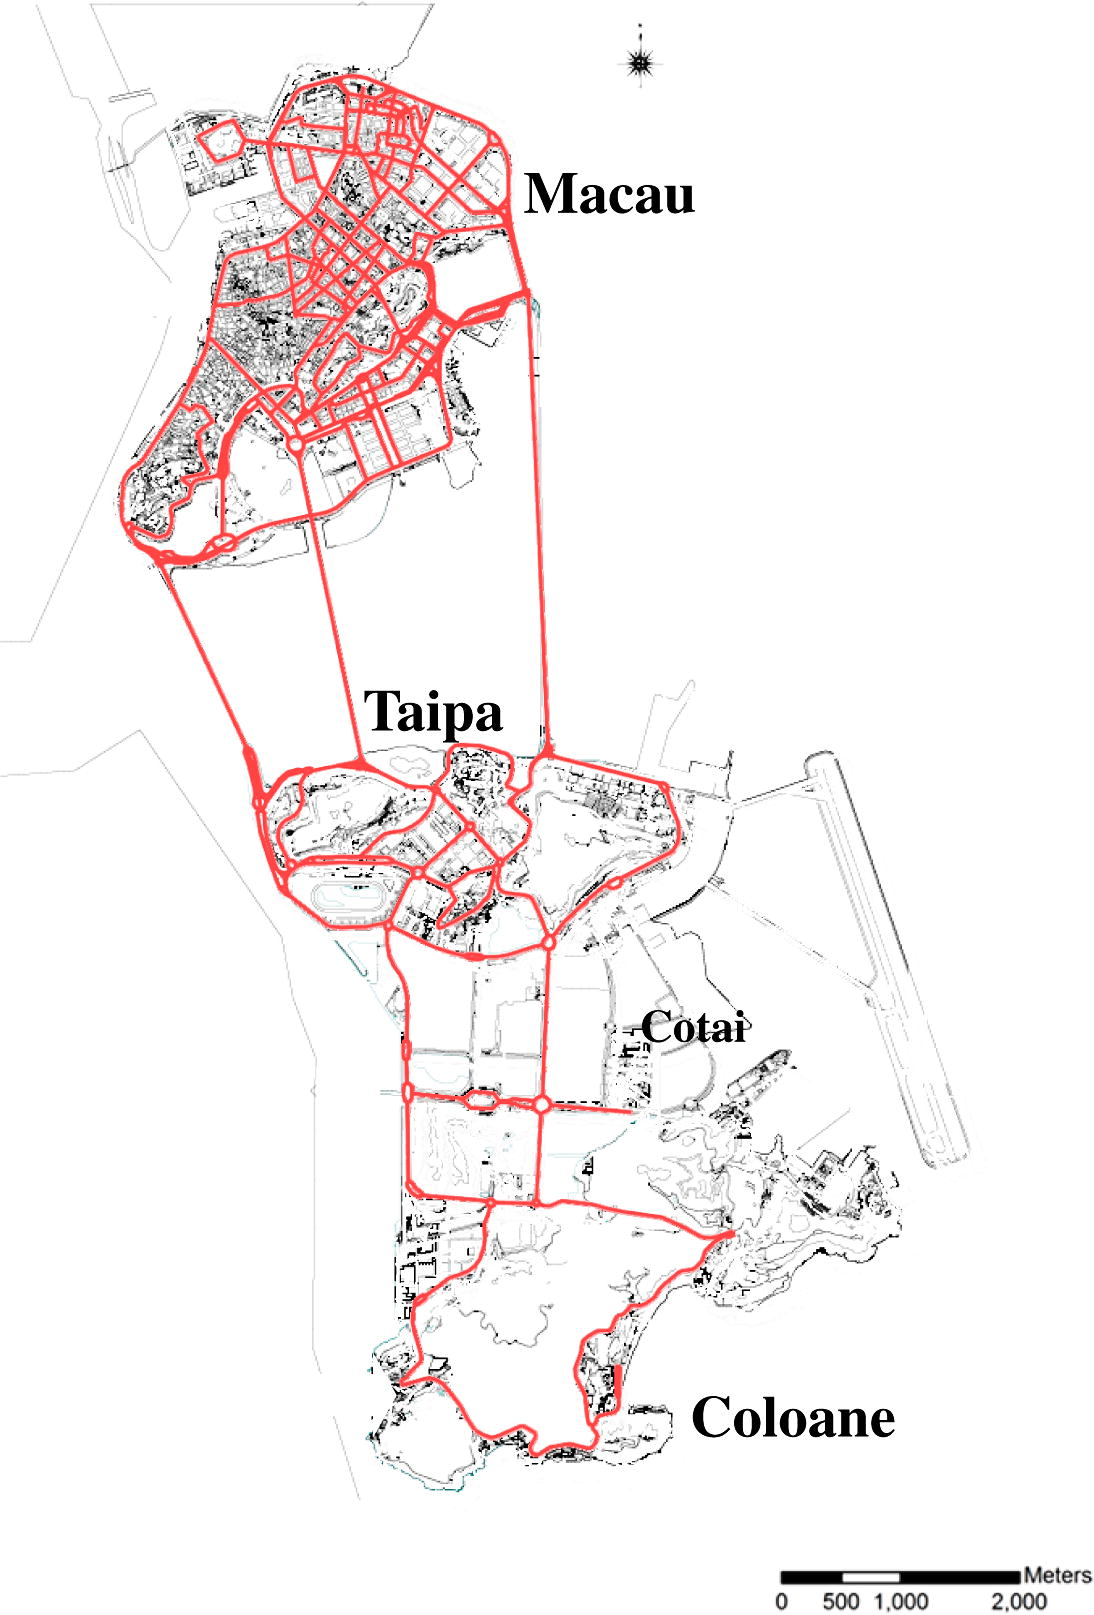
The map of Macau, showing the Macau peninsula, Taipa island and Coloane island.
5.1 Data collection
The transportation network of Macau consists of 443 nodes and 1340 links, and the area is divided into 23 zones for the OD estimation procedure. The network is coded into VISUM (PTV, 2009) for the network coding debug, parameter calibration and evaluation purposes. We collected the traffic flow data at the morning peak period for normal day and during the GP event. The normal day (ND) data were collected within a week in October 2009, during which we executed a survey measuring the traffic flow at each approach of the 36 intersections and 26 road segments along major arterials. The Grand Prix (GP) data were collected from the 19th to 21st of December, 2009. Since the event period only lasted a few days, only traffic flows at 8 intersections and 15 road segments were measured, with some selected locations dedicated to the boundary of the racing circuit. During the week of the racing, the entrances at the boundary were closed by the event organization at 3 a.m. and re-opened at 5:30 p.m. subject to the operational schedule of the event, and the transportation network has to be updated. In overall, we have 159 observed links for normal day and 65 observed links during the GP event. The locations of the observation stations are displayed in Figs. 4 and 5 for normal day and GP event, respectively. The historical OD matrices used as the prior OD in the estimation process were generated from a household traffic characteristics survey (DSAT, 2010; Wan et al., 2009). Although these matrices have not been calibrated with a transport planning model, they are useful as an initial input to the estimation process of this study.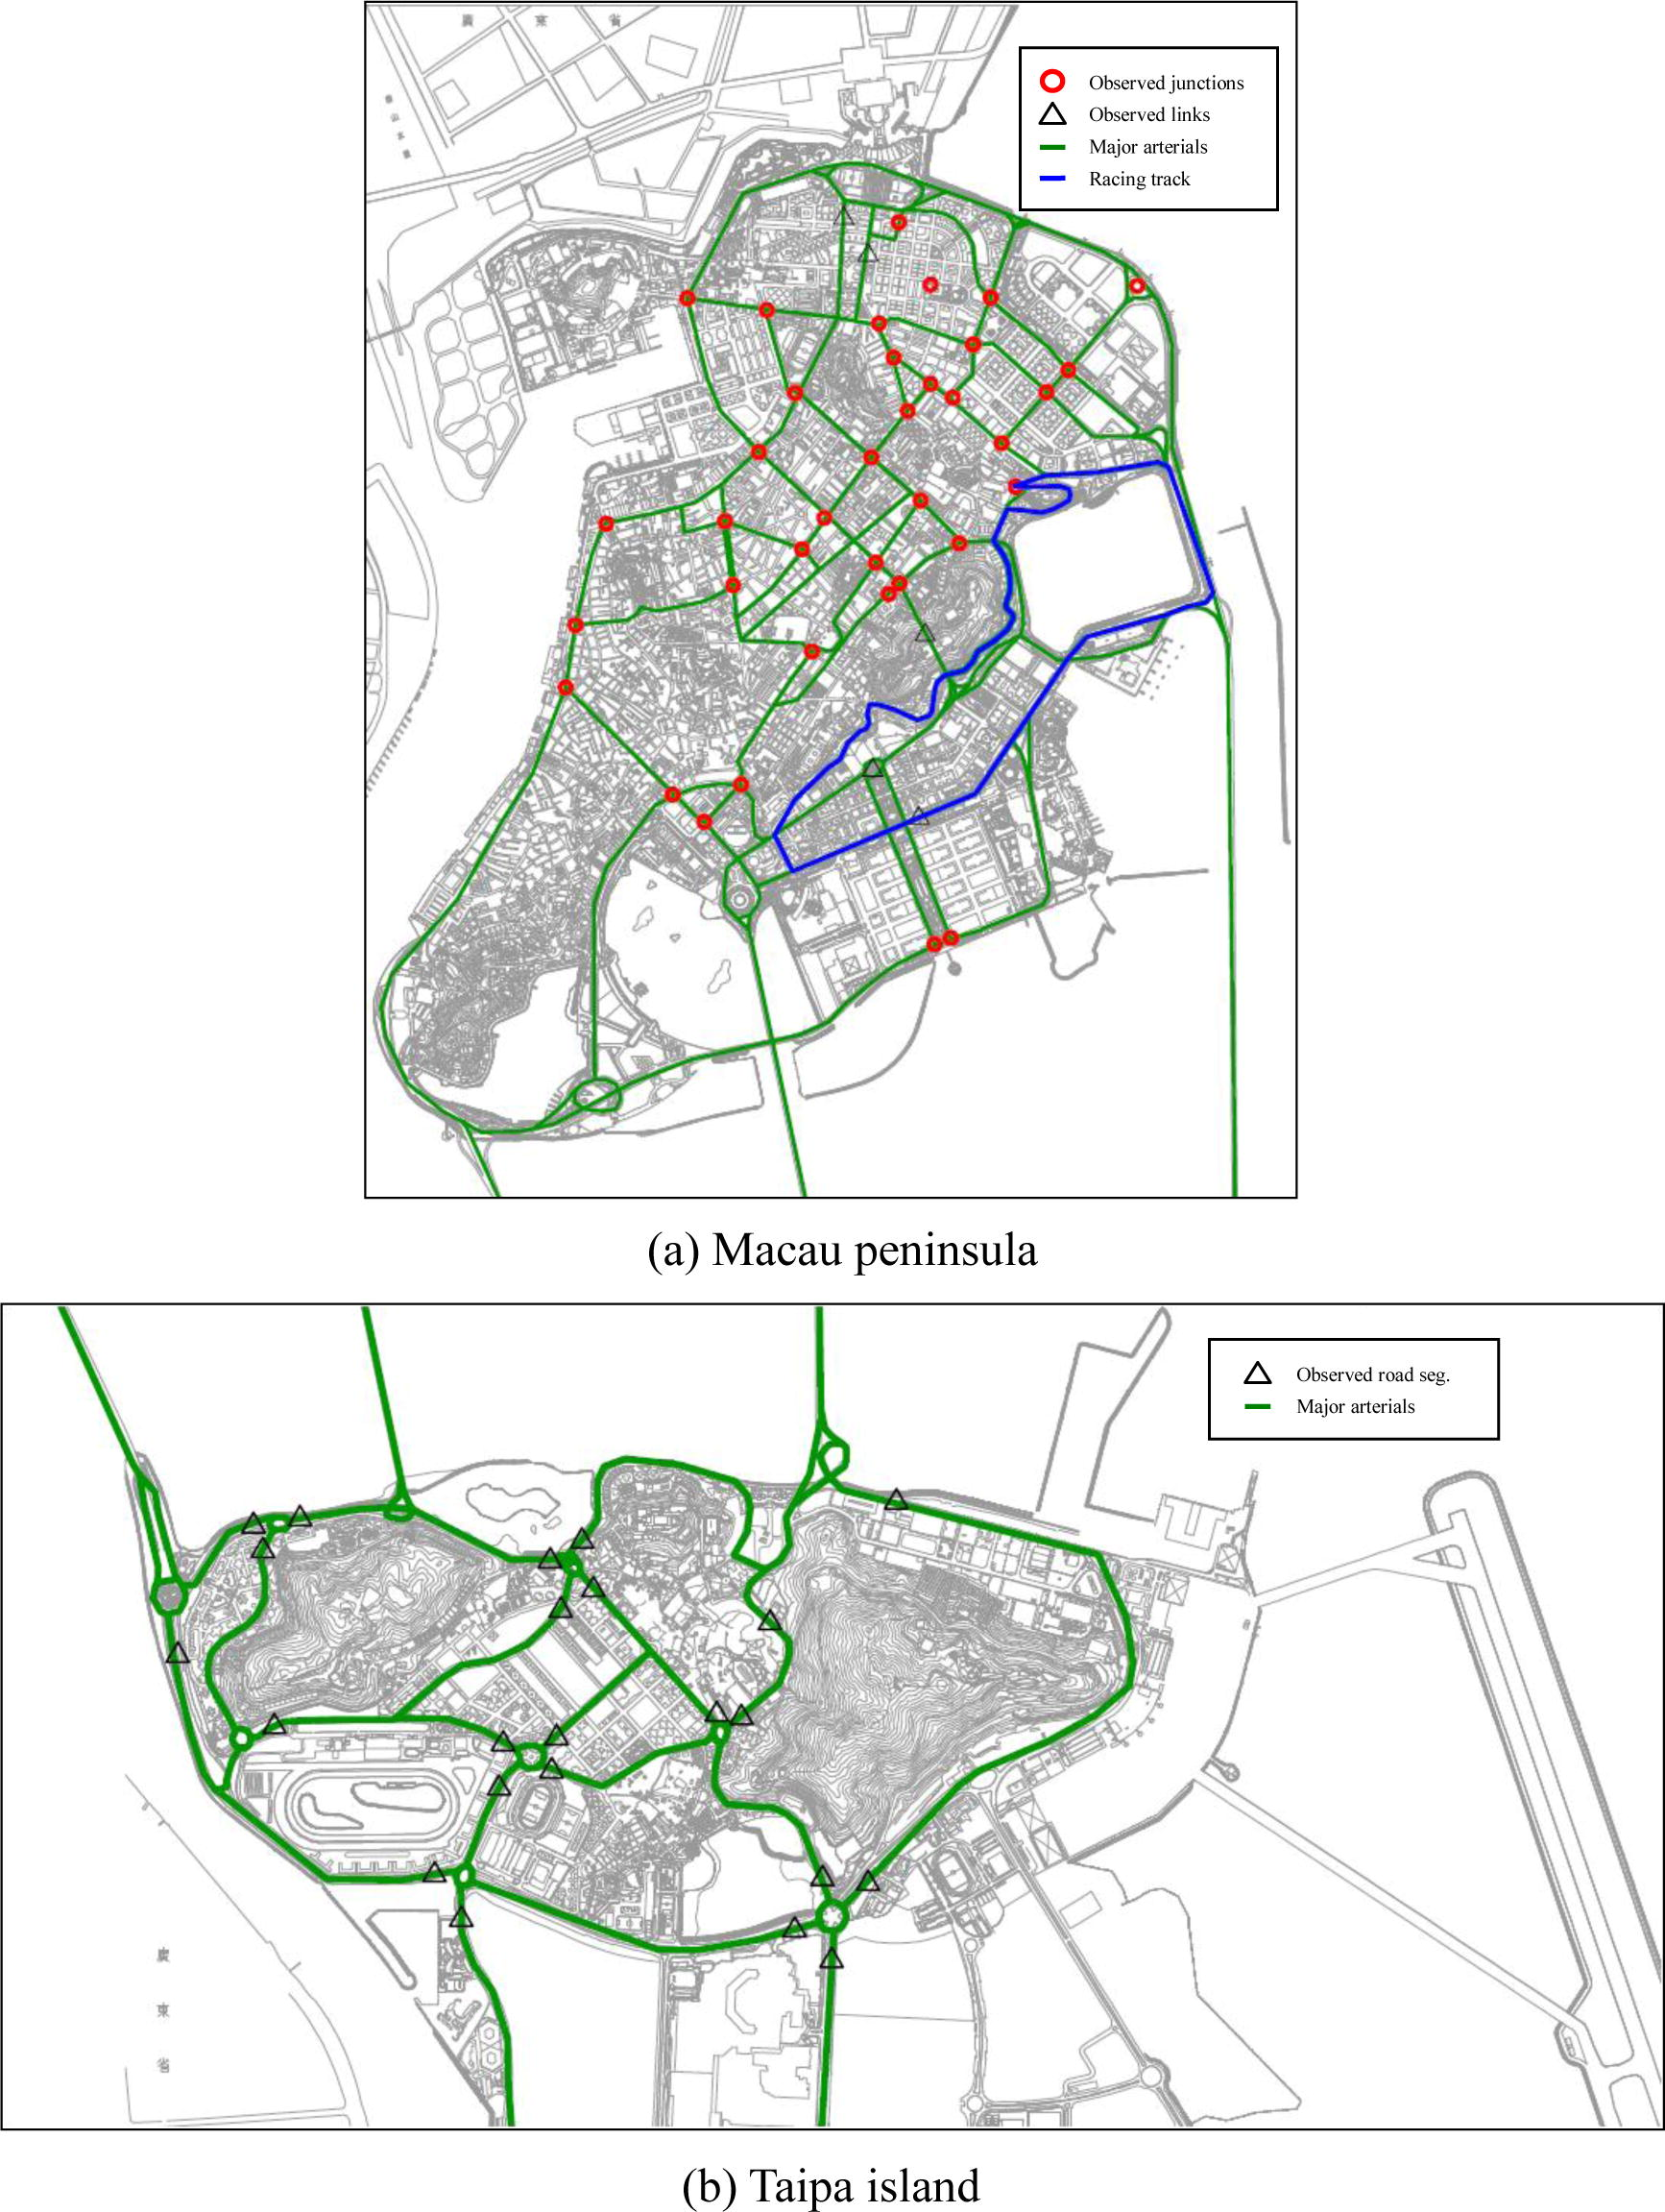
Locations of observed stations for normal day.
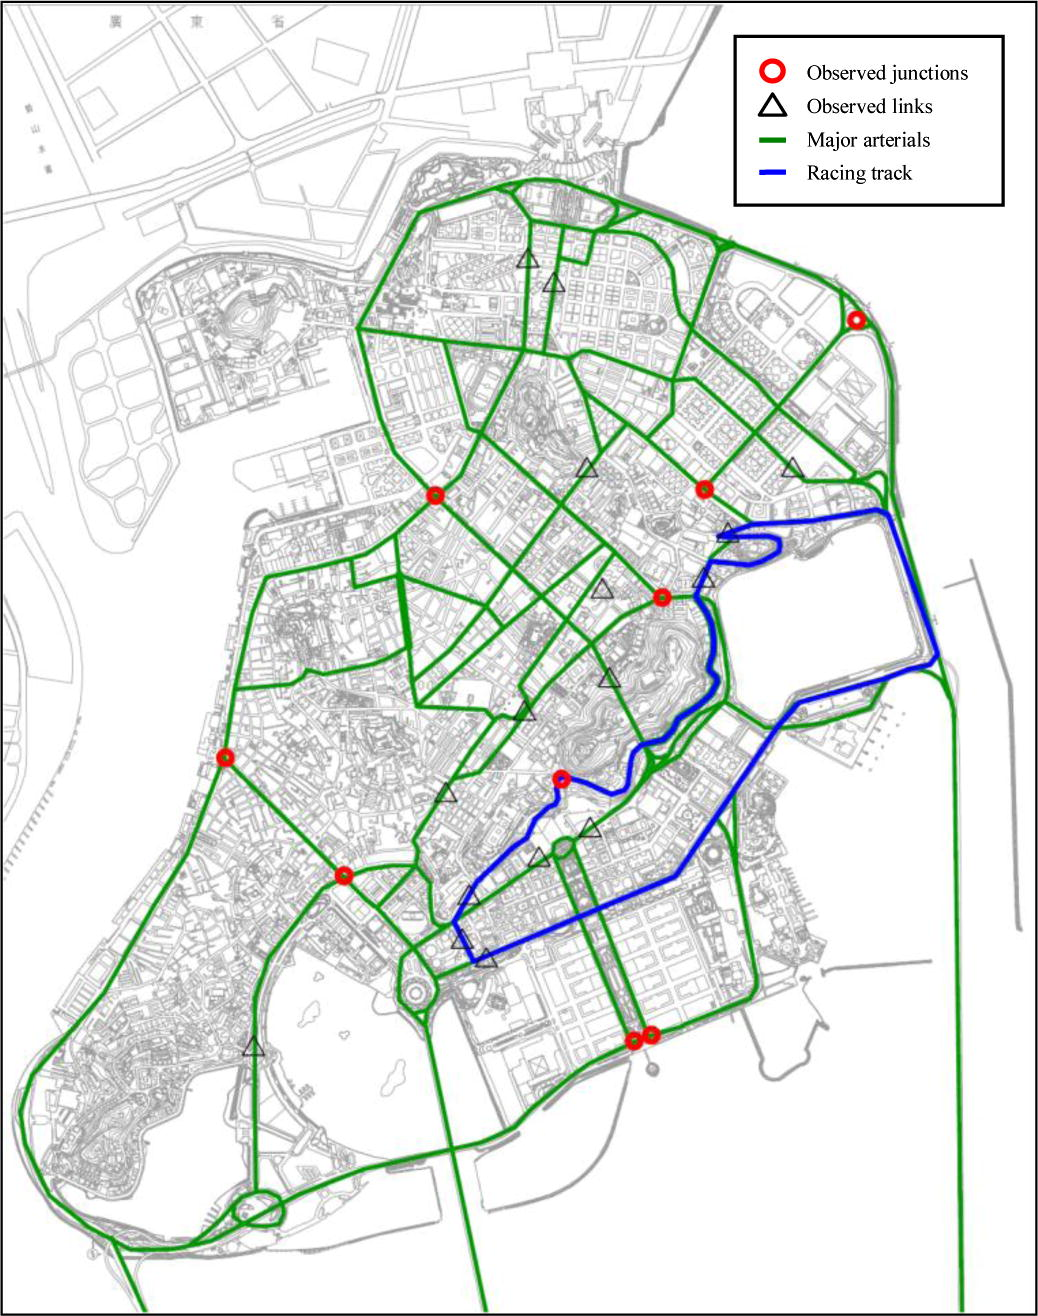
Locations of observed stations during GP event (Macau peninsula).
To measure the goodness-of-fit of the estimated link flows as compared to the observed link flows, we use the Relative Root Mean Square Error (RRMSE), which is calculated by
5.2 Estimation result for normal day
To evaluate the performances of the trip matrix estimation process, we compare the modeled link flows against observed values before and after the OD estimation. The modeled link flows that correspond to the “before” analysis are obtained by assigning the prior OD matrices to the network with multiclass traffic assignment, and the modeled link flows of the “after” analysis are obtained by assigning the estimated OD matrices to the network.
For the case of normal day, Figs. 6 and 7 compared the “before” and “after” link flows of selected links for private cars and motorcycles, respectively. The result shows that the modeled link flow values after the estimation matches the observed values better than the case before the estimation. The “after” results have a smaller RRMSE values and are much closer to the 45° line. The RRMSE values are also displayed in the figures and summarized in Table 2. It can be seen that there are large reductions of discrepancies between the modeled link flows and the corresponding observed values after the OD estimation process for both cases of private cars and motorcycles, and the improvements are significant.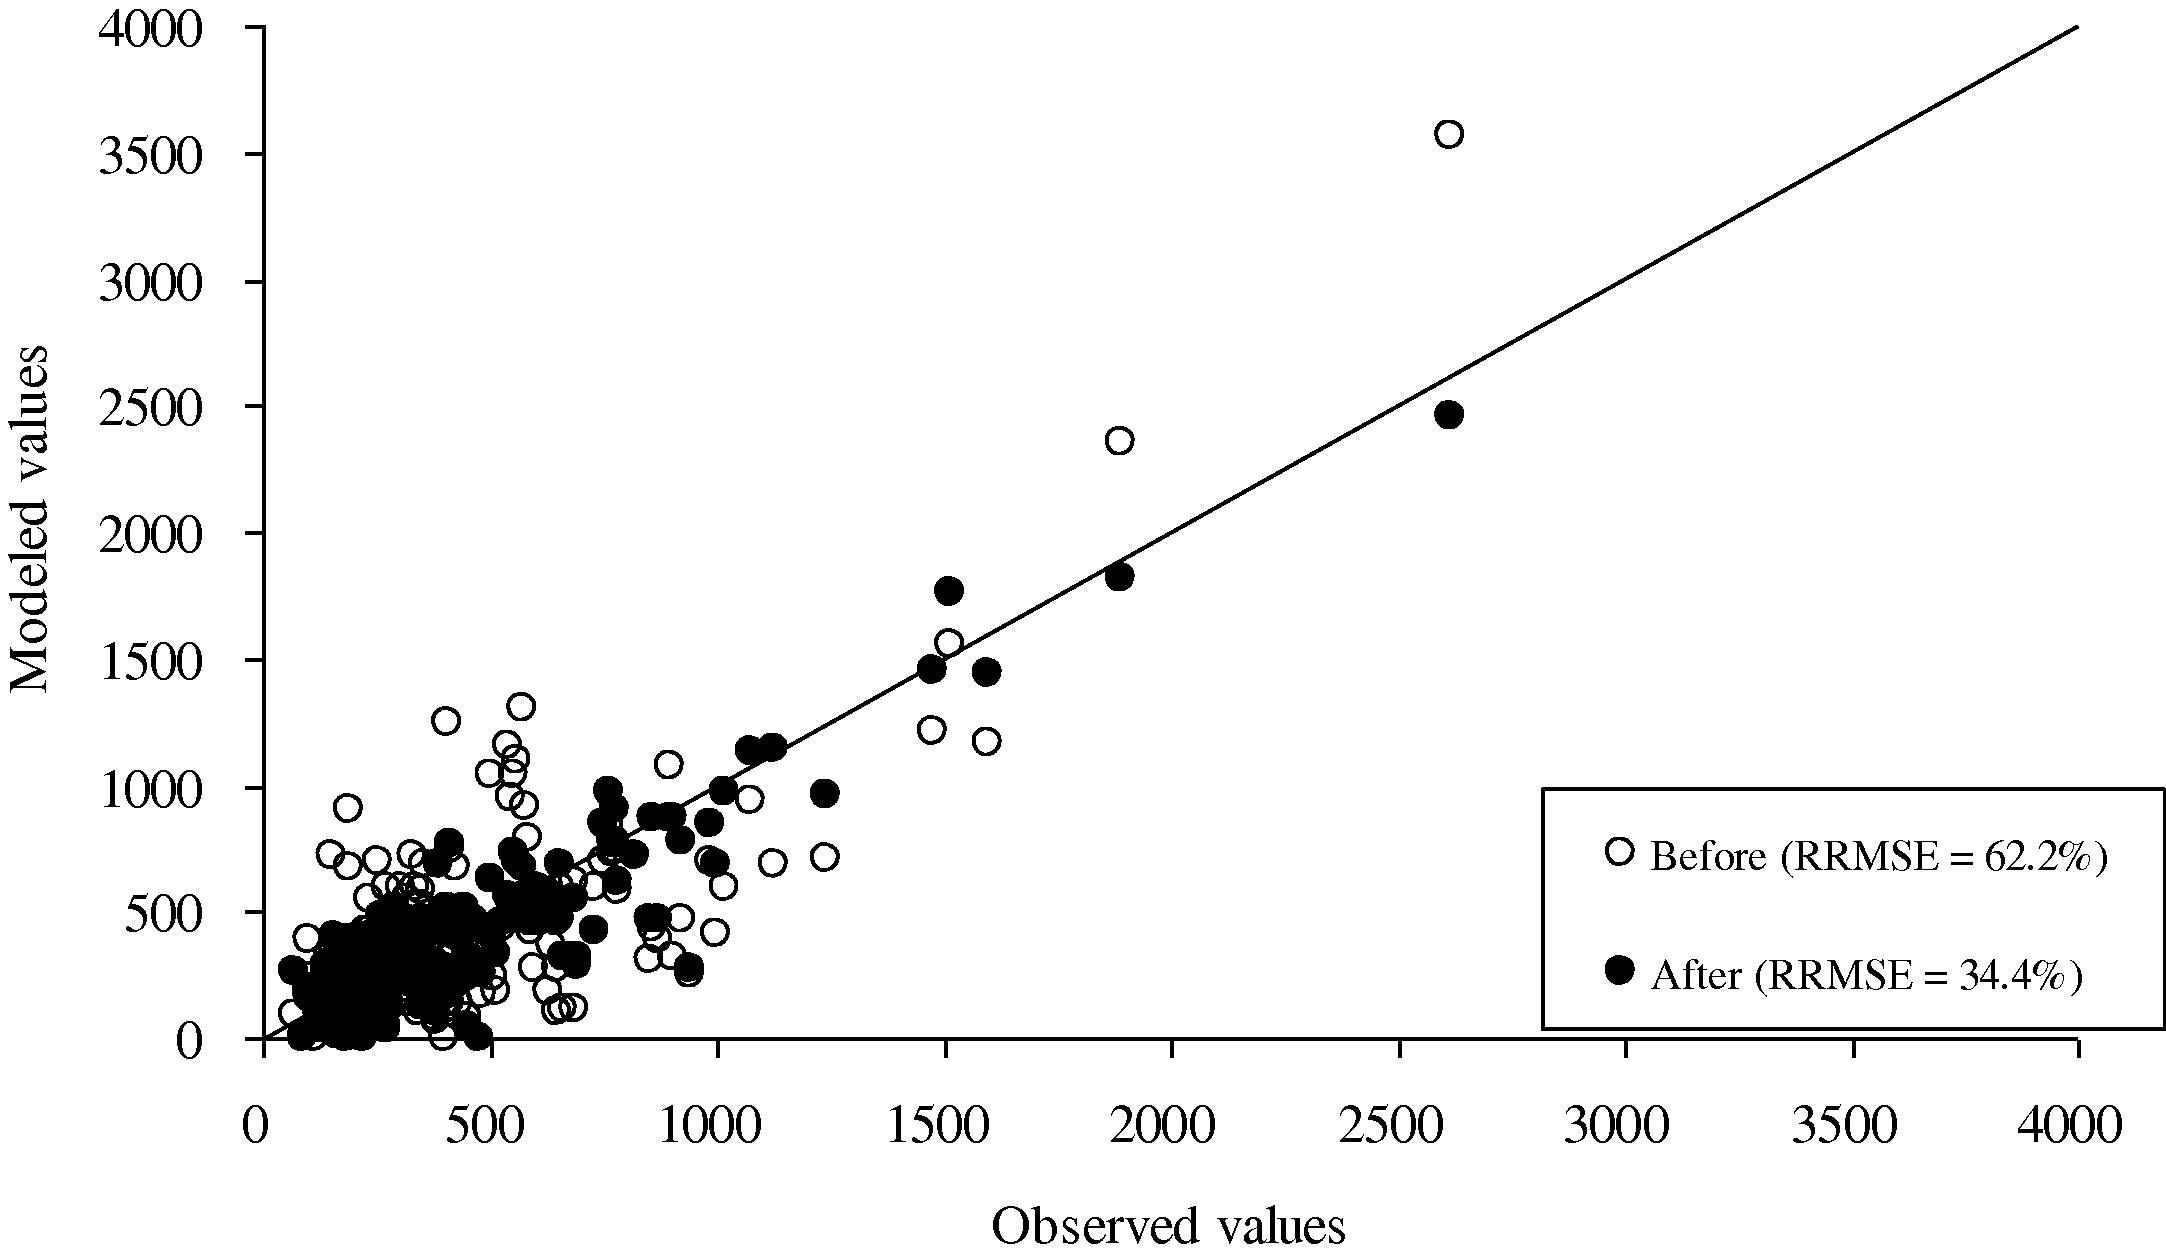
Comparison of the modeled and observed link flows of private cars for normal days before and after the trip estimation procedure.
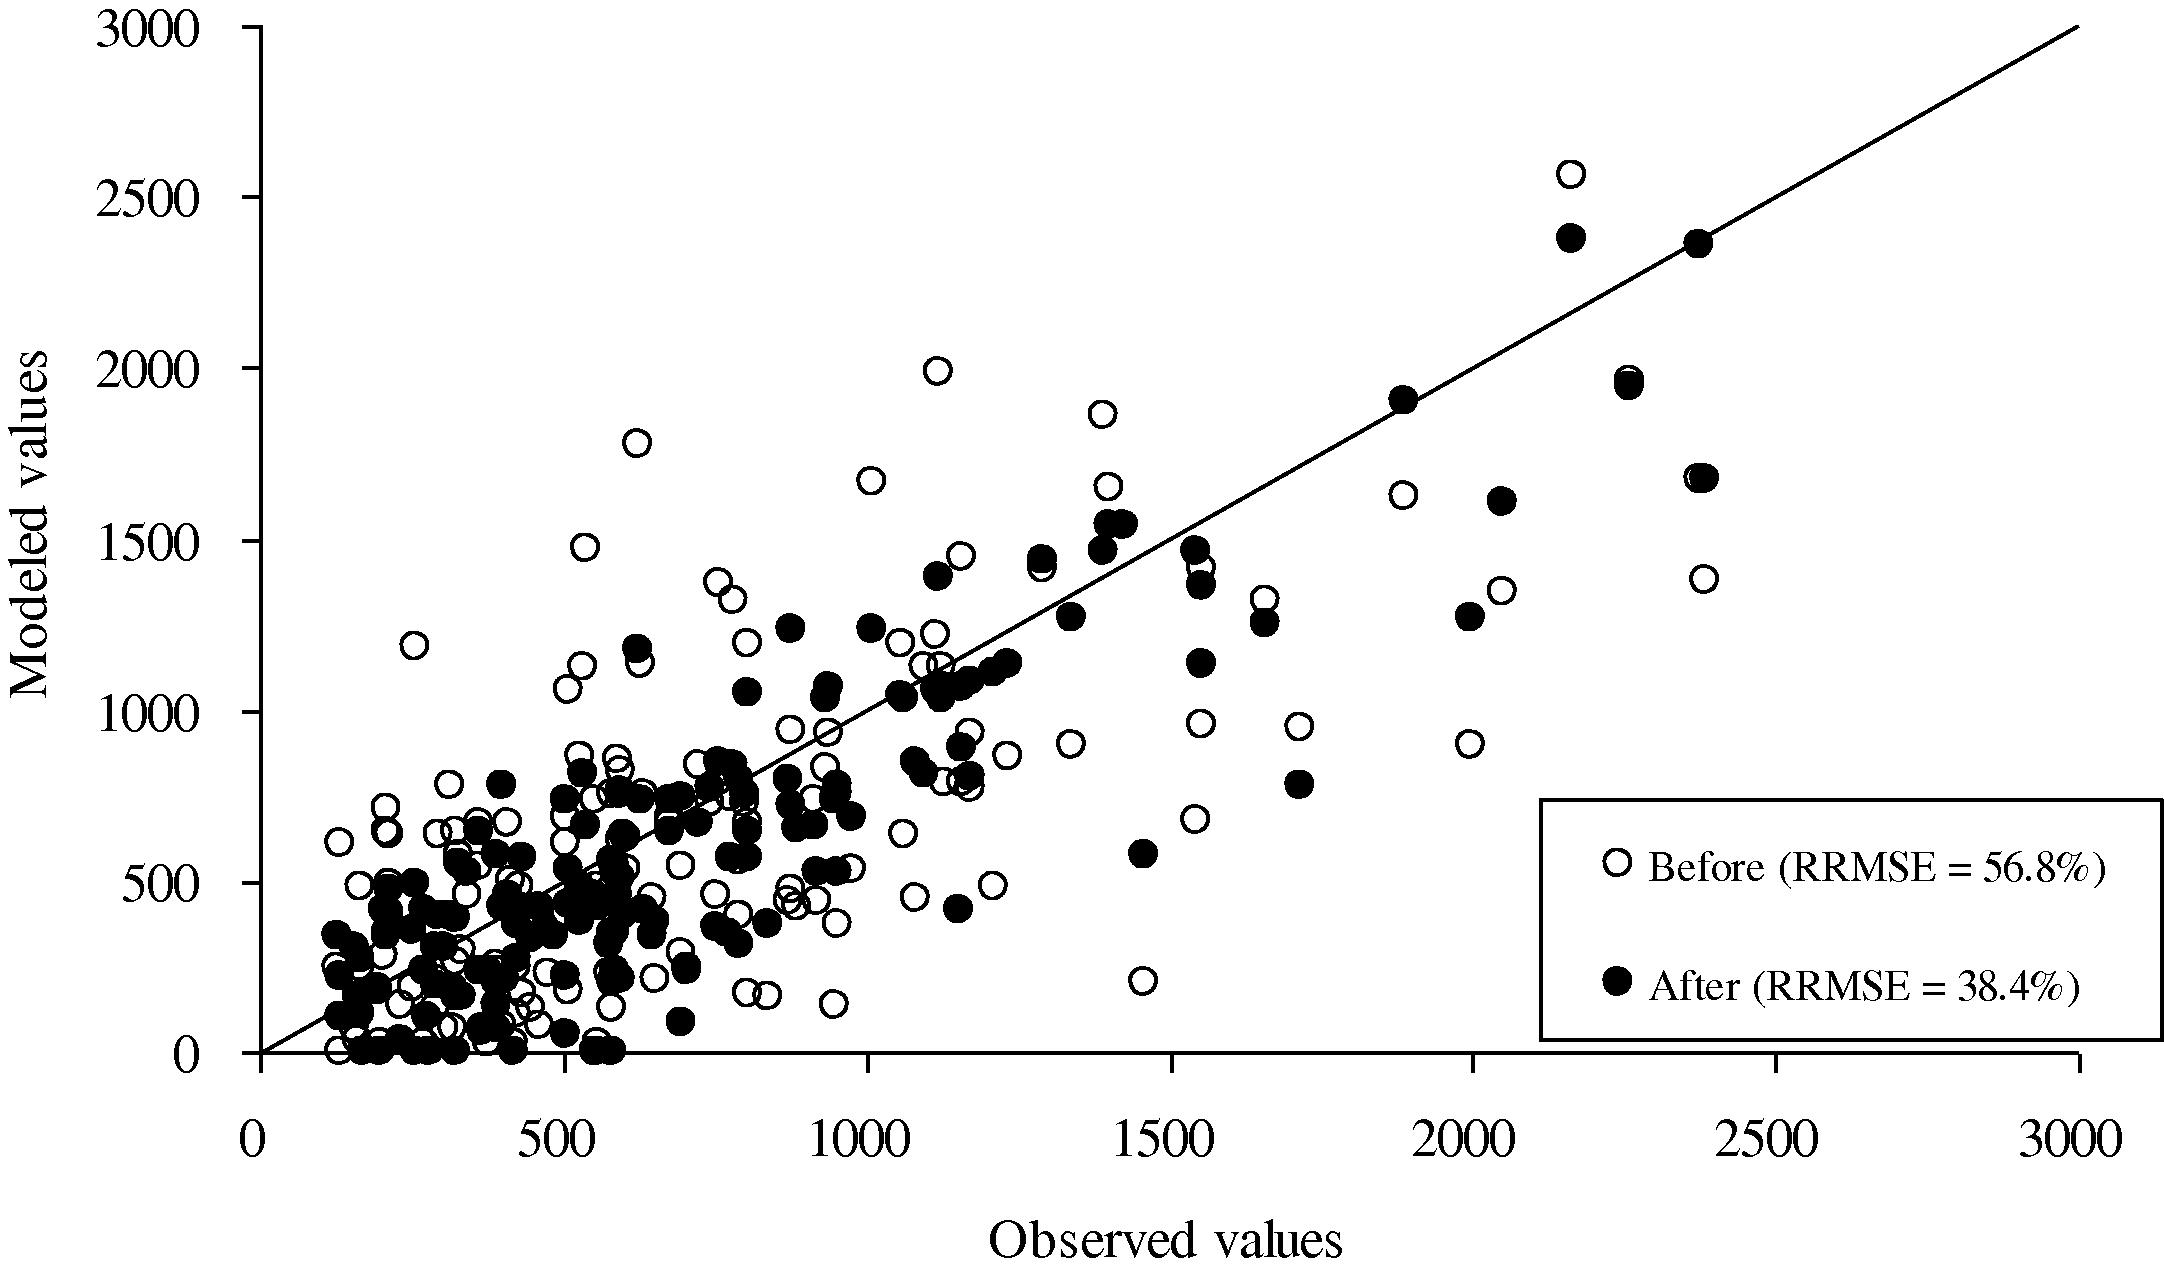
Comparison of the modeled and observed link flows of motorcycles for normal days before and after the trip estimation procedure.
Vehicle mode
RRMSE (%) before estimation
RRMSE (%) after estimation
Car
62.2
34.4
Motorcycle
56.8
38.4
Total
50.8
30.9
5.3 Estimation result for GP event
To estimate the OD matrices for the GP event, we make use of a different set of prior OD matrices and evaluate the improvements. Firstly, we investigate if the estimated OD matrices for normal day can characterize the travel demand pattern during the GP event better than the household survey OD. We assign the OD from household survey
into the GP network, and the RRMSE errors of the observed link flows during the event and modeled link flows are 64.7% and 60.5%, respectively, for private cars and motorcycles. In contrast, the RRMSE errors by assigning the estimated OD matrices for normal day to the GP network are 45.8% and 56.0%, respectively, for private cars and motorcycles. Therefore, it shows that using the estimated OD matrices for normal day can better represent the travel demand in the GP network. The results are shown in Table 3.
Vehicle mode
Using
from household survey as prior OD
Using estimated OD for normal day as prior OD
RRMSE (%) before estimation
RRMSE (%) after estimation
RRMSE (%) before estimation
RRMSE (%) after estimation
Car
64.7
25.6
45.8
24.3
Motorcycle
60.5
40.2
56.0
38.6
Total
55.0
27.2
44.7
25.6
Next we estimate the OD matrices using estimated OD matrices for normal day as prior and observed link counts during GP, and the traffic assignment is solved with the GP network, in which some links are subject to temporal road closure. The RRMSE of modeled link flows after estimation are reduced to 24.3% and 38.6% for private cars and motorcycles traffic, respectively. With the proposed estimation approach, the modeled link flows show good matching with the observed traffic pattern. The RRMSE errors are largely reduced as compared to the case of before estimation. The “before” and “after” comparisons are shown in Fig. 8 for private car and Fig. 9 for motorcycle mode.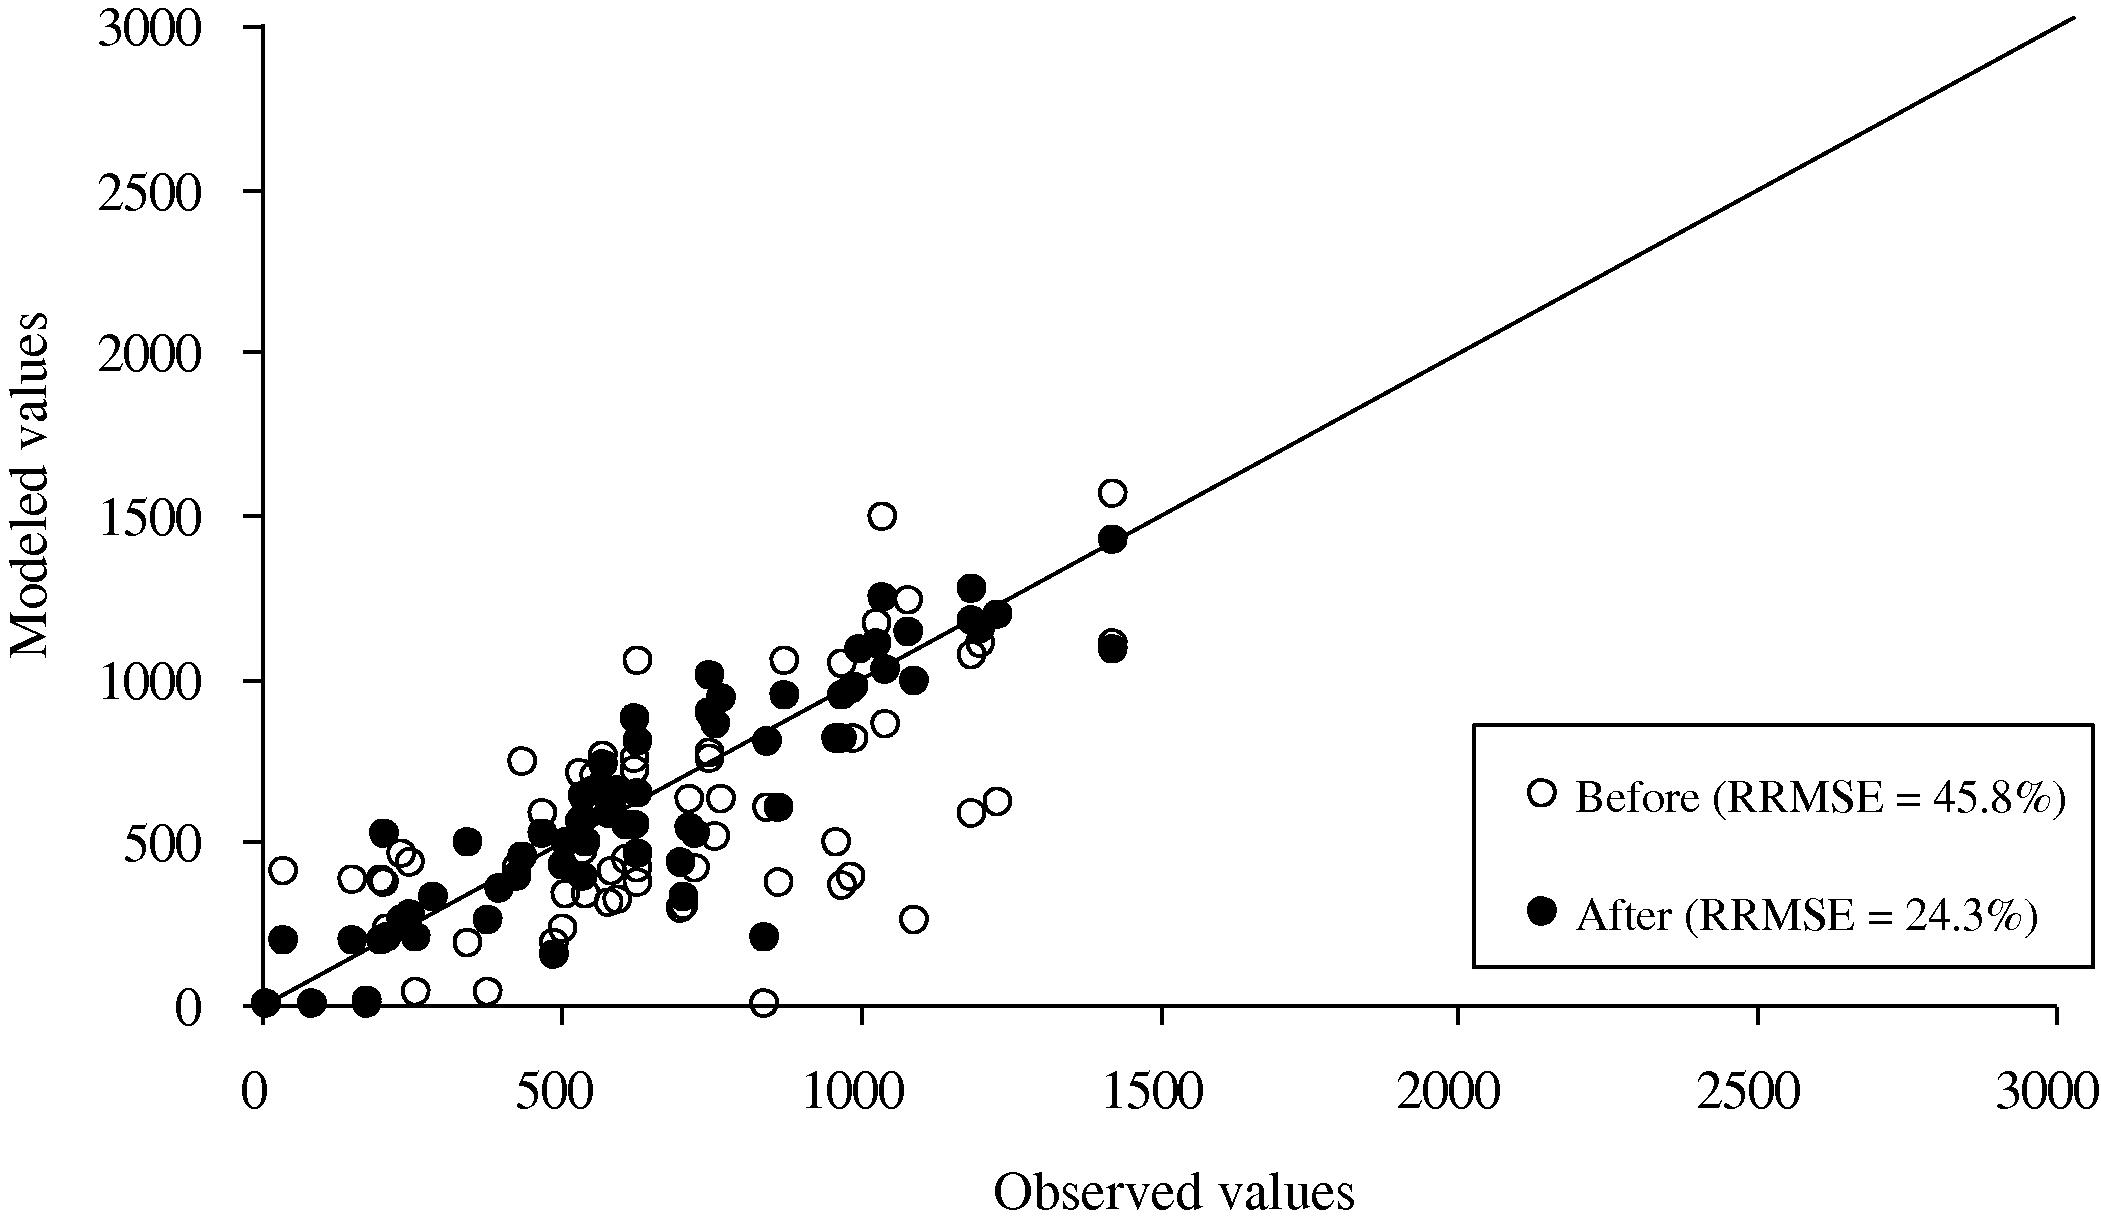
Comparison of the modeled and observed link flows of private cars during the GP event before and after the trip estimation procedure.
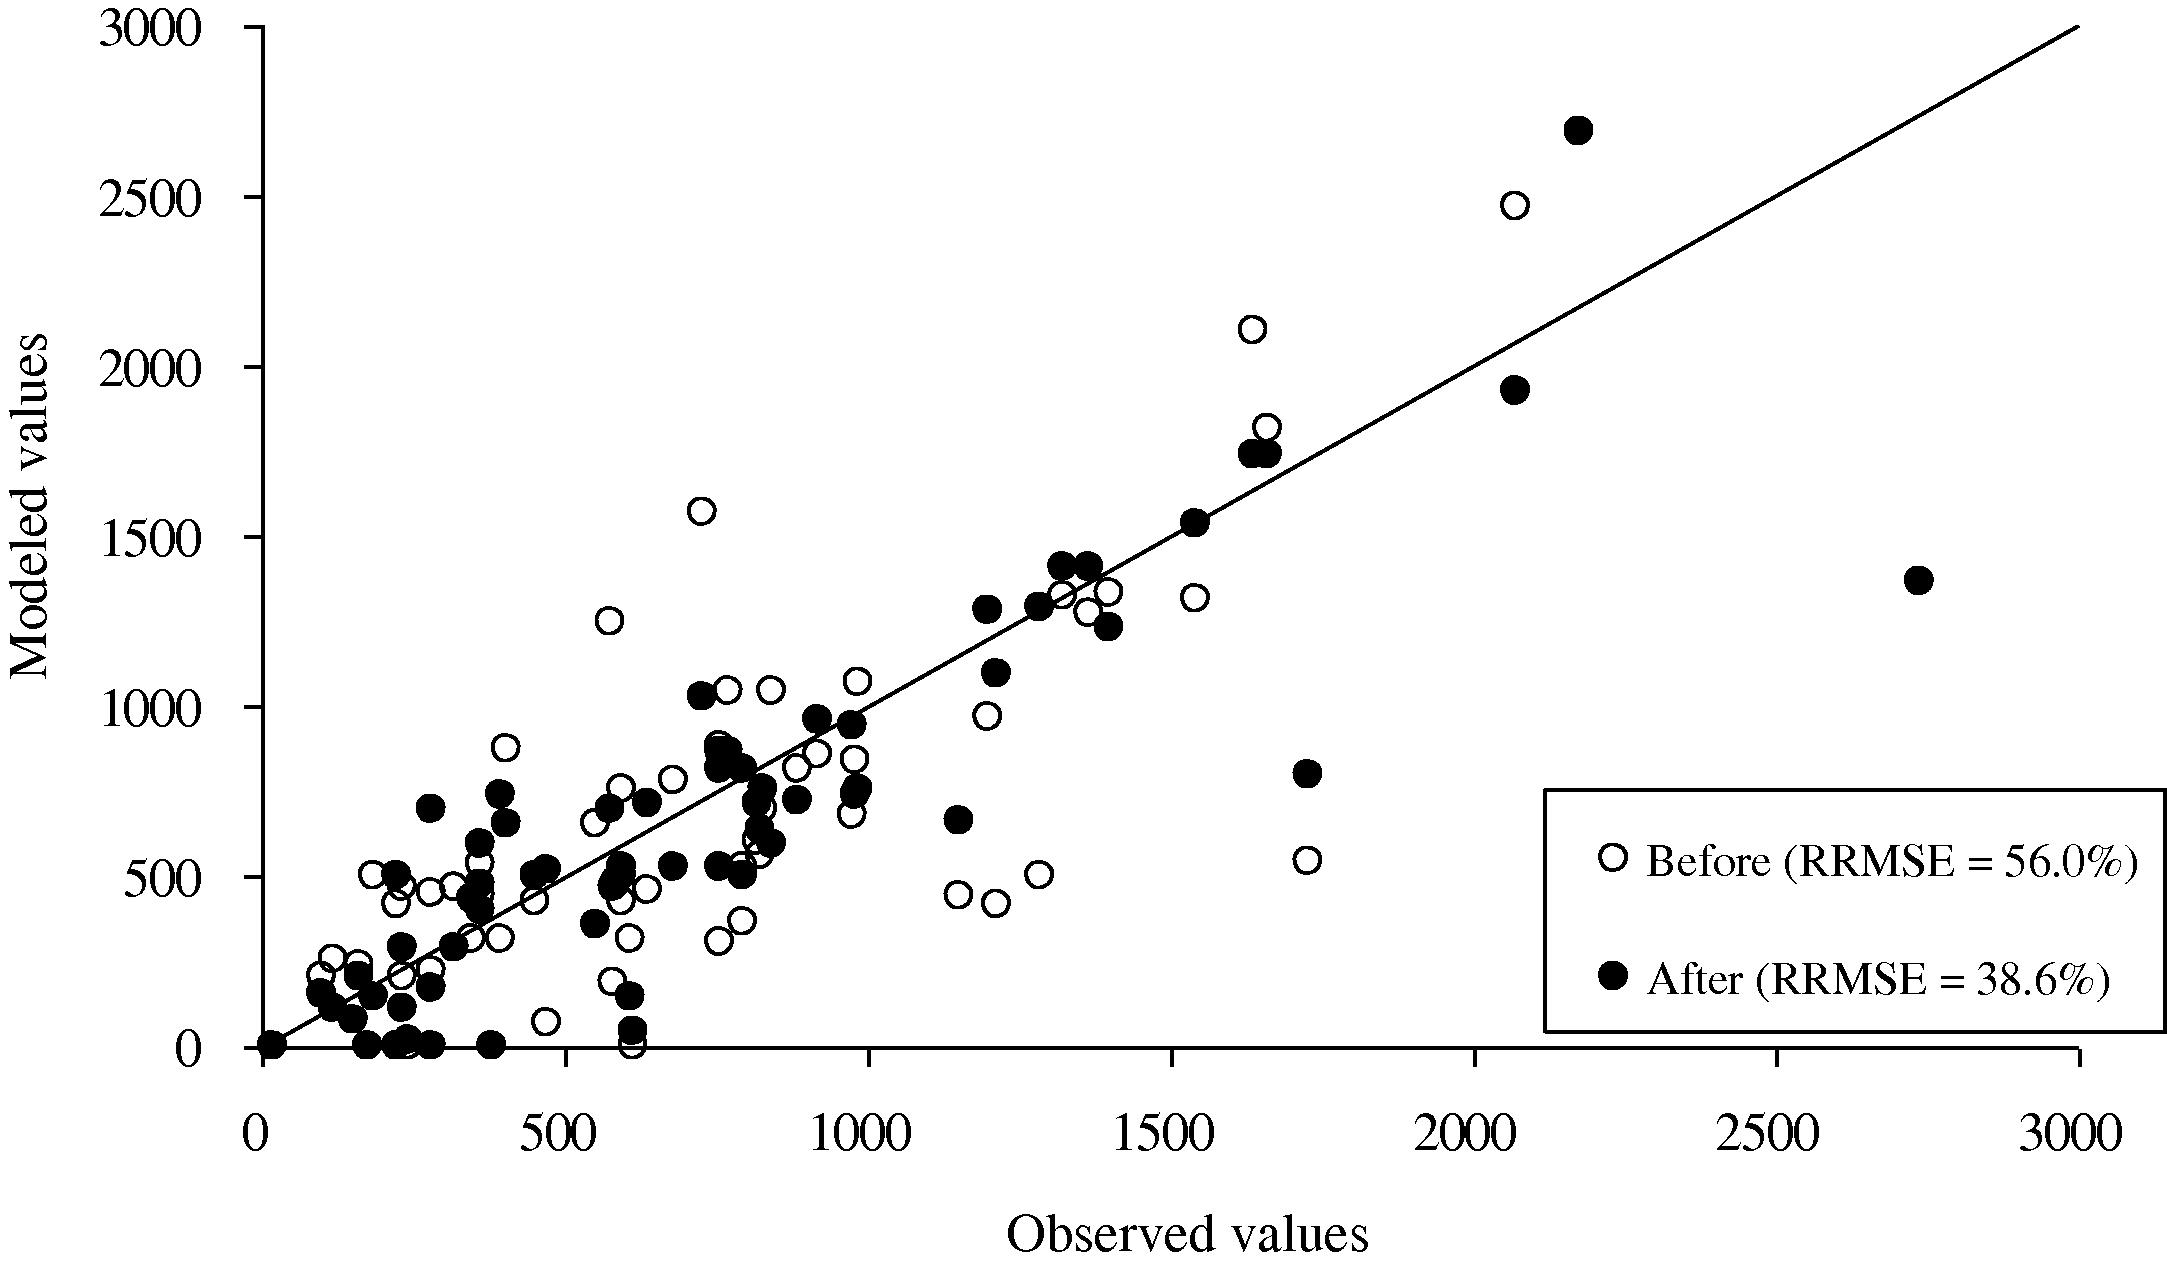
Comparison of the modeled and observed link flows of motorcycles during the GP event before and after the trip estimation procedure.
To see the changes of traffic pattern during the mass event, the flow values on selected links with large variations between normal day and GP event are shown in Figs. 10 and 11, respectively. It can be observed that during GP there are large differences in the link flows for those links leading to and from the city centre, and the differences can be more than 30% as shown by the details of the results. Such variations can be captured in our analysis, and the findings can be useful for the traffic planner to evaluate and adjust their traffic management arrangement.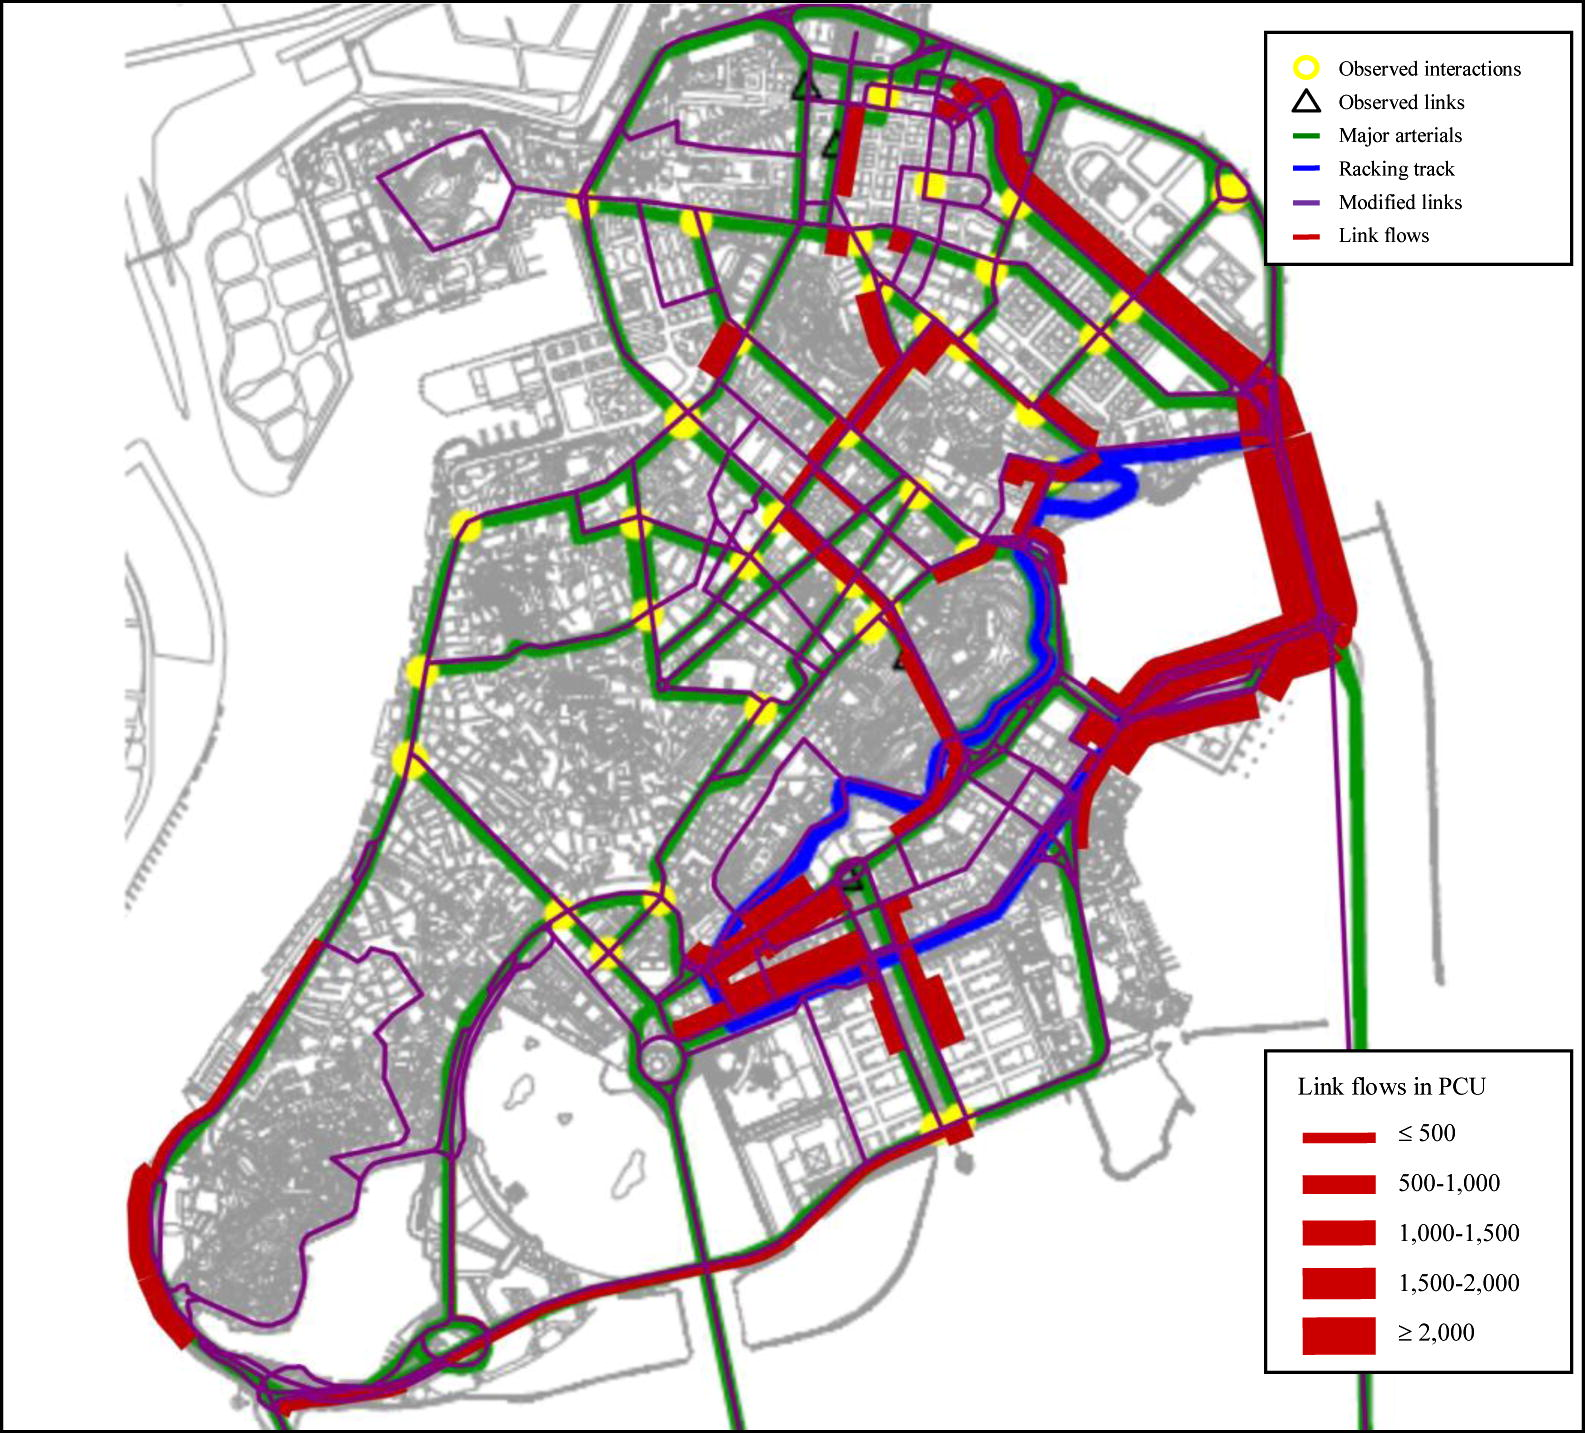
Flow values on selected links for normal day.
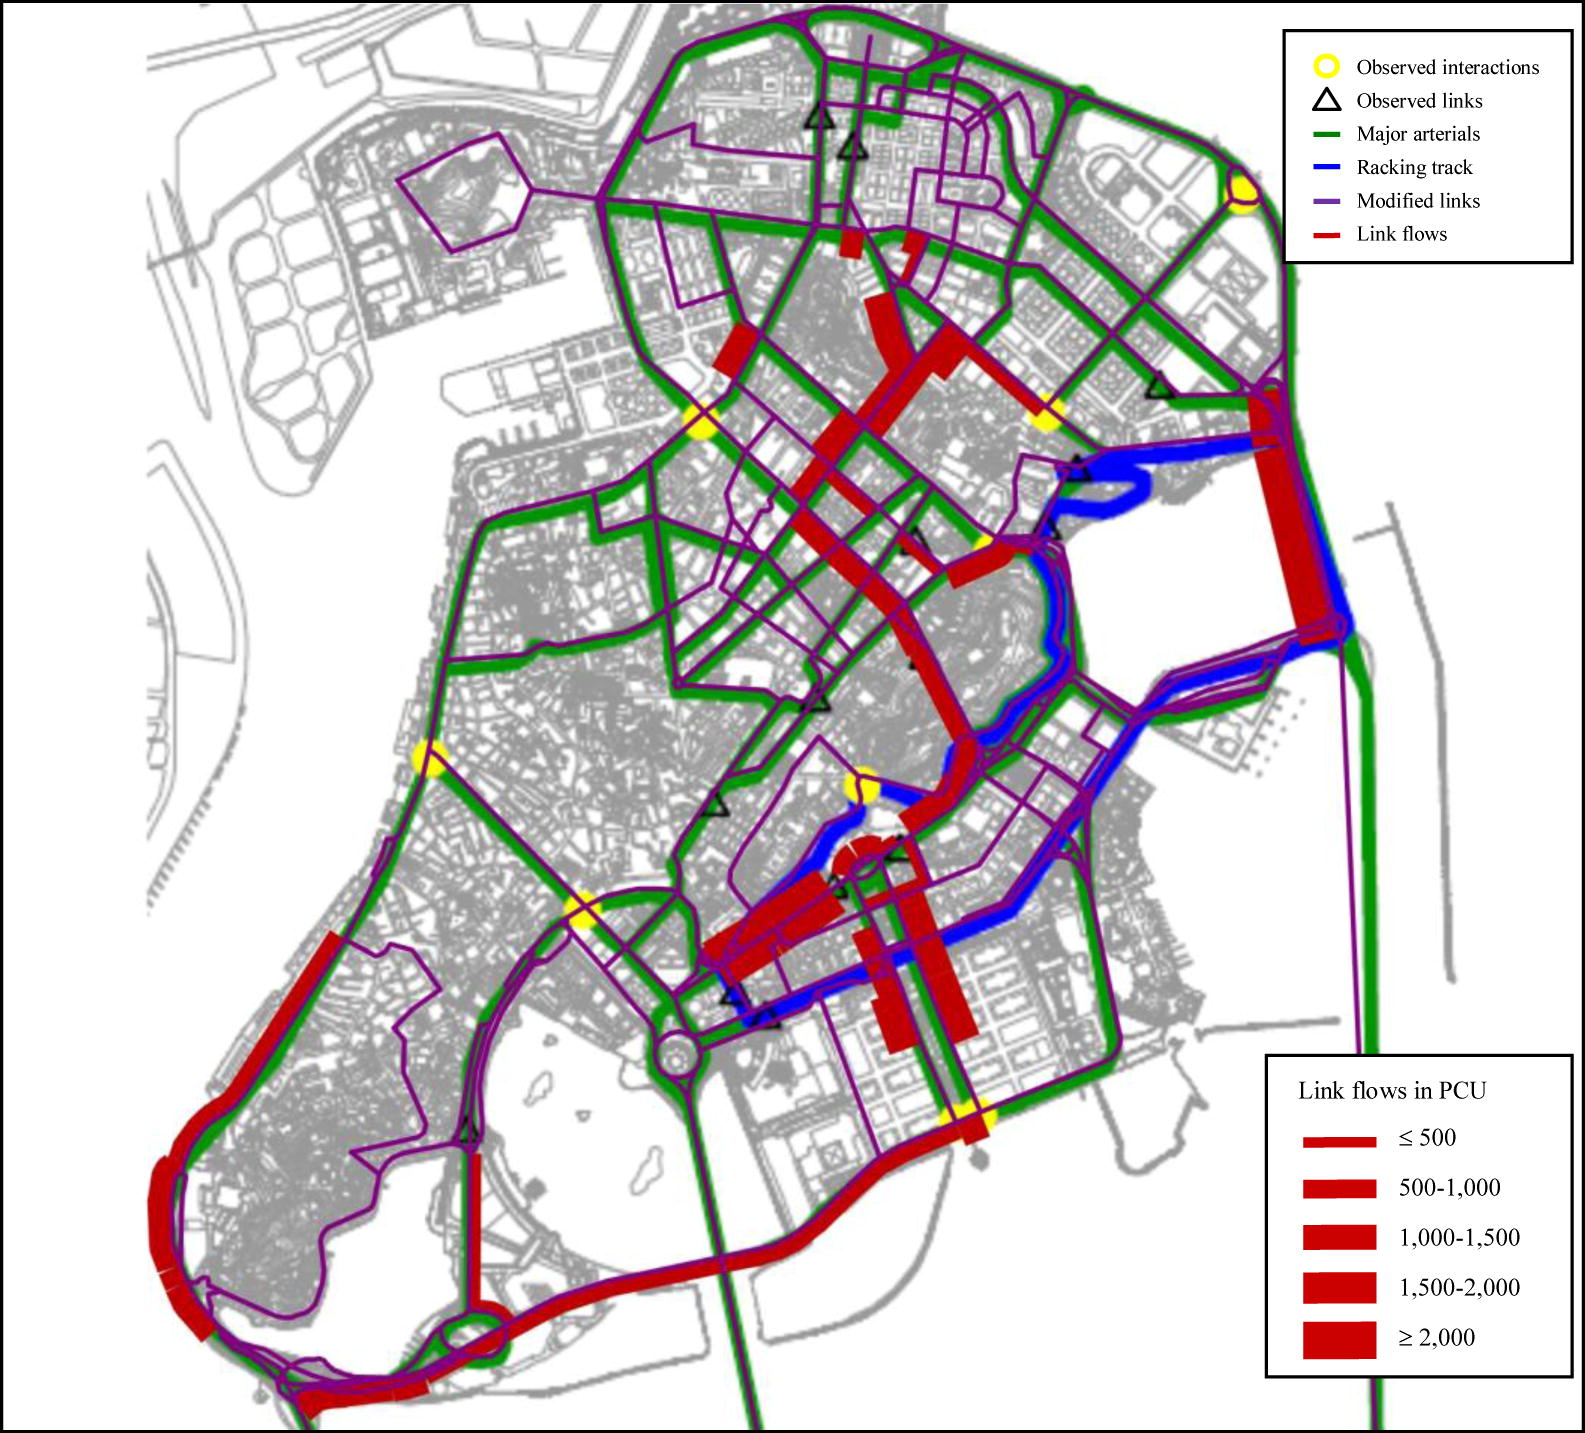
Flow values on selected links during GP event.
5.4 Trip length distributions
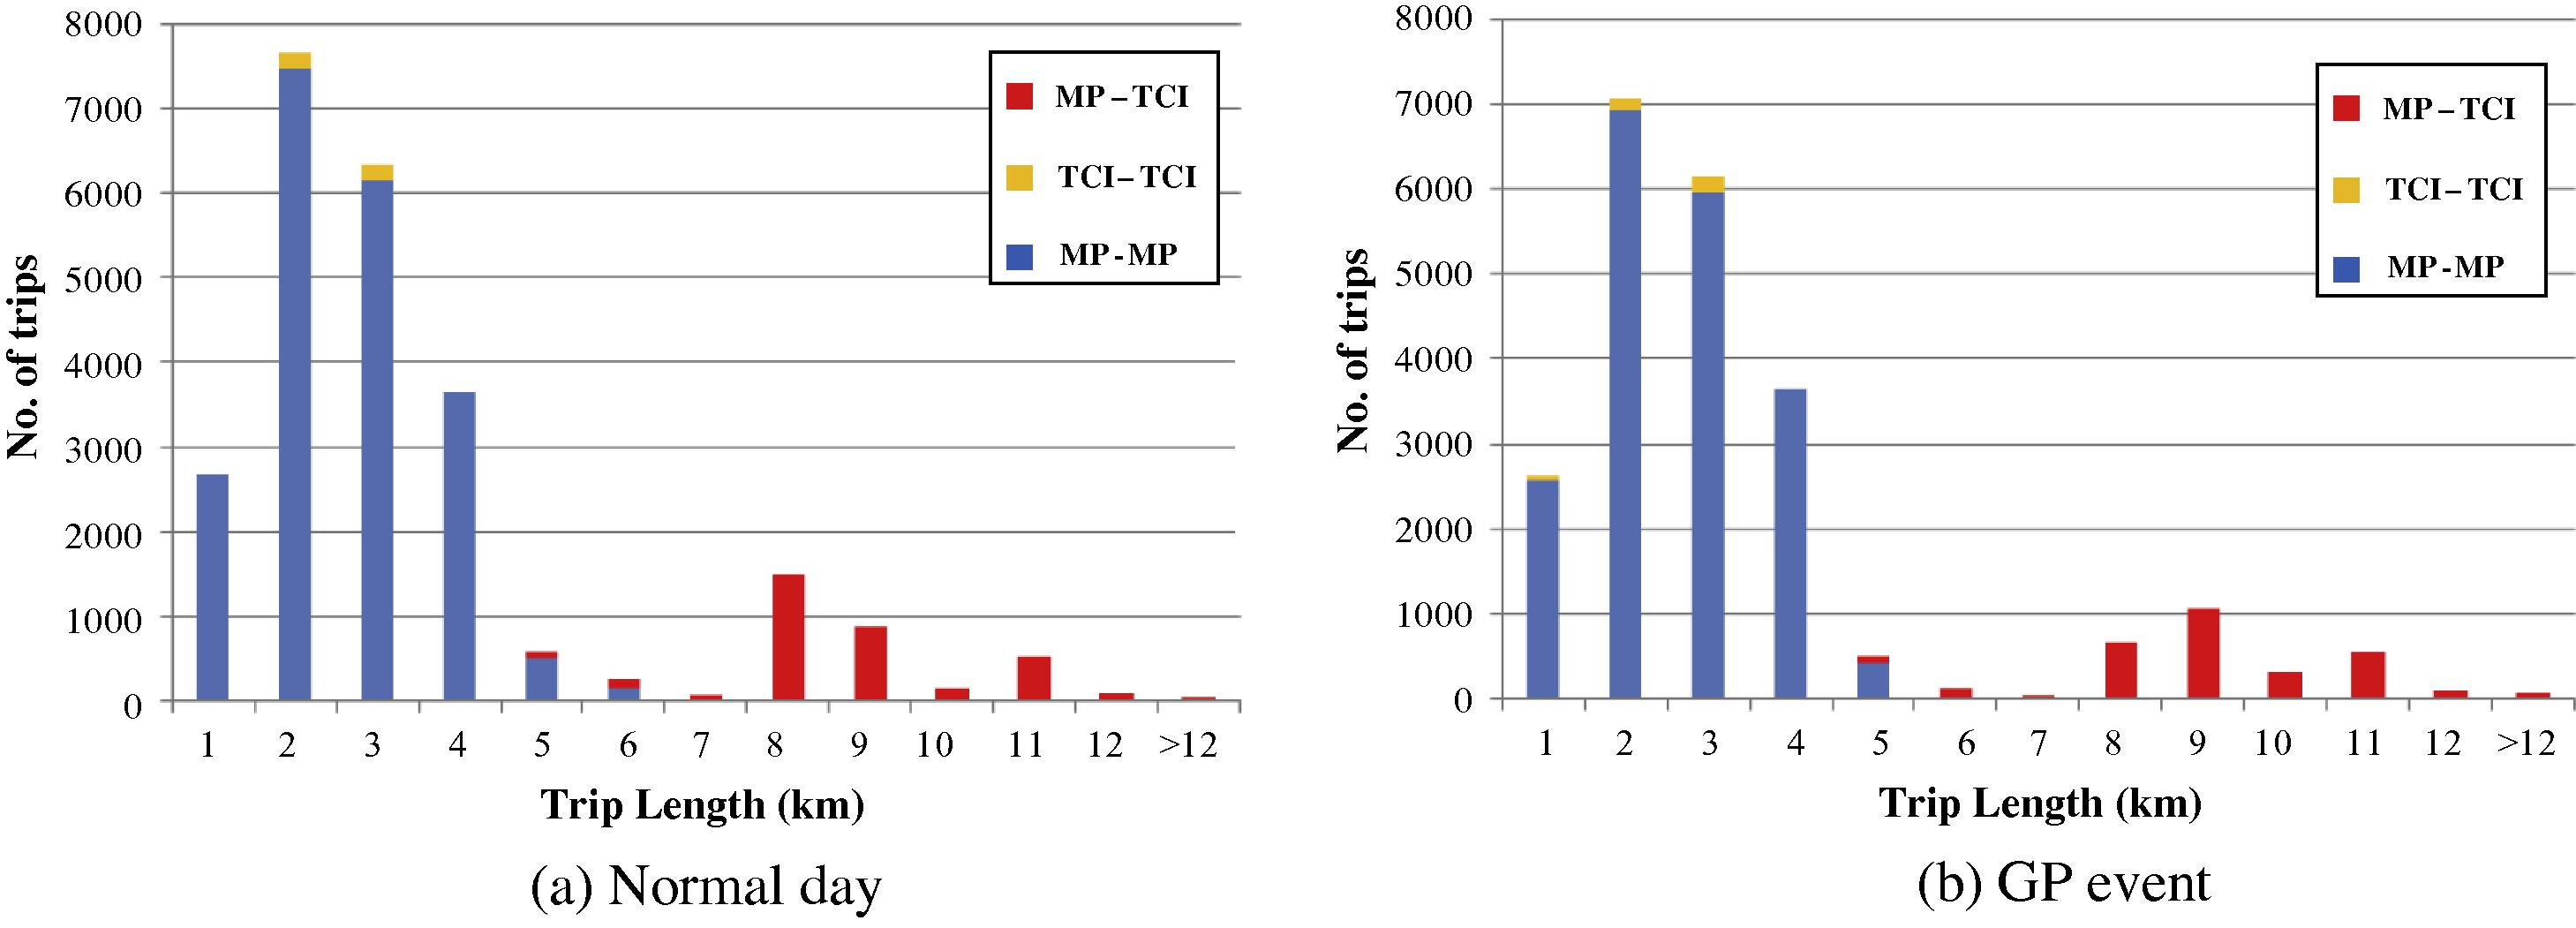
To understand the change of travelers’ behavior during the event, we analyze the trip length distributions of the OD matrices. Fig. 12 illustrates and compares the trip length distributions of private car trips for normal day and GP event. The trips were also separated considering the locations of the origin and destination. For the two areas Macau peninsula (MP) and Taipa and Coloane island (TCI), trips between MP and TCI crossing the bridges are longer than the city trips. We consider three types of trips, namely MP–MP for trips within MP, MP–TCI for trips crossing the bridges and TCI–TCI for trips within TCI. From Fig. 12(a), we can see that most MP–MP trips within the city are within 4 km, with a maximum of 6 km. Most of the MP–TCI trips are within the range of 7–10 km. Fig. 12(b) is the distribution of private car trips during GP event, for which we can see that the there is an increase in the number of trips at the 4-km range (and a decrease for 3-km trips), and the average trip length is increased. There were also more MP–TCI trips during GP, but the TCI–TCI trips were unaffected by the GP event. Similar comparisons of trip length distribution for motorcycle trips are shown in Fig. 13, and the differences between normal day and GP event are insignificant. It is possibly because motorcycles have a higher flexibility in their route choices, and therefore, the motorcycle trips are less sensitive to the changes in the network.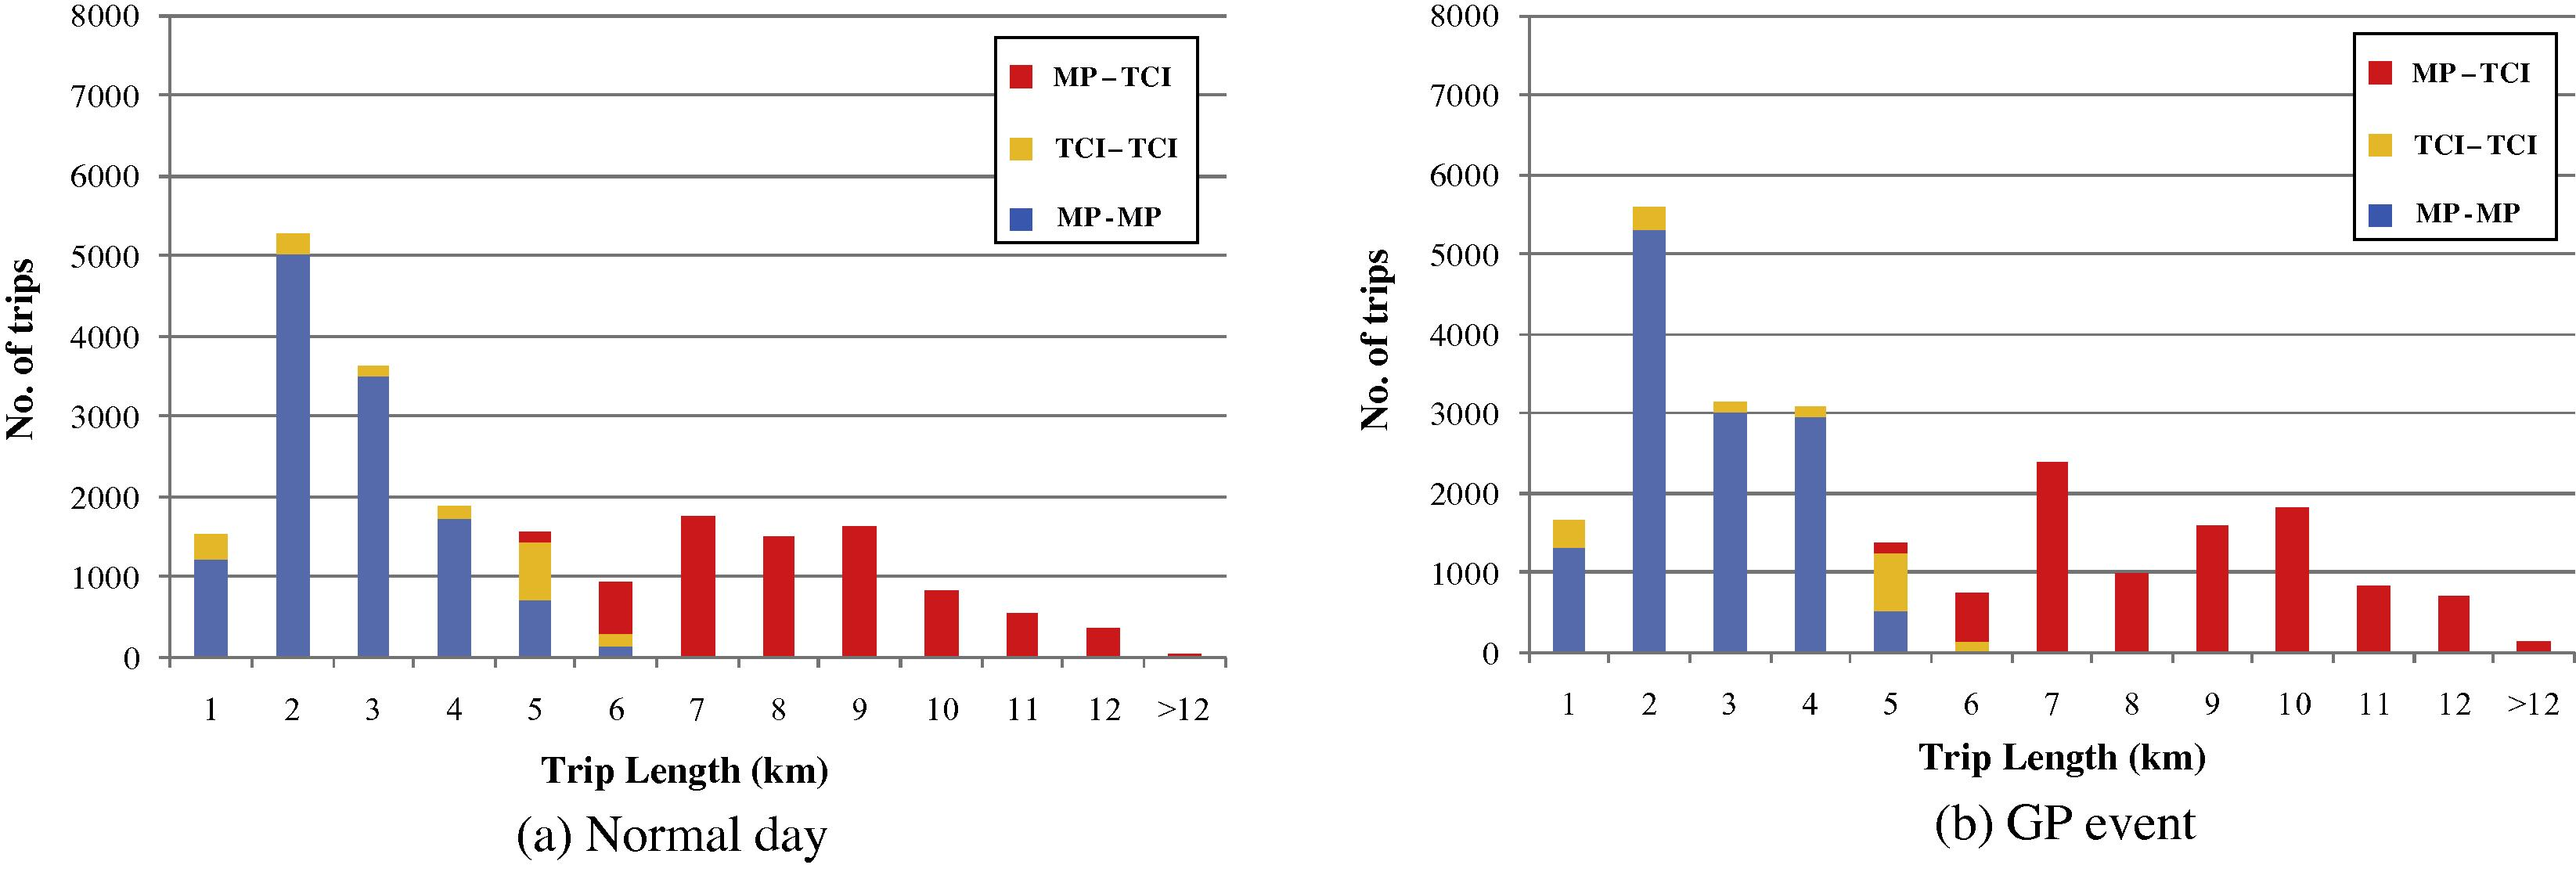
Trip length distributions of private car trips between Macau peninsula (MP) and Taipa and Coloane island (TCI).
Trip length distributions of motorcycle trips between Macau peninsula (MP) and Taipa and Coloane island (TCI).
6 Concluding remarks
We have studied the problem of estimating the OD matrices of a city area during a planned special event. A case study of Macau Grand Prix motor-racing event is investigated. The event is held annually in the streets of Macau city, which not only attracts a lot of visitors, but also restricts the accessibility of the transportation network for the residents. In the past, the traffic controls were suggested by the event organizer and government departments based on their experiences, lacking any scientific approach or tools in the evaluation of the measures.
In this paper, an OD matrices estimation procedure with multiple vehicle classes is presented, in which the demand matrices are assigned to the network with a multiclass deterministic user-equilibrium traffic assignment model. A simultaneous optimization process has been proposed to integrate the entropy-based optimization model for the OD estimation and the network equilibrium model, which is solved in an iterative manner. While the entropy maximization model minimizes the differences between the modeled and observed link flows, the network equilibrium model updates the link choice proportions of each vehicle modes in the iteration.
For the case of mass event, the data availability is limited. Therefore, we propose a two-stage procedure to estimate the OD matrices for special event, making use of the estimated OD matrices for normal day as the prior OD in the estimation, and it is shown that the estimation performances are improved. In overall, there is a good matching between the observed and modeled link flows, and therefore, the estimated OD is reliable for further analysis. The results of the analysis also illustrate that there are very different traffic patterns during the event for the links leading to and from the city centre. This is helpful for the associated department or traffic planner to identify the situation with limited traffic counting data. However, the planner should be careful when using the results, which maybe useful for a short term basis. When the overall land use pattern or network configuration are changed in the future, the basic travel demand will also change and, therefore, the estimated OD may not be directly applicable for the planning of the event next year. The year-to-year variations of the normal day traffic pattern also need to be calibrated and updated and the proposed procedure can be used as a supplementary.
Using the estimated OD matrices, network analysis can be used to evaluate various traffic control and management issues for planning special events. For example, the topics, such as access restrictions, parking limitations and diversions of private vehicles, public transport provisions and evacuation schemes for event participants can be investigated, which are some directions for further research. The presented methodology in a static approach is useful to assist the traffic planning for special events, which are organized annually. Continuous investigations over years are needed for data collection and verification of the results. It is noted that the current approach cannot be used for dynamic traffic operation and management purposes, which requires real-time traffic data from surveillance system around the event areas. This could be a research direction of traffic modeling and simulation for special events.
Acknowledgement
We would like to express our sincere thanks to Mr. I.M. Wan and Dr. K.P. Kou of University of Macau for providing the opportunity of this study and the support of the data collection.
References
- The estimation of an origin–destination matrix from traffic counts. Transportation Science. 1983;17:198-217.
- [Google Scholar]
- The estimation of origin–destination matrices by constrained generalised least squares. Transportation Research Part B. 1991;25:13-22.
- [Google Scholar]
- Estimation of trip matrices from traffic counts and survey data: a generalized least squares estimator. Transportation Research Part B. 1984;18:289-299.
- [Google Scholar]
- DSAT, 2010. 2009 Travel Characteristics Survey of Macao. Transport Department, Macao SAR Government.
- DSEC, 2010. Census Data, Statistics and Census Service, Census and Statistics. Department, Macao SAR Government. <http://www.dsec.gov.mo>.
- Dunn, W., 2007. Managing Travel for Planned Special Events Handbook: Executive Summary. Federal Highway Administration.
- Federal Highway Administration, 2003. Managing Travel for Planned Special Events Handbook. US Department of Transportation, Washington.
- Friedrich, M., Mott, P., Nökel, K., 2000. Keeping Passenger Surveys up-to-date – A Fuzzy Approach. Transportation Research Records, No. 1735, pp. 35–42.
- Han, A.F., Ho, S.N., 2010. Traveler’s Impact Study of Traffic Planning and Management under Special Events: A Case Study of Macau Grand Prix 2009. Working Paper.
- Estimation of an origin–destination matrix with random link choice proportions: a statistical approach. Transportation Research Part B. 1996;30:309-324.
- [Google Scholar]
- PTV, 2009. VISUM. PTV Software. <http://www.ptvag.com/>.
- Urban Transportation Network: Equilibrium Analysis with Mathematical Programming Methods. Prentice-Hall Inc.; 1985.
- A maximum likelihood model for estimating origin–destination matrices. Transportation Research Part B. 1987;21:395-412.
- [Google Scholar]
- Van Vliet, D., Bergman, T., Scheltes, W.H., 1986. Equilibrium traffic assignment with multiple user classes. In: PTRC Summer Annual Meeting, Planning and Transport Research and Computation Co., England, July 14–17, 1986, pp. 111–121.
- The most likely trip matrix estimated from traffic counts. Transportation Research Part B. 1980;14:281-293.
- [Google Scholar]
- Wan, I.M., Wong, K.I., Kou, K.P., 2009. Highlights of the 2009 travel characteristics survey of Macao. In: Proceedings of the 14th International conference of Hong Kong Societies for Transportation Studies, pp. 263–265.
- Some theoretical aspects of road traffic research. Proceedings of the Institute of Civil Engineers Part II 1952:325-378.
- [Google Scholar]
- Estimation of multiclass origin–destination matrices from traffic counts. Journal of Urban Planning and Development – ASCE. 2005;131:19-29.
- [Google Scholar]
- Estimation of origin–destination matrices for a multimodal public transit network. Journal of Advanced Transportation. 2005;39(2):139-168.
- [Google Scholar]
- Estimation of origin–destination matrices from link traffic counts on congested networks. Transportation Research Part B. 1992;26:417-434.
- [Google Scholar]
- Heuristic algorithms for the bilevel origin–destination matrix estimation problem. Transportation Research Part B. 1995;29:231-242.
- [Google Scholar]


