Translate this page into:
Kinetic analysis of nonisothermal decomposition of (Mg5(CO3)4(OH)2·4H2O/5Cr2O3) crystalline mixture
*Corresponding author asmaalothman@yahoo.com (Asma A. Al-Othman)
-
Received: ,
Accepted: ,
This article was originally published by Elsevier and was migrated to Scientific Scholar after the change of Publisher.
Abstract
Pure MgCr2O4 spinel was synthesized from crystalline mixture of (Mg5(CO3)4(OH)2·4H2O/5Cr2O3) by heating at 900 °C for 27 h. TG, DTA, FT-IR and XRPD techniques were used to follow the reactions and identify the products. Nonisothermal kinetics of thermal decomposition of un-irradiated and γ-irradiated physical crystalline mixtures were studied in static air. The kinetic parameters were obtained through model-fitting and model-free methods, and artificial isokinetic relationship (IKR) for multi-step processes. The results show that the decomposition for both un-irradiated and γ-irradiated mixtures proceed through two steps with different reaction mechanisms. The first is a third-order reaction (F3) mechanism followed by one-dimensional diffusion (D1) as a second step.
Keywords
Thermal decomposition
Model fitting
Model free
Isokinetic
Kinetic parameter
MgCr2O4 spinel
1 Introduction
The tremendous increase in the development of the industrial and transportation sectors have led to consumption of huge quantities of fuel which results in an increase in the amount of hazardous gases such as NOx, CH and COx emitted to the environment. Low cost transition metal mixed oxides such as spinels are active in catalytic total oxidation processes aimed at limiting of air pollution, which often is carried out on the more expensive noble metal-based catalysts. Spinels with AB2O4 formula such as pirochromite MgCr2O4 have additional important technological applications such as magnetic materials, high temperature ceramics, combustion catalysis, catalytic support, strength agents, sensor elements and inter connection materials for solid oxide fuel cells (Shimizu et al., 1990; Gengembre et al., 1999; Docherty et al., 2001). MgCr2O4 is normal spinel has space group F3dm, with 56 atoms per unit cell (Z = 8), Mg and Cr ions occupy the tetrahedral and octahedral site, respectively (Bhatta and Nayak, 2002).
Thermal decomposition of various compounds are of major importance because of their frequent applications in calcinations metallurgy and in the production of large-surface materials for sorbents and catalysis (Hartman et al., 1994). Many studies have been carried out on the effect of γ-irradiation on the thermal decomposition of inorganic solids (Monshi et al., 1998; Mahfouz et al., 2000, p. 59). In general, the effects with increasing dose are in changing of the induction period and acceleration of the decomposition process i.e. the decrease in time or temperature required to complete the reaction in case of the pre-irradiated material which were attributed to formation of additional nucleation site and reactive center (Mahfouz et al., 2000, p. 363).
In the present work, we report the kinetic studies of the thermal decomposition of crystalline mixtures (Mg5(CO3)4(OH)2·4H2O/5Cr2O3) before and after γ-irradiation by applying model-fitting and model-free kinetic approaches to the nonisothermal thermoanalytical data. Formation of magnesium chromite from above materials is also reported. TG, DTA, FT-IR and XRPD techniques were used to follow the reactions and identify the products.
2 Experimental
Powder of heavy magnesium carbonate hydrate Mg5(CO3)4(OH)2·4H2O and Cr2O3 were obtained commercially from (BDH reagent grade) and were used without any further purifications. 1:5 molar ratio mixtures of the starting materials were calcined at different temperature in the range (100–900 °C) for 9 h each. For irradiation, samples were encapsulated under vacuum in glass vials and were exposed to successively increasing doses of γ-irradiation at constant intensity using Co-60 γ-ray cell 220 (Nordion MDS, Ontario, Canada) at a dose rate of 102 kGy/h. The source was calibrated against Fricke ferrous sulfate dosimeter, and the dose rate in the irradiated samples was calculated by applying appropriate corrections on the basis of photon mass attenuation and energy-absorption coefficient for the sample and the dosimeter solution (Spinks and Woods, 1990). IR spectra were recorded as KBr pellets using a Perkin–Elmer 1000 FT-IR spectrometer. XRPD measurements were carried out on a Jeol D8030 X-ray diffractometer using a nickel filter (Cu Kα λ = 1.5418 Å). The thermal decomposition of physical mixture was followed by nonisothermal (dynamic) thermogravimetric techniques using TGA-7 (Perkin–Elmer) thermogravimetric analyzer. Dynamic experiments were performed at heating rate 5, 10, 15, 20 and 25 °C/min.
3 Result and discussion
3.1 X-ray powder diffraction (XRPD) analysis
Fig. 1 shows XRPD patterns of the calcined mixtures at different temperatures for different duration times. All phases in the mixtures were identified by FARHAN program (Al-Farhan, 1999). The XRPD pattern of the mixture heated at 300 °C displays only the peaks of Cr2O3, indicating that the heavy magnesium carbonate hydrate had converted to amorphous lower carbonate as documented by FT-IR measurement (see Fig. 2). The XRPD of the mixture calcined at 500 °C shows only the characteristic peaks of Cr2O3 and MgO. No notable changes in XRPD of the mixtures heated up to 600 °C were detected compared with that heated at 500 °C. The XRPD of the mixture calcined at 625 °C are dominated by the peaks of Cr2O3 and MgO, with the main characteristic peaks of MgCr2O4 just starting to show up in the XRPD. MgCr2O4 becomes the dominant phase in the mixture calcined at 900 °C for 9 h. MgCr2O4 is the only phase present in the XRPD pattern of the mixture heated at 900 °C for 27 h. The same result was obtained from the counterpart of irradiated mixture.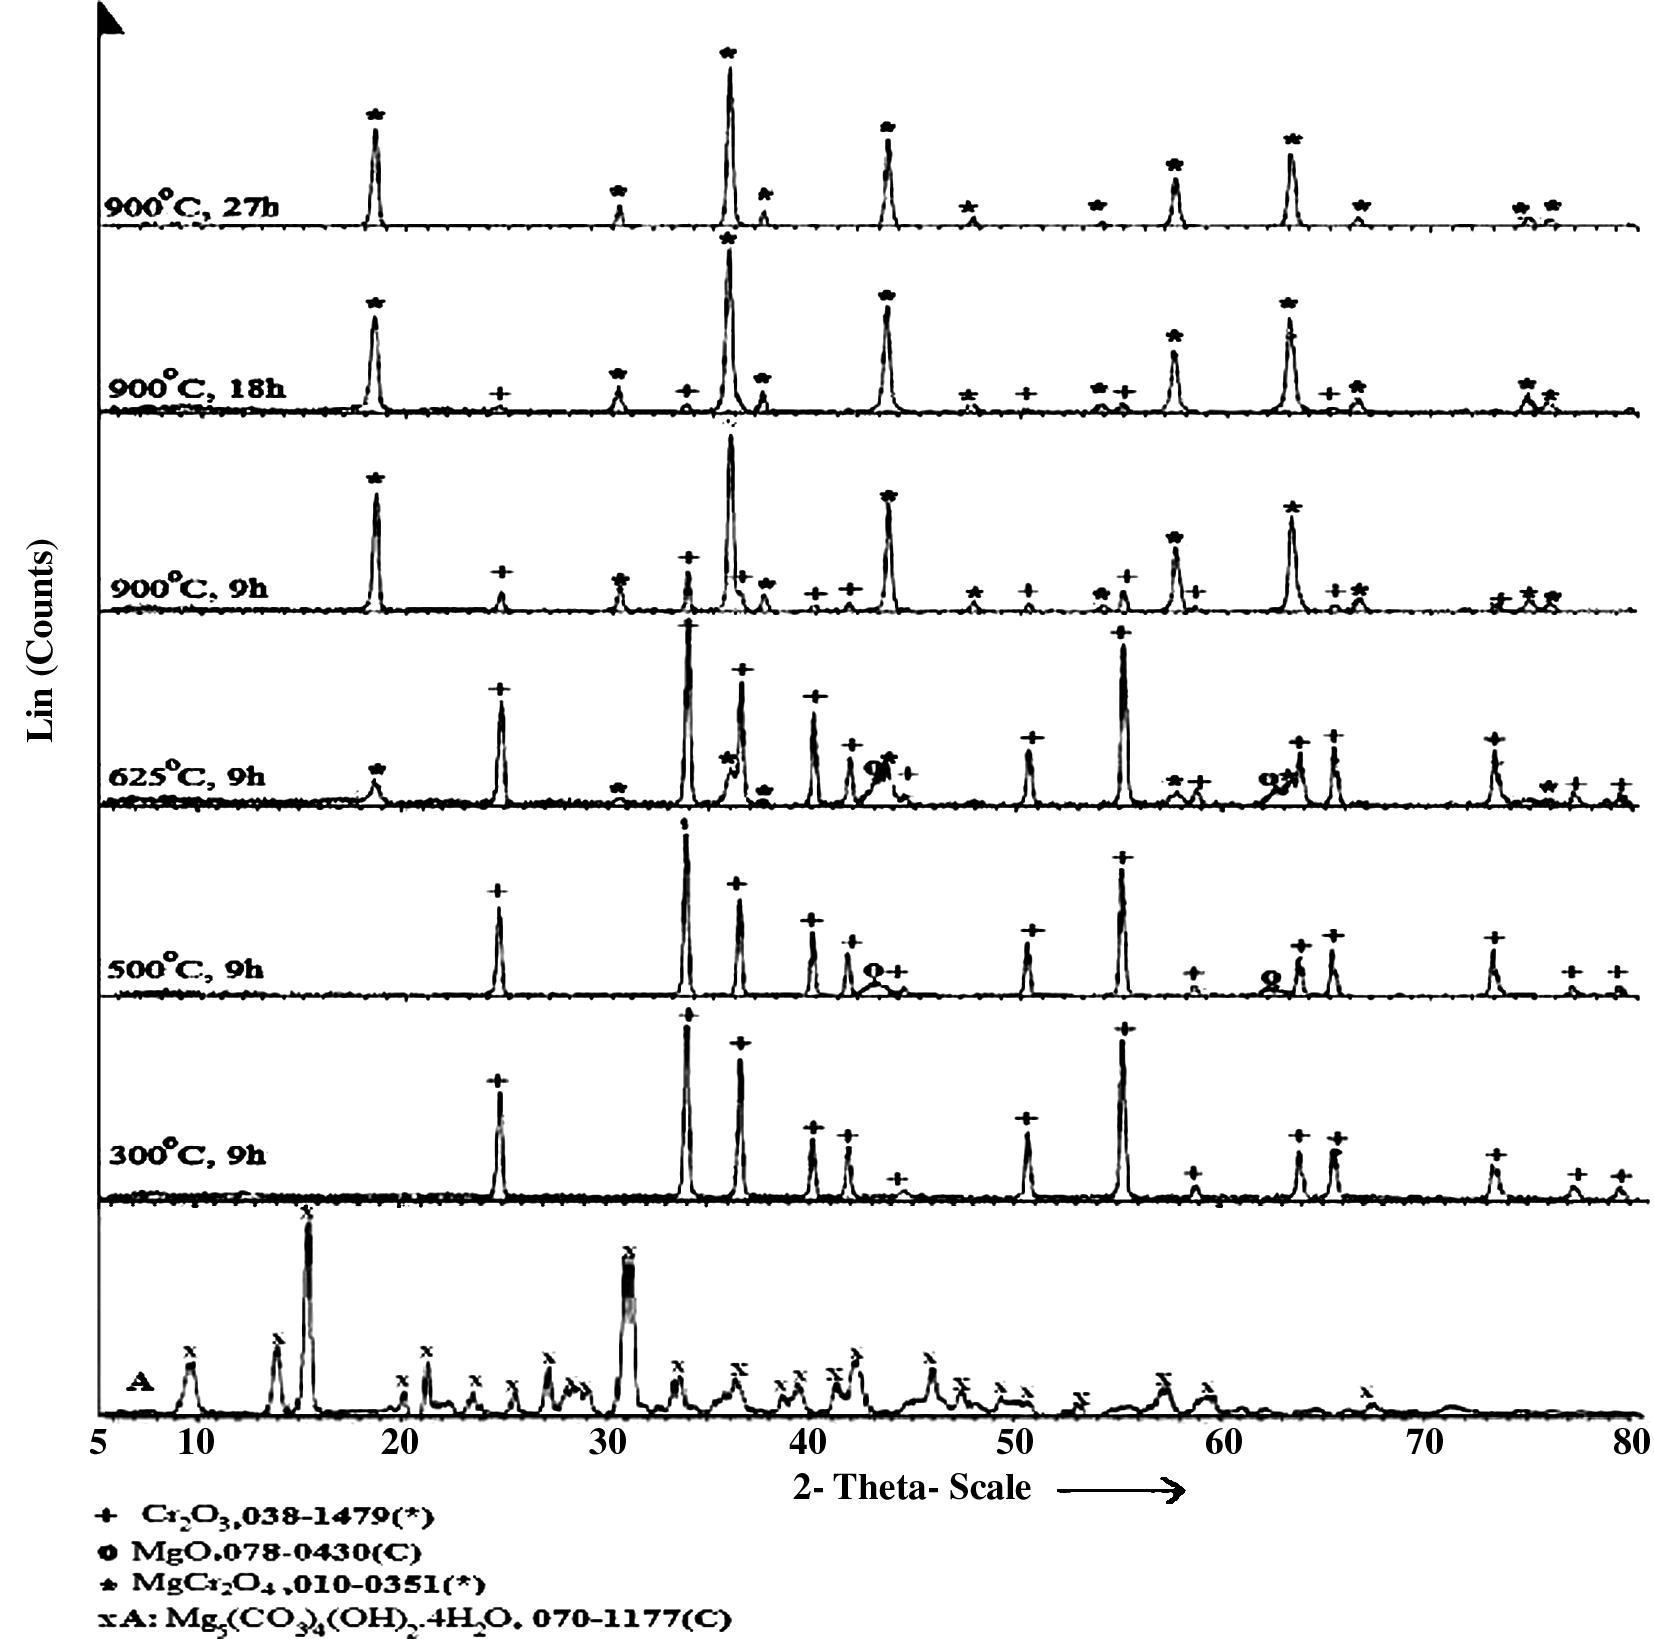
XRPD patterns of un-irradiated (Mg5(CO3)4(OH)2·4H2O) and the calcined un-irradiated mixtures at different temperatures for different time duration.
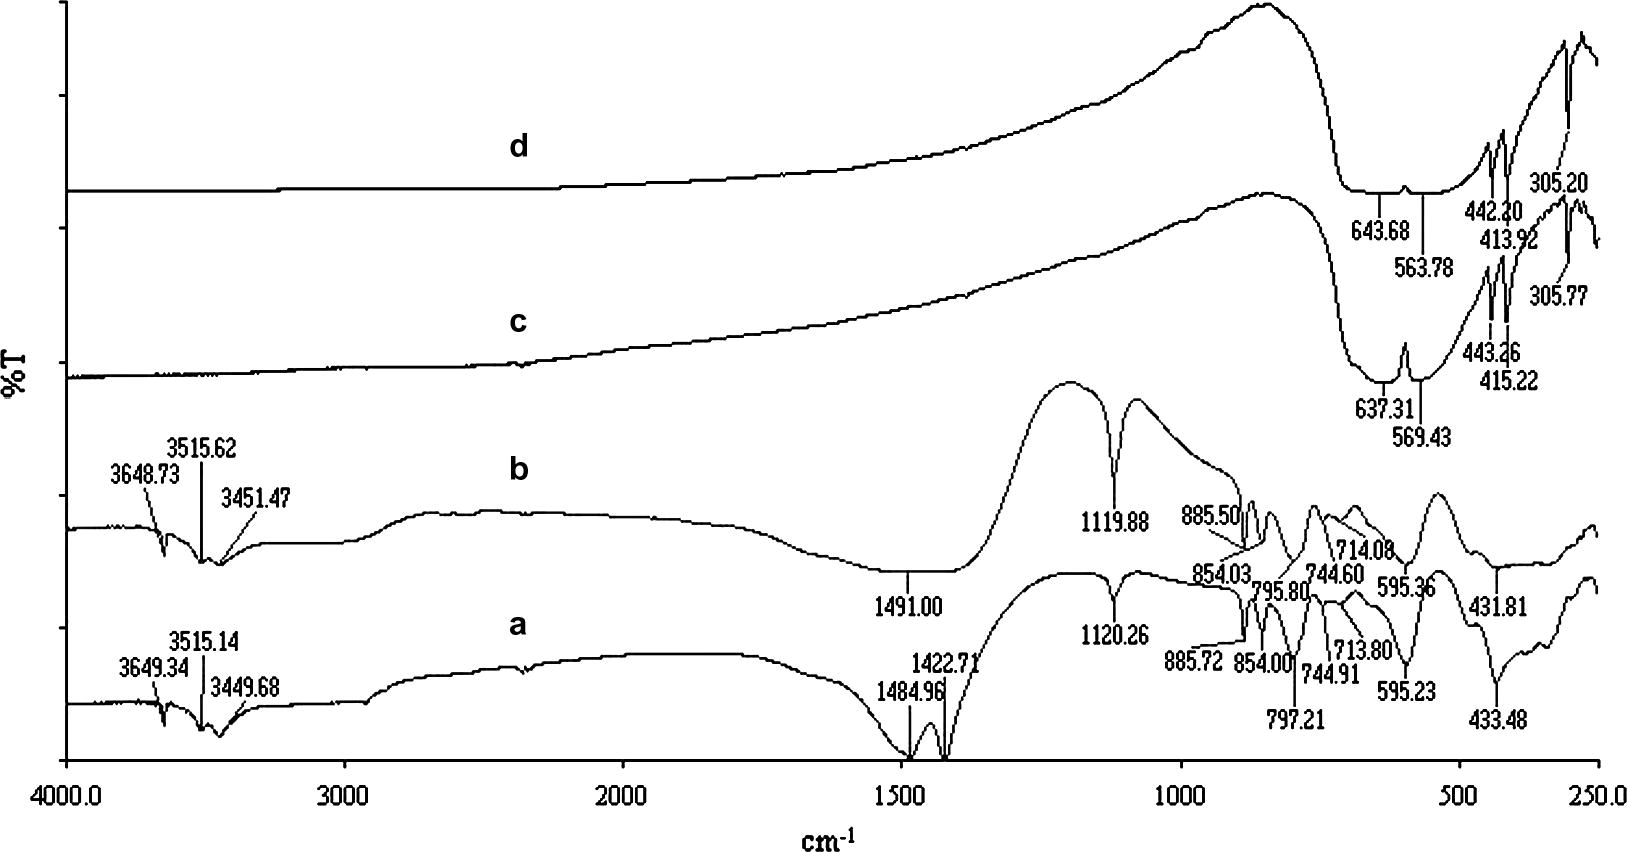
FT-IR spectra of un-irradiated (a and c) and irradiated (b and d) of Mg5(CO3)2(OH)2·4H2O and Cr2O3, respectively.
3.2 FT-IR analysis
Fig. 2 shows the FT-IR spectra of the starting materials before and after γ-irradiation. The spectrum of un-irradiated heavy magnesium carbonate hydrate (a) shows bands of the carbonate anion at 1120 cm−1 (symmetric stretching), 1485 and 1423 cm−1 (asymmetric stretching), 745 and 714 cm−1 (symmetric bend), and 854, 886 and 797 cm−1 (asymmetric bend). The two main bands at 3515 and 3450 cm−1 are due to lattice water vibration and the 3649 cm−1 is due to OH− stretching (White, 1971). Spectrum (c) shows five main bands at 637, 569, 443, 415 and 305 cm−1 which are due to lattice vibration of un-irradiated Cr2O3. Neither disappearance nor appearance of new bands was observed as result of γ-irradiation up to 103 kGy total γ-ray dose as well as seen in (b and d, respectively).
The FT-IR spectra for the calcined mixtures are shown in Fig. 3. The spectra of the mixture calcined at 300 °C shows main bands at 643, 573, 442, 413 and 305 cm−1 which are due to Mg–O and Cr–O lattice vibrations, and the weak band at 858 cm−1 is due to carbonate anion. At 500 °C, the spectra displays, in addition to, lattice vibration bands of MgO and Cr2O3, two bands at 957 and 834 cm−1 which are due to Cr⚌O stretching of amorphous α-MgCrO4 (Roy et al., 1969). At 625 °C, the bands of α-MgCrO4 completely disappeared from the spectra, and the characteristic band of MgCr2O4 at 429 cm−1 (Williey et al., 1993) is not detectable, although it present and it was confirmed by XRPD. However, the 429 cm−1 band is observable in FT-IR spectra of the mixture heated at 650 °C. The spectra of the mixture calcined at 900 °C for 27 h displays only the bands of MgCr2O4, and the characteristic band of Cr2O3 at 305 cm−1 is completely disappeared.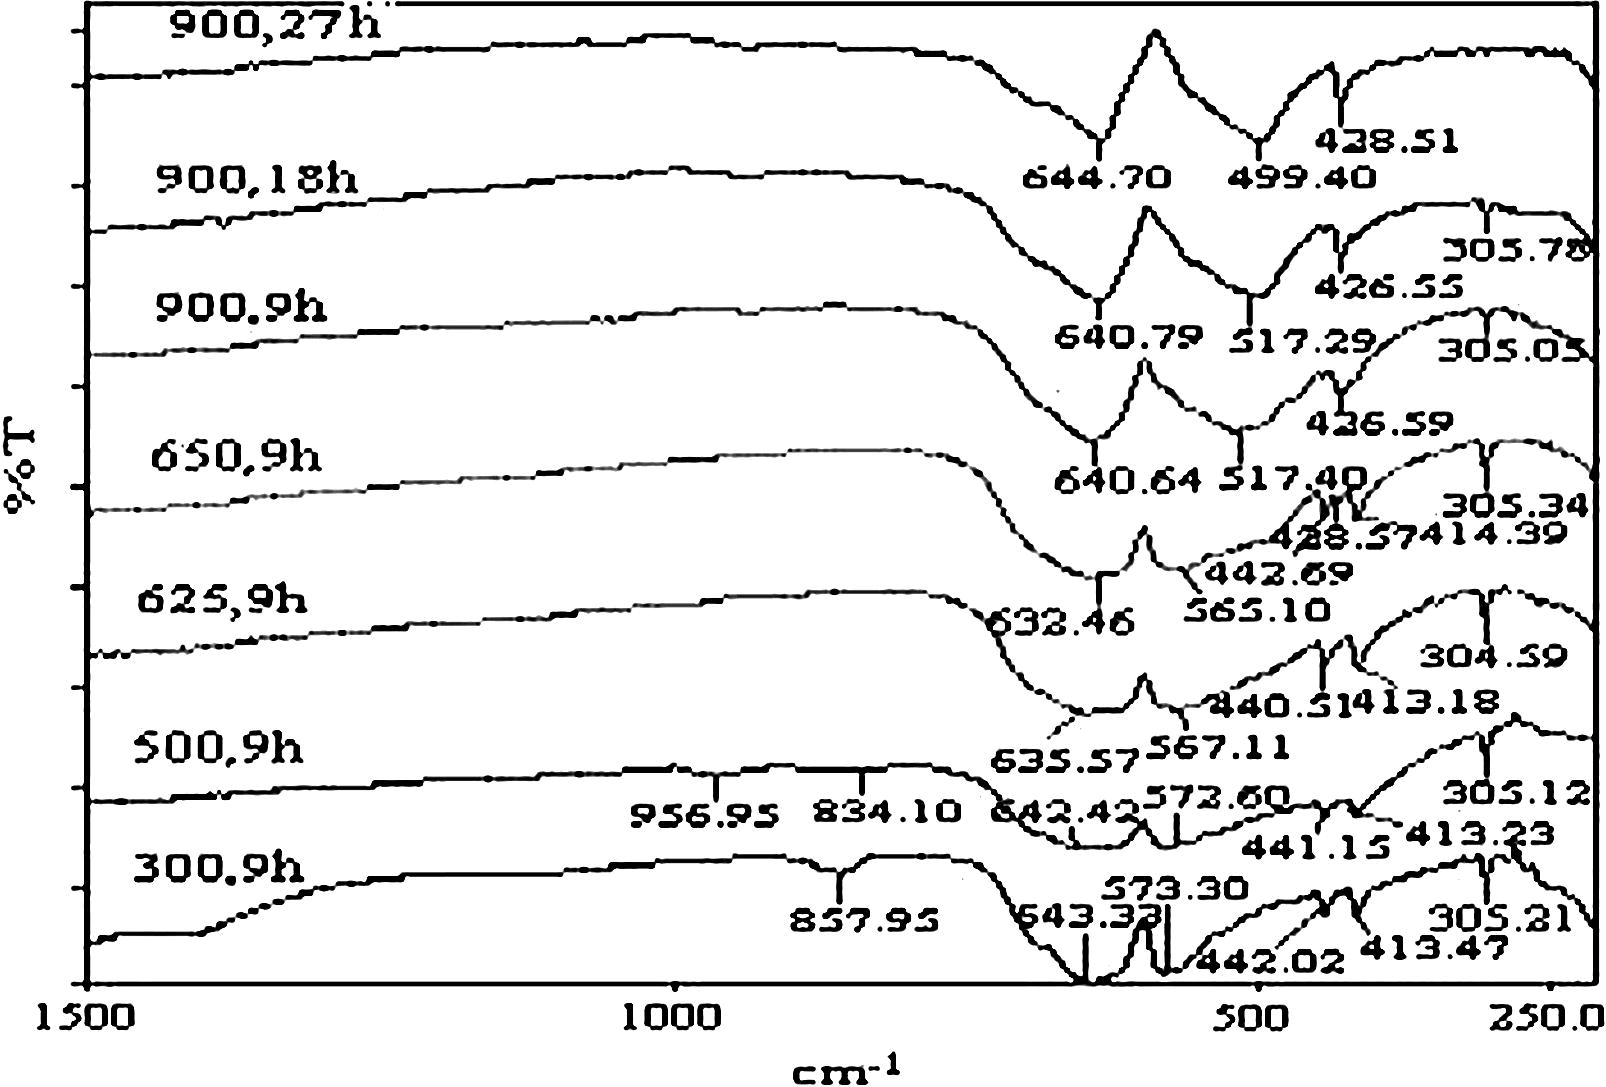
FT-IR spectra of un-irradiated calcined mixtures at different temperatures for different time duration.
3.3 TG and DTA analysis
Fig. 4 shows TG and DTA curves for thermal decomposition of heavy magnesium carbonate in a pure form and in physical mixture with chromium(III)oxide.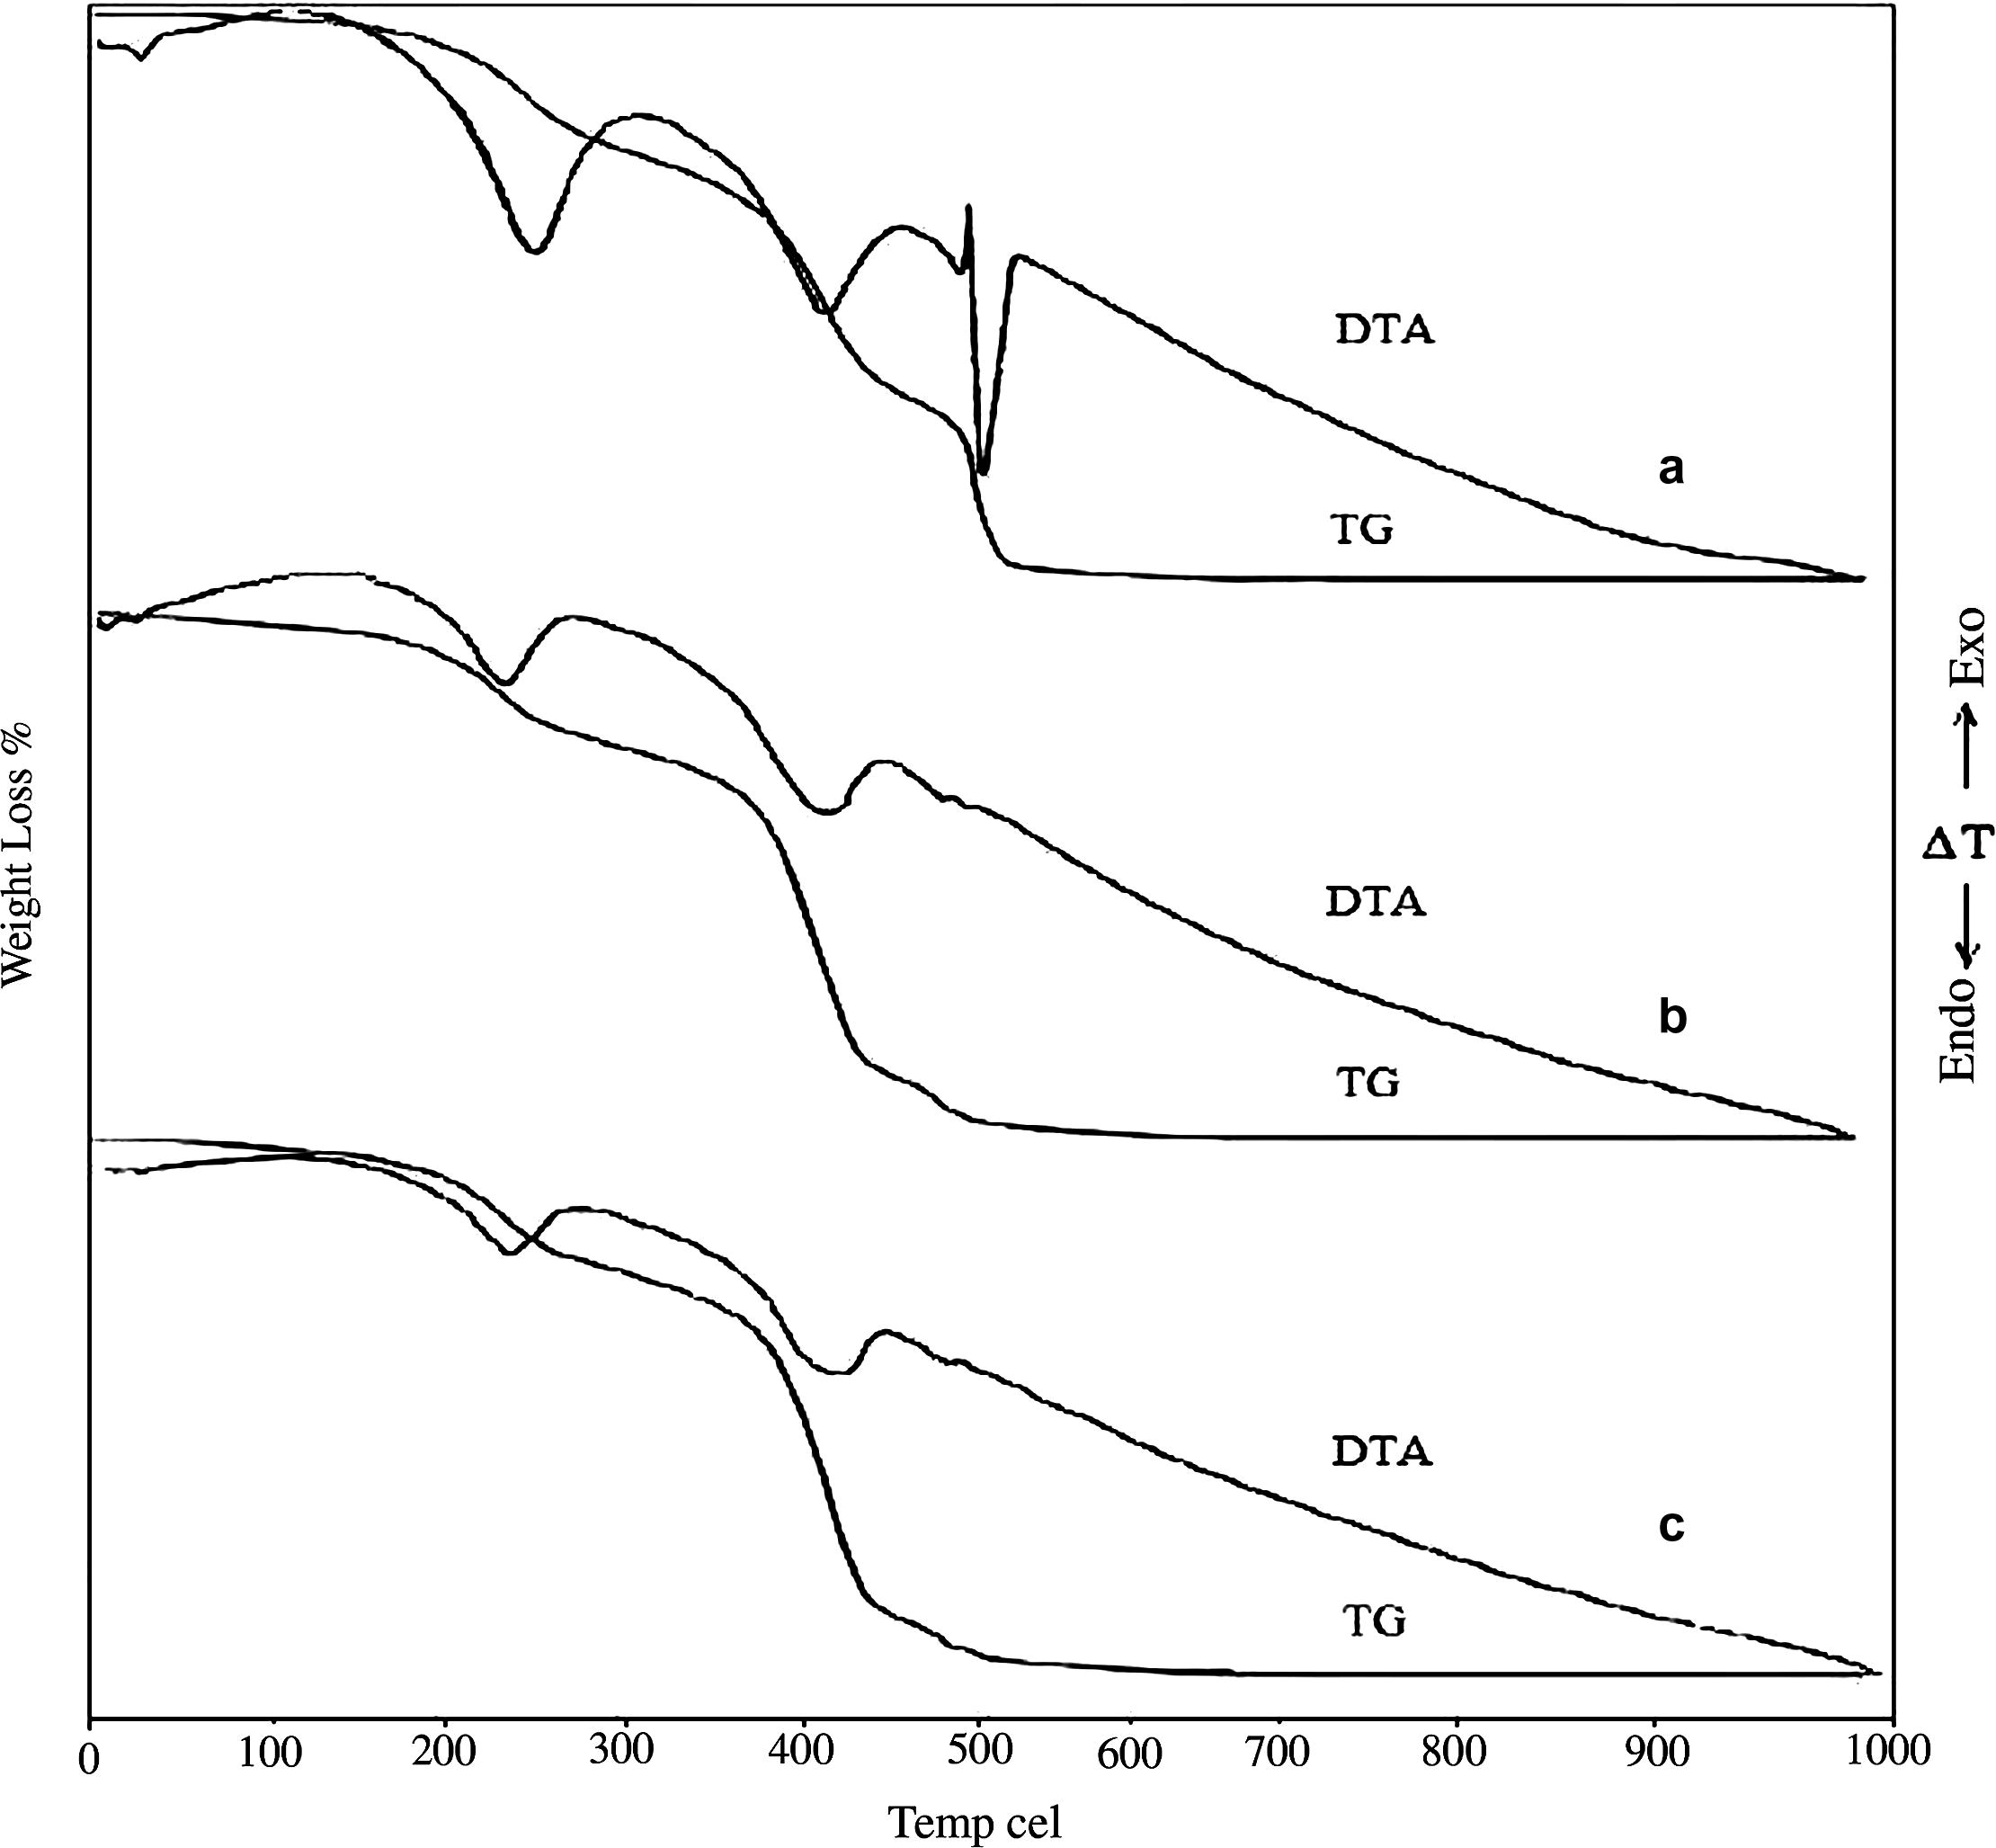
TG/DTA curves of Mg5(CO3)4(OH)2·4H2O (a), physical crystalline mixtures before (b) and after (c) irradiation.
Fig. 4a shows typical TG–DTA curves of the thermal decomposition of pure heavy magnesium carbonate hydrate. The TG of pure salt showed three overlapped decomposition steps. The first decomposition step was in the range of (100–250) °C attributed to loss of water of crystallization, this decomposition was accompanied by an endothermic peak at 230 °C. The second decomposition step was in the range of (370–440) °C due to loss of hydroxyl water and was accompanied by an endothermic peak at 430 °C. The third decomposition step was in the range of (440–500) °C due to decomposition of MgCO3 and was accompanied by sharp endothermic peak at 480 °C. Very sharp exothermic peak was detected at 460 °C attributed to the crystallization of MgCO3 from the amorphous lower carbonate (Criado et al., 1979; Khan et al., 2001; Sawada et al., 1979a, p. 32, 1979b, p. 33, 1979c, p. 34).
Fig. 1b shows the TG and DTA curves of crystalline mixture. The DTA show an endothermic peak detected at almost the same temperature range as for pure salt for loss of water of crystallization. A more broad second endothermic peak was detectable at 440 °C due to loss of hydroxyl water and starting to form the chromate intermediate. Two endothermic peaks were detectable at 490 °C and 500 °C due to the decomposition of chromate intermediate and formation of amorphous magnesium chromite. The decomposition behavior of γ-irradiated mixture is similar to that of un-irradiated mixture as we seen in Fig. 1c. Thus, γ-irradiation has no apparent effect on the decomposition behavior of γ-irradiated physical mixture with 102 kGy total dose.
Based on the foregoing discussion of XRPD, FT-IR, TG and DTA analysis the following Scheme 1, for decomposition of the investigated crystalline mixture and formation of chromite spinel could be suggested.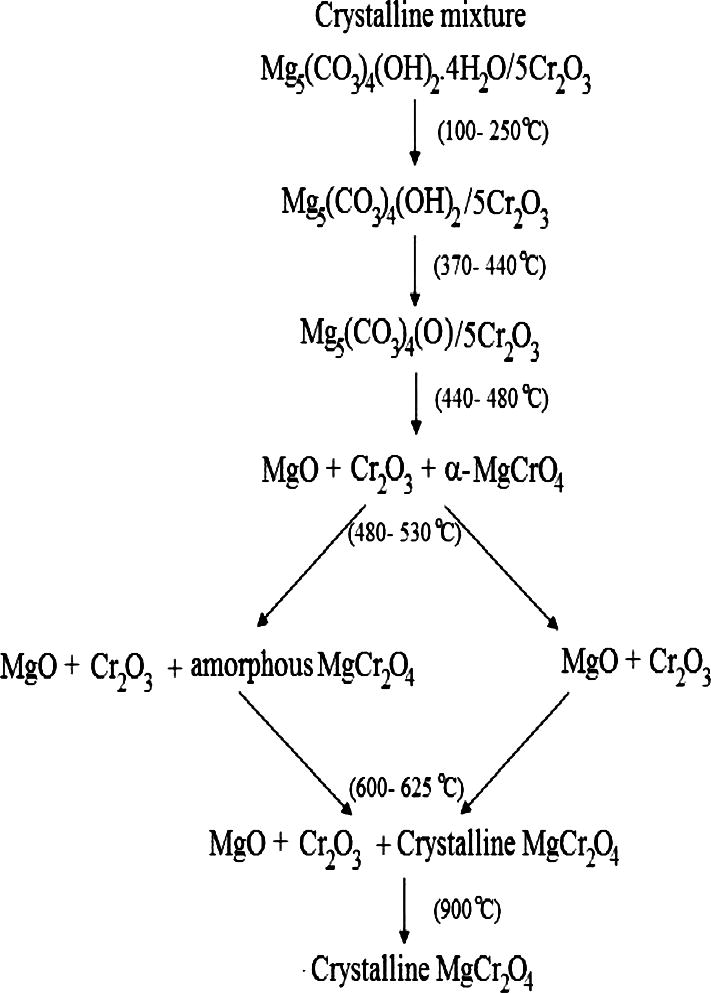
The proposed reaction mechanism or the thermal decomposition of the investigated crystalline mixture and formation of chromite spinel.
4 Kinetic studies
Heterogeneous solid-state reaction can empirically be described by a single-step kinetic equation:
Symbol
No.
Reaction model
f(
)
z
1
D1
One-dimensional diffusion
1/2
2
2
D2
Two-dimensional diffusion (bi-dimensional particle shape) Valensi equation
1/[−ln(1 −
)]
(1 −
)ln(1 −
) +
3
D3
Three-dimensional diffusion (tri-dimensional particle shape) Jander equation
3(1 −
)1/3/2[(1 −
)−1/3 − 1]
[1 − (1 −
)1/3]2
4
D4
Three-dimensional diffusion (tri-dimensional particle shape) Ginstling–Brounshtein
3/2[(1 −
)−1/3 − 1]
(1 − 2
/3) − (1 −
)2/3
5
R2
Phase-boundary controlled reaction (contracting area, i.e., bi-dimensional shape)
2(1 −
)1/2
[1 − (1 −
)1/2]
6
R3
Phase-boundary controlled reaction (contracting volume, i.e., tri-dimensional shape)
3(1 −
)2/3
[1 − (1 −
)1/3]
7
F1
First-order (Mampel)
(1 −
)
[−ln(1 −
)]
8
F2
Second-order
(1 −
)2
(1 −
)−1 − 1
9
F3
Third-order
(1 −
)3
(1/2)[(1 −
)−2 − 1]
10
F3/2
Three-halves order
(1 −
)3/2
2[(1 −
)−1/2 − 1]
11
A2
Avrami-Eroféev (n = 2)
2(1 −
)[−ln(1 −
)]1/2
[−ln(1 −
)]1/2
12
A3
Avrami-Eroféev (n = 3)
3(1 −
)[−ln(1 −
)]2/3
[−ln(1 −
)]1/3
13
A3/2
Avrami-Eroféev (n = 1.5)
(3/2)(1 −
)[−ln(1 −
)]1/3
[−ln(1 −
)]2/3
14
A4
Avrami-Eroféev (n = 4)
4(1 −
)[−ln(1 −
)]3/4
[−ln(1 −
)]1/4
The rate constant, k, usually has an Arrhenius temperature dependence
Replacing k(T) in Eq. (1) with the Arrhenius equation gives
Kinetic parameters can be obtained from nonisothermal rate laws by both model-fitting and isoconversional (model-free) methods.
Force-fitting experimental data to different model function f( ) is denoted as model-fitting methods, after the f( ) model has been selected from the best linear fit for a series of temperature, k(T) is evaluated (Rodante et al., 2002).
Model-free isoconversional methods allow for estimating the activation energy as function of without choosing the reaction model, the basic assumption of these methods is that the reaction rate of constant extent of conversion depends only on the temperature. Hence, constant Ea value can be expected in the case of single stage decomposition, while for multi-step process Ea varies with due to the variation in the relative contributions of single steps to the overall reaction rate (Khawam and Flanagan, 2005; Vyazovkin and Sbirrazzuoli, 2002).
5 Model-fitting approach
There are several nonisothermal model-fitting methods. One of the most popular is the Coats and Redfern method (CR method), which utilizes the asymptotic series expansion in approximating P(x) Eq. (7), producing the following equation:
The other method proposed by Clark and Kennedy (CK method) is based on the expression, T = t + T0, where T0 is initial temperature.
The basic equation is:
Plotting the left-hand side of both Eqs. (8) and (10) against 1/T should give straight lines for the reaction models listed in Table 1 (Vyzovkin and Wight, 1999) and the result are shown in Fig. 5. From the slope and intercept we can determine Ea and ln A, respectively.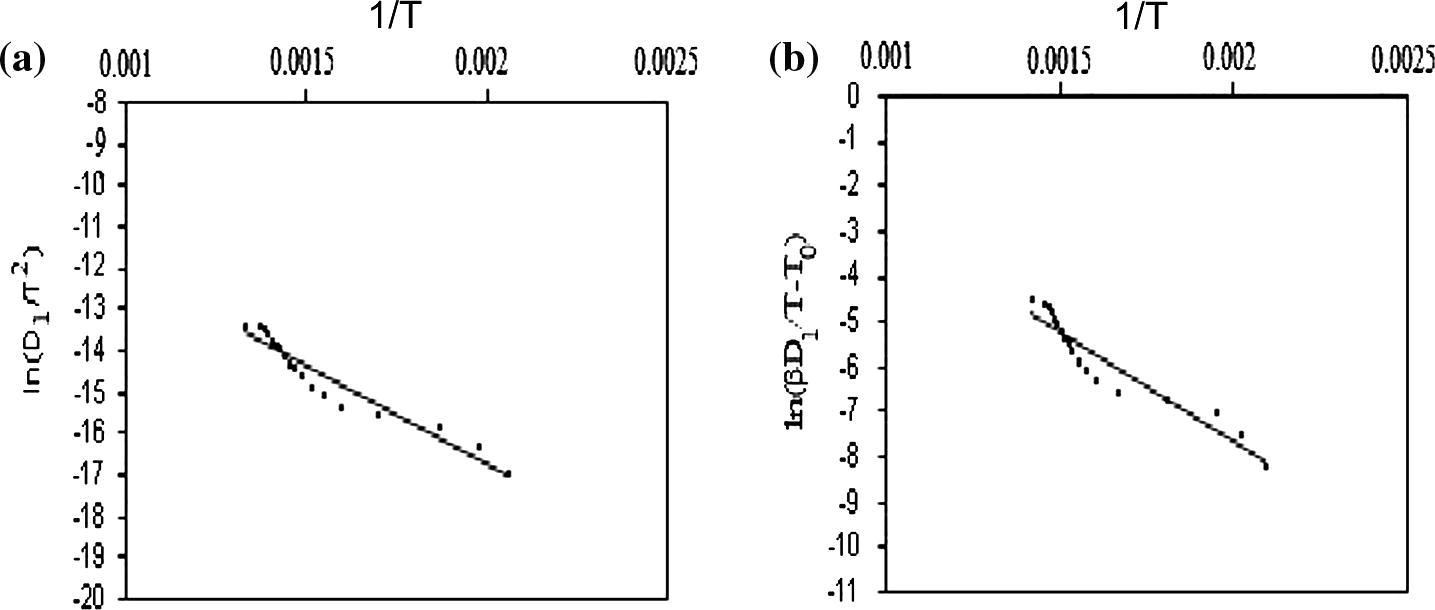
(a) CR method and (b) CK method.
The values of activation energy (Ea), pre-exponential factors (lnA) and the coefficients of linear correlations (r) for kinetic models are presented in Table 2. The correlation coefficient (r) is sometimes used as a parameter for choosing the best model.
Model
CR
CK
E
ln A
r
E
ln A
r
Un-irradiated
Irradiated
Un-irradiated
Irradiated
Un-irradiated
Irradiated
Un-irradiated
Irradiated
Un-irradiated
Irradiated
Un-irradiated
Irradiated
D1
39.2464
40.03058
4.22043
4.314446
91.528
92.324
39.05335
39.99566
2.50784
2.61826
91
91.982
D2
44.26224
45.23348
4.800317
4.925812
89.362
90.384
44.06919
45.13837
3.00946
3.13678
88.806
89.9
D3
50.69728
51.84427
4.901847
5.052753
86.026
87.194
50.50439
51.749
3.01522
3.16666
85.46
86.696
D4
46.70489
47.40077
3.828872
3.957691
88.27
89.344
46.17945
47.30533
2.001
2.13616
87.704
88.85
R3
18.84302
20.95361
0.471686
0.481407
82.33
82.284
18.65013
20.8585
−1.03556
−0.99312
80.712
80.93
R2
20.4275
19.29513
0.419865
0.522472
80.626
83.788
20.23461
19.23261
−1.06906
−0.96554
79.074
82.552
A2
7.04249
–
–
–
55.174
58.306
6.849522
7.212328
−2.1533
−2.10832
50.74
54.498
A3
1.414162
–
–
–
10.664
13.266
1.221194
1.464228
−3.15334
−3.12316
6.954
10.17
A3/2
12.67087
-
1.043867
−
68.484
70.568
7.482101
12.96053
−1.1533
−1.09346
65.778
68.458
A4
–
–
–
–
18.854
17.928
–
–
−3.72528
−3.63062
18.498
15.686
F1
23.92719
24.55174
2.342056
2.438306
76.942
78.648
23.73431
24.45679
0.84674
0.9363
75.544
77.418
F2
37.05384
38.06748
4.591417
5.691372
66.106
67.818
36.86095
37.97237
3.87932
4.02374
65.174
67.002
F3
53.49527
54.83765
7.313669
9.754276
58.818
60.462
53.13594
54.74254
7.6117
7.8265
58.198
59.924
F3/2
30.01919
30.82133
7.016659
3.937283
71.25
72.98
29.82598
30.72638
2.2576
2.37312
70.098
71.964
P1
–
–
–
–
89.794
90.326
–
–
−4.19572
−4.18152
86.678
86.986
P2
–
–
–
–
47.984
48.426
–
–
−3.8765
−3.86118
45.342
43.424
P3
2.620722
–
–
–
45.912
48.986
2.236749
2.474895
−3.23806
−3.21012
34.73
41.668
P4
26.97411
27.58386
2.119116
2.195114
90.048
91.302
26.78106
27.48874
0.59254
0.67548
89.428
90.606
As listed in Table 2 for both applied methods (CR and CK methods), it can be found that D1 is the best model show the linear relationships of the data for both irradiated and un-irradiated mixtures. The values of Ea, ln A (Arrhenius parameters) and r obtained from CR and CK methods using the selected model for the processes obtained in Table 2 are very low. From this fact it may be concluded that the reaction under consideration is a typical complex multi-step reaction with more than one mechanism.
5.1 Model-free approach
The Kissinger–Akahira–Sunose method (KAS method) is based on the Coats–Redfern approximation of P(x) ≅ (exp(−x))/x2 which transformed Eq. (7) to:
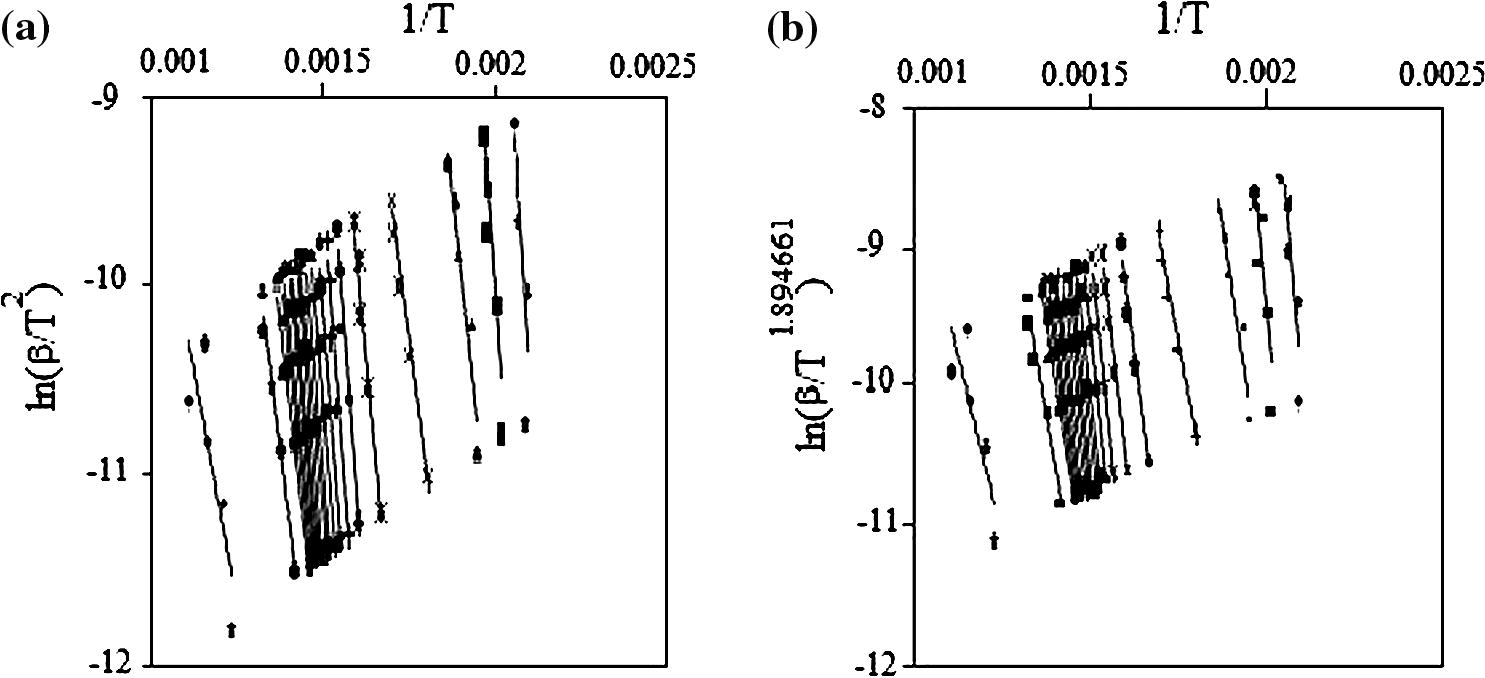
(a) KAS method and (b) T method.
The Vyazovkin isoconversional method (VYZ method) (Vyzovkin and Wight, 1999; Janković et al., 2007) is a nonisothermal method which utilizes an accurate nonlinear Senium-Yang approximation of P(x) (Eq. (7)), which leads to:
The can be determined at any particular value of by finding the value of for which the objective function Ω is minimized.
The temperature integral can be evaluated by several approximation. We have used Gorbachev, Agrawal and Sivasubramanian and Cai for integration of Eq. (14) (Ghoshal and Saha, 2006; Maiti et al., 2006).
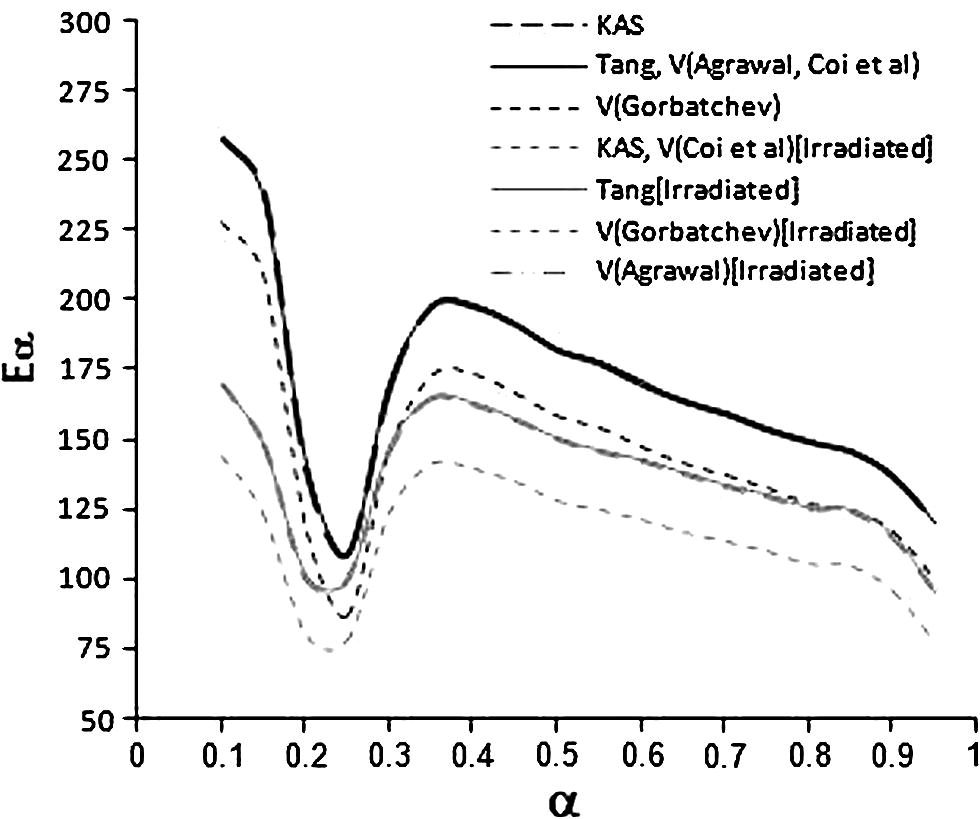
The activation energy plotted as a function of the extent of the conversion.
5.2 Compensation effect
Use of the artificial isokinetic relationship (IKR) that occurs on fitting various reaction models to the same set of nonisothermal kinetic data can be used to evaluate ln A.
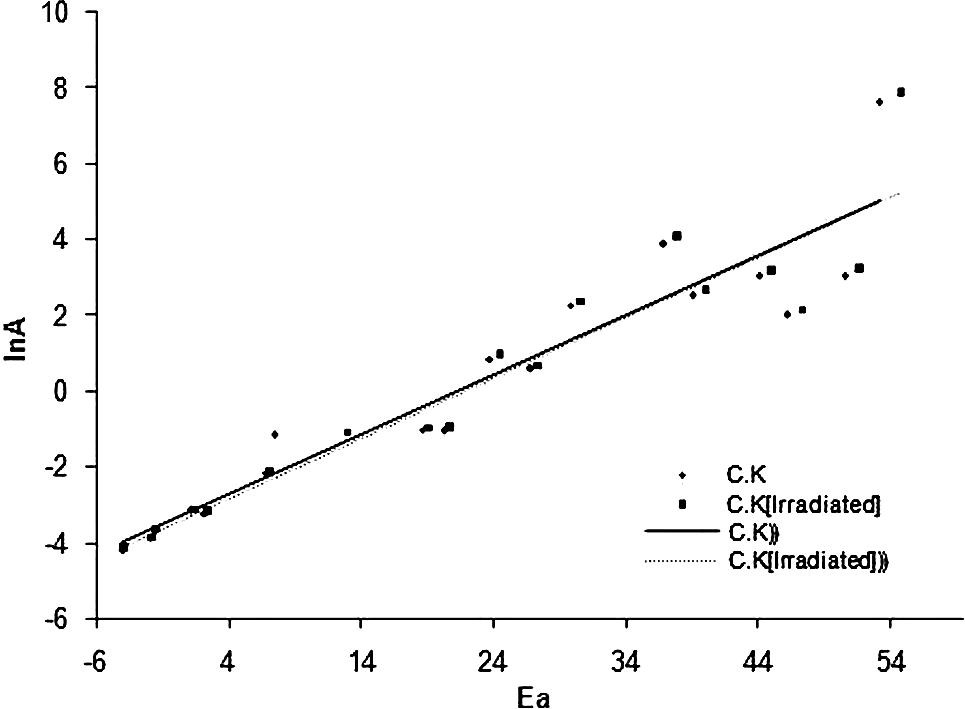
The isokinetic relationships obtain by CK method.
Method
a (min−1)
b (mol kJ−1)
kiso (min−1)
Tiso (K)
r
KC
−3.396
0.158
0.0335
759.82
0.896
KC (irradiation)
−3.488
0.159
0.0306
753.63
0.905
It can be seen that the isokinetic temperatures (Tiso) lying in the region of the experimental temperature and this indicates that the reaction model f( ) was properly chosen.
Once the correlation parameters a and b have been evaluated, the values are substituted for Ea,j in Eq. (18) to estimate the corresponding ln values and obtaining the dependence of ln on for multi-step processes (Vyzovkin and Wight, 1999).
Fig. 9 shows the variation of the ln
as a function of extent of conversion
, which was obtained by different isoconversional methods for the process.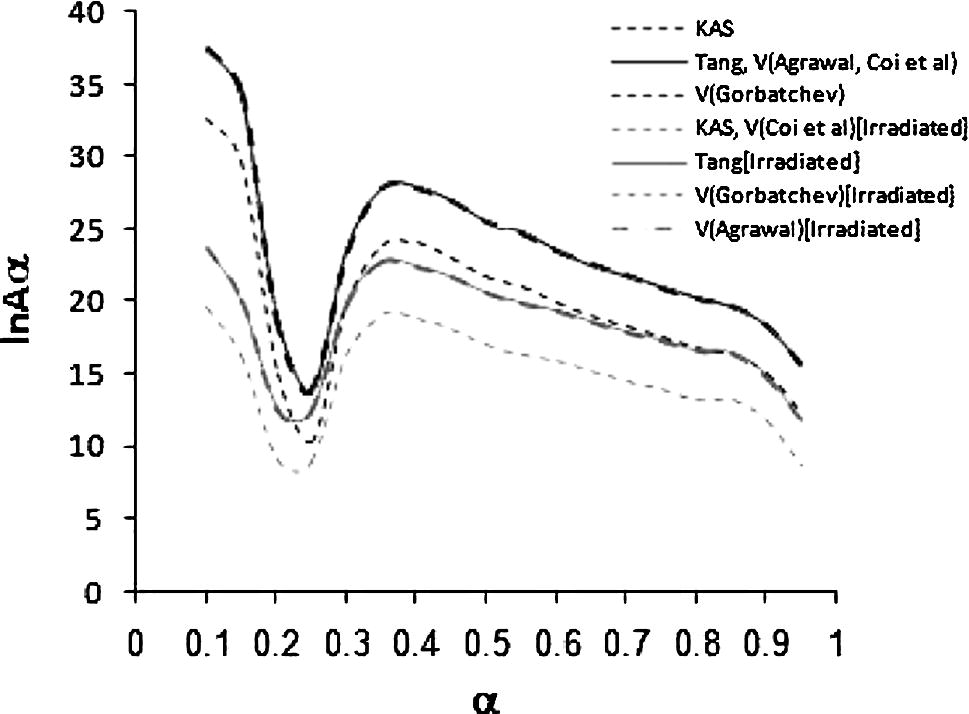
Dependence of the ln Aα on extent of conversion, estimated from Eq. (18) for the different isoconversional methods.
It can be seen that the ln shows the same dependence on α as the apparent activation energy in Fig. 7. This behavior supported the conclusion mentioned above.
5.3 Simulation
Simulated data are the only data for which Arrhenius parameters and reaction models are known exactly (Vyazovkin, 2000). The data were simulated according to the scheme of two reaction mechanisms
Integration of Eq. (20) for nonisothermal condition has give rise to reaction dependence of versus T.
By assumption that, the processes contain at least two steps with different reaction mechanism. The first mechanism is third-order reaction (F3) model, and the second mechanism is diffusion in one-dimensional (D1) model. Then the effective activation energy of the overall process can be written as:
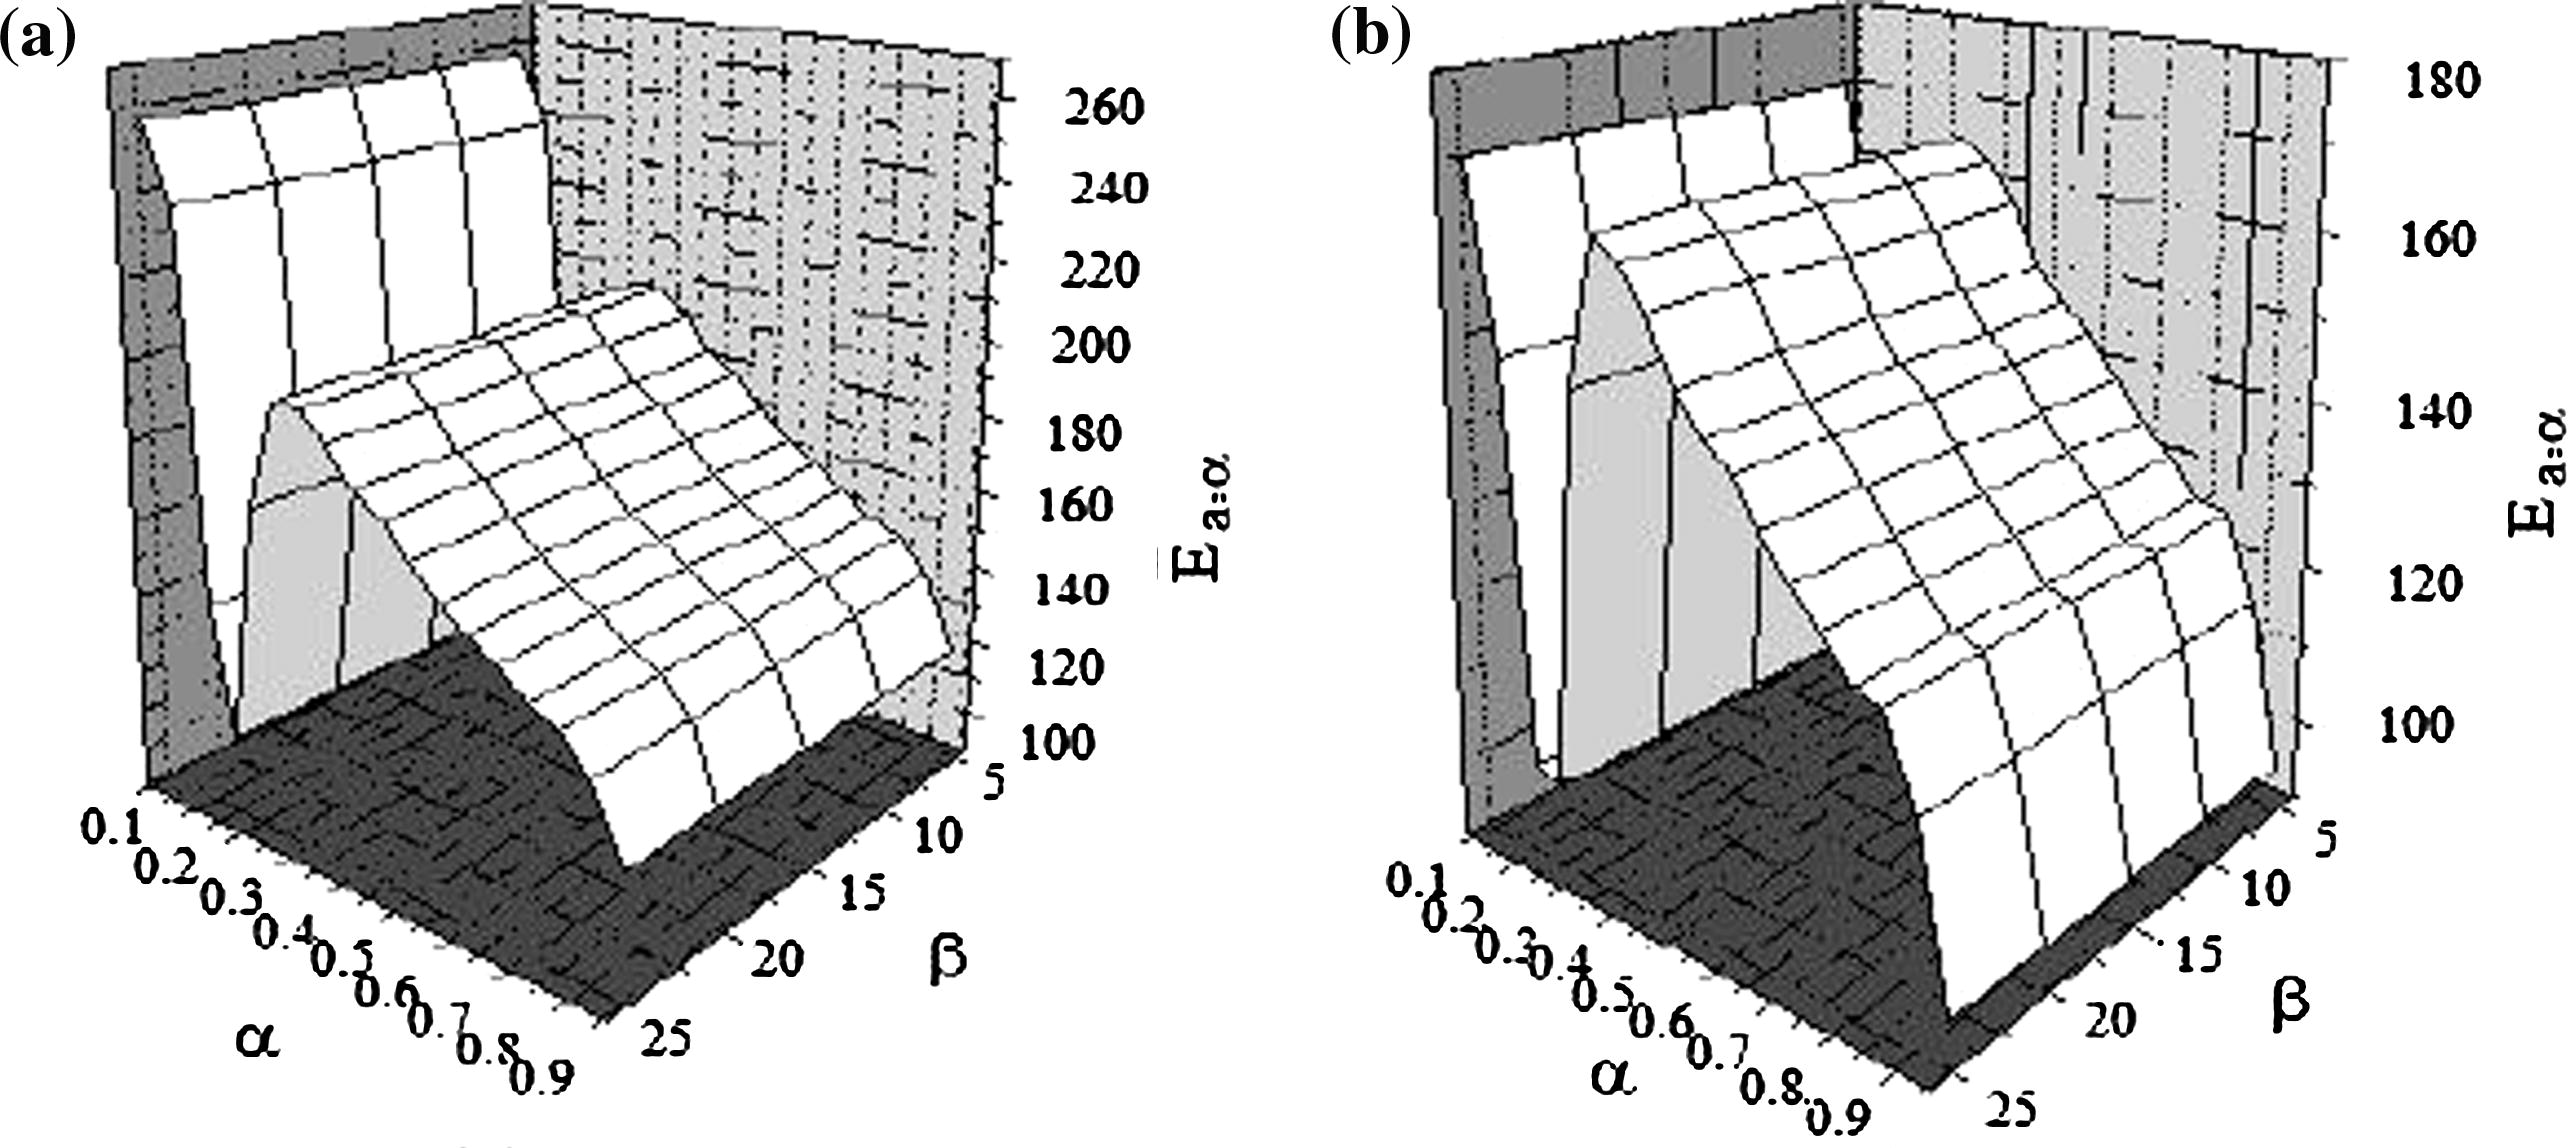
Surface plot of activation energy for simulated process before irradiation (a) and after irradiation.
Acknowledgements
This work was supported by the King Abdullaziz City of Science and Technology in Saudi Arabia. Also the authors thanks Dr. Ahmed Basfar for his supported and advice.
References
- A qualitative and quantitative PC program for X-ray powder diffraction. Powder Diffraction. 1999;14(1):16-21.
- [Google Scholar]
- Catalytic effects of magnesium chromite spinel on the decomposition of lanthanum oxalate. Thermochimica Acta. 2002;389:109-119.
- [Google Scholar]
- Alteration of kinetics and thermodynamics of thermal decomposition of Alkaline-Earth carbonates induced by grinding. Thermochimica Acta. 1979;32:99-110.
- [Google Scholar]
- ELNES investigations of the oxygen K-edge in spinels. Ultramicroscopy. 2001;86:273-288.
- [Google Scholar]
- Galway, A.K., Brown, M.E., 1999. Thermal Decomposition of Ionic Solids. Elsevier Science B.V.
- Oxidative dehydrogenation of propane on NixMg1−xAl2O4 and NiCr2O4 spinels. Journal of Catalysis. 1999;187:410-418.
- [Google Scholar]
- Model-free kinetics analysis of waste PE sample. Thermochimica Acta. 2006;451:27-33.
- [Google Scholar]
- Decomposition kinetics of Alkaline-Earth hydroxides and surface-area of their calcines. Chemical Engineering Science. 1994;49:1209-1216.
- [Google Scholar]
- Application of model-fitting and model-free kinetics to the study of non-isothermal dehydration of equilibrium swollen poly (acrylic acid) hydrogel: thermogravimetric analysis. Thermochimica Acta. 2007;452(2):106-115.
- [Google Scholar]
- The origin of the exothermic peak in the thermal decomposition of basic magnesium carbonate. Thermochimica Acta. 2001;367:321-333.
- [Google Scholar]
- Role of isoconversional methods in varying activation energies of solid-state kinetics II. Nonisothermal kinetic studies. Thermochimica Acta. 2005;436:101-112.
- [Google Scholar]
- Isothermal decomposition of γ-irradiated samarium acetate. Radiation Physics and Chemistry. 2000;59:381-385.
- [Google Scholar]
- Kinetics of the thermal decomposition of γ-irradiated cobaltous acetate. Thermochimica Acta. 2000;363:61-70.
- [Google Scholar]
- Model-free method for isothermal and non-isothermal decomposition kinetics analysis of PET sample. Thermochimica Acta. 2006;444:46-52.
- [Google Scholar]
- Isothermal decomposition of γ-irradiated uranyl acetate. Thermochimica Acta. 1998;322:33-37.
- [Google Scholar]
- Kinetic analysis of thermal decomposition for penicillin sodium salts – model-fitting and model-free methods. Journal of Pharmaceutical and Biomedical Analysis. 2002;29:1031-1043.
- [Google Scholar]
- Infrared spectra of the chromates of magnesium, nickel and cadmium. Spectrochimica Acta. 1969;25:1491-1499.
- [Google Scholar]
- Thermal decomposition of basic Magnesium Carbonates under high-pressure gas atmospheres. Thermochimic Acta. 1979;32:277-291.
- [Google Scholar]
- Thermogravimetric study on the decomposition of hydromagnesite 4Mg(CO3)·Mg(OH)2·4H2O. Thermochimica Acta. 1979;33:127-140.
- [Google Scholar]
- Isothermal differential calorimetry on an exothermic phenomenon during thermal decomposition of hydromagnesite 4Mg(CO3)·Mg(OH)2·4H2O. Thermochimica Acta. 1979;34:233-237.
- [Google Scholar]
- Comparison of several computational procedures for evaluating the kinetics of thermally stimulated condensed phase reactions. Chemometrics and Intelligent Laboratory Systems. 2000;54:53-60.
- [Google Scholar]
- Numerical data for some commonly used solid state reaction equations. Journal of American Ceramic Society. 1966;49(7):379-382.
- [Google Scholar]
- Oxygen-sensing properties of spinel-type oxides for stoichiometric air/fuel combustion control. American Ceramic Society. 1990;73:818-824.
- [Google Scholar]
- An Introduction to Radiation Chemistry. New York: Wiley; 1990.
- Model-free and model-fitting approaches to kinetic analysis of isothermal and nonisothermal data. Thermochimica Acta. 1999;340–341:53-68.
- [Google Scholar]
- Computational aspects of kinetic analysis. Part C. The ICTAC Kinetics Project – the light at the end of the tunnel. Thermochimica Acta. 2000;355:55-163.
- [Google Scholar]
- Learning about epoxy cure mechanisms from isoconversional analysis of DSC data. Thermochimica Acta. 2002;388:289-298.
- [Google Scholar]
- Infrared characterization of water and hydroxyl ion in the basic magnesium carbonate minerals. The American Mineralogist. 1971;56:46-53.
- [Google Scholar]
- Preparation and characterization of magnesium chromite and magnesium ferrite aerogels. Chemical Engineering Communication. 1993;123:1-16.
- [Google Scholar]


