

Translate this page into:
Chemical analysis of trace metal contamination in the air of industrial area of Gajraula (U.P), India
⁎Corresponding author at: Chemistry Department, School of Sciences, IFTM University, Moradabad 244102, U.P, India. akres9017@gmail.com (Atul Kumar)
-
Received: ,
Accepted: ,
This article was originally published by Elsevier and was migrated to Scientific Scholar after the change of Publisher.
Peer review under responsibility of King Saud University.
Abstract
Industrial air pollution has emerged as a speeding problem in recent years because of its detrimental effects on human health. The present study was conducted in Gajraula industrial area of India, highly affected by ambient air pollution. Samples of PM10 were collected from three different sites (Raunaq Automotives, Indra Chowk and Town Basti) during 2017–2018. Maximum concentration of PM10 was observed during winter and the minimum during monsoon season. Heavy metals such as Pb, Cd, Cu, Zn, Cr, Fe, Al and Ni were analysed by ICP-MS. This study concluded that Indra Chowk is affected by high particulate pollution, while its level at Raunaq Automotives was moderate. Town Basti was being considered as less polluted area. Toxic metals are emitted into the atmosphere mainly due to industrial, commercial and agricultural activities. Most of the industrial emissions from Indra Chowk was because of lots of industries in the vicinity and it has been observed that public from this area is suffering from respiratory disorders and other health problems due to exposure of air pollution.
Keywords
PM10
Heavy metals
ICP-MS spectrophotometer

1 Introduction
Industrial, commercial activities and agricultural production are considered as the engines of economic growth. Man, land, and crops are responsible for agriculture revolution (Yubero et al., 2018). Rapid industrialization and urbanization have resulted in widespread pollution of airborne particulate matter (PM) containing various heavy metals with adverse human-health effects. (Srivastva et al., 2012; Park et al., 2015; Liu et al., 2019). Man and nature have always been antithetical and all his invention tampered with keeping on making continuous efforts to conquer nature in order to satisfy his needs (Dappe et al., 2018). The quality of the environment is a datum of grave concern, specifically when the importance of human intervention are clearly manifest (Philip et al., 2017).
The particulate matter could be elementary (particles emitted outright by emission sources) or secondary (particles formed via the atmospheric reaction of gases) (Yubero et al., 2018; EPCA, 2018). The particles vary greatly in size, concentration, composition, depending on age and origin. Particles produced by anthropogenic activities are typically smaller than 10 μm in diameter and in contrast particles of natural origin are mainly in the size range between 2.5 μm to 10 μm. PM10 deposit relatively quickly with a lifetime of lower than two days and exposure may lead to adverse responses in the lungs triggering an array of problems in the heart and the lungs. Heavy metals in PM are deemed to be the determining causes of a range of diseases (Akinfolarin et. al., 2017).
Two main anthropogenic sources that pollute the earth and natural air are burning of coal and the corrosion of commercial waste products, which add copper, chromium, lead and galvanized metals (Eroula et al., 2011; IARC, 2013). Burning coal adds Trace metals such as cadmium, nickel, aluminum and iron into the soils and oil burning contributes iron, lead and nickel to the environment. The emission of metal during the transportation of vehicles includes nickel and zinc from tires, aluminum from a catalyst, cadmium, and copper primarily from diesel engines and nickel and zinc from aerosol emission lubricants, which are interceded. The burning of leaded gasoline has been the main source of Pb in the environment. Incineration of municipal wastes generates a valued concentration of Zn, Al, Cu and Fe (Ujowundu et al., 2011). National and International environmental pollution and disease problems continue to rise and the World health organization (Im et al., 2013; WHO, 2013; Pope et al., 2015) reported that 25%-30% of diseases in evolved countries are due to environmental factors. Thus, the objective of this study was to identify the possible source and determination of Particulate Matter PM10, the concentration of Trace Metals (Ni, Zn, Cd, Fe, Al, Cr, Cu and Pb) in respirable dust (PM10) during winter, summer and monsoon season at all sampling sites (Ratna et al., 2007; Ujowundu et al., 2011). In the present study efforts have been made to analyze and determine the present level of Particulate Matter and their trace metal contents in the industrial city Gajraula of Western UP, India, over the one year period, i.e. July 2017–June 2018.
2 Material and methods
Gajraula is an Industrial area and Nagar Panchayat at Amroha district in the western U. P. (India); it is vested on NH-24, 4-lane highway connecting capital of state and country at latitude 28.85 N, longitude 78.23 E and elevation of 257 m (879 feet). According to Indian census, 2011 Gajraula had a population of 55048. Due to the establishment of a large number of industries, there is an urgent need of ambient air pollution monitoring in Gajraula industrial area. Various types of Industries such as chemicals, fertilizers, pesticides, insecticides, sugar plants, paper mills and automobiles are located over here. Now people have started to take serious note of the ill effect of particulate matter, therefore, detailed study and control measures are required to account the ill health effects.
2.1 Site selection
Raunaq Automotive (S1): It is an Automotive Industry and the site is located near NH-24.
Indra Chowk (S2): It is a residential area having commercial activities. A large number of workshop and shops are situated near this site, and the distance of the Gajraula railway station is 500 m.
Town Basti (S3): It is low density agriculture, residential based area and almost free from pollution. It is located in the southern part of the city and around 2 km away from the Railway station.
2.2 Analysis technique of particulate matter (PM10)
PM10 samples were collected with the aid of Respirable Dust Sampler (RDS) APM-460 NL (Envirotech, New Delhi) at the rate of two samples per week on Whatman glass fiber filter paper- GF-A for 24hrs. (Three shift i.e. 8 h.) with air flow rate of 1–1.5 m3/min. The distinction in the initial and the final weight of the filter paper gave the total quantity of PM10 collected over the 24 h. The value of PM10 were reported in µg/m3 (CPCB, 2015). Each gravimetric measurements were obtained precisely in a digital balance (Sartorius, Model: TE214S Max = 210 g and d = 0.1 M/g).
2.3 Analysis of trace metal
For trace metal analysis, six samples were taken from each site, select minimum and maximum concentration of PM10 in a season. A known portion of the fiber filter paper was covered by particulates digested by nitric acid and Perchloric acid at 140 °C on a hot plate. Residues were then re-dissolved by 0.1 m hydrochloric acid and a blank were also prepared using the same area of unexposed glass fiber filter paper and by treating the same procedure. These were cooled, filtered and makeup to 50 ml by adding with DDW. Concentrations of trace metals have been analyzed in triplicate by ICP-MS (Agilent Instruments-USA) from samples collected for each site (Danadurai et al., 2011).
2.4 Quality control
The quality control, during the investigation, filter paper numbering, Weighing, monitoring, preconditioning, handling, the post weighing and recording was the thrust. For maintaining the quality control all instruments used during monitoring such as balance, spectrophotometer and Respirable Dust Sampler (RDS) were calibrated on regular gap and recorded. The instruments, performance check, temperature, humidity control, data validation and standard monitoring protocol were followed at all stages. The complete analytical procedures were provided by NABL regulation and central pollution control board, New Delhi.
3 Results and discussion
The results show that the seasonal average concentrations of PM10 in three different areas in Gajraula city i.e. Industrial area, Commercial area, and Residential area were recorded as 222 µgm−3, 250 µgm−3 and 206 µgm−3 in winter and 166 µgm−3, 183 µgm−3 and 163 µgm−3 in monsoon season respectively (Fig. 1). The higher concentration of PM10 was recorded (285 µgm−3) at S2 in the month of June and lower concentration was recorded (145 µgm−3) at S3 in the month of July. The average of all sites exceeded the CPCB National Air Quality Standards (CPCB, 2015).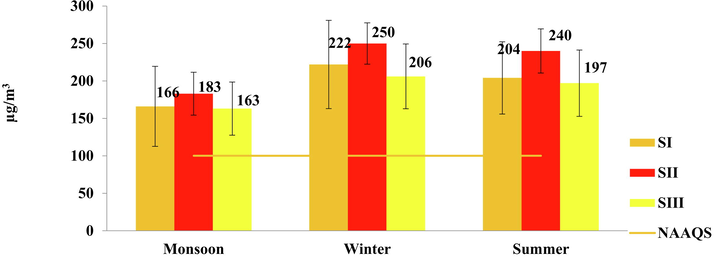
Seasonal average concentration of PM10 at different sites.
In the industrial area of Gajraula the concentration of PM10 was found to be in the range of 38–439 µg/m3. This area is surrounded by many small and big scale of industries along with vehicles, railway and Traffic Emission and many agricultural activities like fuel Burning, leaves burning.
The concentration of PM10 was found to be highest at site II in the range of 49–439 µg/m3 because it has been identified that this area is surrounded by large scale industries like Jublient Power Plant having many units of boiler and fertilizer plants, etc. Railway station, high traffic density, power generators, power houses and many types of commercial activities like coal burning and dung cake burning (Akshu, 2015).
The minimum concentration of PM10 was found at SIII, which is a residential area containing the range of (38–309 µg/m3). In the moderate range of pollution concentration of PM10 was found in SI surrounded by many small scale industries and a few number of large scale industries. It has been found that all the location (SI, SII and SIII) the quantitative value of PM10. Was above the prescribed standards of air quality (CPCB, 2015) of 100 µg/m3 for rural urban and industrial area respectively.
Trace metal such as Pb, Cd, Cu, Zn, Cr, Fe, Al and Ni concentration for the year of 2017–18 was also observed in PM10. Annual mean and ± SD are presented in Table 1 and are reported in ng/m3. Among the three monitoring sites, the highest concentration of Pb (613 ng/m3), Cd (12 ng/m3), Zn (2463 ng/m3), Cr (827 ng/m3), Fe (3249 ng/m3), Al (5143 ng/m3) and Ni (454 ng/m3) recorded at S2, and Cu (138 ng/m3)at S1 which falls in industrial and commercial area due to Jubilant life science, Raunaq Automotives and many other kind of industry i.e. such as paper mills, milk Industry, Teva, Sugar industry and traffic density on NH-24 Line Highway as well as railway station. *Minimum (min) and Maximum (max).
Sites
Session
*Ran-ge
Concentration of PM10(µg/m3)
Concentration of Trace Metal (ng/m3) in PM10
Pb
Cd
Cu
Zn
Cr
Fe
Al
Ni
SI (July 2017 - June 2018)
Monsoon
Min
59
20
1
10
608
32
575
158
13
Max
256
294
4
15
1594
279
1958
2834
124
Winter
Min
85
84
3
45
1235
88
815
239
21
Max
387
478
12
31
1824
819
3142
5042
439
Summer
Min
42
78
4
34
998
65
716
199
17
Max
316
341
8
12
1632
508
2896
4795
387
SII (July 2017 - June 2018)
Monsoon
Min
49
29
4
14
615
41
195
169
15
Max
302
464
10
57
1849
284
2051
2978
127
Winter
Min
149
84
8
48
918
52
845
245
24
Max
439
613
13
138
2463
827
3249
5143
454
Summer
Min
58
62
7
39
816
67
749
207
19
Max
377
521
12
37
2218
512
2985
4895
422
SIII (July 2017 - June 2018)
Monsoon
Min
56
0
0
4
554
7
219
41
0
Max
294
39
2
32
1450
114
1724
1342
10
Winter
Min
81
15
4
18
670
28
621
88
3
Max
309
172
9
84
2023
219
2924
2954
48
Summer
Min
38
11
1
11
998
34
515
64
1
Max
287
142
8
57
1632
207
1624
2815
27
The density of trace metals lead, cadmium, copper, zinc, chromium, iron, aluminum and nickel was also monitored from these three sites SI, SII and SIII. The concentrations of these metals at three different sites are given in the Table 1. Among these trace metals the concentration of Al found to be higher (5143 ng/m3) followed by Fe (3249 ng/m3), Zn (2463 ng/m3), Cr (827 ng/m3), Pb (613 ng/m3), Ni (454 ng/m3), Cu (138 ng/m3) and Cd (13 ng/m3) these trace metals can be arranged in the decreasing order of their concentration (ng/m3) in the following order aluminum > iron > zinc > chromium > lead > nickel > copper > cadmium (ATSDR, 2008).
The highest concentration of trace metals was found to be highest at SII, because this area is surrounded by Power Plants and heavy emission from industries and vehicular activities. These sources were found to release trace metal loaded fumes in the ambient air. Many other activities like cutting, scraping and finishing of machine tools are the other reason for the increasing of trace metal concentration specially Al, Fe and Zn. Vehicular activities and traffic is the main source for the increasing concentration of Pb. Combustion of carburetor, releases total pollutant Cd in the air. Tyre burning and tyre dust found to release and increases the concentration of Cu, Cd and Pb in the level which is injurious to human health and these trace metals may be categorize as traffic pollutants (Wang et al., 2015).
Correlation coefficient (Table 2) of Trace metal concentration inPM10: The correlation coefficient (r) was calculated from the trace metal density in order to predict the perspective of a common source of PM10. The significant positive correlation was found between Pb with Cr (r = 0.921), Al (r = 0.919) and Ni (r = 0.905), Zn with Fe (r = 0.939) and Al (r = 0.903), Cr with Ni (r = 0.957) and Al (r = 0.932), Fe with Al (r = 0.962), Al with Ni (r = 0.905) and in the year July 2017 to June 2018, respectively. Similarly, moderate positive correlation were found between Pb with Cu (r = 0.531), and Cu with Zn (r = 0.496). It may be due to the industrial and anthropogenic activities like vehicular emission and the burning of industrial activity.
Pb
Cd
Cu
Zn
Cr
Fe
Al
Ni
Pb
1.000
Cd
0.847**
1.000
Cu
0.531*
0.661**
1.000
Zn
0.868**
0.789**
0.678**
1.000
Cr
0.921**
0.802**
0.496
0.815**
1.000
Fe
0.868**
0.807**
0.541
0.939**
0.886**
1.000
Al
0.919**
0.813**
0.456
0.903**
0.932**
0.962**
1.000
Ni
0.905**
0.762**
0.350
0.739**
0.957**
0.836**
0.905**
1.000
There were also found a nonsignificant correlation between Ni (r = 0.350) in a complete year. On the basis of correlation study, it may be found that lead, cadmium, copper, zinc, chromium, iron, aluminum and nickel were contributed by some common sources, probably by stacking of industries, vehicular, anthropogenic activity and agriculture sources etc (ATSDR, 2008; Aksu, 2015).
The principal component application for factor analysis is to decrease the number of variables. This method focuses on tidiness up the factors. PCA was applied to determine the correlation between pollutants and to calculate the source layout plan of trace metals in PM10 (Table 3). The values of PCA that was featured to cognize ordinary sources of heavy metals with their variance in PM10 during an year sampling time. PCA results of trace metals in PM10 for last one year exhibited three factors accounting for 99.735% of the collective variance. Factor 1 had high loadings for lead, cadmium, zinc and nickel which explained 81.904% of the entire variance. This factor is allied with Industries and traffic emission (Patil et al., 2004). Thus, factor 1 can be identified as complex sources of industrial activities (such as burning and heating Boiler in Industries, Boiling of Stack and Production on the basis of Acid-Base Reaction) and marching emissions. Factor 2 showing that 10.231% of the total variance and correlated with high loadings on Copper, iron and aluminum. This factor depicts the use of copper and zinc for molding purpose in making Brassware items and other utensils.
Variables
Factor 1
Factor 2
Factor 3
Pb
0.957
−0.093
0.094
Cd
0.895
0.172
0.264
Cu
0.626
0.758
0.072
Zn
0.932
0.163
−0.294
Cr
0.952
−0.179
0.111
Fe
0.954
−0.044
−0.242
Al
0.966
−0.180
−0.132
Ni
0.908
−0.366
0.173
% Variance
81.904
10.231
3.600
Cumulative %
81.904
92.135
95.735
Sources
Industrial activities, Anthropogenic activities and road traffic
Industrial activities (molding Purpose) and road traffic
Agriculture Activity
Another possible source of Zn and Cu is road traffic (diesel engine and wearing of brakes). Factor 3 explained 3.600% of the total variance mainly derived from the rural activities. Table 3: Principle Component Analysis (PCA) in PM10 during 2017–2018. Most of the industrial emissions from IndraChowk (around 500-meter distance industry and traffic interceptions) were attached residential area of the Nagar panchayat and this shows up the urban and rural pop released from the industries.
4 Conclusion
The study carried out to estimate the concentration of various heavy metals in SPM of ambient air in three different site of Gajraula Industrial area. Nevertheless, it was found to have low concentrations of heavy metals except Indra Chowk site. Conclusively, SPM analyses showed the presence of Pb, Cd, Cu, Zn, Cr, Fe, Al and Ni heavy metals. Although the findings on the rate of heavy metal contents are not alarming in this region, regular survey at appropriate intervals should be implemented to monitor the air quality of the Gajraula city as to control pollution from industries, foundries and from other sectors. Further, actions may be taken by educating the industrialists to adapt pollution curtailing methods and also to bring awareness among the common public so as to support and follow pollution control strategies.
Acknowledgements
The author’s gratefully acknowledge the financial help provided by UPPCB/CPCB, Ministry of Environment, Forest and Climate Change New Delhi. The authors would like to thank to UPPCB (Uttar Pradesh Pollution Control Board) and also acknowledge the support of the King Khalid University through a grant RCAMS/KKU/011/19 under Research Center for Advanced Materials Science (RCAMS) at King Khalid University, Kingdom of Saudi Arabia. The authors also thankful to Dr. Shivlalsingh (AGSS Laboratory New Delhi), Dr. R.B. Singh (Cardiologist), Charu Gangwar (Project Assistant), Ajay Kumar (Project Assistant), Priyanka Singh (Project Assistant), Mahesh Kumar (Field Assistant), Digvijay Saxena and Sumit Verma (Computer Assistant) for their valuable support and providing sampling facilities at different locations.
Declaration of Competing Interest
The authors declare that they have no known competing financial interests or personal relationships that could have appeared to influence the work reported in this paper.
References
- Assessment of particulate matter-based air quality index in Port Harcourt. Nigeria. J. Environ. Anal. Chem.. 2017;224(4):1-4.
- [Google Scholar]
- Sources of metal pollution in the urban atmosphere (A case study: Tuzla, Istabul) J. Environ. Health. Sci. Eng.. 2015;13:79.
- [Google Scholar]
- ATSDR, 2008. Division of Toxicology and Environmental Medicine. Public Health Statement Aluminium”. Agency for Toxic Substances and Disease Registry. 2008, CAS# 7429-90-5.
- CPCB, 2015. National Air Quality Index, Available online. http://www.cpcb.nic.in/National Air Quality Index.
- Trace elemental analysis of air-borne particulate matter using dynamic reaction cell inductively coupled plasma- mass spectrometry: application to monitoring episodic industrial emission events. Anal. Chim. Acta. 2011;686:40-49.
- [Google Scholar]
- Single-particle analysis of industrial emissions bring new insights for health risk assessment of PM. J. Atmospheric Pollut. Res. 2018
- [Google Scholar]
- EPCA., CSE. 2018. Air pollution report card 2017.
- Assessment of cadmium, lead and iron in hand dug wells of Ilaro and Aiyetoro, Ogun State, South- Western Nigeria. Res. J. Chem. Sci.. 2011;1(9):1-5.
- [Google Scholar]
- IARC (International Agency for Research on Cancer), 2013. Outdoor Air Pollution a Leading Environmental Cause of Deaths. http://www.iarc.fr/en/mediacentre/iarcnews/pdf/pr221_E.pdf, accessed in June.
- A study on concentrations of heavy metal in blood and urine of local area in Korea. J. Environ. Sci.. 2013;2013(22):59-72.
- [Google Scholar]
- Incorporating bioaccessibility into health risk assessment of heavy metals in particulate matter originated from different sources of atmospheric pollution. Environ. Pollut.. 2019;254:113113.
- [CrossRef] [Google Scholar]
- Simultaneous exposure to heavy metals among residents in the industrial complex: Korean national cohort study. J. Environ. Res.. 2015;2015(12):5905-5917.
- [Google Scholar]
- Accumulation of heavy metals through industrialization. Int. J. Chem. Sc.. 2004;2(4):637-641.
- [Google Scholar]
- Anthropogenic fugitive, combustion and industrial dust: a significant, underrepresented fine particulate matter source in global atmospheric models. Environ. Res. Lett.. 2017;12(044018):1-7.
- [Google Scholar]
- Pope, C.A., Burnett, R.T., Thourton, G.D., Thun, M.J., Calle, E.E., Krewski, D. Goldleski, J.J., 2015. Cardiovascular mortality and long term exposure to particulate air pollution: epidemiological evidence of general pathophysiological pathways of disease. http//circ.aha journals.Org., p. 71–77.
- Effect of sugar factory effluent on some physico-chemical properties of soils-A case study. J. Environ. Sci. Eng.. 2007;49(4):277-282.
- [Google Scholar]
- Impact of air- pollution on pH of soil of Saran, Bihar, India. Res. J. Recent Sci.. 2012;1(4):9-13.
- [Google Scholar]
- Biochemical and physical characterization of diesel petroleum contaminated soil in southeastern Nigeria. Res. J. Chem. Sci.. 2011;1(8):57-62.
- [Google Scholar]
- Sources, transport and deposition of iron in the global atmosphere. Atmos. Chem. Phys.. 2015;15(4):6247-6270.
- [Google Scholar]
- W.H.O. 2013. Health effects of particulate matter. Policy implications for countries in eastern Europe, Caucasus and central Asia. Copenhagen: WHO Regional Office for Europe, 2013.
- Day-night variability of PM10 components at a Mediterrean urban site during winter air quality. Atmos. Health. 2018;1
- [Google Scholar]


