

Translate this page into:
Assessment of Drought vulnerability through an integrated approach using AHP and Geoinformatics in the Kangsabati River Basin
⁎Corresponding authors. sayeed.ce@aliah.ac.in (Mohd Sayeed Ul Hasan), amir.khan@galgotiacollege.edu (Mohammad Amir Khan),
-
Received: ,
Accepted: ,
This article was originally published by Elsevier and was migrated to Scientific Scholar after the change of Publisher.
Peer review under responsibility of King Saud University.
Abstract
This study focuses on the application of multi-sensor satellite archived data products and ancillary data for the evaluation of drought vulnerability. The use of a subjective model, namely Analytical Hierarchy Process (AHP) integrated with Geographical Information System (GIS) and various influencing parameters, emerged as a powerful tool for the gauged and ungauged watershed. The Kangsabati river basin, located in the southern part of West Bengal (India), is facing issues of overexploitation of groundwater, climate variation, and unsystematic agricultural practices that are inducing the water crisis and vulnerability of the basin to drought conditions. In this study, 11 parameters, namely elevation, slope, aspect, LULC, population density, normalized difference vegetation index (NDVI), normalized difference drought index (NDDI), land surface temperature (LST), normalized difference water index (NDWI), vegetation condition index (VCI), and soil moisture index (SMI) were used to delineate the drought in the catchment of Kangsabati River. Findings of this study using Analytical Hierarchy Process (AHP) integrated with a GIS platform, show that, nearly 28.5% of the area falls under the medium drought category, followed by the high (21.1%), no drought (20%), low (19.5%), and very high (10.6%) drought categories in the study area. The study also suggests Nature Based Solution (NBS) in Disaster Risk Reduction (DRR) strategies such as ecosystem-based approaches (EBA) and blue infrastructure for Drought Risk Reduction for drought mitigation in the study area.
Keywords
Drought
Land use
GIS
Nature based solution
Groundwater

1 Introduction
Climate change has aggravated extreme episodes of weather events including severe precipitation, extreme flows and hydro-meteorological droughts in several parts of the world (Miralles et al., 2019). Recent findings of the Intergovernmental Panel on Climate Change (IPCC) AR6 emphasized that the planet is going through a crucial period in terms of the constant rise of surface temperature. It is projected that the temperature will increase up to 5 °C at the end of the century (IPCC, 2021). Besides, findings of World Economic Forum (WEF) expanded concerns over the two prime high risks including failure of climate action and extreme weather events which have severe implications on environment, society and livelihood. Drought refers to the extended abnormal dry weather conditions affecting the hydrological balance. Meteorological droughts are the result of deficit precipitation while hydrological droughts are associated with shortages of water in lakes, reservoirs, stream flow and groundwater (Khoi et al., 2021). The Global Assessment Report on Disaster Risk Reduction (GAR) special report on drought (UNDRR, 2021) has also emphasized that an increase in temperature between 3° to 5 °C would lead to severe to very severe drought over central, eastern and western Asia. Further, droughts have affected nearly 1.5 billion people between 1998 and 2017 and economic losses incurred from droughts are up to USD 124 billion globally. The imbalance of natural components makes the climatic events more irregular and whimsical. The common climatic events have turned into destructive hazards that have created an alarming situation for the society since the last decade. Climate change has also induced the frequency and intensity of hydro-meteorological hazards (HMH) such as floods, droughts, cyclones, wildfires, sea level change, ecological vulnerability etc. resulting acute water crisis in various parts of the world (Mitchard 2018; Rehman et al.,2021; Rehman et al.,2022; Rather et al., 2022; Hasan et al.,2022).Fig. 1..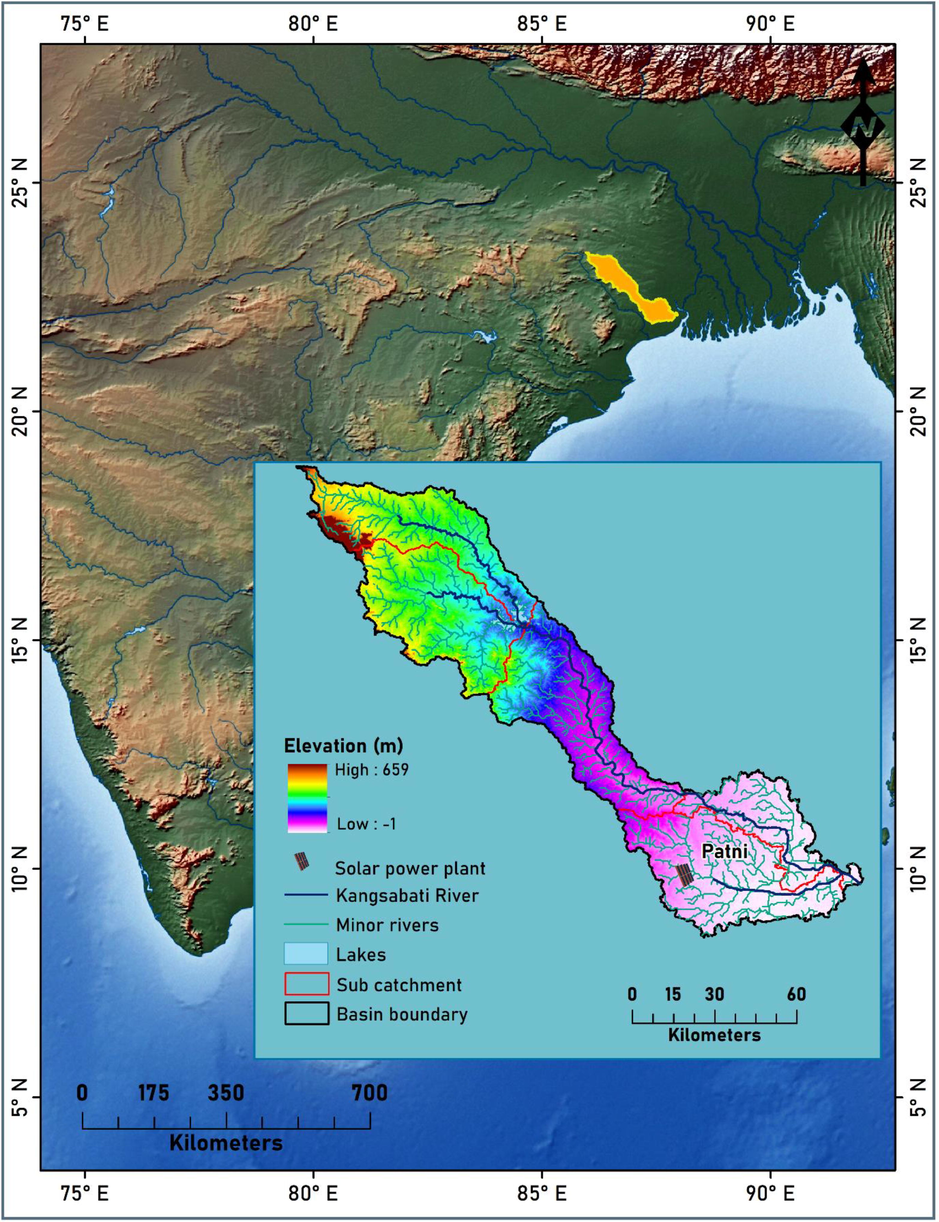
Location of the site.
Though climate change effects are evident in every corner of the world, tropical countries are highly susceptible to their implications. Seasonal variability, such as a prolonged summer and irregular monsoonal onset and withdrawal, makes floods and droughts more severe nowadays. The exponential increase in population is also putting a strain on natural resources, leading to overexploitation and degradation (Hasan & Rai,2020). Studies have also been expanded on growing drought implications in tropical river basins (Vu et al., 2017; Khatiwada & Pandey, 2019; Rehana & Naidu, 2021). A study by (Senarathne et al. 2021) mentioned that the Walawe River basin in Sri Lanka is facing the ground water crisis and drought condition due to the intervention of human society. Many studies show that the tropical basin are also showing the effect of drought due to lack of precipitation, and also effected by transformation of land use pattern. Moreover, drought assessment using a combination of indices may provide significant insights of drought frequency, occurrence and severity (UNDRR, 2021). Ma et al. (2014) used an improved standardized palmer drought severity (SPDI) for precise spatio-temporal drought analysis at selected locations globally. Vu et al. (2017) utilized Standardized Runoff Index (SRI) and Standardized Precipitation Index (SPI) for assessing the hydro-meteorological drought in Vu Gia-Thu Bon basin of Vietnam. Sur et al. (2019) carried out remote sensing based agricultural drought assessment using hydro-meteorological variables. Another study by Alsumaiei (2020) examined the drivers of groundwater drought in arid areas of Kuwait using a simplified precipitation index (PI). Several other methods have also been used by scholars including remote sensing-based indices (Su et al., 2017), drivers, impacts & response (Lange et al., 2017), neural network models (Khan et al., 2018), nonlinear autoregressive neural network (Alsumaiei & Alrashidi, 2020) and multivariate statistical methods (Azhdari et al., 2021). Global various studies show the relevance of application of AHP techniques for drought vulnerability mapping (Palchaudhuri and Biswas, 2016; Ekrami et al.,2016; Sivakumar et al.,2021).
Kangsabati, like other tropical river basins, has experienced severe hydro-meteorological disasters in recent years. Thus, this study makes an attempt to analyze the spatio-temporal distribution of drought-influencing parameters in the catchment of the Kangsabati River basin using an analytical hierarchy process (AHP). The study also suggests a long-term solution by using a pair of NBS in the Disaster Risk Reduction (DRR) strategy, such as 1) an ecosystem-based approach (EBA) and 2) blue infrastructure for drought risk reduction.
2 Site description
Kangsabati river basin is a part of Chhotonagpur plateau, located in the eastern part of India. The river basin sets over the tropical fringe plateau with a total area of ∼ 9685 km2. The river basin is extended from 21°45′N to 23°30′N latitudes and 85°45′E to 88° 15′E longitudes. Kangsabati is one of the most important rivers in the southern part of West Bengal, flowing from northwest to south eastward (Bhattacharya et al., 2020). The name of the basin came from the tropical rainfed river ‘Kangsabati’ which leads to floods and droughts every year in its basin. This river is considered one of the largest rivers in West Bengal. The unbearable temperature and high evaporation make the summer extremely dry and accelerate the fast consumption of the groundwater. For urbanization and economic development, the maximum catchment area has turned into cultivated land by erasing forests. Agriculture is considered as the main occupation in this catchment area. Kharif and Ravi crops yield primarily based on the Kangsabati river water. But crop failures, improper growth of plants, soil erosion occur every year due to the inadequate supply of water. To resolve the problems, the Government of India and the Government of West Bengal mutually decided to build a reservoir on Kangsabati channel namely Kangsabati irrigation Project at Mukutmanipur, in Bankura district near the confluence of the Kangsabati and the Kumari River. The reservoir was mainly built to provide the sufficient water for the irrigation in dry pre monsoon period to protect the agriculture and to supply the fresh drinking water for the people in lower catchment areas. The natural flow of the river was interrupted for the artificial reservoir and the river basin was bifurcated into two portions. After a while it was observed that the local ecology and the environment have gradually changed. The supply of the water was unequal to both the up and down streams. As a result, two different types of conditions prevailed in the same river basin. The irrigation project was unable to fulfil the demand.
3 Methods
Drought in the study areas was delineated through 11 conditioning parameters including elevation, slope, aspect, LULC, population density, NDVI, normalized difference drought index (NDDI), land surface temperature (LST), normalized difference water index (NDWI), vegetation condition index (VCI) and soil moisture index (SMI) using analytical hierarchy process (AHP). A detailed suggested methodology is presented in Fig. 2.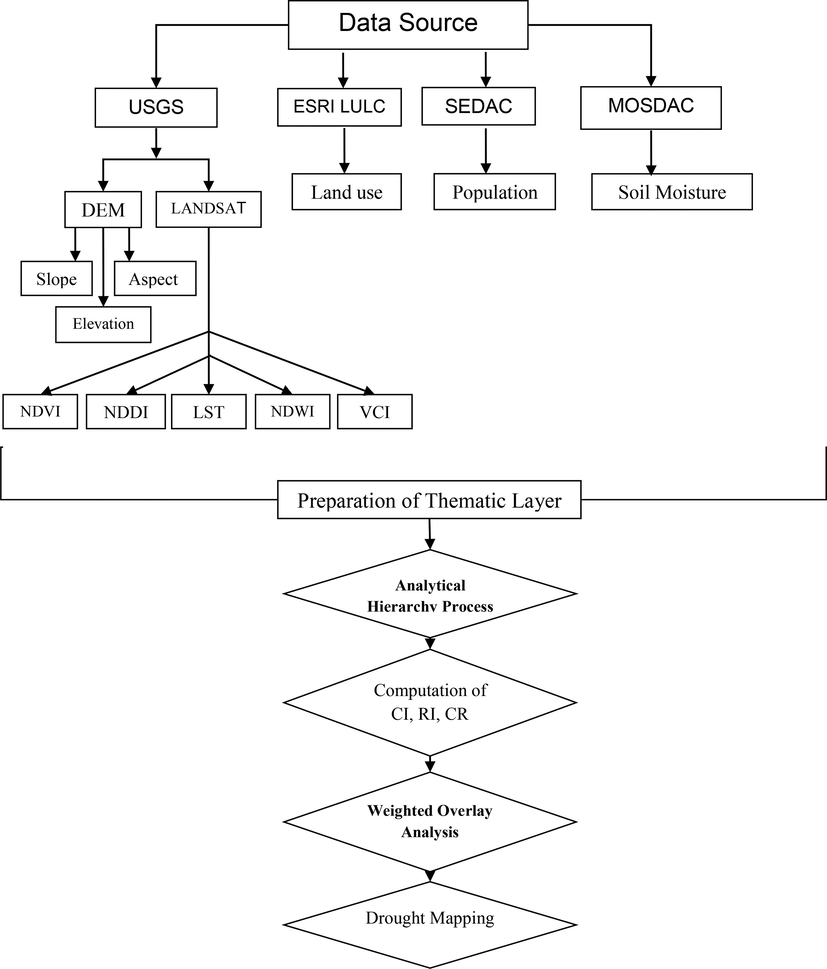
Adopted methodology for drought vulnerability in Kangsabati River Catchment.
3.1 Analytical hierarchy process
The AHP method was used to generate a pairwise matrix of conditional variables. The AHP method is a well-known method for solving complex problems related to drought vulnerability (Palchaudhuri and Biswas, 2016; Ekrami et al.,2016; Sivakumar et al.,2021). Different researchers have used pairwise rating methods in flood risk studies to capture the significance and contributions of each conditional element in flood mapping (Vojtek & Vojteková, 2019). All the parameters were ordered hierarchically in this approach to allow pairwise comparison and their relative significance was ascertained using a comparative scale suggested by Saaty (1980) consisting of integer numbers ranging from 1 to 9 (1 indicating equal importance and 9 refers to extreme importance). A 11 × 11 pair wise reference matrix of diagonals, it compares the value of each unit, elements are equal to 1. The remaining values in each row reflect the relative significance of the remaining variables. Rank of each parameter was determined using pair wise comparison matrix, the relative weight matrix, and the normalized principal Eigen vector (Table 1). maximum eigenvalue: 12.4, CI: 0.14 and CR: 0.10.
Parameters
NDVI
VCI
LST
LULC
SMI
NDDI
NDWI
Slope
Population Density
DEM
Aspect
NDVI
1
2
3
2
6
5
7
9
8
9
9
VCI
0.5
1
1
1
2
5
4
6
5
7
7
LST
0.33
1
1
1
6
7
3
5
6
7
6
LULC
0.5
1
1
1
3
8
7
9
7
9
7
MSI
0.17
0.5
0.17
0.33
1
3
1
5
7
5
8
NDDI
0.2
0.2
0.14
0.13
0.33
1
1
4
6
9
4
NDWI
0.14
0.25
0.33
0.14
1
1
1
4
6
9
4
Slope
0.11
0.17
0.2
0.11
0.2
0.25
0.25
1
3
4
2
Population Density
0.13
0.2
0.17
0.14
0.14
0.17
0.17
0.33
1
3
3
DEM
0.11
0.14
0.14
0.11
0.2
0.11
0.11
0.25
0.33
1
1
Aspect
0.11
0.14
0.17
0.14
0.13
0.25
0.25
0.5
0.33
1
1
The estimation of the normalized principal eigen vector based on the comparison matrix was calculated by dividing the summation of column values with the relative weight matrix. The normalized principal eigen vector was obtained by averaging the rows, and then the effect percentages for each thematic layer based on the normalized principal eigen vector were calculated. The consistency ratio (CR) was used to check the accuracy of the relation, where less than or equal to 0.1 implies an appropriate reciprocal matrix while a ratio greater than 0.1 indicates that the matrix should be modified (Sani Yahaya et al. 2010). It is determined as:
3.2 Weighted overlay analysis
The weighted overlay analysis is an easy, simple, and sufficient approach for evaluating possible drought hazard areas. Eleven environmental factor maps were used to prepare a drought risk zonation map of the study area. In order of significance, those factors were given a numerical proportional rating on a 1–5 scale. The classes of the factor were also assigned weights and grades, with higher weights and ranks showing a greater impact on drought occurrence. To create the drought hazard zone map, these factors were overlaid as thematic layers in GIS using the weighted overlay method (WOM). Finally, the drought map was prepared by adding all the parameters after multiplication to their weights (Eq. (3)). Drought map was categorized into five zones: very high, high, medium, low and no drought.
4 Results and discussion
4.1 Elevation, slope, aspect and LULC
The availability of water is also heavily influenced by the plain's elevation. The digital elevation model (DEM) represents landscapes and ground surface topography and is critical for overcoming problems such as climate change impacts, emergency management, environmental management, and water security. This study has utilized a 30-meter-resolution SRTM DEM dataset (USGS). High elevations are observed in the north region, while the area in the south region is mostly a low-elevation zone (Fig. 3a). The descriptive statistics shows the mean sea level ranges from −1 to 659 m, having mean and standard deviation as 126.69 and 107.83 m respectively. Slope is another significant drought risk parameter that quantifies the inclination of the ground surface from the horizontal. When compared to the nearby ground surface, water runoff is significantly higher over steeper terrain. As a result, as compared to steep plains, terrain regions with lower slopes are less sensitive to droughts (Jain et al. 2015). The descriptive statistics shows the slope in degree ranges from 0 to 89.99, having mean and standard deviation as 80.11 and 28.11 respectively. Fig. 3b shows the spatial variation of the slope percentage. Aspect refers to the slope direction, and different aspects have varying degrees of sun radiation which influence the hydrology of the study area (Fig. 3c). This parameter is influenced by hydrology. The research area's aspect map was separated into several classifications (Bennie et al. 2008). A value was determined for each class based on the influence of temperature, humidity, infiltration, runoff, and soil evaporation. Using relevant literature and local specialized knowledge, vulnerability classifications for various aspect ranges were developed.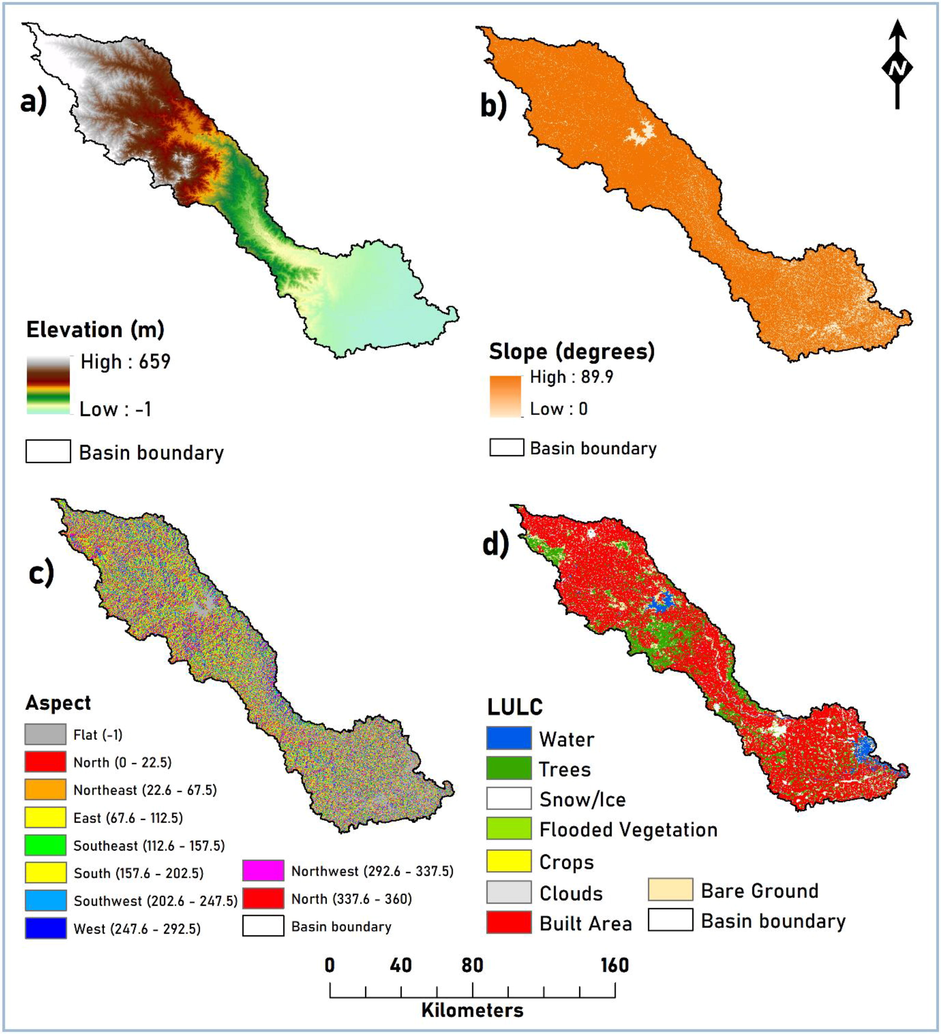
Thematic layers for drought analysis: a) elevation, b) slope, c) aspect and d) LULC.
Drought susceptibility can be seen dynamically as a function of land use and management, involving government farming methods and societal issues. Due to its dynamic character, it is regarded as an exposure variable for the study. The land use data were collected from the Esri 2020 Land cover (Karra et al., 2021). The dominant land use in the study area was identified by crop (63.74 %) followed by trees (18.62 %), built area (9.45 %), scrub/shrub (4.25 %), water (3.37 %), grass (0.35 %), barren land (about 0.16 %) and flooded vegetation (0.06 %) as shown in Fig. 3d. Because of their dependence on water for living, agricultural (urban use) is implicitly the first (second) victim due to water scarcity and drought among the eight stated land-use groups. As a result, the agricultural category has the largest number weight value since it is thought to be more sensitive to drought.
4.2 Population density, LST, NDVI and NDWI
Population density has an impact on water consumption as well. Water use and demand are both high in places with dense populations. As a result, regions with a higher population are thought to be more sensitive to drought than those with a lower population. Population density is classified as an exposed factor in this study because while the population expands, so does the demand for water and the strain on scarce water supplies. The constant rise in population density will have an influence on water supply in any given location, increasing the risk of drought. The population density estimates for 2020 were acquired from NASA Socio Economic Data and Application Centre (SEDAC) (CIESIN, 2022) (Socioeconomic Data and Application Centre) (Fig. 4a). In contrast, the population density in the southeast study region is quite high. This suggests that the region's high population density and rapid population growth rates increase the likelihood of water shortage or water stress conditions. Land surface temperature (LST) produced from TIR band data has been discovered to give critical and valuable information on the status of the land surface, and it is commonly used in calculating water and energy budgets at the surface-atmosphere interface (Gutman, 1990). LST (Fig. 4b and Table 2) is used as a proxy in this context to quantify evapotranspiration, vegetation water stress, soil moisture, and thermal inertia (Moran et al., 1994).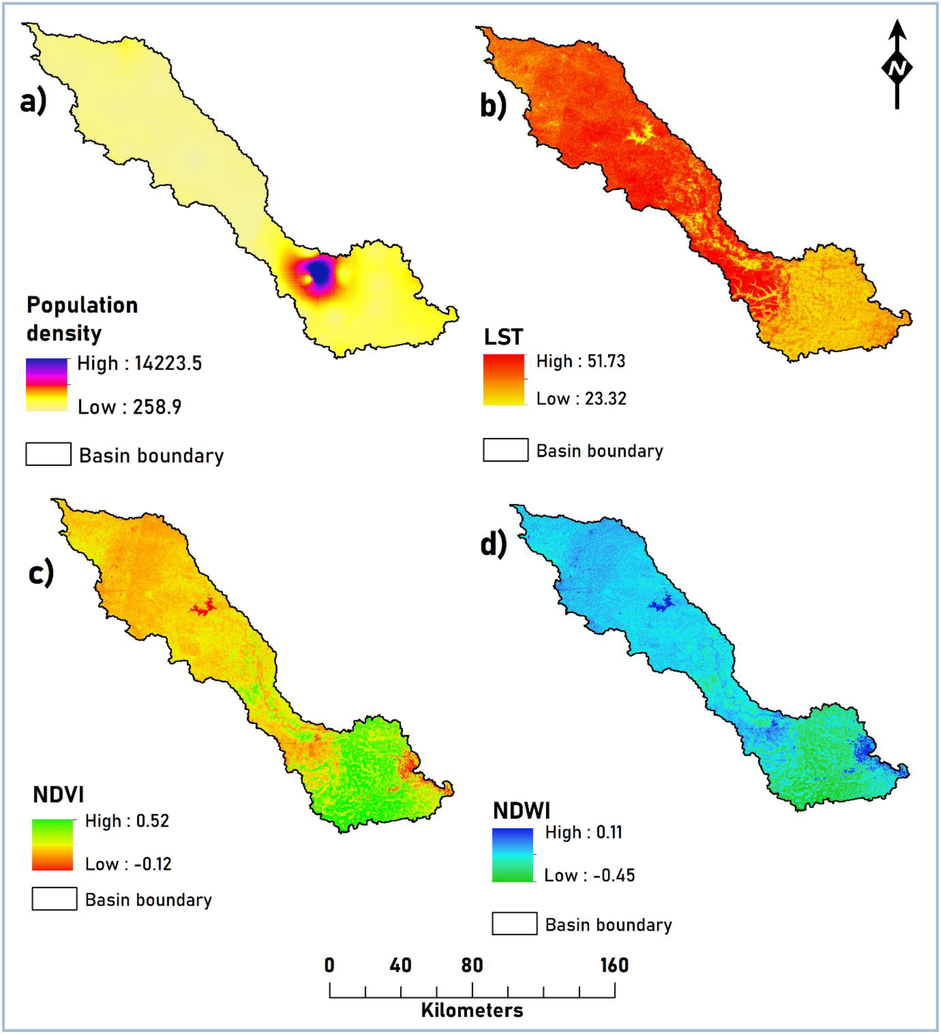
Thematic layers for drought analysis: a) population density, b) LST, c) NDVI and d) NDWI.
Indices
Formula
Sources
NDVI
NDVI = (NIR- RED)
/ (NIR + RED)(Myneni et al., 1995)
NDDI
NDDI = (NDVI – NDMI) / (NDVI + NDMI)(Gu et al., 2008)
NDWI
NDWI = (NIR – Green) / (NIR + Green)(Jackson et al., 2004)
VCI
VCI = (NDVI -
) / (
+
)
(Kogan 1995)
LST
1. Digital Numbers (DN) converted to spectral radiance
(
)=
*
+
2. Spectral radiance to brightness temperature in Celsius
=
/ In (
/
+ 1) − 273.153. Proportion of Vegetation
(PV)
Pv = [(NDVI -
)/(
+
)]^2
4. Land Surface Emissivity
LSE = 0.004 * PV + 0.986
5. Land Surface TemperatureLST=
(BT/1) + W * (BT / 14380) * In(E)(Valor and Caselles, 1996; Artis & Carnahan, 1982; Chander et al., 2009)
NDVI can be utilized as a response variable in semiarid and arid environments to identify and quantify drought disturbance, with low values correlating to stressed plants (Tucker & Choudhury, 1987). NDVI index and a Landsat 8 ETM + image was used to map the plant cover in this study. The Normalized Difference Vegetation Indicator (NDVI) is a vegetation index that measures the amount of photosynthesis occurring in plants or their greenness (Fig. 4c). This vegetation index is used rather commonly. Greenness can be calculated by turning a remotely sensed image's red and near-infrared bands into a vegetation index and dividing by the resulting number. NDVI is computed for every image, whether it has a red and near-infrared wavelength band or not (Table 2). NDVI images vary from −1 to + 1, with −1 represents saturated water and + 1 corresponds to healthy vegetation (Myneni et al., 1995). When making this inquiry, just the density of vegetation cover would be considered (Myneni et al., 1995). Water stress can influence the vegetative canopy during a drought episode. This can have a significant influence on plant development in general, resulting in crop failure or poorer crop yield in agricultural regions. Early detection of plant water stress can help to avoid such outcomes. The Normalized Difference Water Index (NDWI) has been shown to be highly linked to plant water content (Fig. 4d). As a result, it is an excellent predictor of plant water stress. Several studies have proved its utility for drought monitoring and early warning (Gu et al., 2008). It is calculated using near infrared (NIR) and short-wave infrared (SWIR) reflectance, making it sensitive to changes in liquid water content and spongy mesophyll in plant canopies (Gao, 1996; Perveen et al., 2016).
4.3 NDDI, VCI and SMI
Normalized Difference Drought Index (NDDI) can provide an appropriate measure of the dryness of a specific area, because it combines information on both vegetation and water (Fig. 5a and Table 2). NDDI combines information from the NDWI (Normalized Difference Water Index) and NDVI (Normalized Difference Vegetation Index) data. The first is an index generated from the visible red and near infrared channels, evaluating variations in chlorophyll absorption and reflection in the vegetative canopy's spongy mesophyll that are reflected in these bands. (Renza et al., 2010) used Landsat to apply the index to diverse vegetation in Spain and found that it performed better than other indices when sensing drought conditions, such as NDVI or NDWI alone. NDDI takes advantage of the fact that NDVI detects plant matter while NDWI detects plant wetness. The vegetation condition index (VCI) established by Kogan (1997) normalizes NDVI pixel by pixel, scaling between minimum and maximum NDVI values (NDVI min and NDVI max, respectively), as recorded at each pixel over a lengthy temporal record since 1981. NDVI′ is the average NDVI for a composite time period (which can be a decade, growing season, Week, month, or a year). The normalization emphasizes relative changes in the local NDVI signal across time while minimizing the impact of spatial and temporal variability in NDVI phenology between various land cover types and meteorological circumstances. This measure is used to estimate vegetative health and monitor drought (Fig. 5b). The SMI is used to assess soil moisture conditions during a drought (Fig. 5c). It is an excellent predictor of drought. The dataset was obtained from the Meteorological & Oceanographic Satellite Data Archival Centre (MOSDAC) having a spatial resolution of 40 km. The SMI results are obtained Pre-monsoon of the year 2018 from the SMAP l-band radiometer.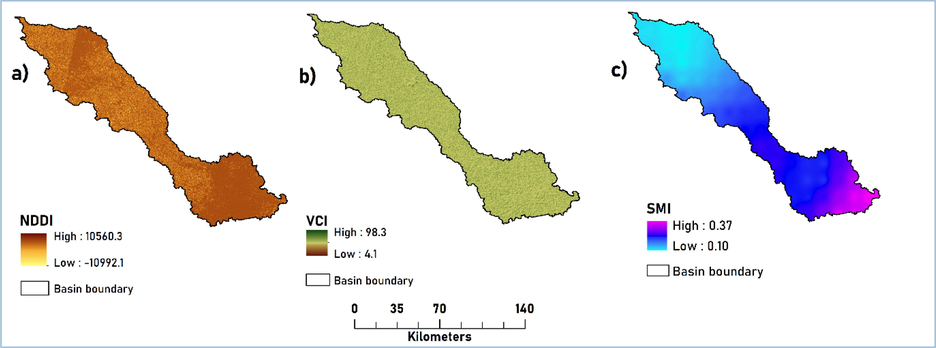
Thematic layers for drought analysis: a) NDDI, b) VCI and c) SMI.
4.4 Spatial distribution of drought vulnerability in the Kangsabati river basin
Drought vulnerability analysis revealed that most of the basin, nearly 28.5 % of its area, falls under the medium drought category, followed by the high (21.1 %), no drought (20 %), low (19.5 %), and very high (10.6 %) categories. High NDVI, high to moderate land surface temperature, moderate elevation, and a steep slope have resulted in high to very high drought vulnerability. These areas are also characterized by built-up areas and moderate population density. Catchment-wise areas under different drought categories are presented in Table 3. The maximum areas under high and very high drought risk can be identified in catchment 2 (9.6 %), catchment 3 (8.9 %) and catchment 1 (5.5 %) illustrated in Fig. 6. Similar study was also carried out over few parts of the study area (Palchaudhuri and Biswas, 2016; Ghosh et al.,2020).
Division
Drought
Area (ha)
Area (%)
Basin
Very High
61514.8
10.61
High
123342.1
21.28
Medium
165,482
28.55
Low
113369.1
19.56
No Drought
115891.9
20
Total
579,600
100
Catchment 1
Very High
10323.68
1.78
High
21579.27
3.72
Medium
58472.08
10.09
Low
5375.53
0.93
No Drought
849.43
0.15
Catchment 2
Very High
12446.99
2.15
High
43023.88
7.42
Medium
39851.60
6.88
Low
828.90
0.14
No Drought
448.63
0.08
Catchment 3
Very High
23078.67
3.98
High
28475.25
4.91
Medium
25463.74
4.39
Low
6051.12
1.04
No Drought
13531.22
2.33
Catchment 4
Very High
8.84
0.00
High
3.79
0.00
Medium
1794.07
0.31
Low
43838.23
7.56
No Drought
50955.06
8.79
Catchment 5
Low
53290.72
9.19
No Drought
43309.28
7.47
Catchment 6
Very High
33.92
0.01
High
45.46
0.01
Medium
6089.30
1.05
Low
47703.55
8.23
No Drought
42727.77
7.37
Total
579,600
100
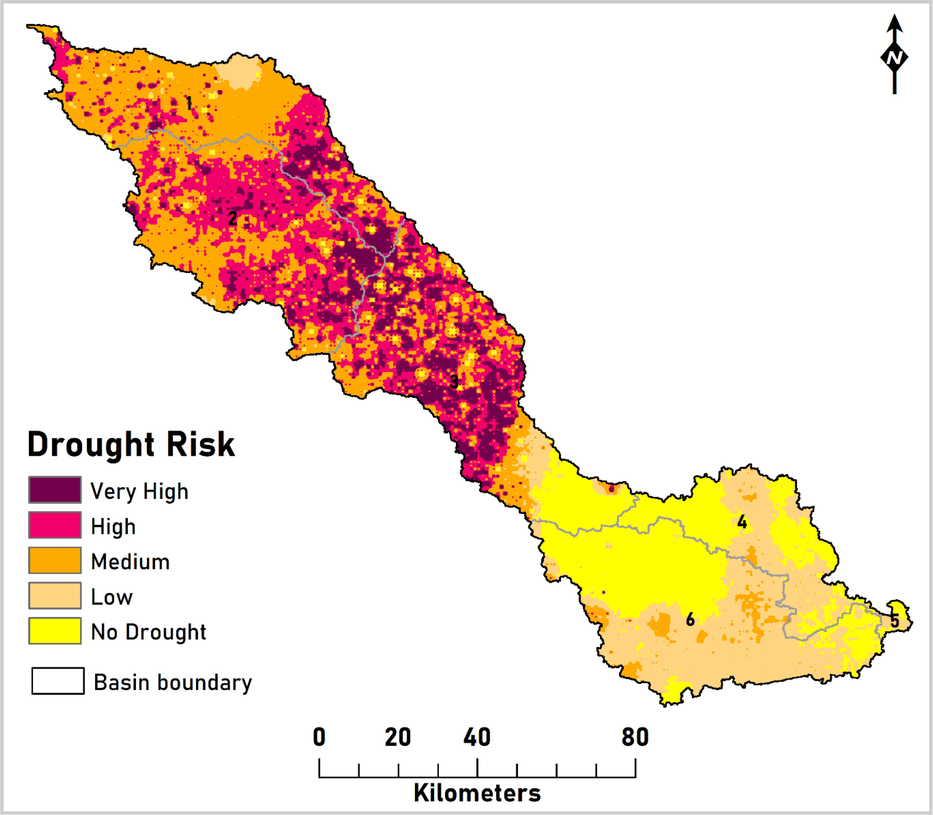
Spatial distribution of drought in the study area.
Apart from drought risk, some critical problems can be identified, such as soil dryness, ground water table decline, water scarcity, drought, soil erosion, deforestation, crop failure, and lastly, environmental imbalance in the upper catchment area. The basin is situated over a transition zone between the Chotanagpur plateau and the river plain. This peculiar lithological setting may be responsible for these problems. The upper catchment area is situated in Purulia and Bankura districts, which are famous for dry and extreme climatic zones and have high potential for water scarcity. The undulating hard rock terrain has infertile lateritic soil with a low water holding capacity. Kangsabati itself is an intermittent river which propagates dryness and aridity in the region. Due to the unsupported circumstances, land erosion and soil fertilization dominate the basin. In these unfavourable physical conditions, agricultural practices and other primary activities get hampered, and people are facing meteorological and agricultural drought almost every year. The gully erosion accelerates with the arrival of the monsoon, and the loose materials deposit in the river bed. Consequently, the lower catchment is severely flooded with a huge economic damage. Kangsabati River basin is such a tropical river that fosters both drought and flood every year. To protect the basin, the government took initiative by making a barrage over Kangsabati near Mukutmanipur. It was planned to supply the reserve water to the upper catchment area in the dry season by the canal system, which would help for both agricultural use and domestic use. Likewise, it may control the lower catchment flood by holding the extra water during the rainy season. But recent studies have mentioned that the barrage failed to prevent the hydro-meteorological hazards, and the Kangsabati command area is at great risk both environmentally and economically.
Various plans, strategies, and techniques have already been applied, but they failed to mitigate these problems. In this circumstance, a nature-based solution (NBS) is the best alternative to mitigate HMH as a long-term solution by developing the adaptive capacity of nature. Two types of problems have been recognized: 1) agriculture and ecosystem-related, and 2) soil and land degradation as a result of groundwater decline. Long-term solutions can be found by using a pair of NBS in the Disaster Risk Reduction (DRR) strategy, such as an ecosystem-based approach (EBA) and blue infrastructure for drought risk reduction. To mitigate the vegetal degradation and prevent the ecosystem extinction, ‘Climate Smart Agriculture’ can be adopted which includes rain fed agriculture and contour trenching for restoration of agricultural land and riparian forest ecosystem and reforestation as a safeguard of Ecosystem and habitat protection. On the other hand, blue infrastructure may be obtained for groundwater table recharge and land reformation which includes Groundwater Based Natural Infrastructure and Integrated Dam Operation Management for the sustainable use of natural assets. All the above strategies are highly suitable for the basin management and they are interconnecting and overlapping accordingly.
5 Conclusion
This work has been carried out for drought risk assessment in the Kangsabati River basin. Assessment has been done by a set of multi-parameter and other site-specific parameters using AHP. Findings of the study reveal that most of the basin—nearly 60 %—is under drought, including three catchments located in the northern parts of the basin. Drought risk was found to be caused by low vegetation cover, dense population, steep slopes, and moderate elevation. Though this study has examined a set of parameters that may be applied in other areas using high-resolution datasets and indicators showing the sensitivity of the people in order to get insights into the drought's implications, Inclusion of vulnerability analysis in risk assessment should be considered equally, including socio-economic and cultural aspects of the susceptible communities. Even though the upper part of the basin is at risk for drought, the lower catchment is severely flooded during the monsoon, which results in significant economic loss. A long-term strategy must safeguard the region by boosting adaptive capacity, which can boost the economic climate scenario in that specific basin. Numerous scientific technologies have already been used; however, none has been able to resolve the problem. Disaster risk approaches such as ecosystem-based approaches (EBA) and blue infrastructure for drought risk reduction may provide an effective and strong climate resilience tool to combat the upcoming hazards in the region. Understanding ecological changes driven by climate change, increasing population, and land use transformation is imperative for long-term drought risk mitigation. The study calls for stringent policy initiatives and the employment of nature-based solutions in dense population areas to lessen the risk of hydrological disasters in the basin. This study is helpful for the future delineation of artificial recharge sites to reduce the effect of drought and surface runoff.
Acknowledgement
The authors would like to acknowledge the support provided by Researchers Supporting Project number (RSP-2021/310), King Saud University, Riyadh, Saudi Arabia.
Declaration of Competing Interest
The authors declare that they have no known competing financial interests or personal relationships that could have appeared to influence the work reported in this paper.
References
- Hydrometeorological drought forecasting in hyper-arid climates using nonlinear autoregressive neural networks. Water. 2020;12(9):2611.
- [CrossRef] [Google Scholar]
- Survey of Emissivity Variability in Thermography of Urban Areas. Remote Sens. Environ.. 1982;12:313-329.
- [CrossRef] [Google Scholar]
- Hydro-meteorological drought risk assessment using linear and nonlinear multivariate methods. Phys. Chem. Earth, Parts A/B/C. 2021;123:103046
- [CrossRef] [Google Scholar]
- Slope, aspect and climate: spatially explicit and implicit models of topographic microclimate in chalk grassland. Ecol. Model.. 2008;216(1):47-59.
- [Google Scholar]
- Sub-basin prioritization for assessment of soil erosion susceptibility in Kangsabati, a plateau basin: a comparison between MCDM and SWAT models. Sci. Total Environ.. 2020;734:139474
- [Google Scholar]
- Summary of Current Radiometric Calibration Coefficients for Landsat MSS, TM, ETM+, and EO-1 ALI Sensors. Rem. Sens. Environ.. 2009;113:893-903.
- [Google Scholar]
- CIESIN (Centre for International Earth Science Information Network)- Columbia University. 2022. National Aggregates of Geospatial Data Collection: Population, Landscape, And Climate Estimates, Version 4 (PLACE IV). Palisades, New York: NASA Socioeconomic Data and Applications Centre (SEDAC). https://doi.org/10.7927/rht8-jv78.
- Drought vulnerability mapping using AHP method in arid and semiarid areas: a case study for Taft Township, Yazd Province, Iran. Environ. Earth Sci.. 2016;75(12):1-13.
- [Google Scholar]
- NDWI—A normalized difference water index for remote sensing of vegetation liquid water from space. Remote Sens. Environ.. 1996;58(3):257-266.
- [CrossRef] [Google Scholar]
- Impact of hydro-geological environment on availability of groundwater using analytical hierarchy process (AHP) and geospatial techniques: A study from the upper Kangsabati river basin. Groundwater Sustainable Dev.. 2020;11:100419
- [Google Scholar]
- Evaluation of MODIS NDVI and NDWI for vegetation drought monitoring using Oklahoma Mesonet soil moisture data. Geophys. Res. Lett.. 2008;35(22)
- [CrossRef] [Google Scholar]
- Groundwater quality assessment in the Lower Ganga Basin using entropy information theory and GIS. J. Clean. Prod.. 2020;274:123077
- [CrossRef] [Google Scholar]
- Hydrometeorological consequences on the water balance in the ganga river system under changing climatic conditions using land surface model. J. King Saud Univ. Sci.. 2022;34:102065
- [Google Scholar]
- IPCC, (2021). Climate Change 2021: The Physical Science Basis. Contribution of Working Group I to the Sixth Assessment Report of the Intergovernmental Panel on Climate Change [Masson-Delmotte, V., P. Zhai, et al. Cambridge University Press, Cambridge, United Kingdom and New York, NY, USA, DOI:10.1017/9781009157896.
- Vegetation water content mapping using Landsat data derived normalized difference water index for corn and soybeans. Remote Sens. Environ.. 2004;92(4):475-482.
- [Google Scholar]
- Spatio-temporal assessment of vulnerability to drought. Nat. Hazards. 2015;76(1):443-469.
- [CrossRef] [Google Scholar]
- Global land use / land cover with Sentinel 2 and deep learning. IEEE Int. Geosci. Rem. Sens. Symposium IGARSS. 2021;2021:4704-4707.
- [Google Scholar]
- Wavelet-ANN versus ANN-based model for hydrometeorological drought forecasting. Water. 2018;10(8):998.
- [CrossRef] [Google Scholar]
- Characterization of hydro-meteorological drought in Nepal Himalaya: A case of Karnali River Basin. Weather Clim. Extremes. 2019;26:100239
- [CrossRef] [Google Scholar]
- Impact of climate change on hydro-meteorological drought over the Be River Basin, Vietnam. J. Water Climate Change. 2021;12(7):3159-3169.
- [CrossRef] [Google Scholar]
- Kogan, F.N. (1995), Application of vegetation index and brightness temperature for drought detection, Adv. Space Res., Volume 15, Issue 11,1995,Pages 91-100,ISSN 0273-1177,https://doi.org/10.1016/0273-1177(95)00079-T.
- Global drought watch from space. Bull. Am. Meteorol. Soc.. 1997;78(4):621-636.
- [CrossRef] [Google Scholar]
- A framework for a joint hydro-meteorological-social analysis of drought. Sci. Total Environ.. 2017;578:297-306.
- [CrossRef] [Google Scholar]
- A new standardized Palmer drought index for hydro-meteorological use. Hydrol. Process.. 2014;28(23):5645-5661.
- [CrossRef] [Google Scholar]
- Land–atmospheric feedbacks during droughts and heatwaves: state of the science and current challenges. Ann. N. Y. Acad. Sci.. 2019;1436(1):19-35.
- [CrossRef] [Google Scholar]
- The tropical forest carbon cycle and climate change. Nature. 2018;559:527-534.
- [CrossRef] [Google Scholar]
- Estimating crop water deficit using the relation between surface-air temperature and spectral vegetation index. Remote Sens. Environ.. 1994;49(3):246-263.
- [CrossRef] [Google Scholar]
- The interpretation of spectral vegetation indexes. IEEE Trans. Geosci. Remote Sens. 1995;33:481-486.
- [Google Scholar]
- Application of AHP with GIS in drought risk assessment for Puruliya district, India. Natural Hazards. 2016;84(3):1905-1920.
- [Google Scholar]
- Influence of Soil Type on the Growth Parameters, Essential Oil Yield and Biochemical Contents of Mentha arvensis L. J. Essential Oil Bear. Plants. 2016;19(1):76-81.
- [Google Scholar]
- Anthropogenic impacts on phytosociological features and soil microbial health of Colchicum luteum L. an endangered medicinal plant of North Western Himalaya. Saudi J. Biol. Sci.. 2022;29(4):2856-2866.
- [Google Scholar]
- Development of hydro-meteorological drought index under climate change–Semi-arid river basin of Peninsular India. J. Hydrol.. 2021;594:125973
- [CrossRef] [Google Scholar]
- Rehman, S., Hasan, Mohd. S. U., Rai, A. K., Rahaman, Md. H., Avtar, R., & Sajjad, H. (2022). Integrated approach for spatial flood susceptibility assessment in Bhagirathi sub-basin, India using entropy information theory and geospatial technology. Risk Analysis, 1– 16. https://doi.org/10.1111/risa.13887.
- Assessing flood-induced ecological vulnerability and risk using GIS-based in situ measurements in Bhagirathi sub-basin, India. Arabian J. Geosci.. 2021;14(15)
- [CrossRef] [Google Scholar]
- Renza, D., Martinez, E., Arquero, A., & Sanchez, J. (2010, May). Drought estimation maps by means of multidate Landsat fused images. In Proceedings of the 30th EARSeL Symposium (pp. 775-782).
- The Analytic Hierarchy Process. New York: McGraw Hill; 1980.
- Influence of regional climatic on the hydrogeochemistry of a tropical river basin—a study from the Walawe river basin of Sri Lanka. Environ Sci Pollut Res. 2021;28:15701-15715.
- [CrossRef] [Google Scholar]
- Drought vulnerability assessment and mapping using Multi-Criteria decision making (MCDM) and application of Analytic Hierarchy process (AHP) for Namakkal District, Tamilnadu, India. Mater. Today:. Proc.. 2021;43:1592-1599.
- [Google Scholar]
- Drought Monitoring and Assessment Using Remote Sensing. In: Lakshmi V., ed. Remote Sensing of Hydrological Extremes. Springer Remote Sensing/Photogrammetry. Cham: Springer; 2017.
- [CrossRef] [Google Scholar]
- Remote sensing-based agricultural drought monitoring using hydrometeorological variables. KSCE J. Civ. Eng.. 2019;23(12):5244-5256.
- [CrossRef] [Google Scholar]
- Satellite remote sensing of drought conditions. Remote Sens. Environ.. 1987;23(2):243-251.
- [Google Scholar]
- UNDRR-United Nations Office for Disaster Risk Reduction (2021). GAR Special Report on Drought 2021. Geneva.
- Mapping Land Surface Emissivity from NDVI: Application to European, African and South American Areas. Remote Sens. Environ.. 1996;57:167-184.
- [CrossRef] [Google Scholar]
- Flood susceptibility mapping on a national scale in Slovakia using the analytical hierarchy process. Water. 2019;11(2):364.
- [CrossRef] [Google Scholar]
- Hydro-meteorological drought assessment under climate change impact over the Vu Gia-Thu Bon river basin, Vietnam. Hydrol. Sci. J.. 2017;62(10):1654-1668.
- [CrossRef] [Google Scholar]
- Multicriteria analysis for flood vulnerable areas in Hadejia-Jama'are River basin, Nigeria. Europ. J. Scient. Res. ISSN.. 2010;42:1450-11216.
- [Google Scholar]


