

Translate this page into:
Grain yield, chlorophyll and protein contents of elite wheat genotypes under drought stress
⁎Corresponding author. ahsanjarid@gamil.com (Ahsan Javed)
-
Received: ,
Accepted: ,
This article was originally published by Elsevier and was migrated to Scientific Scholar after the change of Publisher.
Peer review under responsibility of King Saud University.
Abstract
Background
Drought stress at different growth stages significantly alters growth, yield, and quality traits of wheat. However, great variability exists among genotypes regarding their response to drought stress. Therefore, determining the impacts of drought stress on yield and quality traits would help to select the superior genotypes.
Methods
This study investigated the effects of drought stress on wheat grain yield, chlorophyll, and protein contents. Fourteen (14) recently developed elite bread wheat (Triticum aestivum L.) genotypes were used in this study for evaluation under irrigated (full irrigation) and drought conditions (half of normal irrigation). The data relating to growth, yield and protein contents were recorded.
Results
Significant differences (P ≤ 0.01) were noted among genotypes for all recorded traits. Drought stress significantly reduced the days to 50 % heading, days to 50 % maturity, grain filling, plant height (cm), number of spikes per m2, chlorophyll index (SPAD), peduncle length (cm), number of grains spike-1, thousand grain weight (g) and grain yield (kg ha−1). However, protein contents were increased under drought stress. Correlation analysis showed significant positive association of grain yield with thousand grain weight, number of spikes per m2, spike length, chlorophyll index, grain filling period and number of grains spike-1 under both irrigated and drought stress conditions. The protein contents expressed positive and negative relationship with yield under drought stress and irrigated conditions, respectively. Bioplot analysis revealed that genotype ‘V-19618′ and ‘V-19600′ proved superior under drought conditions regarding grain yield and related traits, while genotype ‘V-19574′ proved better under both irrigated and drought conditions.
Conclusions
These identified genotypes, i.e., ‘V-19618′ and ‘V-19600′ can be utilized in future wheat breeding programs to induce desirable characters for producing drought tolerant wheat genotypes.
Keywords
Climate change
Drought stress
Chlorophyll index
Protein content
Grain yield

1 Introduction
Wheat (Triticum aestivum L.) is considered as major crop among cereals all over the globe. It belongs to family Poaceae with chromosome 2n = 42 (Giraldo et al., 2019). Wheat is considered as an essential part of daily human diet in different geographic regions of the world. Nearly 35 % of the global population consumes wheat as staple food. More than two-third of the global wheat production is used as food, whereas one-fifth is utilized as livestock feed (Grote et al., 2021). Wheat is a vital food source as it provides carbohydrates, fats, protein, fiber, zinc, calcium, and vitamin E etc. (Irge, 2017).
In Pakistan, wheat is cultivated as a major cereal crop, and it contributes 1.6 % towards GDP and 8.9 % share in overall agriculture. During 2020–21 ∼ 27.29 million tons wheat was produced from 9.17 million hectares in Pakistan (GOP, 2019). Globally wheat production was 780 million tons during 2021 (FAO, 2021). Wheat is consumed as staple food in Pakistan (Gul et al., 2021). Recently, wheat production has been greatly affected by climate change around the globe with the increasing unavailability of water resources. Pakistan is ranked in top ten countries which are more vulnerable to climate change (Ahmad et al., 2015). Therefore, the impacts of climate change would be quite significant on crop production in Pakistan (Kamitewoko, 2021).
Climate change is emerging as a significant threat to crop production. As the global population is growing day by day, food security is becoming the major issue of the world and setting a big challenge for the scientist to overcome this problem. Similarly, climate change is creating significant threats to fulfill the consumption demand of wheat under boosting number of population and concomitant urbanization (Anwar et al., 2020). The changing climatic is not only affecting the intensity of rainfall, but also the amount of rainfall per annum. Many areas of the country receiving < 250 mm rainfall annually (Baigal, 2016).
The grain protein concentration of wheat can be greatly influenced by abiotic stresses, which would alter baking quality (Zorb et al., 2018). Drought stress significantly affects the composition of wheat grain, including protein, gliadins, glutenin and fiber (Rakszegi et al., 2019). Wheat grain yield is a complex quantitatively inherited trait. It may be readily affected by biotic and abiotic stresses. About 25 % wheat grain yield can be enhanced by developing stress (biotic and abiotic) tolerant genotypes (Gill et al., 2004). Unfavorable environmental conditions and abiotic stresses negatively affect grain yield, resulting in considerable economic losses (Mahpara et al., 2012). Grain yield can be improved by improving source-sink association (Lawlor and Paul, 2014). Progress in grain yield can be achieved by improving crop varieties with optimum planting time. Several wheat varieties have been developed and introduced in Pakistan; however, new high-yielding cultivars are still needed to combat biotic and abiotic stresses (Sabri et al., 2020). The wheat grain yield can be estimated via its linked characteristics, i.e., number of tillers, 1000-grain weight, spike length, and number of spikelets spike-1 etc. (Li et al., 2020).
The purpose of present study was to evaluate the recently developed wheat genotypes under drought stress for identifying the key traits to aid future screening process for improving grain yield. It was hypothesized that recently developed genotypes will significantly differ in their response to drought stress and stress-free conditions. The genotypes with superior performance under drought stress would be recommended for future breeding programs to develop drought-tolerant genotypes.
2 Materials and Methods
2.1 Experimental site
A field experiment was performed during 2019–20 at Wheat Research Institute (WRI), Faisalabad, Pakistan (31.405286 °N, 73.048130 °E with an elevation of 184 m above sea level). The texture of soil of experimental site was sandy clay loam. The soil characteristics of the experimental site are presented in Fig. 5. The maximum total rain fall was noted during the month of March 2020 which was 143 mm as shown in Fig. 4.
2.2 Experimental design and treatments
A set of 14 genotypes of bread wheat was used in the study to investigate their behavior under irrigated and drought conditions. The variety code and parentage of fourteen genotypes elaborated in Table 1. Randomized complete block design (RCBD) was adopted with three replications in this study. The plot size for each entry was 5 m × 1.62 m (8.1 m2). All the recommended cultural and agronomic practices were adopted. The data relating to days to 50 % heading, days to 50 % maturity, grain filling duration, plant height (cm), number of spikes per m2, chlorophyll index (SPAD), peduncle length (cm), spike length (cm), number of grains spike-1, number of spikelet spike-1, thousand grain weight (g), protein content (%) and grain yield kg ha−1 were recorded.
Code
Genotype
Parentage
Type
V1
V-19503
SHORTENED SR26 TRANSLOCATION//2*WBLL1*2/KKTS/3/BECARD
Adv. line
V2
V-19504
MUTUS*2/KINGBIRD #1/3/KSW/SAUAL//SAUAL
Adv. line
V3
V-19521
WBLL1/KUKUNA//TACUPETO F2001/3/BAJ #1*2/4/BORL14
Adv. line
V4
V-19531
VALK/4/WBLL1*2/BRAMBLING/3/KIRITATI//PBW65/2*SERI.1B/6/WBLL1/4/BOW/NKT//CBRD/3/CBRD/5/WBLL1*2/TUKURU
Adv. line
V5
V-19542
BECARD/FRNCLN//BORL14
Adv. line
V6
V-19550
ATTILA*2/PBW65//PIHA/3/ATTILA/2*PASTOR*2/6/CNO79//PF70354/MUS/3/PASTOR/4/BAV92*2/5/HAR311
Adv. line
V7
V-19554
NELOKI*2//KACHU/KIRITATI
Adv. line
V8
V-19565
FRET2*2/BRAMBLING//BECARD/3/WBLL1*2/BRAMBLING*2/4/BECARD/QUAIU #1
Adv. line
V9
V-19566
INIA CHURRINCHE/KIRITATI*2//KACHU/KINDE
Adv. line
V10
V-19574
IQBAL2000/DHARABI-09
Adv. line
V11
V-19589
MILAN//PRL/2*PASTOR/4/CROC1/AE.SQUARROSA(2 1 3)//PGO/3/BAV92/6/SERI.1B*2/3/KAUZ*2/BOW//KAUZ/5/CNO79//PF70354/MUS
Adv. line
V12
V-19600
BABAX/LR43//BABAX/6/MOR/VEE#5//DUCULA/3/DUCULA/4/MILAN/5/BAU/MILAN/7/SKAUZ/BAV92/8/WBLLI*2/VIVITSI/3/
T.DICOCCOMP194624/AE.SQAdv. line
V13
V-19602
BABAX/LR43//BABAX/6/MOR/VEE#5//DUCULA/3/DUCULA/4/MILAN/5/BAU/MILAN/7/SKAUZ/BAV92/8/WBLLI*2/VIVITSI/3
/T.DICOCCOMP194624/AE.SQAdv. line
V14
V-19618
QUAIU#1/3/T.DICOCCON194625/AE.SQUARROSA(3 7 2)//3*PASTOR /4/QUAIU#2/5/KRITATI//2*PRL/2*PASTOR
Adv. line
2.3 Statistical analysis
The recorded data of all the traits were analyzed using Statistix software (Version 8.1.) The means value of all the treatments were compared using Tukey’s HSD test at 5 % probability level (Steel et al., 1997). Pearson’s correlation was estimated for the identification of best correlated yield trait. Principal component analysis was performed as discussed by Curry et al. (1983) and followed by Abbas et al. (2022).
3 Results and discussion
3.1 Analysis of variance and means comparison of data
Highly significant differences were found among all genotypes for studied traits (Table 2). These significant differences among all traits indicated the presence of great variability that can play a vital role in grain yield enhancement of bread wheat in different breeding programs. The range of coefficient of variance was 0.4 to 4.9 % in irrigated conditions, while 0.7 to 6.4 % in drought conditions. **Significant at P ≤ 0.01; DH = days to 50 % heading, DG = grains filling duration (days), DM = days to 50 % maturity, PH = plant height (cm), NS = number of spike per m2, CC = chlorophyll index (SPAD), PL = peduncle length (cm), SL = spike length (cm), GS = number of grains spike-1, SP = number of spikelets spike-1, GW = 1000 grain weight (g), PC = protein content (%), GY = grain yield (kg ha−1).
SOV
Condition
df
DH
DG
DM
PH
NS
CC
PL
SL
GS
SP
GW
PC
GY
Replications
Irrigated
2
7.1
0.3
6.0
5.8
0.1
0.9
2.5
0.2
7.14
0.2
3.0
0.3
9245.0
Drought
5.8
27.2
7.9
34.6
33.2
10.3
0.6
0.1
2.2
0.1
0.9
0.03
1107.0
Treatments
Irrigated
14
9.3**
6.5**
4.5**
95.2**
4717.5**
7.9**
23.2**
0.6**
47.9**
3.7**
39.8**
0.6**
948202.0**
Drought
9.1**
13.9**
8.9**
163.6**
5341.7**
4.9**
6.3**
0.8**
44.6**
3.3**
65.5**
0.6**
325831.0**
Error
Irrigated
28
0.9
2.7
1.7
4.2
4.9
1.9
0.3
0.1
1.9
0.2
0.4
0.01
5590.0
Drought
2.4
4.6
2.1
3.0
3.6
1.9
0.3
0.01
0.6
0.2
0.2
0.02
2957.0
CV (%)
Irrigated
0.9
4.5
0.9
2.1
0.4
2.8
2.9
4.9
3.4
2.5
1.4
0.5
1.5
Drought
1.4
6.4
1.0
1.9
0.7
2.7
4.2
1.6
2.7
2.9
1.2
1.1
1.9
The response of each bread wheat genotype for all the parameters under study under irrigated and drought conditions is presented in Table 3. In irrigated conditions, days to 50 % heading (DH) ranged from 112.0 to 119.0 days. The genotypes ‘V-19618′, ‘V-19574′ and ‘V-19504′ took lesser number of days for spike appearance compared to the rest of the genotypes included in the study. Under drought conditions, DH ranged from 109.0 to 115.0 days and genotypes ‘V-19600′, ‘V-19589′ and ‘V-19531′ resulted in early heading. Grain filling duration (days) varied from 34 to 39 in irrigated conditions with genotypes ‘V-19550′ and ‘V-19602′ taking lesser days to fill the grain. Grain filling duration (days) ranged from 29.0 to 37.0 days under drought stress with the genotypes ‘V-19550′ and ‘V-19554′ took less days to fill the grain. Significant variability was noted for days to 50 % maturity (DM) under both conditions. The DM varied between 150.0 and 154.0 and 142.0 to 148.0 days under irrigated and drought conditions, respectively. Genotype ‘V-19618′ under irrigated conditions and ‘V-19554′ under drought conditions proved early maturing. Plant height (PH) ranged from 85.0 to 106.0 and 79.0 to 103.0 cm under irrigated and drought conditions, respectively. Genotype ‘V-19600′ was the shortest and ‘V-19602′ was the tallest. Significant variation was found for number of tillers per m2. Number of tillers per m2 ranged from 459.0 to 570.0 and 229.3 to 362.3 under irrigated and drought conditions, respectively. Genotype ‘V-19554′ under irrigated condition and ‘V-19602′ under drought conditions produced the highest number of number of tillers per m2. The chlorophyll index (SPAD) varied from 47.0 to 52.0 and 50.0 to 54.0 in irrigated and drought conditions, respectively. Genotype ‘V-19554′ under irrigated and ‘V-19574′ under drought conditions resulted in the highest chlorophyll index. Under irrigated conditions peduncle length ranged from 14.7 to 23.8 cm and under drought condition it ranged from 11.5 to 16.0 cm. Genotype ‘V-19574′ had the highest peduncle length under both conditions. DH = days to 50 % heading, DG = grains filling duration (days), DM = days to 50 % maturity, PH = plant height (cm), NS = number of spike per m2, CC = chlorophyll index (SPAD), PL = peduncle length (cm), SL = spike length (cm), GS = number of grains spike-1, SP = number of spikelets spike-1, GW = 1000 grain weight (g), PC = protein content (%), GY = grain yield (kg ha−1).
Condition
Genotype
DH
DG
DM
PH
NS
CC
PL
SL
GS
SP
GW
PC
GY
Irrigated
V-19503
114.0CD
38.0AB
152.0ABC
95.0DE
459.0 K
50.0ABC
15.3IJ
6.0CD
39.0D
16.3CD
38.4H
13.4C
4395.0F
V-19504
113.0 DE
37.0ABC
150.0C
101.0BC
496.0 G
49.0BCD
20.0D
5.5EF
38.0D
16.7BCD
42.5D
13.6B
5075.0CD
V-19521
114.0CD
37.0ABC
151.0BC
105.0A
480.0 I
48.0CD
17.3FG
6.6AB
39.0D
17.0ABC
40.5EF
13.0E
4720.0E
V-19531
113.0 DE
39.0A
152.0ABC
98.0CD
524.0 D
50.0ABC
21.0C
5.9CDE
42.0C
15.0E
45.9B
12.7F
5227.0B
V-19542
114.0CD
37.0ABC
151.0BC
103.0AB
490.7H
48.0CD
19.0E
6.1BCD
39.0D
16.3CD
43.9C
13.6B
5007.0D
V-19550
116.0B
34.0D
150.0C
99.0C
460.0 K
50.0ABC
15.8HI
6.9A
44.0BC
16.0D
39.3GH
13.5BC
4625.0E
V-19554
114.0CD
39.0A
153.0AB
93.0E
570.0 A
52.0A
23.8A
6.3ABC
46.0B
16.0D
47.6A
12.5G
5550.0A
V-19565
114.0CD
36.0BCD
150.0C
94.0E
560.0B
51.5A
22.0B
5.7DEF
38.0D
16.3CD
47.9A
13.9A
5537.0A
V-19566
115.0 BC
37.0ABC
152.0ABC
93.0E
489.3H
50.0ABC
18.0F
5.3F
39.0D
15.0E
41.4E
13.6B
4957.0D
V-19574
112.0 E
39.0A
151.0BC
95.0DE
500.0F
51.0AB
20.5CD
5.8CDE
43.0C
17.3AB
44.2C
13.2D
5167.0BC
V-19589
115.0 BC
37.0ABC
152.0ABC
94.0E
470.0 J
49.0BCD
16.7GH
5.8CDE
39.0D
14.3EF
39.8FG
12.7F
4632.0E
V-19600
114.0CD
38.0AB
152.0ABC
85.0F
510.0 E
52.0A
20.9C
5.8CDE
50.0A
17.7A
44.6C
13.2D
5187.0BC
V-19602
119.0 A
35.0CD
154.0A
106.0A
430.0 L
47.0D
14.7 J
5.3F
34.0E
14.0F
36.6I
13.4C
3352.0G
V-19618
112.0 E
38.0AB
150.0C
100.0BC
540.0C
52.0A
21.4BC
5.7DEF
42.0C
15.0E
47.3A
14.0A
5280.0B
Range
112–119
34–39
150–154
85–106
459–570
47–52
14.7–23.8
5.3–6.9
34–50
14–17.7
36.6–47.9
12.5–14
3352–5550
LSD
1.7
2.8
2.2
3.5
3.7
2.3
0.9
0.5
2.3
0.7
1.0
0.1
125.5
Drought
V-19503
113.0ABC
34.0ABCD
147.0AB
90.0D
304.0C
52.0ABC
12.0G
6.3C
28.0F
16.0DE
38.7C
15.1DEF
3231.7B
V-19504
110.0DE
34.0ABCD
144.0CDE
102.0A
290.3E
53.0AB
15.5AB
6.1C
30.3CD
16.7BCD
34.7E
15.3D
2854.0D
V-19521
112.0BCD
32.5BCDE
144.5CD
97.0B
253.0I
51.0BC
15.0BC
5.5GH
24.7H
17.0ABC
28.5 J
15.0EFG
2552.0FG
V-19531
110.0DE
36.0AB
146.0ABC
85.0EF
254.7I
54.0A
14.0DE
5.7FG
26.7G
15.0FG
29.3I
14.8G
2628.0F
V-19542
112.0BCD
32.5BCDE
144.5CD
92.0CD
229.3 J
52.0ABC
14.5CD
5.43H
28.7EF
15.3EF
27.8 K
15.1DEF
2497.7GH
V-19550
114.0AB
29.0E
143.0DE
87.0E
214.3 K
53.0AB
12.0G
5.2I
31.0C
16.3CD
26.4L
14.9FG
2276.3I
V-19554
110.0DE
32.0CDE
142.0E
81.0G
283.0F
53.0AB
12.0G
5.9D
29.0EF
16.0DE
33.6F
15.2DE
2805.0DE
V-19565
112.0BCD
35.0ABC
147.0AB
92.0CD
276.7G
53.0AB
13.0F
5.8EF
24.3H
16.0DE
32.6G
15.8BC
2728.0E
V-19566
112.0BCD
31.0DE
143.0DE
84.0F
262.0H
52.0ABC
11.5G
5.6G
24.3H
14.7FG
30.3H
16.1A
2621.7F
V-19574
111.0CDE
33.5ABCD
144.5CD
86.0EF
347.3B
54.0A
16.0A
6.7B
33.0B
17.3AB
39.5B
15.0EFG
3240.0B
V-19589
110.0DE
36.0AB
146.0ABC
84.0F
280.3F
51.0BC
13.0F
5.9DE
29.7DE
14.7FG
33.3F
14.8G
2765.0DE
V-19600
109.0E
37.0A
146.0ABC
79.0G
294.0D
54.0A
13.5EF
6.2C
35.3A
17.7A
35.8D
15.3D
2965.7C
V-19602
115.0A
33.0BCD
148.0A
103.0A
230.3 J
50.0C
15.0BC
5.4HI
21.0I
14.3G
27.5 K
15.7C
2441.3H
V-19618
110.0DE
35.0ABC
145.0BCD
94.0C
362.3A
54.0A
14.0DE
6.8A
31.0C
15.3EF
40.6A
16.0AB
3416.7A
Range
109–115
29–37
142–148
79–103
229.3–362.3
50–54
11.5–16
5.2–6.8
21–35.3
14.3–17.7
26.4–40.6
14.8–16.1
2276.3–3416.7
LSD
2.6
3.6
2.5
2.9
3.1
2.4
0.9
0.3
1.3
0.8
0.7
0.3
91.3
Spike length varied from 5.3 to 6.9 cm under irrigated conditions and genotype ‘V-19550′ produced the longest spikes. On the other hand, spike length under drought conditions ranged from 5.2 to 6.8 cm and genotype ‘V-19618′ produced the longest spike. Number of grains spike-1 varied from 34.0 to 50.0 and 21 to 35.3 under irrigated and drought conditions, respectively. Genotype ‘19600′ produced the highest number of grains among all genotypes under both irrigated and drought conditions. The number of spikelets per spike-1 varied from 14.0 to 17.7 under irrigated and 14.3 to 17.7 under drought conditions. Under both conditions genotype ‘V-19600′ produced the higehst number of spikelets per spike-1. Under irrigated condition thousand grain weight ranged from 36.6 to 47.9 g, while under drought it ranged from 26.4 to 40.6 g. Genotype ‘V-19565′ under irrigated conditions and ‘V-19618′ under drought conditions produced the heaviest thousand grains. Protein contents ranged from 12.5 to 14.0 % and 14.8 to 16.1 % under irrigated and drought conditions, respectively. Genotypes ‘V-19618′ had the highest protein content under both environments. Grain yield ranged between 3352 and 5550 kg ha−1 under irrigated conditions, while it varied from 2276 to 3416 kg ha−1 under drought conditions. Genotype ‘V-19554′ under irrigated conditions and ‘V-19618′ under drought stress produced the highest grain yield.
Drought stress is a major factor among other environmental stresses which can cause significant yield losses by affecting crop growth and productivity (Pour-Aboughadareh et al., 2019). Generally, drought stress leaves negative effects on physiological and agronomic characters in wheat crop (Qaseem et al., 2019). The mean data (Table 3) of wheat genotypes under irrigated and drought conditions indicated a decline in yield and related traits. Gaju et al. (2009) and Pour-Aboughadareh et al. (2020) also reported similar trend. However, protein contents under both the conditions observed a positive jump under drought stress (Kilic and Yağbasanlar, 2010). Previous studies also discussed reduction in grain yield due to drought stress (Etminan et al., 2019).
3.2 Association between measured traits
The association among recorded traits under both environments was assessed using Pearson’s correlation as adopted by Pour-Aboughadareh et al. (2020). Under drought conditions, grain yield showed highly significant positive correlation with thousand grain weight, number of spikes per m2, and spike length. On the other hand, chlorophyll index, grain filling duration, and number of grains spike-1 showed significant positive relation with grain yield. Baye et al. (2020) also reported positive correlation of grain yield with grain filling period, grains spike-1 and thousand grain weight in wheat. The higher value of chlorophyll index is prediction of good grain yield in wheat (Islam et al., 2014). The non-significant and positive correlation was found among days to 50 % maturity, protein content, peduncle length and spikelets per spike-1 with grain yield under drought condition, while non-significant negative relationship of grain yield was observed with plant height (Fig. 1). Days to 50 % heading expressed significant but negative correlation with grain yield under drought condition. Similar findings have also been explained by Mecha et al. (2017).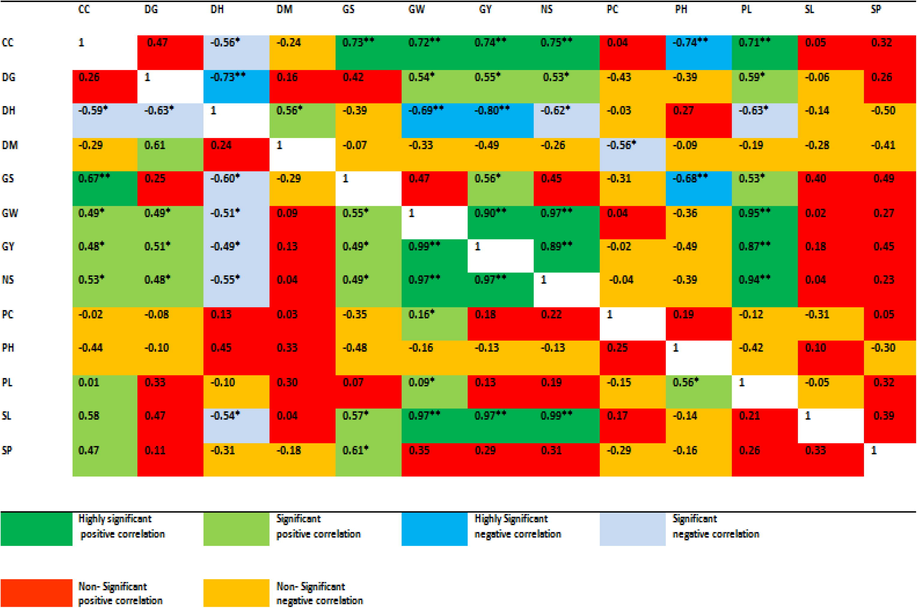
Phenotypic Correlation of wheat genotypes for yield and quality traits in Drought conditions (below diagonal) and Irrigated (above diagonal). CC = chlorophyll index (SPAD), DG = grains filling duration (days), DH = days to 50 % heading, DM = days to 50 % maturity, GS = number of grains spike-1, GW = 1000 grain weight (g), GY = grain yield (kg ha−1), NS = number of spike per m2, PC = protein content (%), PH = plant height (cm), PL = peduncle length (cm), SL = spike length (cm), SP = number of spikelet spike-1,
In irrigated condition the relationship of chlorophyll index, thousand grain weight, number of spikes per m2 and peduncle length had highly significant positive correlation with grain yield, while grain filling period and number of grains spike-1 expressed significant positive correlation with grain yield. Spike length and number of spikelets spike-1 showed non-significant and positive correlation, while days to 50 % maturity, protein contents (%) and plant height showed non-significant but negative relationship with grain yield.
3.3 Principal component analysis
Principal component analysis (PCA) separated the total variance into several factors which are useful for conservation and manipulation of genetic resources and planning for utilization of appropriate germplasms in crop improvement (Zaman et al., 2014). The biplot expressed the association among different measured traits and wheat genotypes. Biplot vectors closer to each-other showed the correlation between those traits and the genotypes close to a specific trait vector represents the best performance of the wheat genotypes for that particular plant trait (Zulkiffal et al., 2018).
The biplot of PCA1 and PCA2 for irrigated (Fig. 2) and drought condition (Fig. 3) indicates the relationships between different indices. Differentiation indices in different groups was found due to PCA1 and PCA2 under both the conditions. The first and second components justified 65.4 % and 62.6 % variation between the criteria under irrigated and drought conditions, respectively.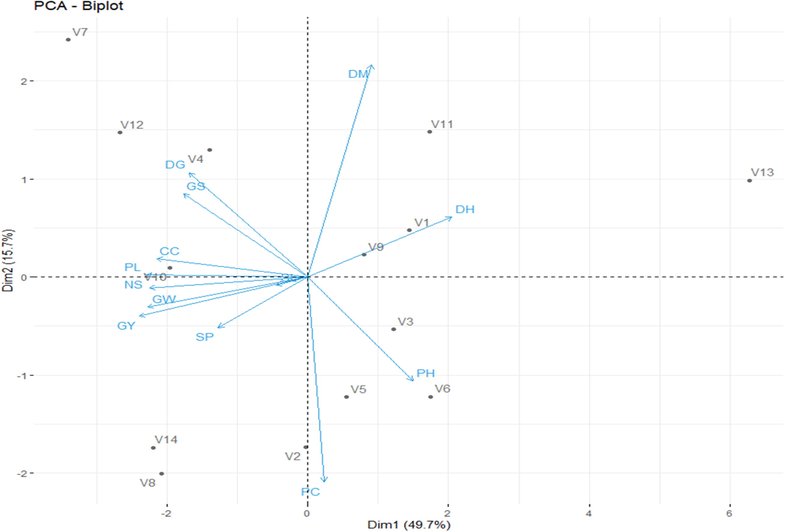
PCA biplot of wheat Genotypes under irrigated conditions. V1 = V-19503, V2 = V-19504, V3 = V-19521, V4 = V-19531, V5 = V-19542, V6 = V-19550, V7 = V-19554, V8 = V-19565, V9 = V-19566, V10 = V-19574, V11 = V-19589, V12 = V-19600, V13 = V-19602, V14 = V-19618.
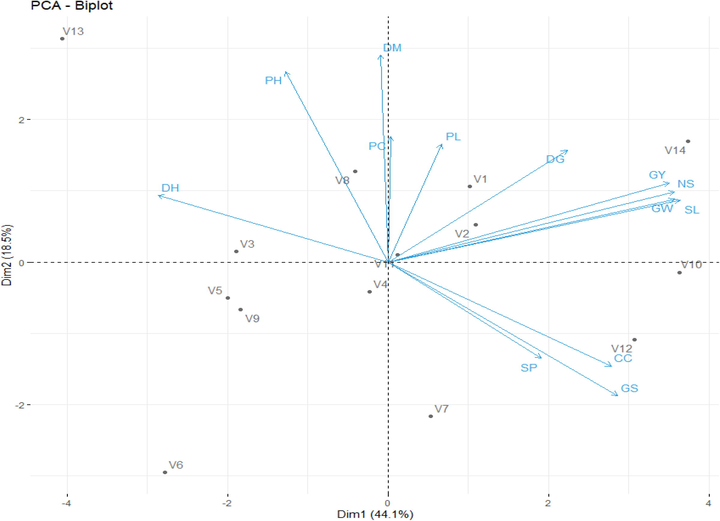
PCA biplot of wheat genotypes under drought conditions. V1 = V-19503, V2 = V-19504, V3 = V-19521, V4 = V-19531, V5 = V-19542, V6 = V-19550, V7 = V-19554, V8 = V-19565, V9 = V-19566, V10 = V-19574, V11 = V-19589, V12 = V-19600, V13 = V-19602, V14 = V-19618.
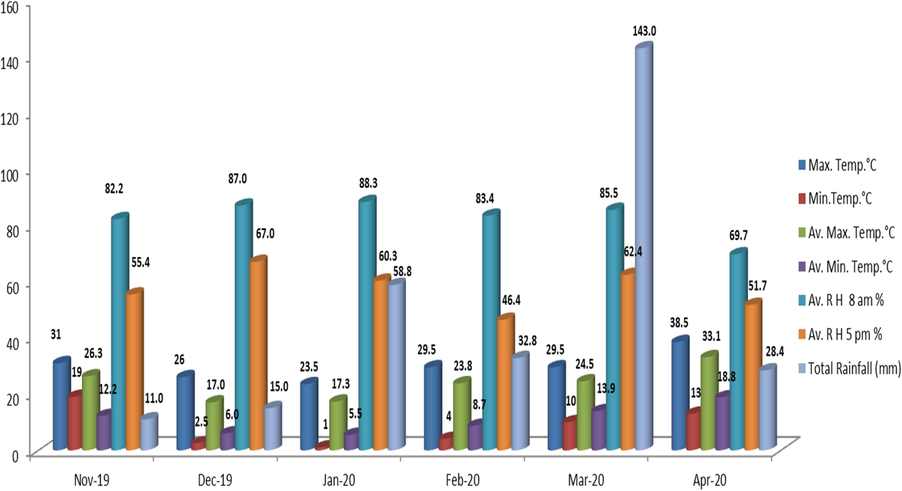
Meteorological data of the experimental site during 2019–20.
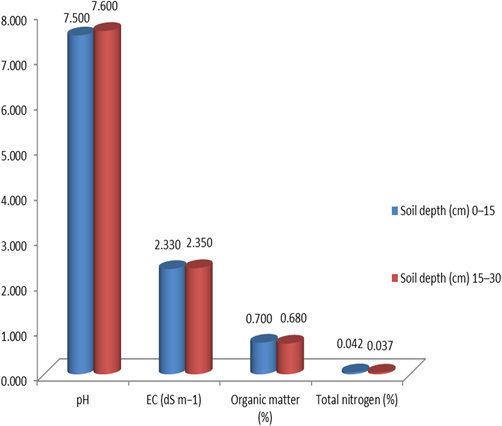
Characteristics of soil of the field trial site.
The PCA biplot under irrigated conditions (Fig. 2) revealed positive association of grain yield with chlorophyll index, thousand grain weight, number of spikes per m2, peduncle length, grain filling duration, number of grains spike-1, spike length (cm) and number of spikelets spike-1. However, plant height (cm), protein contents (%), days to 50 % maturity and 50 % heading expressed negative relationship with grain yield. Genotype ‘V-19574′ proved the best genotype under irrigated conditions regarding grain yield and related traits.
Under drought stress, PCA biplot showed positive relationship of grain yield with thousand grain weight, number of spikes per m2, spike length (cm), chlorophyll index, grain filling period and number of grains spike-1. On the other hand, negative relationship was found regarding days to 50 % heading and 50 % maturity, protein content, peduncle length, and number of spikelets spike-1. Genotypes ‘V-19618′, ‘V-19574′ and ‘V-19600′ proved best genotypes under drought conditions regarding grain yield and related traits.
4 Conclusion
The current findings revealed that wheat genotypes were considerably affected by drought stress for grain yield and morpho-physiological traits. There was notable variation was found in the recorded traits and these genotypes may be considered for wheat breeding programs for drought tolerance. As seen in the current results, positive relationship of thousand grain weight, number of spikes per m2, spike length, chlorophyll index, grain filling duration and number of grains spike-1 with grain yield made the wheat genotypes to perform better in drought stressed environment. The protein content was negatively associated with yield in irrigated conditions but increase in these contents was recorded under drought stress. Among all tested genotypes, ‘V-19574′ proved better under both (irrigated and drought) conditions regarding grain yield and its contributing traits. It can be utilized in drought prone environment for cultivation and to develop drought tolerant varieties.
Acknowledgements
Authors would like to thank Taif University Researchers Supporting Project number (TURSP-2020/64), Taif University, Taif, Saudi Arabia.
Declaration of Competing Interest
The authors declare that they have no known competing financial interests or personal relationships that could have appeared to influence the work reported in this paper.
References
- K. Abbasa, Z. Hussainb, M. Hussaina, F. Rahimc, N. Ashrafd, Q. Khane, G. Razaf, A. Alig, D. M. Khanh, U. Khalilh, N. Irshad. 2022. Statistical modeling for analyzing grain yield of durum wheat under rainfed conditions in Azad Jammu Kashmir, Pakistan. Brazil J. Biol., 2022, vol. 82, e240199 Doi: 10.1590/1519-6984.240199.
- Impact of climate change on the rice–wheat cropping system of Pakistan. In: Rosenzweig C., Hillel D., eds. Handbook of Climate Change and Agroecosystems: The Agricultural Model Intercomparison and Improvement Project Integrated Crop and Economic Assessments. London: Imperial College Press; 2015. p. :219-258.
- [Google Scholar]
- Impact of urbanization and economic growth on CO2 emission: A case of far east Asian countries. Int. J. Environ. Res.. 2020;17:2531.
- [CrossRef] [Google Scholar]
- Birhanu Mecha, Sentayehu Alamerew, Alemayehu Assefa, Ermias Assefa, Dargicho Dutamo. 2017. Correlation and path coefficient studies of yield and yield associated traits in bread wheat (Triticum aestivum L.) Genotypes. Adv. Plants Agric. Res. 2017;6(5):128-136. DOI: 10.15406/apar.2017.06.00226.
- Baigal, P.M., 27 April, 2016. accessed. https://www.thethirdpole.net/en/climate/climate- change-brings-severe-risks-to-northern-pakistan/2016.
- The principal components of auditory target detection. Adv. Psychol.. 1983;10:79-117.
- [CrossRef] [Google Scholar]
- Chemical Composition and Nutritional Quality of Wheat, Teff Eragrostis tef (Zucc) Trotter), Barley (Hordeum vulgare L.) and Rice (Oryza sativa) -A Review. Food Sci. Qual. Manage.. 2017;59:6-11.
- [Google Scholar]
- Determining the best drought tolerance indices using artificial neural network (ANN): Insight into application of intelligent agriculture in agronomy and plant breeding. Cereal Res. Commun.. 2019;47:170-181.
- [Google Scholar]
- Relationships between large-spike phenotype, grain number, and yield potential in spring wheat. Crop Sci.. 2009;49:961-973.
- [Google Scholar]
- Pooled analysis of fluorouracil-based adjuvant therapy for stage II and III colon cancer: who benefits and by how much. J. Clin. Oncol.. 2004;22(10):1797-1806.
- [Google Scholar]
- Worldwide Research Trends on Wheat and Barley: A Bibliometric Comparative Analysis. Agronomy.. 2019;9:1-18.
- [Google Scholar]
- Government of Pakistan. 2019. Economic survey of Pakistan. Statistics of Pakistan.Ministry of National Food Security and Research (Economic Wing), Islamabad.
- Food Security and the Dynamics of Wheat and Maize Value Chains in Africa and Asia. Front. Sustain. Food Syst.. 2021;4(4):617009
- [CrossRef] [Google Scholar]
- How climate change is impacting the major yield crops of Pakistan? an exploration from long-and short-run estimation. Environ. Sci. Pollut. Res. 2021:1-15.
- [Google Scholar]
- Impact of Climate Change on Food Crop Production in Congo Brazzaville. Modern Econ.. 2021;12(11):1686-1702.
- [Google Scholar]
- The effect of drought stress on grain yield, yield components and some quality traits of durum wheat (Triticum turgidum ssp. durum) cultivars. Notulae Botanicae Horti Agrobotanici Cluj-Napoca. 2010;38(1):164-170.
- [Google Scholar]
- Source/sink interactions underpin crop yield: the case for trehalose 6-phosphate/SnRK1 in improvement of wheat. Front. Plant Sci.. 2014;5:418.
- [Google Scholar]
- Characterization of a major quantitative trait locus on the short arm of chromosome 4B for spike number per unit area in common wheat (Triticum aestivum L.) Theor. Appl. Genet.. 2020;133(7):2259-2269.
- [Google Scholar]
- Assessment of genetic distance among wheat genotypes through RAPD markers. Adv. Agric. Bot.. 2012;4:31-35.
- [Google Scholar]
- Alireza Pour-Aboughadareh 1, Reza Mohammadi 2, Alireza Etminan 3, Lia Shooshtari 4, Neda Maleki-Tabrizi 5 and Peter Poczai.2020. Effects of Drought Stress on Some Agronomic and Morpho-Physiological Traits in Durum Wheat Genotypes. Sustainability. 12, 5610; doi:10.3390/su12145610 pp. 1-14.
- Effect of water deficit stress on seedling biomass and physio-chemical characteristics in different species of wheat possessing the D genome. Agronomy. 2019;9:522.
- [Google Scholar]
- Heat and their combination on the growth, yield and physiology of diverse wheat (Triticum aestivum L.) genotypes varying in sensitivity to heat and drought stress. Sci. Rep.. 2019;9:6955.
- [Google Scholar]
- Drought stress affects the protein and dietary fiber content of whole meal wheat flour in wheat/Aegilops addition lines. PLoS ONE. 2019;14(2):1-19.
- [CrossRef] [Google Scholar]
- Assessment of agro-morphologic performance, genetic parameters and clustering pattern of newly developed blast resistant rice lines tested in four environments. Agronomy. 2020;10:1098.
- [Google Scholar]
- Steel, R.G.D.; Torrie, J.H.; Dickey, D.A. Principles and Procedures of Statistics. A Biometrical Approach; McGraw Hill Book Co.: New York, NY, USA, 1997; pp. 400–428.
- Divergence analysis of drought tolerant. Bangladesh Journal of Agriculture Research. 2014;39:385-396.
- [Google Scholar]
- Perspective on wheat yield and quality with reduced nitrogen supply. Trends Plant Sci.. 2018;23:1029-1037.
- [Google Scholar]


