Translate this page into:
Preparation, characterization and physicochemical study of 3-amino propyl trimethoxy silane-modified kaolinite for Pb(II) adsorption
-
Received: ,
Accepted: ,
This article was originally published by Elsevier and was migrated to Scientific Scholar after the change of Publisher.
Peer review under responsibility of King Saud University.
Abstract
Modification of Indonesian kaolinite with 3-amino propyl trimethoxy silane (APTES) was investigated for use as an adsorbent for the removal of Pb(II) from aqueous solutions. This research aimed to evaluate the effect of the amount of APTES on the surface properties and adsorption capability. Characterization of the materials was conducted by X-ray diffraction, Fourier transform-infrared (FT-IR) analysis, gas sorption analysis and scanning electron microscopy (SEM). In addition, the adsorption kinetics were also studied.
The results show that that modification leads to no significant change in the surface profile or crystallinity by the modification, while a higher amount of Pb(II) (from 5 to 140 mg/L) led to an approximately sevenfold increase of adsorption by modified kaolinite compared to raw kaolinite. FTIR analysis suggests the presence of a chemical interaction on the active surface of modified kaolinite. The adsorption obeys pseudo first-order kinetics and was fit to the Dubinin-Radushkevich isotherm model.
Keywords
Adsorption
Isotherm
Kaolinite
Surfactant
1 Introduction
The rapid growth of the chemical industry has led to a significant increase of wastewater and contaminated water. For many common industrial applications, such as for batteries, leather, and electroplating, water contamination by lead ions can potentially result in severe environmental damage. Selective adsorption of heavy metal contamination in aqueous solutions has become an important technique. To find a low cost adsorbent, some natural inorganic solids have been widely used with the aim of improving their adsorption capability via surface modifications (Li et al., 2012; Szala et al., 2015). Currently, multifunctional organic-inorganic hybrids using natural inorganic materials and their utilization for environmental applications, such as toxic metal ion uptake, have attracted significant green chemistry-related interest (Koteja and Matusik, 2015; Li et al., 2012; Sari and Tuzen, 2014). Over the last three decades, among other natural inorganic materials, kaolinite has been widely used as an inorganic support for adsorption applications. Several researchers have investigated the adsorption of metal ions and organic compounds by modified and unmodified kaolinite (Jiang et al., 2010, 2009). Previous studies have reported several hydrophilic modifications of the kaolinite surface (Cavallaro et al., 2012). Organic molecules containing a silane coupling agent have also been reported (Cheng et al., 2012; Koteja and Matusik, 2015; Sari and Tuzen, 2014). Solid surface modification by an organic compound that can potentially bond to metal ions via a complex interaction is one method for preparing a selective adsorbent. The adsorption capability improvement is related to less-reversible interactions within the adsorption mechanism.
In light of the large amount of available kaolinite clay in Indonesia, this research aimed to study surface modification of natural kaolinite with 3-aminopropyl trimethoxysilane(APTES) Pb(II) adsorption from an aqueous solution on its surface. APTES contains N atoms from the ammine functional group, which has Lewis base properties and can potentially bond to a Lewis acid, such as an ion, so that coordination chemical bonding can occur. Based on previous studies that implied that the surface modification is controlled by a preparation parameter, this study investigates the effects of the amount of surface modifier used. This research focused on the effects of the APTES mole ratio on the physicochemical characteristics as well as kinetics of Pb(II) adsorption.
2 Materials and method
2.1 Materials
Kaolinite clay (purity of ∼95%) was obtained from Sukabumi, West Java, Indonesia. The composition of the material is listed in Table 1. Kaolinite powder was first treated by mixing with 0.2 N HCl by stirring for 4 h, followed by mixing several times with distilled-water until the filtrate reached pH 7.0 and was free from Cl− ions. 3-Aminopropyl trimethoxysilane(APTES) was purchased from Aldrich, and Pb acetate was obtained from Merck-Millipore.
Compound
Mass %
Na2O
0.13
MgO
0.60
Al2O3
25.71
SiO2
66.56
CaO
0.27
K2O
6.72
For material characterization, an X-ray diffraction instrument (Shimadzu XRD X6000, Tokyo, Japan) was utilized. Ni-filtered Cu-Kα radiation was used for analysis with a step size of 0.4o/min. For surface analysis, a Quantachrome NOVA 1200e (Singapore) apparatus and scanning electron microscope SEM SEIKO were used. Fourier transform-Infra Red (FTIR) spectra of the materials were obtained using a Nicolet Avatar (New York, US) series instrument.
2.2 Preparation of APTES-Kaos
An APTES solution was slowly added to a suspension of 10 g of kaolinite sample in 100 mL of distilled water and isopropanol (1:1). This suspension was then added to 0.2 M HCl and stirred for 4 h before it was refluxed for 6 h. The mixture was filtered, washed and dried at 80 °C, and the obtained result was designated as APTES-Kao. The mole ratio of APTES to the kaolinite weight was varied at 1, 2, 5 and 10 mmol/g, and the corresponding result was encoded as APTES-Kao-01, APTES-Kao-02, APTES-Kao-05 or APTES-Kao-10, respectively.
The N2 adsorption-desorption experiments were conducted at 77 K. The powder sample was degassed for 12 h at 90 °C before the adsorption measurement. The Brunauer-Emmett-Teller (BET) method was utilized to calculate the specific surface area according to the range of relative pressure p/po 0.03–0.2. The external surface area was calculated using the Dubinin–Radushkevich (D-R) method, while the total pore volume was determined based on the maximum adsorption capacity at the saturation pressure.
2.3 Adsorption studies
Batch adsorption studies were carried out for various Pb(II) solutions, with the initial concentrations ranging from 10 to 150 ppm. A series of lead nitrate solutions was placed in Beaker glasses, and 0.5 g of the adsorbent was added to each flask for varied adsorption times. For a certain adsorption time, the mixture was filtered and the filtrate was analyzed for Pb(II) AAS. The analysis was performed by using Perkin Elmer instrument and calibration method using Pb certified reference material (Perkin Elmer, New York, US). The same conditions were used for variations of the adsorbent, temperature and pH.
3 Results and discussion
3.1 Material structure
The APTES structure is presented in Fig. 1. The change of FT-IR spectra data of materials are tabulated in Table 2 correspond to FT-IR spectra of APTES-Kaos (Fig. 2). From kaolinite spectra, Al—O—Si and Si—O—Si bending vibrations were observed at 536.01 and 471.18 cm−1, respectively. The peak at 913.26 cm−1 was assigned to the bending vibration of the inner surface hydroxyl groups. Water between the kaolinite interlayer is shown by a peak at 1638.43 cm−1, which had a bending vibration at 1638.39 cm−1. The 1032.55 cm−1 peak was attributed to the stretching mode of the apical Si—O. The peaks at approximately 3620 cm−1 was attributed to the stretching vibrations of the inner-surface Al OH groups. The peak at 2390 cm−1 corresponded to the stretching vibration of silane Si-O. According to the APTES structure, the new peak at approximately 1380 cm−1 was due to methyl groups from the APTES structure; the new peak at 1557.80 cm−1 was attributed to N–H bending, and the peak at approximately 3451 cm−1 was attributed to the N–H stretching vibration.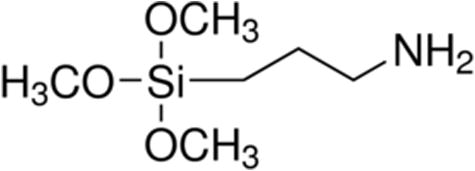
Structure of APTES.
APTES-Kao-10
APTES-Kao-05
APTES-Kao-03
APTES-Kao-01
Kaolinite
Identification
470.69
470.83
471.75
471.18
Si—O—Si bending
535.91
536.18
535.91
536.48
536.01
Al—O—Si bending
–
–
693.71
693.53
693.32
Interaction to other metal
–
–
796.80
794.81
796.33
Interaction to other metal
913.26
913.18
916.26
914.30
913.86
Inner surface Al-OH deformation
1032.52
1032.66
Si-O planar stretching
1384.12
1383.97
1384.12
CH3-R symmetric bending
1557.82
1557.80
N–H stretching
1637.00
1637.18
1637.97
1637.97
1638.43
Si—O stretching
1032.03
1032.55
Si—O stretching
2339.97
2340.33
–
CH3-R symmetric stretching
–
2923.66
-
CH3-R asymmetric stretching
3458.58
3451.08
–
3451.62
3461.62
H-O-H stretching
3458.68
3695.86
3696.96
3696.86
Inner layer OH (Al-O-H) stretching
3620.24
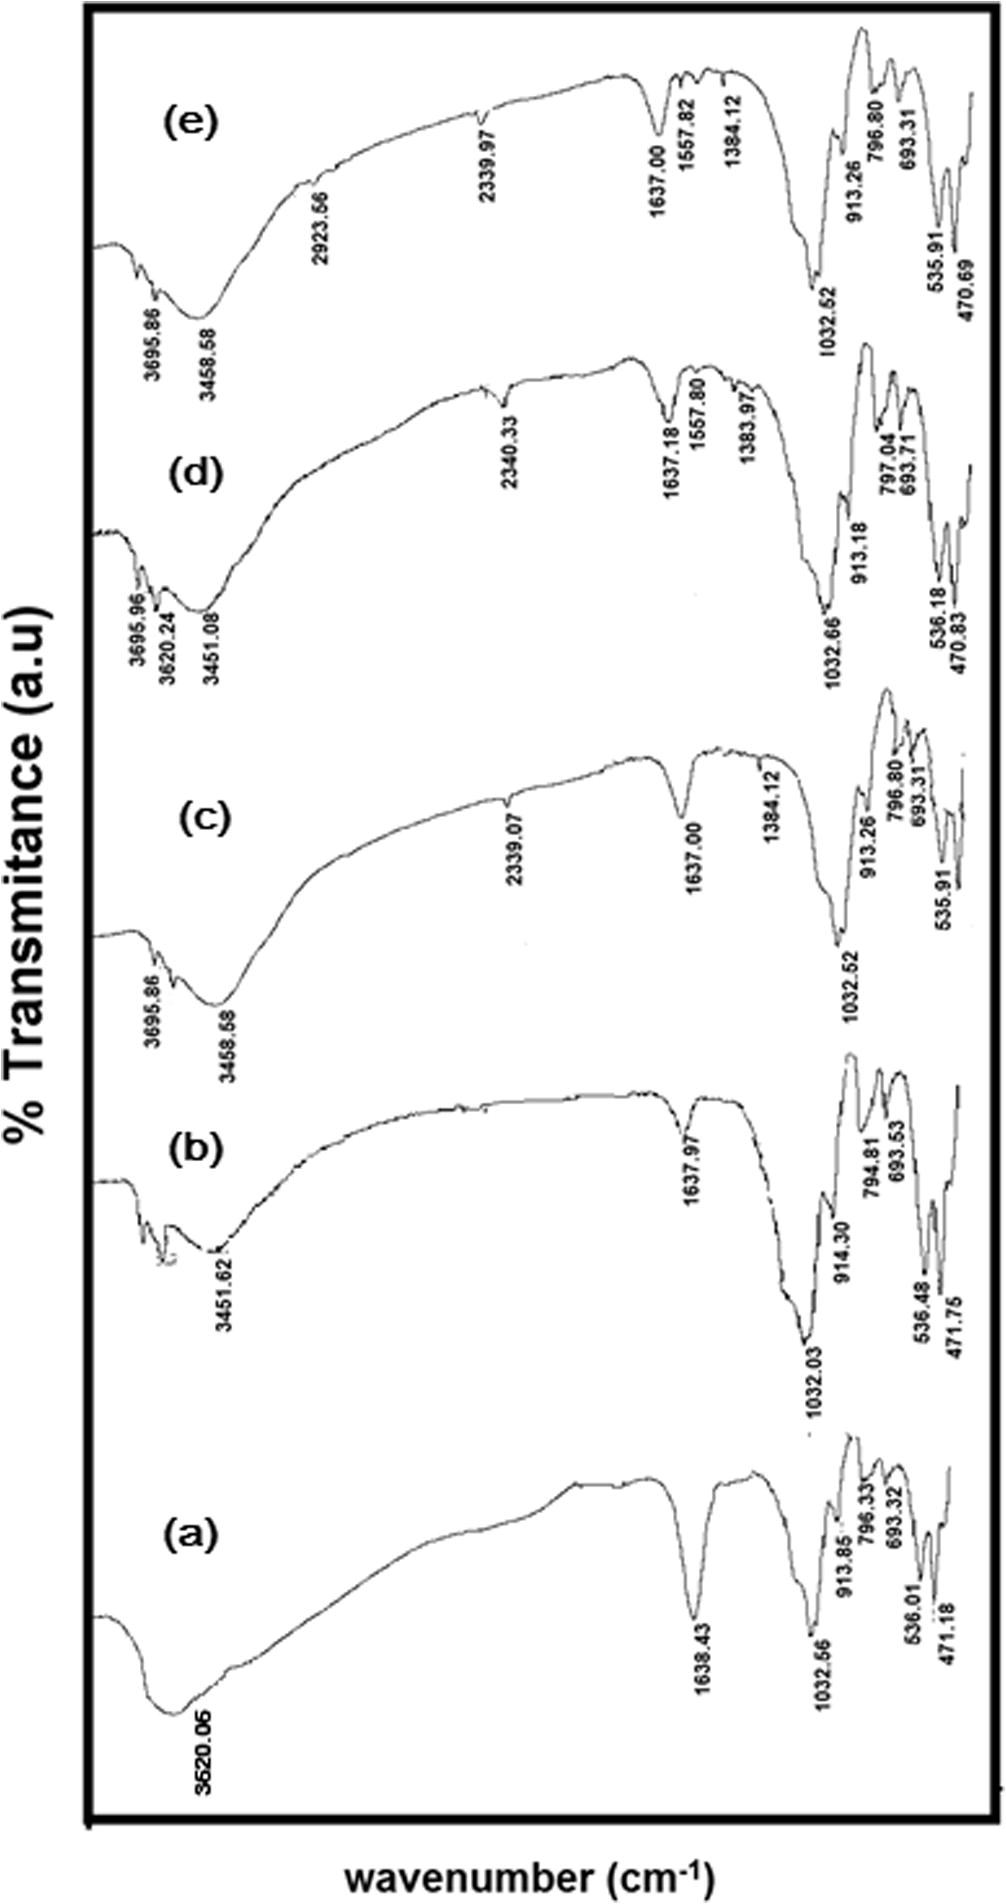
FTIR spectra of (a) Kaolinite (b) APTES-Kao-01 (c) APTES-Kao-03 (d) APTES-Kao-05 and (e) APTES-Kao-10.
The XRD patterns of the samples are given in Fig. 3, showing that kaolinite was the major clay mineral in the raw sample together with quartz as a non-clay contaminant mineral (Jiang et al., 2009). Overall, the XRD patterns showed no significant difference between raw and APTES-modified kaolinite. Examination of Fig. 3 shows that only APTES-Kao-01 exhibited significant increasing d001 values, from 9.921 Å to 9.989 Å, compared to kaolinite, while a change was not observed in the other samples. The data indicate that APTES was incorporated into the layers at a small mole ratio with a small cation exchange capacity (CEC) value and covered the surface kaolinite. The trend of the surfactant covering the kaolinite structure was similar an observation of a kaolinite modification with hexadecyl trimethyl ammonium (HDTMA) (Jin et al., 2014). The relatively unchanged structure was also described by the surface morphology of the modified and unmodified kaolin examined by scanning electron microscopy (SEM). As shown in Fig. 4, the shape of the unmodified kaolin appears to be a sheet and is maintained after modification. Consequently, the surface parameters, such as the specific surface area, pore volume and pore radius of the materials, also changed insignificantly (Fig. 5 and Table 3). The BET surface area and Langmuir surface area of the materials had relatively the same values for unmodified and modified kaolinite. However, it is noted that APTES-Kao-02 exhibits the highest external surface area.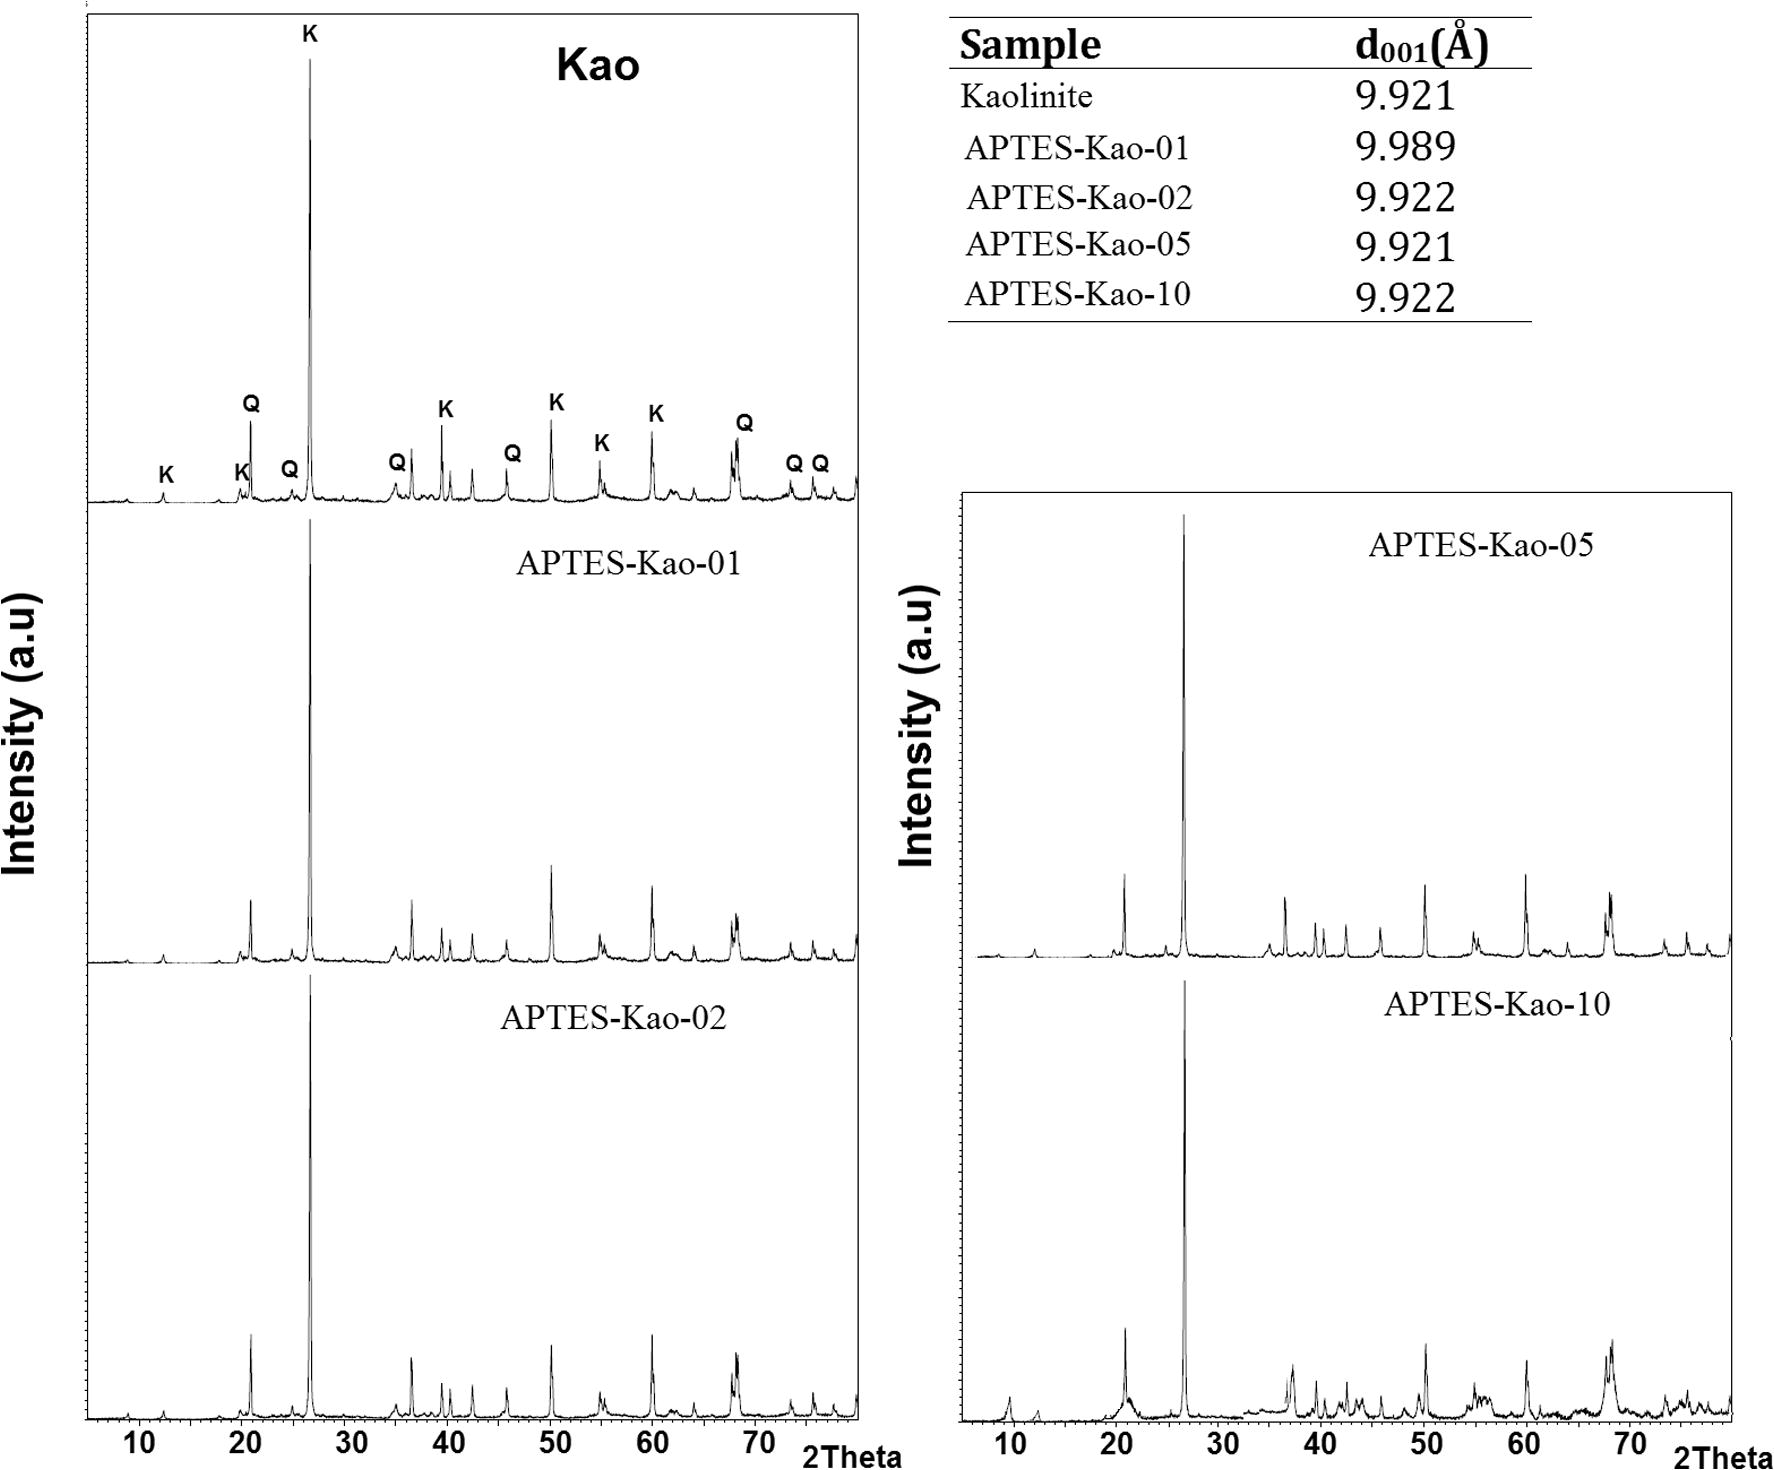
XRD pattern of materials.
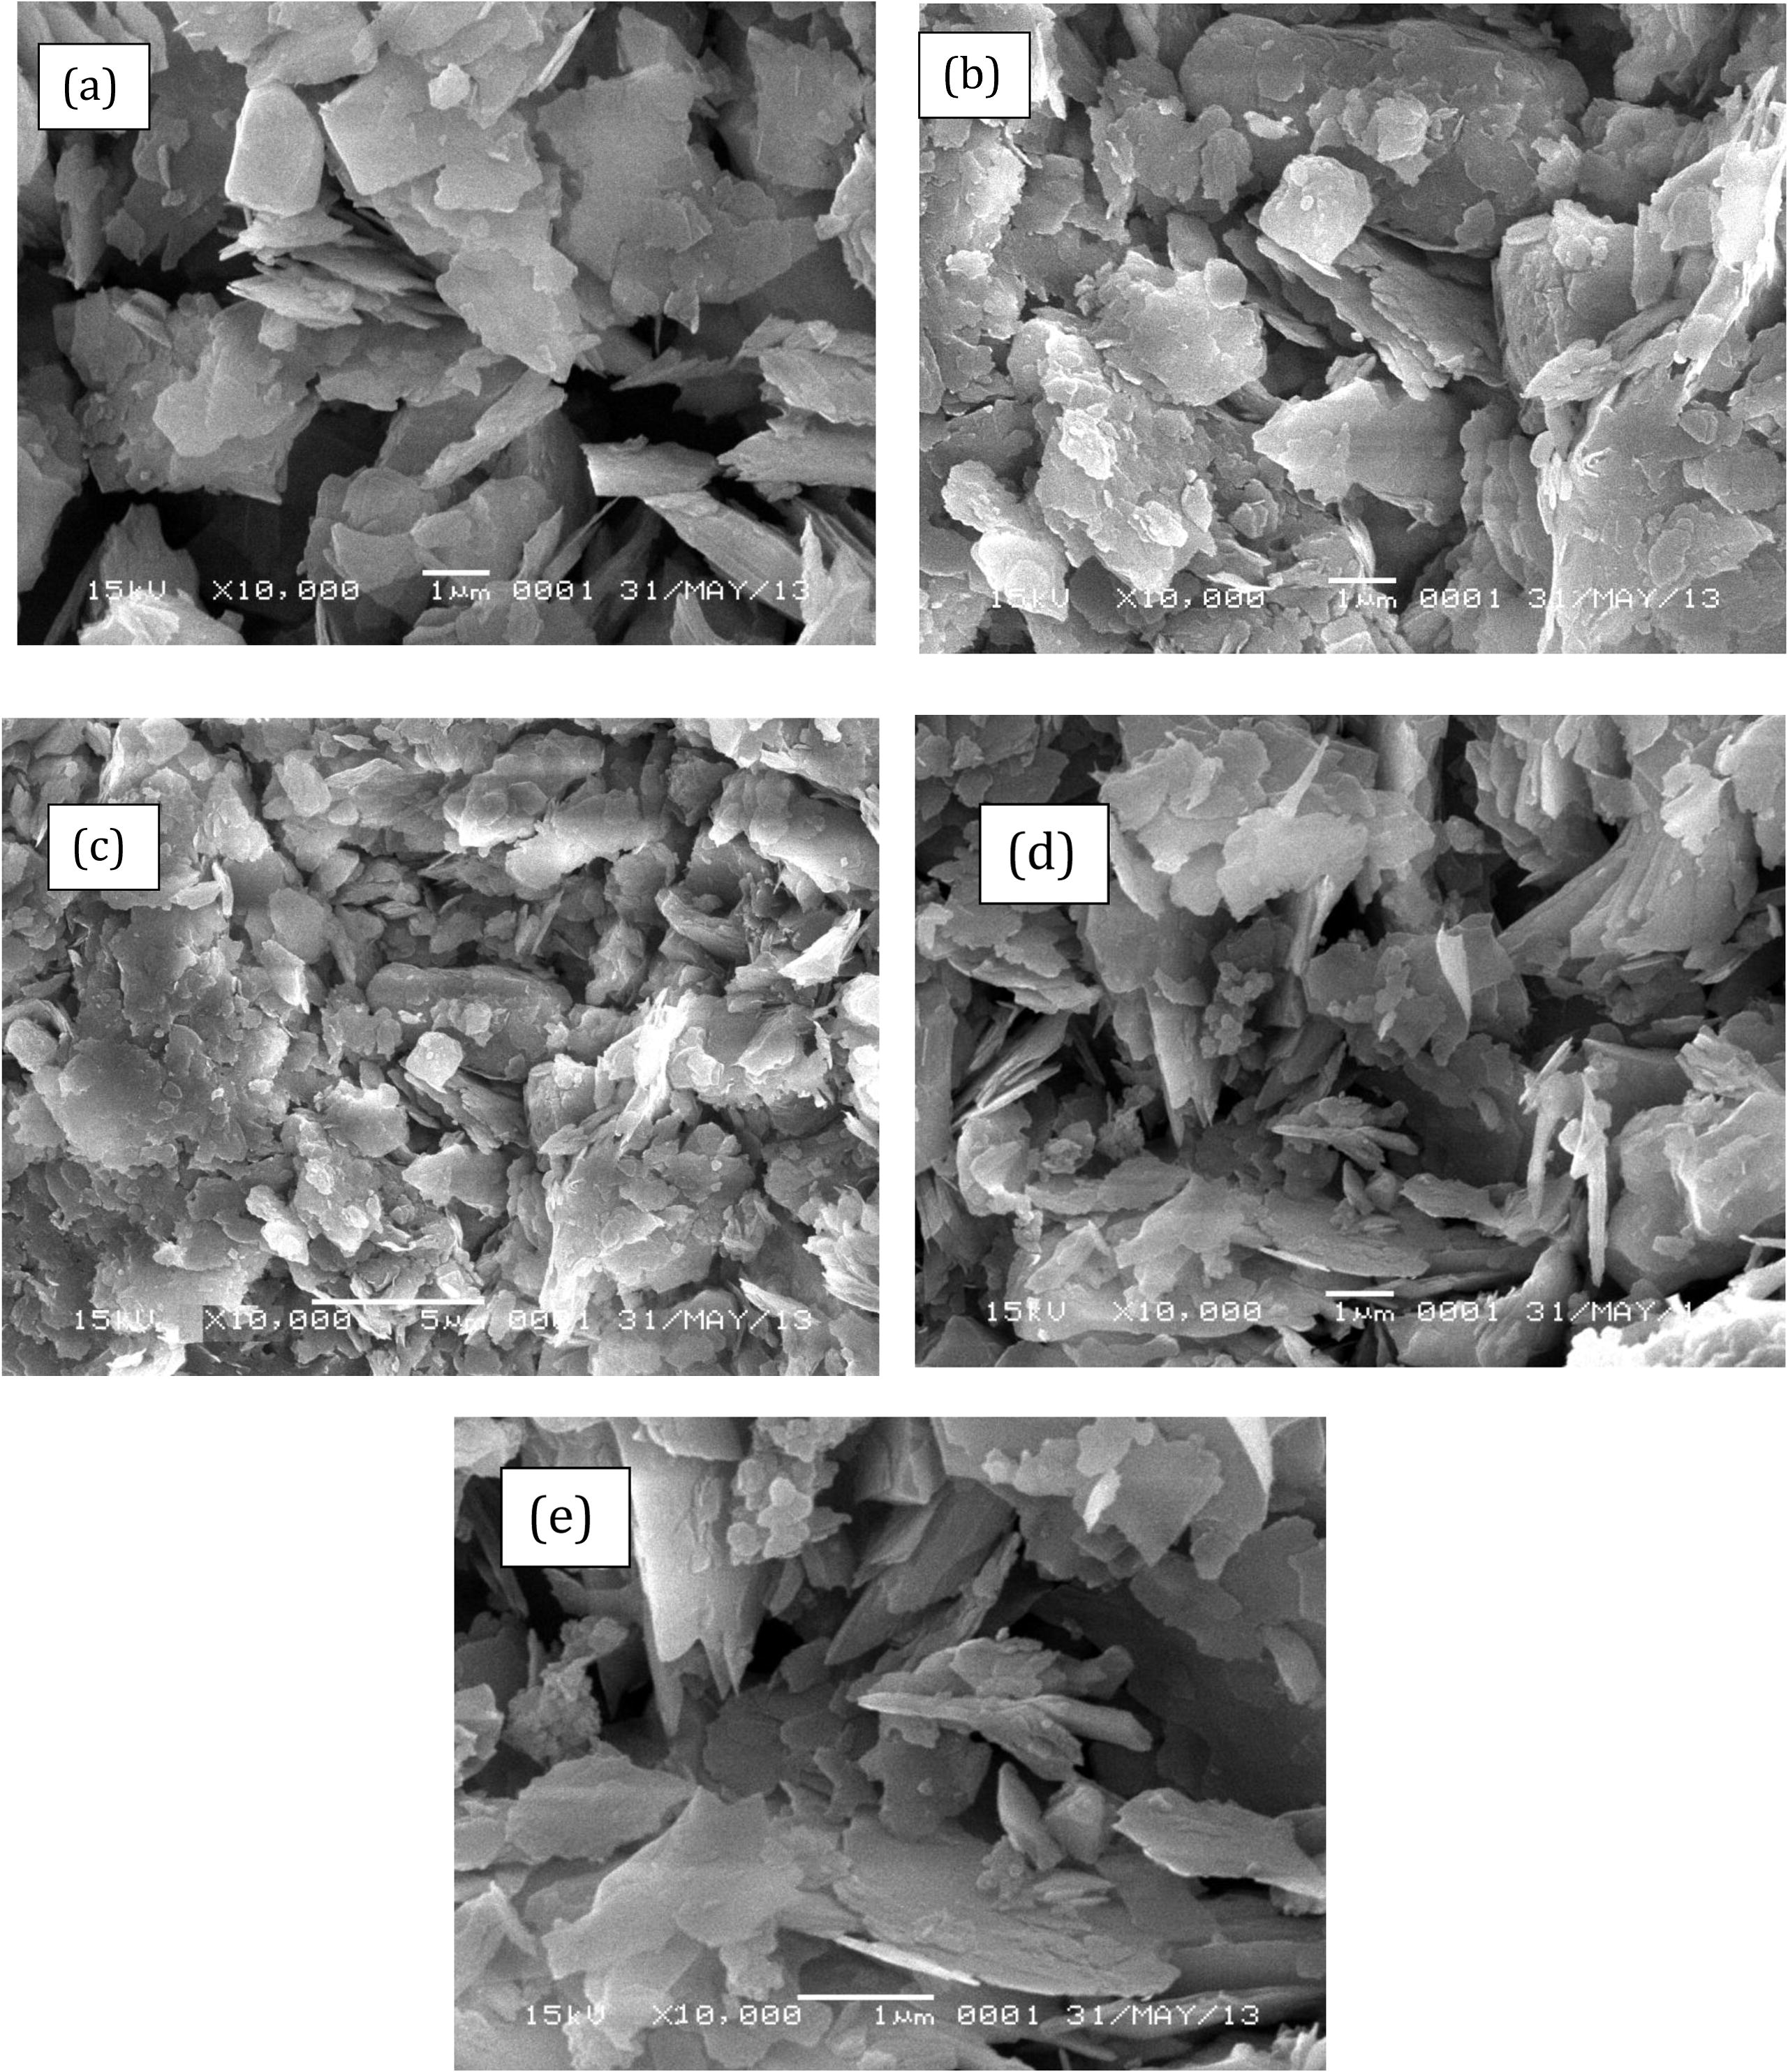
SEM Profile of (a) Kaolinite (b) APTES-Kao-01 (c) APTES-Kao-03 (d) APTES-Kao-05 and (e) APTES-Kao-10.
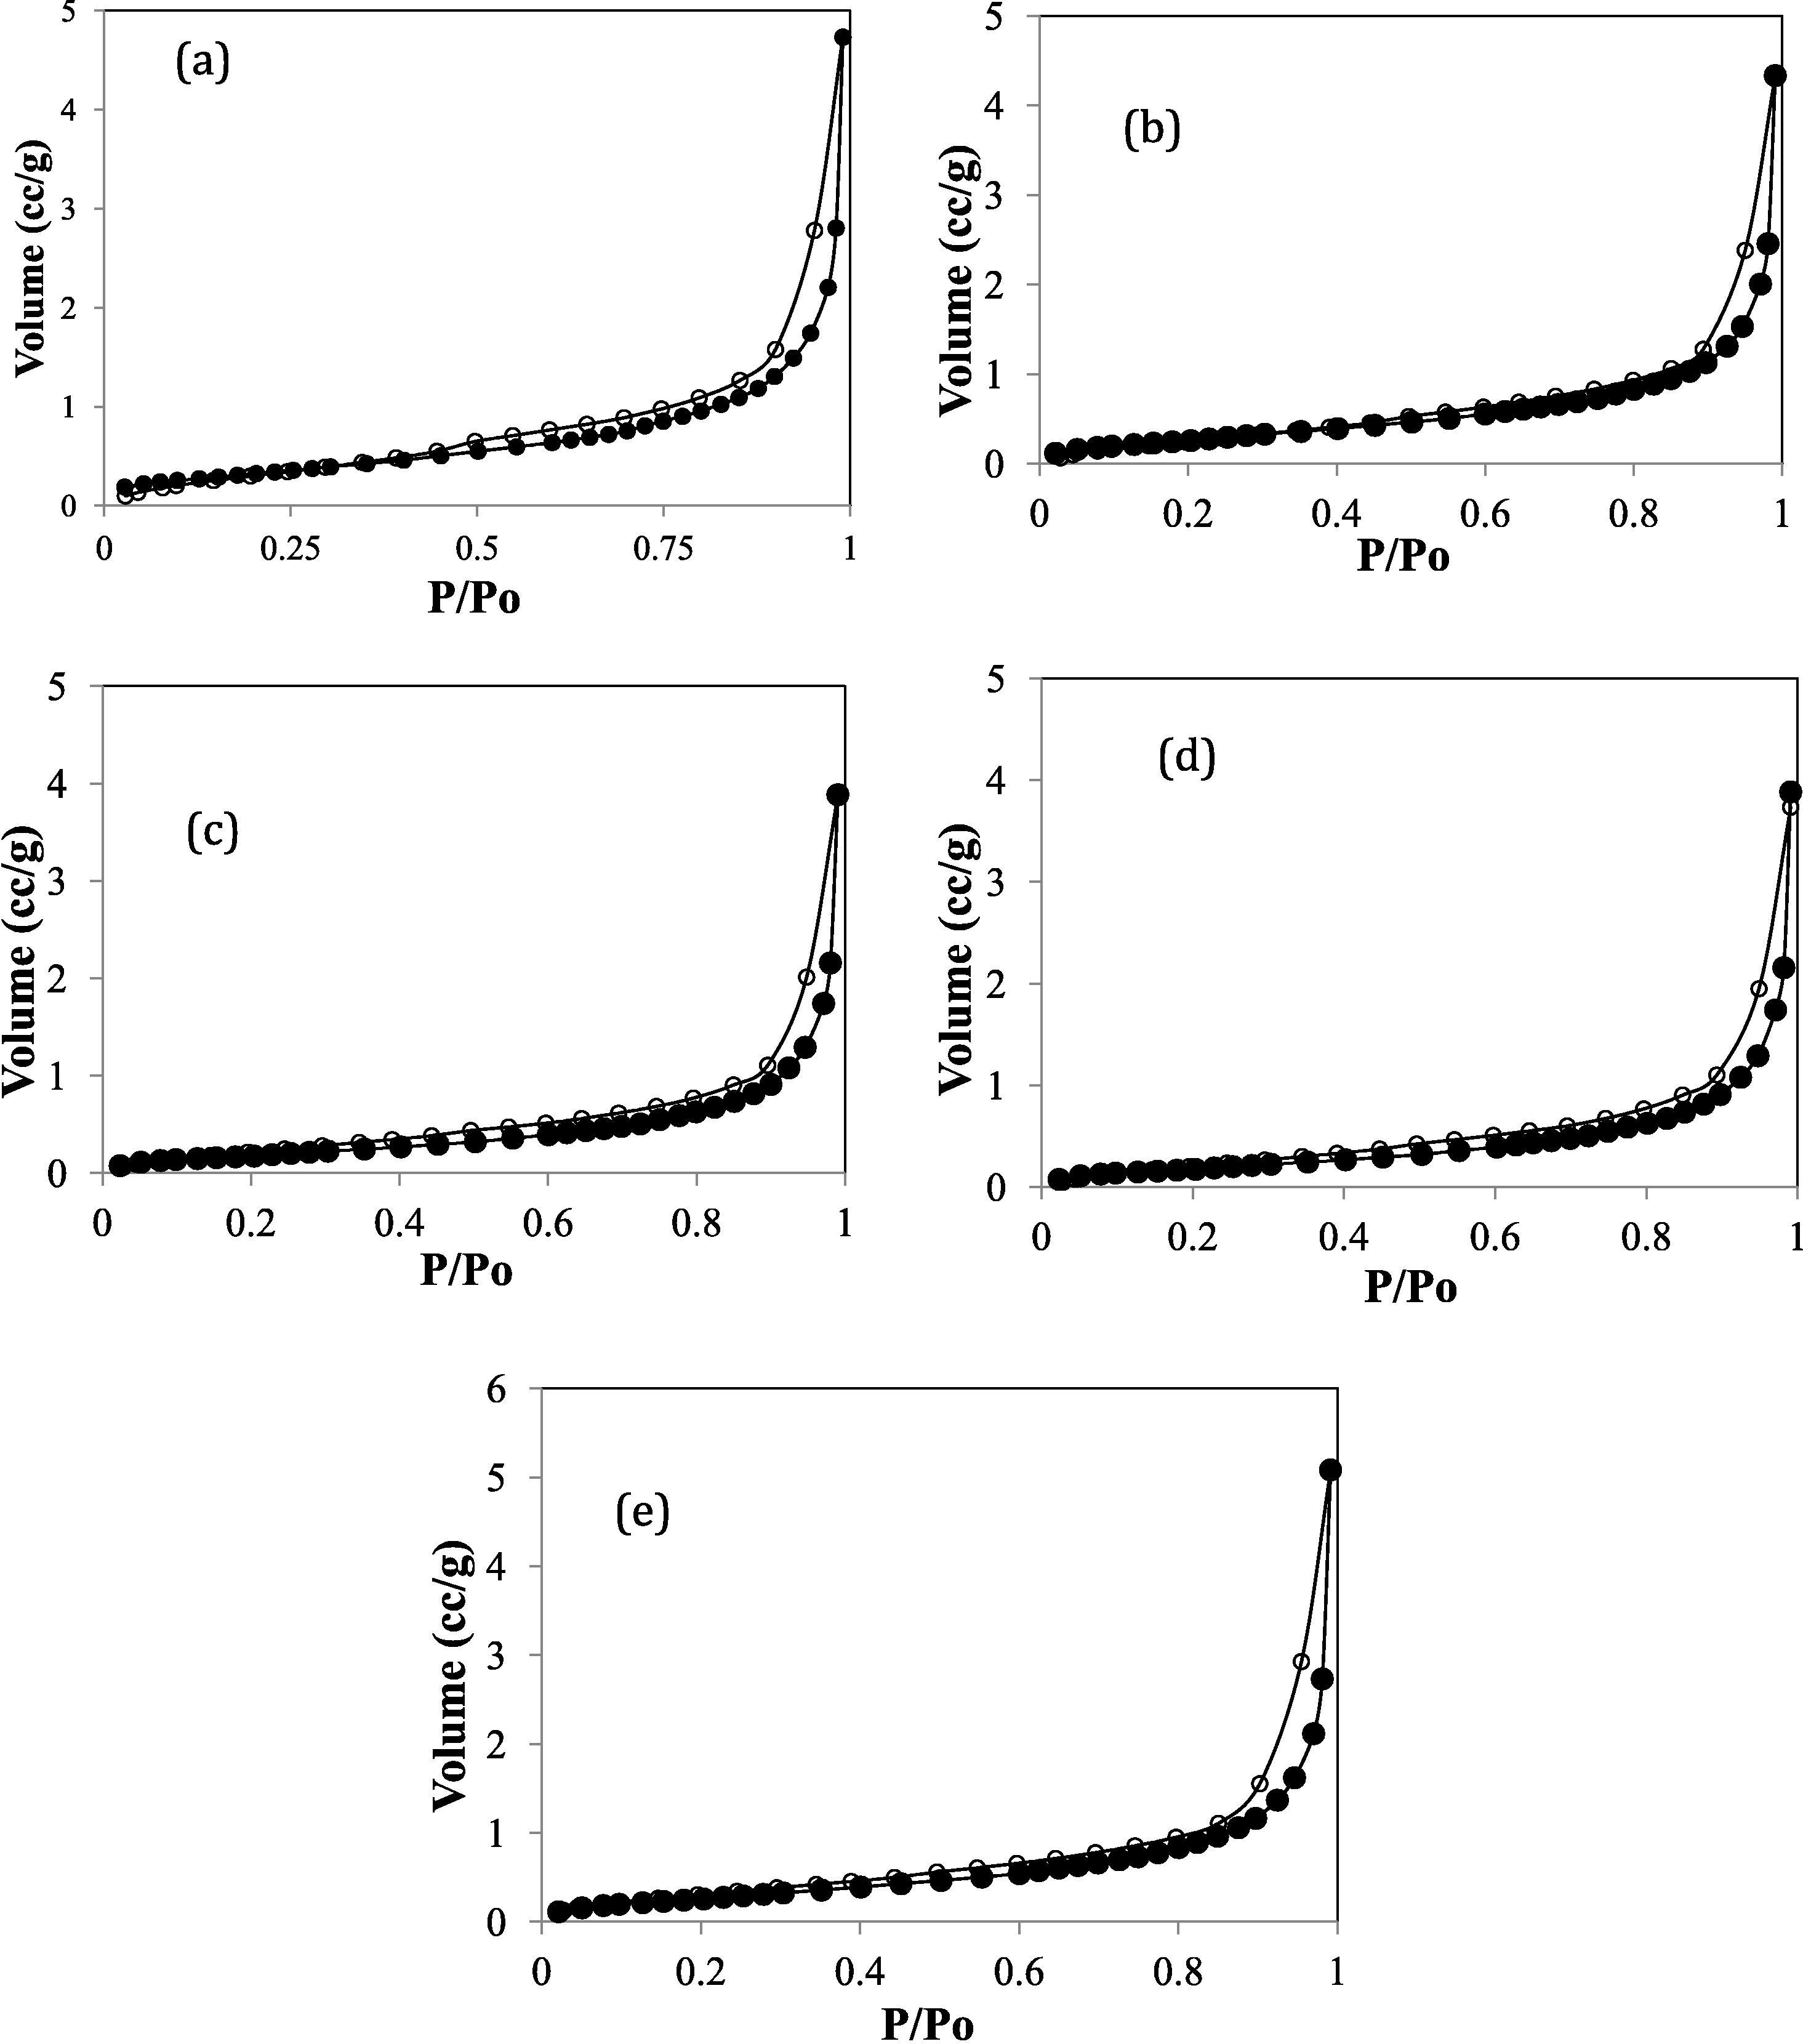
Adsorption-desorption profile of (a) Kaolinite (b) APTES-Kao-01 (c) APTES-Kao-03 (d) APTES-Kao-05 and (e) APTES-Kao-10.
Sample
BET surface area
Langmuir Surface area
External Surface area
Pore radius (nm)
Total Pore Volume
Kaolinite
11.303
12.43929
2.963093
11.82
4.679 × 10⁻²
APTES-Kao-01
10.011
11.93394
4.998437
16.56
6.300 × 10⁻²
APTES-Kao-02
6.486
11.87563
4.213214
12.59
5.370 × 10⁻²
APTES-Kao-05
7.954
10.69001
4.828962
13.73
5.461 × 10⁻²
APTES-Kao-10
10.261
11.91351
4.965315
15.94
7.663 × 10⁻²
3.2 Adsorption study
3.2.1 Adsorption kinetics
The kinetics of Pb(II) adsorption by varied adsorbents are presented in Fig. 6. The results of simulations of the kinetics data are presented in Table 4, and based on these data, it can be concluded that the adsorption rate of APTES-kaolinites is higher than that of kaolinite. All adsorbents, except for APTES-Kao-10, fit Lagergren’s pseudo first-order adsorption (Eq. (1)) kinetics rather than second-order (Eq. (2)) adsorption kinetics, as indicated by the higher determination data of the pseudo first-order data simulation.
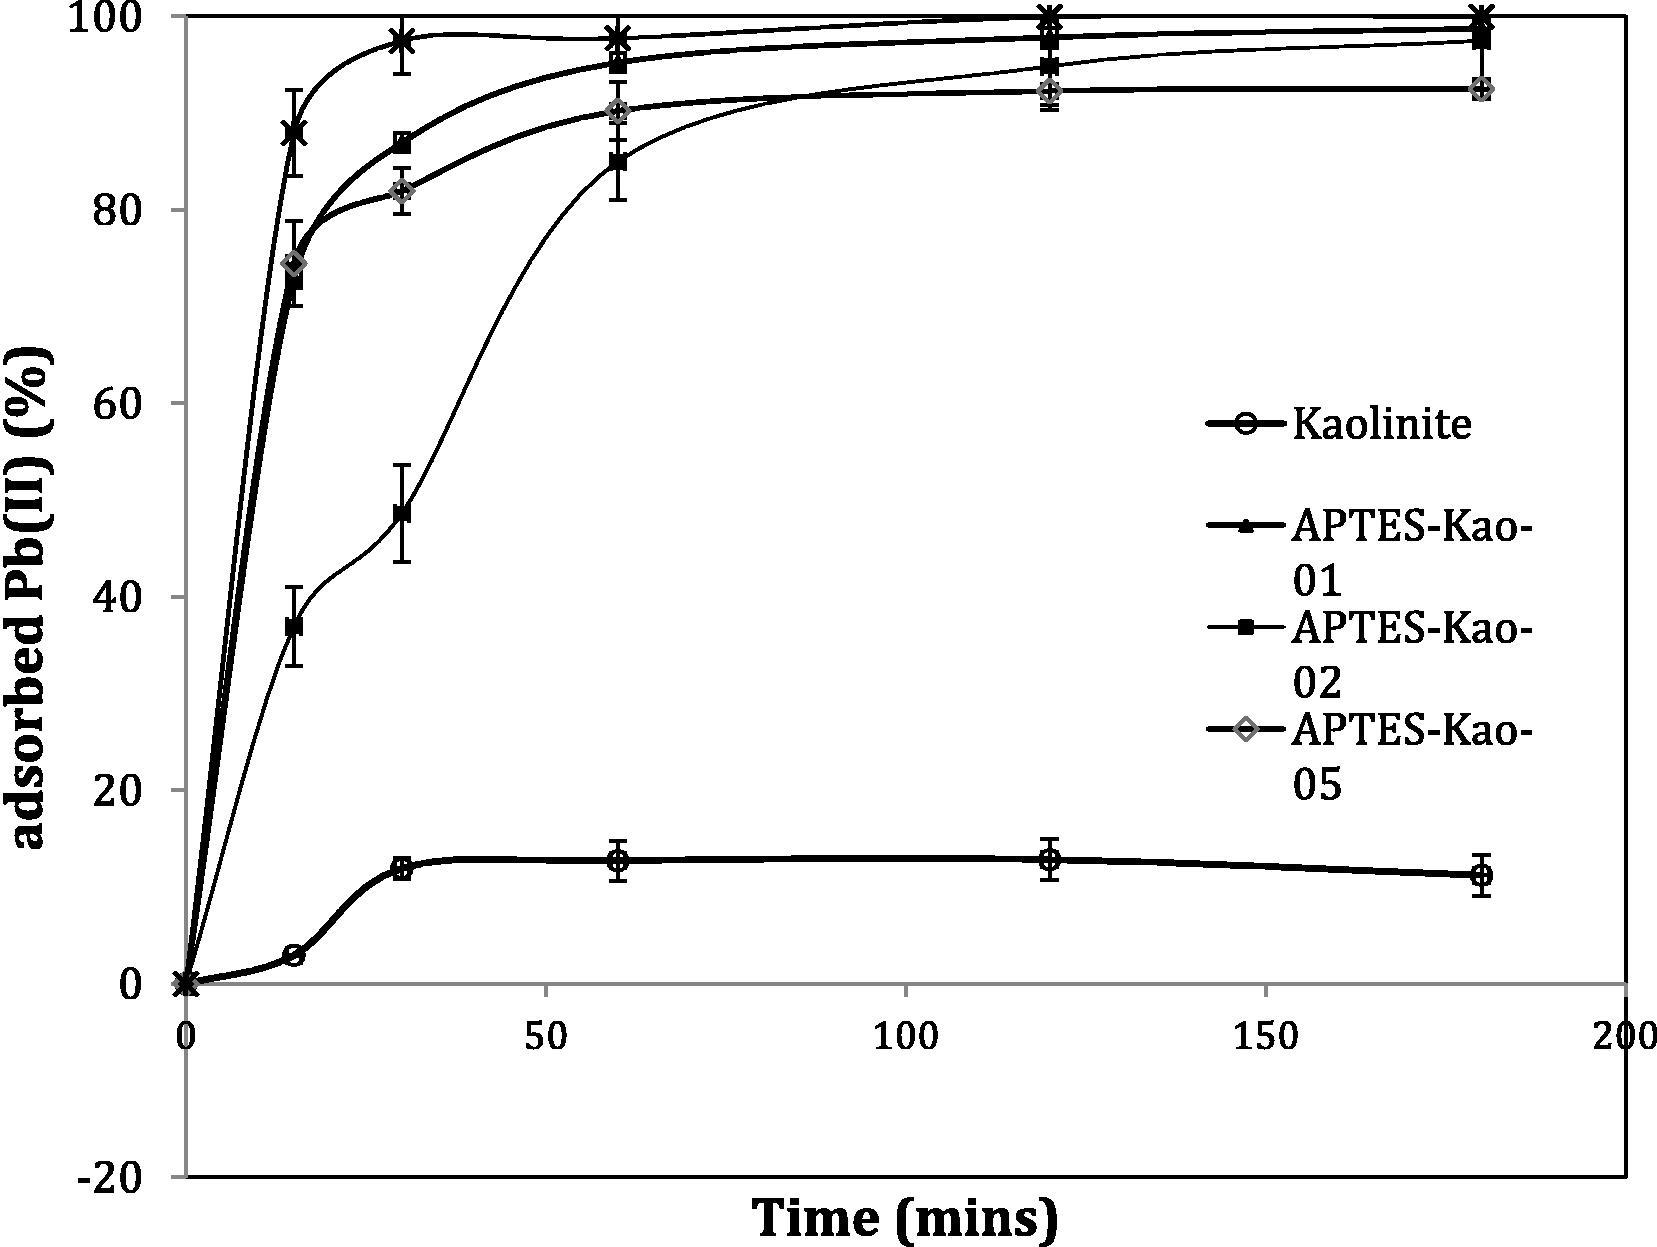
Kinetics curve of Pb(II) adsorption over materials.
Sample
Initial rate (mg/Lmin)*
Qe (mg/g)
Qe (mg/m2)
1st order simulation
2nd order simulation
R2
k
R2
Kaolinite
0.339
2.58
0.228258
0.7807
2.420 × 10⁻³
0.7672
APTES-Kao-01
3.623
19.49
1.946858
0.9319
9.32 × 10⁻²
0.9947
APTES-Kao-02
1.643
18.02
2.778292
0.9999
6.689 × 10⁻²
0.9196
APTES-Kao-05
2.406
18.32
2.303244
0.9822
8.806 × 10⁻²
0.9767
APTES-Kao-10
6.080
19.99
1.948153
0.7719
9.605 × 10⁻²
0.7711
The fitness of the pseudo first-order adsorption indicates that the adsorption is strongly affected by the concentration of metal ions in solution and the significant chemical interaction within the adsorption mechanism. The value of APTES-Kao-10 is low due to the very fast initial rate of adsorption compared those of the other materials. By varying the mole ratio, the adsorption rate order is as follows: APTES-Kao-10 > APTES-Kao-01 > APTES-Kao-05 > APTES-Kao-02 > kaolinite. APTES-modified kaolinite exhibited an increasing adsorption capacity (Qe) compared to kaolinite because of surface property changes as presented by either Qe in mg/g or in mg/m2, which have the potential to lead to chemical interactions during adsorption. The higher adsorption capacity of APTES-Kao-1 appears to correlate with the surface profile data in that the material has a higher BET surface area, Langmuir surface area and external surface area as well as a larger pore radius and pore volume compared to APTES-Kao-05 and APTES-Kao-02. The larger surface may lead to more surface interactions with the ions from solution. However, compared to APTES-Kao-10, the data are not linear, except for the pore volume, and these APTES-Kao-10 parameters are lower than those of APTES-Kao-01, but had the highest adsorption rate. These data may occur because of the large amount of APTES anchored to the kaolinite surface, which led to more interaction between APTES and Pb(II) ions.
To prove that there was chemical interaction between Pb(II) and modified kaolinite, the FTIR spectra of APTES-Kao-10 before and after adsorption were compared (Fig. 7).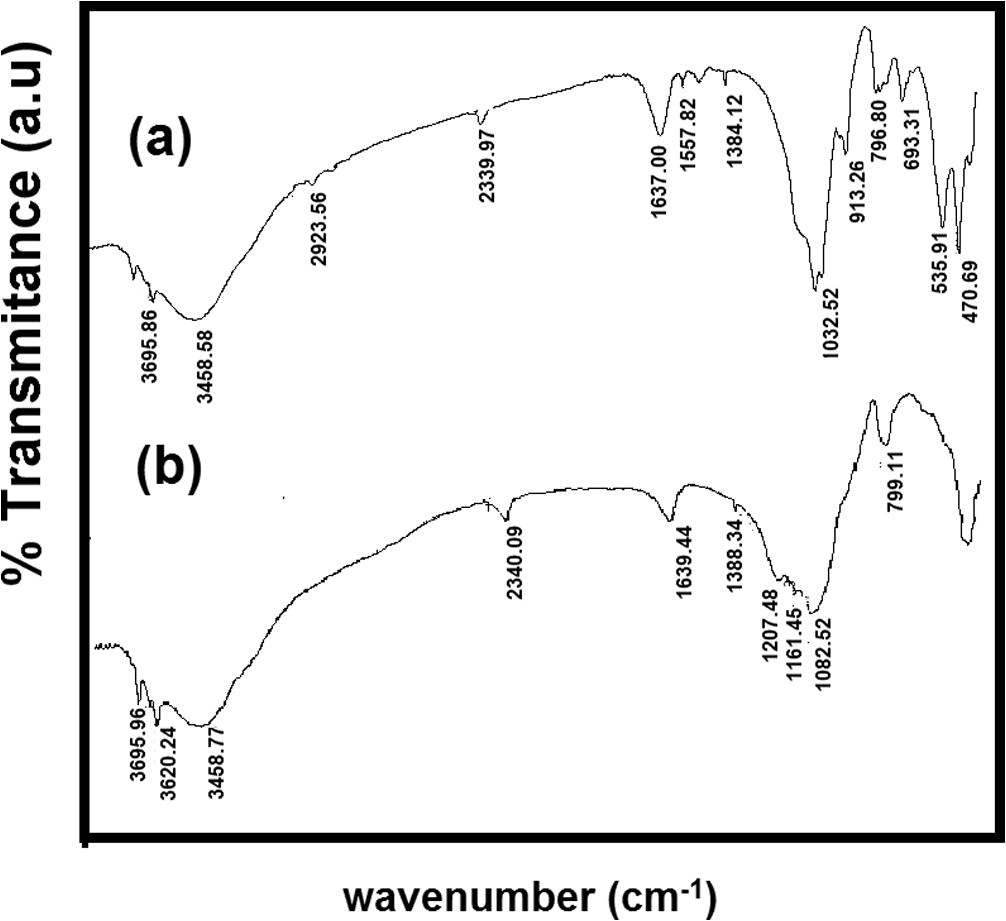
FTIR spectra of APTES-Kao-10 (a) before adsorption (b) after adsorption.
The peak at 1557.82 cm−1, corresponding to N–H, disappeared after adsorption, which is an indication of the interaction between N and Pb(II) ions through the coordination interaction. This assumption is also supported by new peaks at 1161.45 cm−1 and 1207 cm−1, which were due to Pb(II), as well as shifts of other absorption peaks at higher wavenumbers, i.e., from 1032.52 cm−1 to 1082.52 cm−1. The shift of the wavenumber to a greater value is due to the higher energy caused by the bonded Pb ions on the surface.
To evaluate the adsorption capacity of the adsorbents, simulations of the adsorption isotherm models were used (Table 5). From adsorption experiments with the adsorbent and by varying the initial concentration from 5 ppm to 140 ppm, the Langmuir, Freundlich and Dubinin–Radushkevich (D–R) isotherm models were implemented for the obtained data. The linear equation of the Langmuir model is as follows:
Sample
Langmuir Isotherm
Freundlich Isotherm
Dubinin-Radushkevich isotherm
R2
RL
R2
KF
R2
E
qD
Kaolinite
0.8925
9.29 × 10⁻³
0.5635
2.6919
0.97367
0.5154
7.303
APTES-Kao-01
0.9513
9.77 × 10⁻¹
0.9147
13.0891
0.96761
0.5647
3.686
APTES-Kao-02
0.9999
1.0034
0.8608
39.4399
0.9999
0.6763
1.950
APTES-Kao-05
0.9914
1.0047
0.9553
19.1913
0.99493
0.5927
6.313
APTES-Kao-10
0.9465
1.0165
0.9225
55.7951
0.99946
0.6638
1.900
The linear form of the Freundlich isotherm is:
The data obtained by the D-R isotherm simulation show the good fit of the isotherm to the experimental data for all modified samples, which means that the Langmuir isotherm is not favorable for modified kaolinite from a mole ratio of 2 to 10 mmol/gram based on RL values > 1.0, while it is suitable for kaolinite and the APTES-Kao-01 sample. This suggests that the surfaces of both samples are relatively homogeneous compared to those of the other materials. Moreover, the D-R isotherm data confirmed the more feasible interpretation that multilayer and heterogeneous surface interactions occurred during adsorption (Başçetin and Atun, 2010; Senthil Kumar and Gayathri, 2009; Xu et al., 2013). The adsorption free energy data are also in line with the initial rate data, showing that APTES-Kao-10 reaches the highest rate at the highest energy and that the order for each sample is also in line with expectations.
3.2.2 Effect of pH
pH is usually affects the adsorption capacity in adsorption, meanwhile the data on the effect of pH is important for application purposes. The adsorption of Pb(II) by the samples was examined at pH values of 4, 5, 6.5, 8, 9 and 10. From the chart shown in Fig. 8, it is evident that the amount of adsorption strongly depends on the solution pH. It is suggested that positive charges activate the electrochemical interactions between positive ions and the surface, but the amount of the adsorbed ions remains constant from pH 6.5 to 10. The formation of Pb species at the hydrolysis pH may compete with adsorption (Jiang et al., 2009; Bhat et al., 2015):
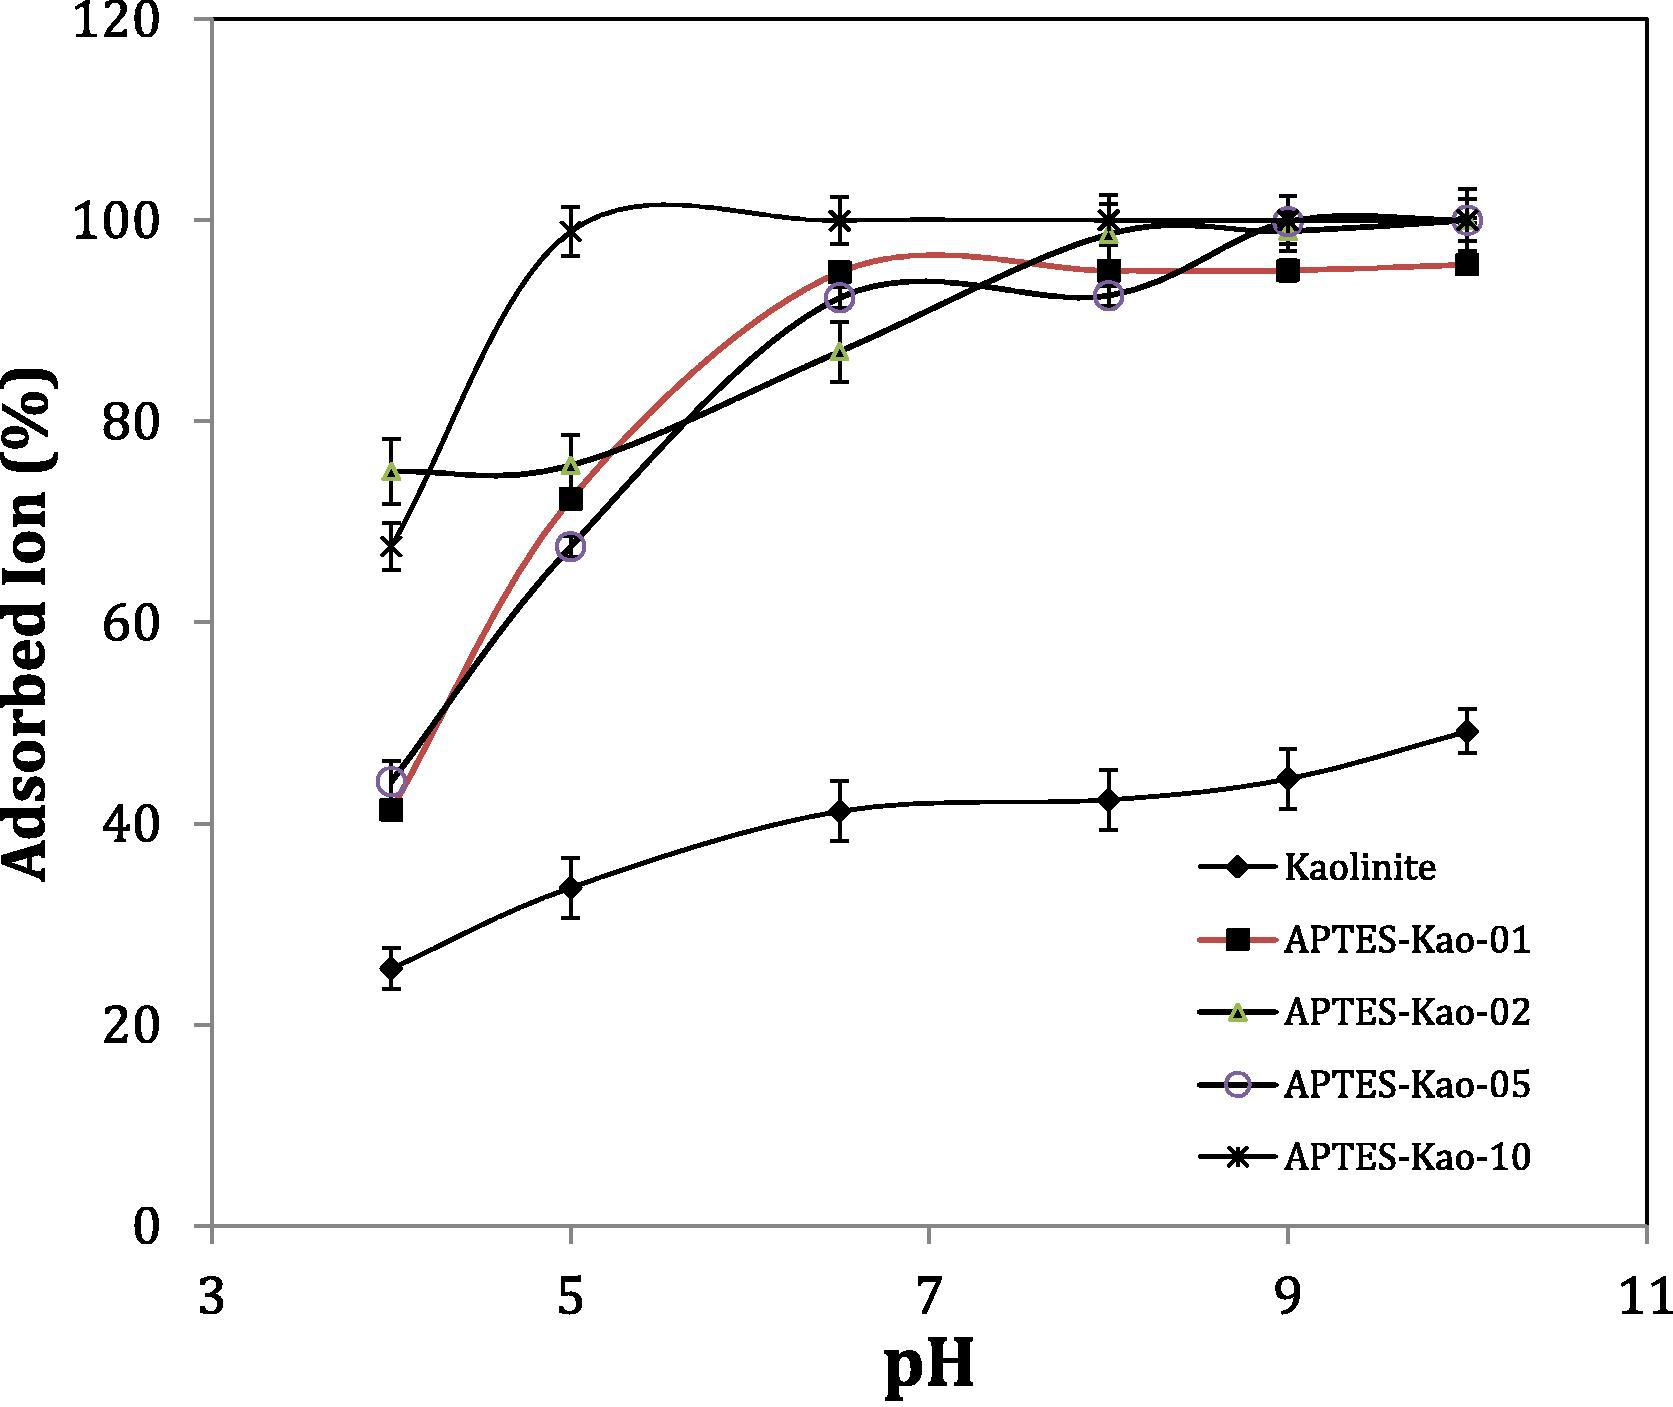
Effect of pH on adsorption capability.
3.2.3 Effect of temperature
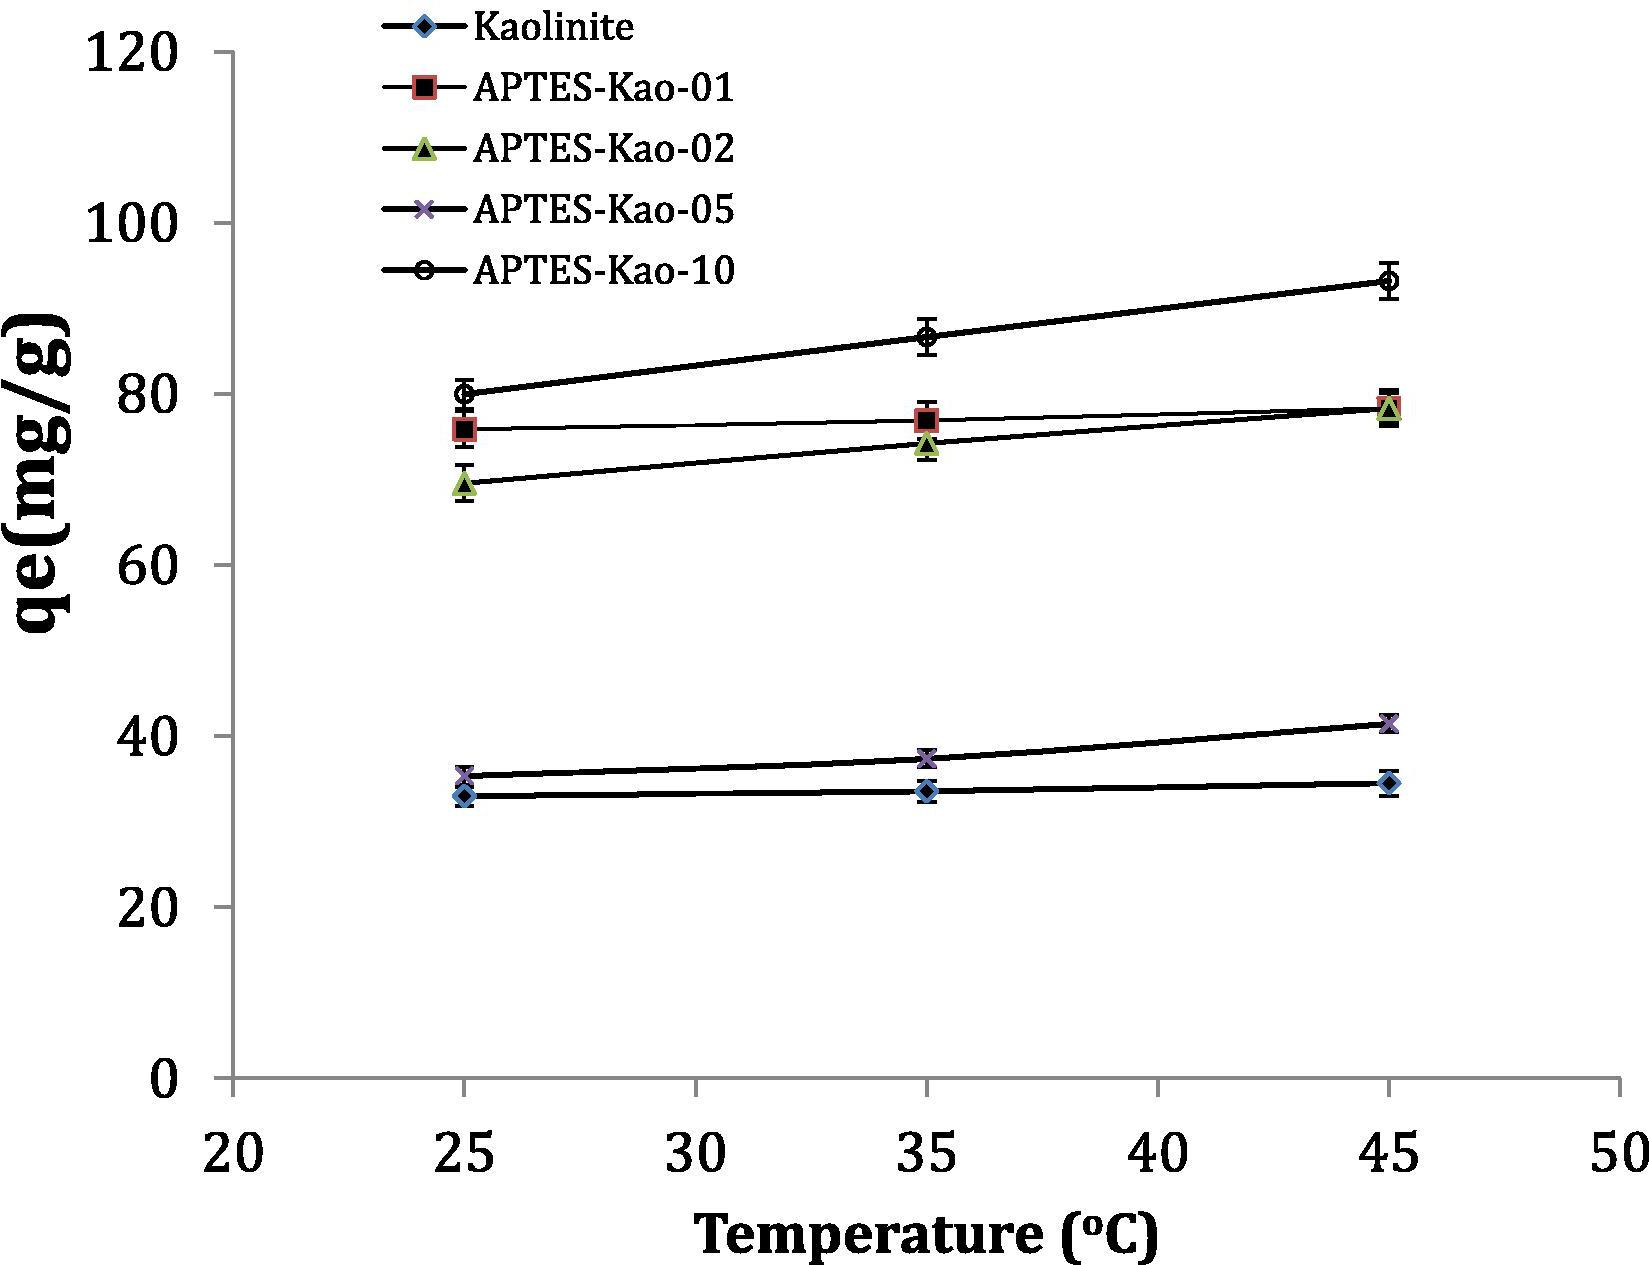
Heat of adsorption The effect of temperature on the adsorption of Pb(II) on the adsorbents was examined at three different temperatures, 25, 35 and 45 °C. The adsorption capacity results as a function of temperature are expressed as shown in the chart in Fig. 9. The increasing adsorption capacity with increasing temperature indicates that the adsorption of phenol is controlled by an endothermic reaction. Considering that the slope is related to the activation energy of the adsorption based on the Arrhenius equation, we obtain:
Effect of temperature on adsorption capacity.
3.2.4 Material recyclability
Material recyclability is one of important parameters for adsorbent application in industry. Study on material recyclability was conducted by reuse the regenerated used adsorbent for 5 cycles. The regeneration of adsorbent was conducted by leaching using HCl 0.2 M. Used adsorbent was soaked in the HCl solution for 24 h followed by filtration, washing by double distilled water and drying. The adsorbed Pb (%) by using recycled adsorbent is presented in Fig. 10. The pattern suggests that the material have stable adsorbent capability until 5 cycles.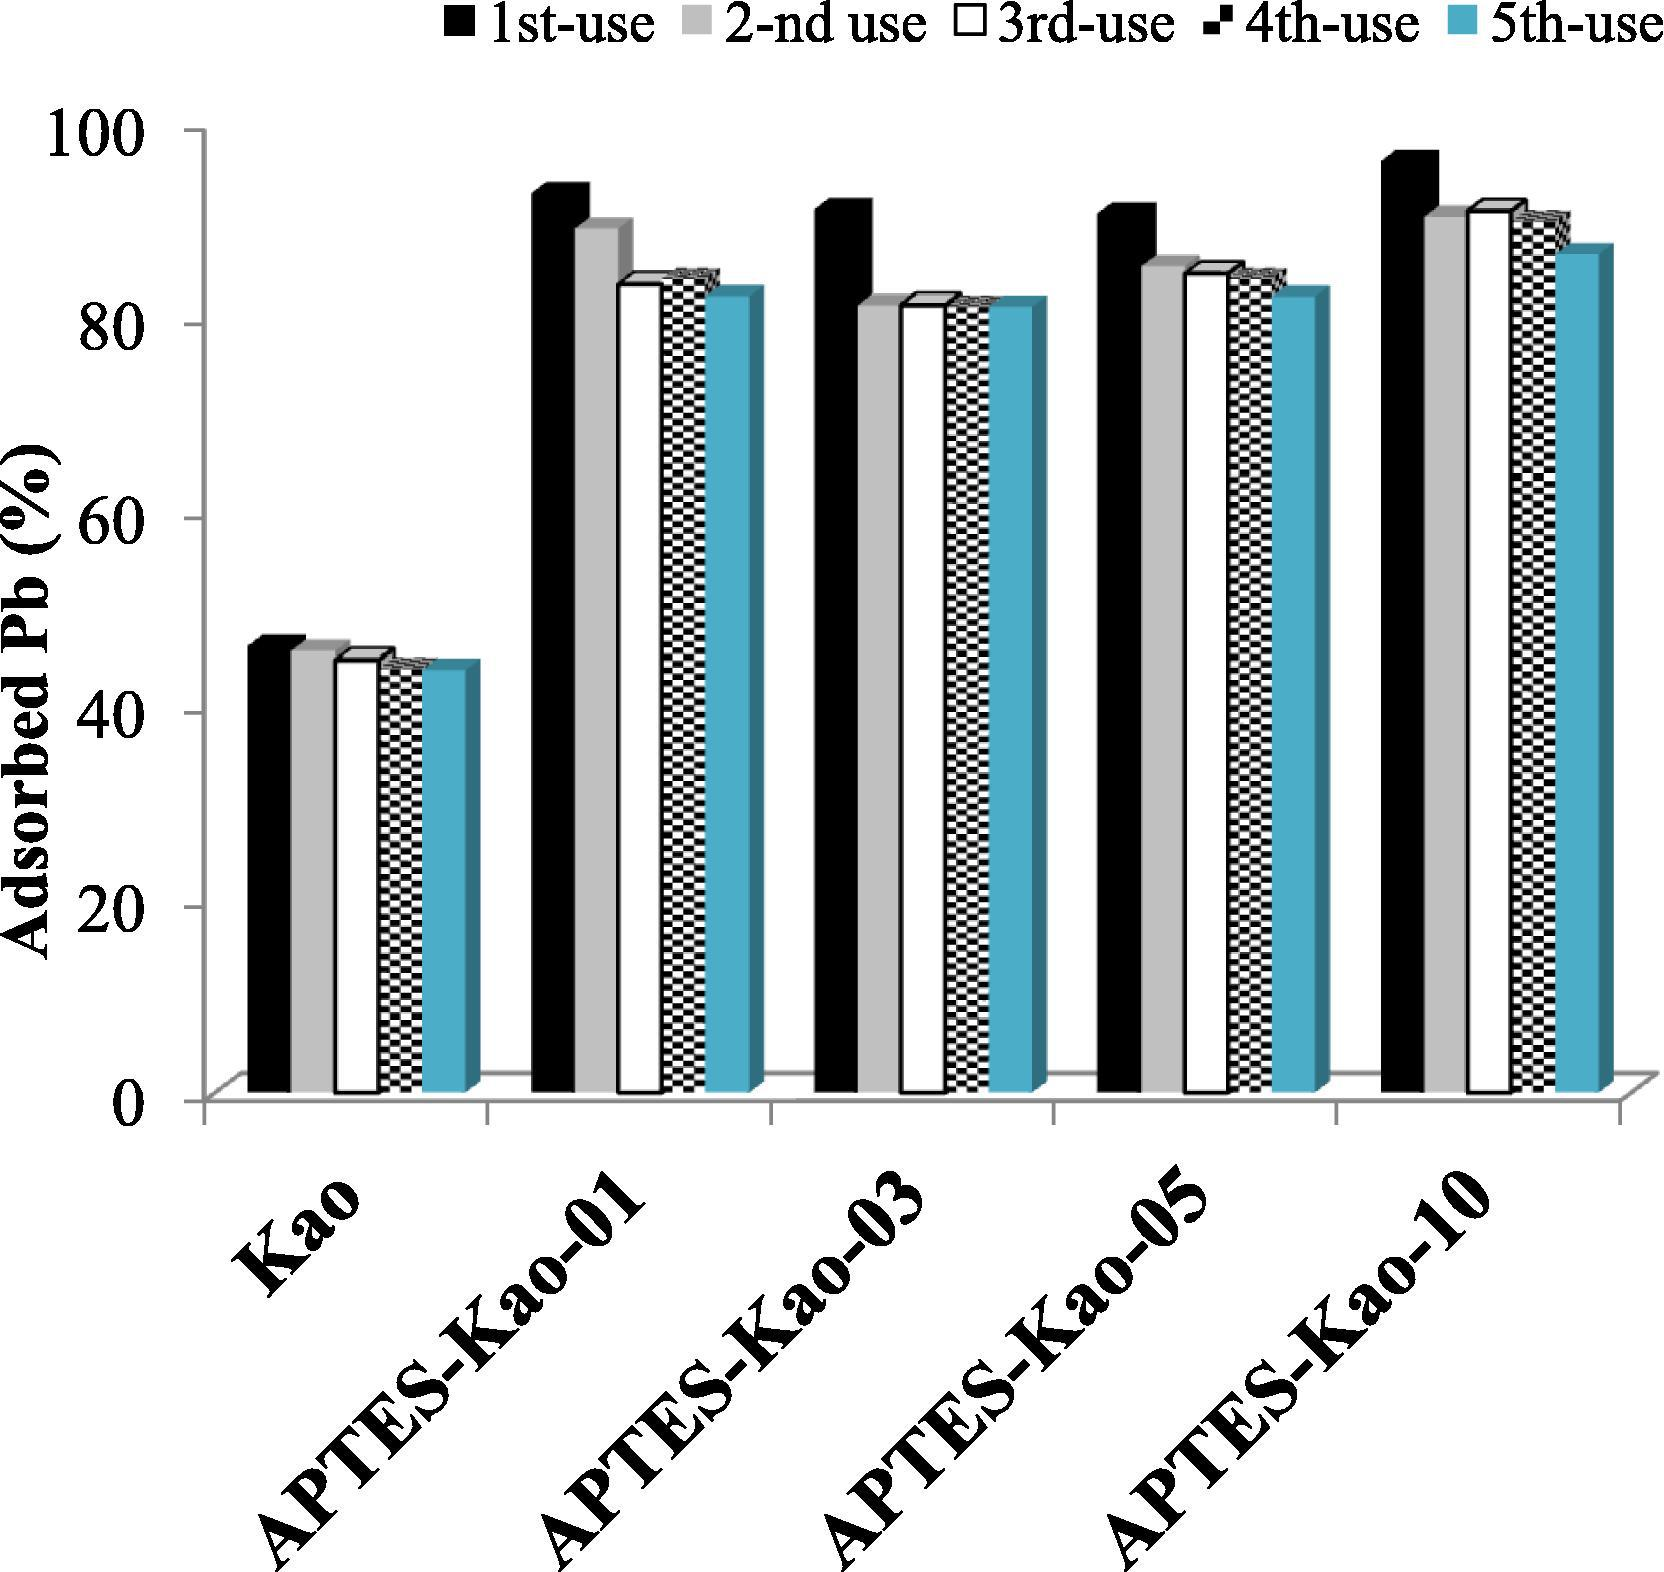
Adsorbed Pb(%) by using fresh and recycled materials.
4 Conclusion
In the present study, 3-amino propyl trimethoxy silane-modified kaolinite was successfully synthesized by varying the mole to mass ratio. The synthesized materials were found to have surface profiles and adsorptivity that was affected by mole ratio of APTES to kaolinite mass. The surface profiles of modified kaolinite were similar to those of raw kaolinite, but exhibited a better adsorption capability for Pb(II) from aqueous solutions. The adsorption obeyed pseudo first-order adsorption and the Dubinin-Radushkevich isotherm. pH and temperature affected the adsorption kinetics.
References
- Adsorptive removal of strontium by binary mineral mixtures of montmorillonite and zeolite. J. Chem. Eng. Data. 2010;55:783-788.
- [CrossRef] [Google Scholar]
- Adsorption and optimization studies of lead from aqueous solution using γ-Alumina. J. Environ. Chem. Eng.. 2015;3:30-39.
- [CrossRef] [Google Scholar]
- Exploiting the colloidal stability and solubilization ability of clay nanotubes/ionic surfactant hybrid nanomaterials. J. Phys. Chem. C. 2012;116:21932-21938.
- [Google Scholar]
- The heavy metal adsorption characteristics on metakaolin-based geopolymer. Appl. Clay Sci.. 2012;56:90-96.
- [CrossRef] [Google Scholar]
- Removal of Pb(II) from aqueous solution using modified and unmodified kaolinite clay. J. Hazard. Mater.. 2009;170:332-339.
- [CrossRef] [Google Scholar]
- Adsorption of Pb(II), Cd(II), Ni(II) and Cu(II) onto natural kaolinite clay. Desalination. 2010;252:33-39.
- [CrossRef] [Google Scholar]
- Removal of Cr(VI) from aqueous solution by surfactant-modified kaolinite. J. Ind. Eng. Chem.. 2014;20:3025-3032.
- [CrossRef] [Google Scholar]
- Di- and triethanolamine grafted kaolinites of different structural order as adsorbents of heavy metals. J. Colloid Interface Sci.. 2015;455:83-92.
- [CrossRef] [Google Scholar]
- Highly selective solid-phase extraction of trace Pd(II) by murexide functionalized halloysite nanotubes. Anal. Chim. Acta. 2012;713:136-144.
- [CrossRef] [Google Scholar]
- Cd(II) adsorption from aqueous solution by raw and modified kaolinite. Appl. Clay Sci.. 2014;88–89:63-72.
- [CrossRef] [Google Scholar]
- Adsorption of Pb2+ ions from aqueous solutions onto bael tree leaf powder: isotherms, kinetics and thermodynamics study. J. Eng. Sci. Technol.. 2009;4:381-399.
- [Google Scholar]
- BTX sorption on Na-P1 organo-zeolite as a process controlled by the amount of adsorbed HDTMA. Microporous Mesoporous Mater.. 2015;202:115-123.
- [CrossRef] [Google Scholar]
- Removal of sulfadiazine from aqueous solution on kaolinite. Front. Environ. Sci. Eng.. 2013;7:836-843.
- [Google Scholar]


