Translate this page into:
Cost effective preparation and characterization of nanocrystalline nickel ferrites (NiFe2O4) in low temperature regime
*Corresponding authors shanmugavelnano@gmail.com (T. Shanmugavel), gokulrajs@yahoo.com (S. Gokul Raj)
-
Received: ,
Accepted: ,
This article was originally published by Elsevier and was migrated to Scientific Scholar after the change of Publisher.
Available online 6 January 2015
Peer review under responsibility of King Saud University.
Abstract
Nanocrystalline forms of nickel ferrite (NiFe2O4) have been synthesized with the aid of single step chemical combustion method using citric acid as fuel in the 1:1 ratio. The single phase formation of nickel ferrite was confirmed through powder X-ray diffraction (XRD). The presence of various functional groups was confirmed through Fourier transform infrared spectroscopic (FTIR) analysis and the compositional analysis was performed through Energy dispersive X-ray studies (EDX). The micro structural features of nanocrystallites were examined by scanning electron microscope (SEM). Surface morphology of the nanocrystalline form of NiFe2O4 was also investigated through transmission electron microscopic (TEM) analysis. Magnetic measurements have showed the ferrimagnetic properties with Curie temperature @ 500 °C. The obtained results are in good agreement with the reported values. The other results have been discussed in detail.
Keywords
Spinel ferrites
Nickel ferrite
Chemical synthesis
X-ray diffraction
Magnetic measurements
HRTEM
1 Introduction
In the last few decades enormous development has been made in the field of nano technology, particularly in physical sciences. The formations of nano crystalline spinel ferrites play an important role in determining their physical properties in nano and sub nano levels. Nanocrystalline spinel ferrites are normally represented by a general formula MFe2O4 where M is usually a divalent metal ion (e.g. metals like Ni, Co, Cu, Zn, Fe, Mn, etc.). Ferrites have shown several applications due to their remarkable electrical and magnetic properties, and also in fields of magnetic resonance imaging (MRI) enhancement, magnetic high-density information storage etc., Nickel ferrite is one of the versatile and technologically important soft ferrite materials because of its typical ferrimagnetic properties, low conductivity, lower eddy current losses and high electrochemical stability (Zhao et al., 2006; Zhang et al., 2003).
Synthesis of nickel ferrite by conventional solid state reaction method involves higher calcination temperature, which leads to the formation of in-homogeneity, poor stoichiometries and higher crystallite sizes. Various chemical routes have been already adopted by many authors to synthesize nanocrystalline NiFe2O4 including a sonochemical process, co-precipitation, sol–gel, shock wave, reverse micelle and hydrothermal methods (Chen and He, 2001; Sagar, 2011; Sivakumar et al., 2009; Prasad and Gajbhiye, 1998; Shi et al., 1999; Liu et al., 2001; Kale et al., 2004; Zhou et al., 2005). Among them gel combustion process using hydroxyl carboxylic acids (citric acid) as chelating agents is experimentally proved to be simple and cost effective (Sutka and Mezinskis, 2012; Sivakumar et al., 2011; Barati and Seyyed Ebrahimi, 2008). The principle of this method is based on the distribution of metal ions within the polymeric network to avoid the segregation. In the present work, the compound has been synthesized in single phase at very low temperature (80 °C). Since, practical applications of ultrafine powders strongly depend on the particle size and morphology, the preparation of ultrafine particles well defined in size and morphology has attracted more interest in recent years (Matijevic, 1993, 1994; Kim et al., 2001).
2 Experimental procedures
2.1 Materials and methods
Nano particles of NiFe2O4 (NFO) have been prepared by sol–gel auto combustion method. Appropriate amounts of analytical grade Ni (NO3)2·6H2O and Fe (NO3)3·9H2O were dissolved in 200 ml of DI water homogeneously in 1:2 molar ratio. The ratio of citric acid (chelating agent) to the metal contents was maintained at 1:1. DI water was used as the solvent. Reaction was carried out in air atmosphere without the protection of nitrogen or inert gas. The solution was continuously stirred using a magnetic stirrer. Condensation reaction occurred between the adjacent metal nitrates and the molecules of citrates, yielding a polymer network in colloidal dimensions known as sol. Continuous heating of xerogel, led to the formation of nanopowders of NiFe2O4 through a self-propagating combustion process, until all the gel was burnt out completely to form loose powder.
2.2 Characterization studies
To identify the crystallinity of the synthesized nanopowders, X-ray diffraction (XRD) patterns of the samples were recorded by RIGAKU-DMAX2500 X-ray diffractometer with Cu Kα radiation (λ = 1.5406 Å) for 2θ values ranging from 10° to 70°. FTIR spectrum for the powder sample of NFO was recorded in the frequency regime 400–4000 cm−1, at room temperature using Bruker IFS 66V FTIR spectrometer. The morphological features have been observed with the aid of scanning electron microscope (SEM: model JOEL-JSM 6360). The particle sizes of nanopowders were obtained using a JEOL JEM 2100 Japan high resolution transmission electron microscope (HRTEM) operated at 200 kV. Magnetic measurements were carried out for the nanosized sample of NFO using a vibration sample magnetometer (VSM) with a maximum external magnetic field of 10 kOe. Temperature dependent magnetization was also measured by using the same instrument fitted with high temperature (HT) set-up for the samples calcined at 700 °C.
3 Results and discussion
The prepared spinel oxides of NiFe2O4 were collected and the obtained powders were calcined in different temperatures at 600, 700 and 800 °C for further investigations.
3.1 X-ray diffraction
The powder XRD pattern of the as-synthesized and the samples calcined at 600, 700 and 800 °C are shown in Fig. 1. It shows that the sharp crystalline peaks observed for samples calcined above 500 °C are attributed to the face-centered cubic nature of NiFe2O4. No secondary impurity phase was detected. The peaks appearing at 2θ values 18.4°, 30.2°, 35.7°,37.3°, 43.4°, 53.8°, 57.4° and 63.0° may be assigned for X-ray scattering from the (1 1 1), (2 2 0), (3 1 1), (2 2 2), (4 0 0), (4 2 2), (5 1 1) and (4 4 0) planes of the spinel crystal lattice, respectively. The obtained values of lattice constants for NiFe2O4 were in good agreement with the standard JCPDS (74-2081) data file as well as that of reported values. The increase of crystallite size may be due to the higher calcination temperatures (Yue et al., 2004).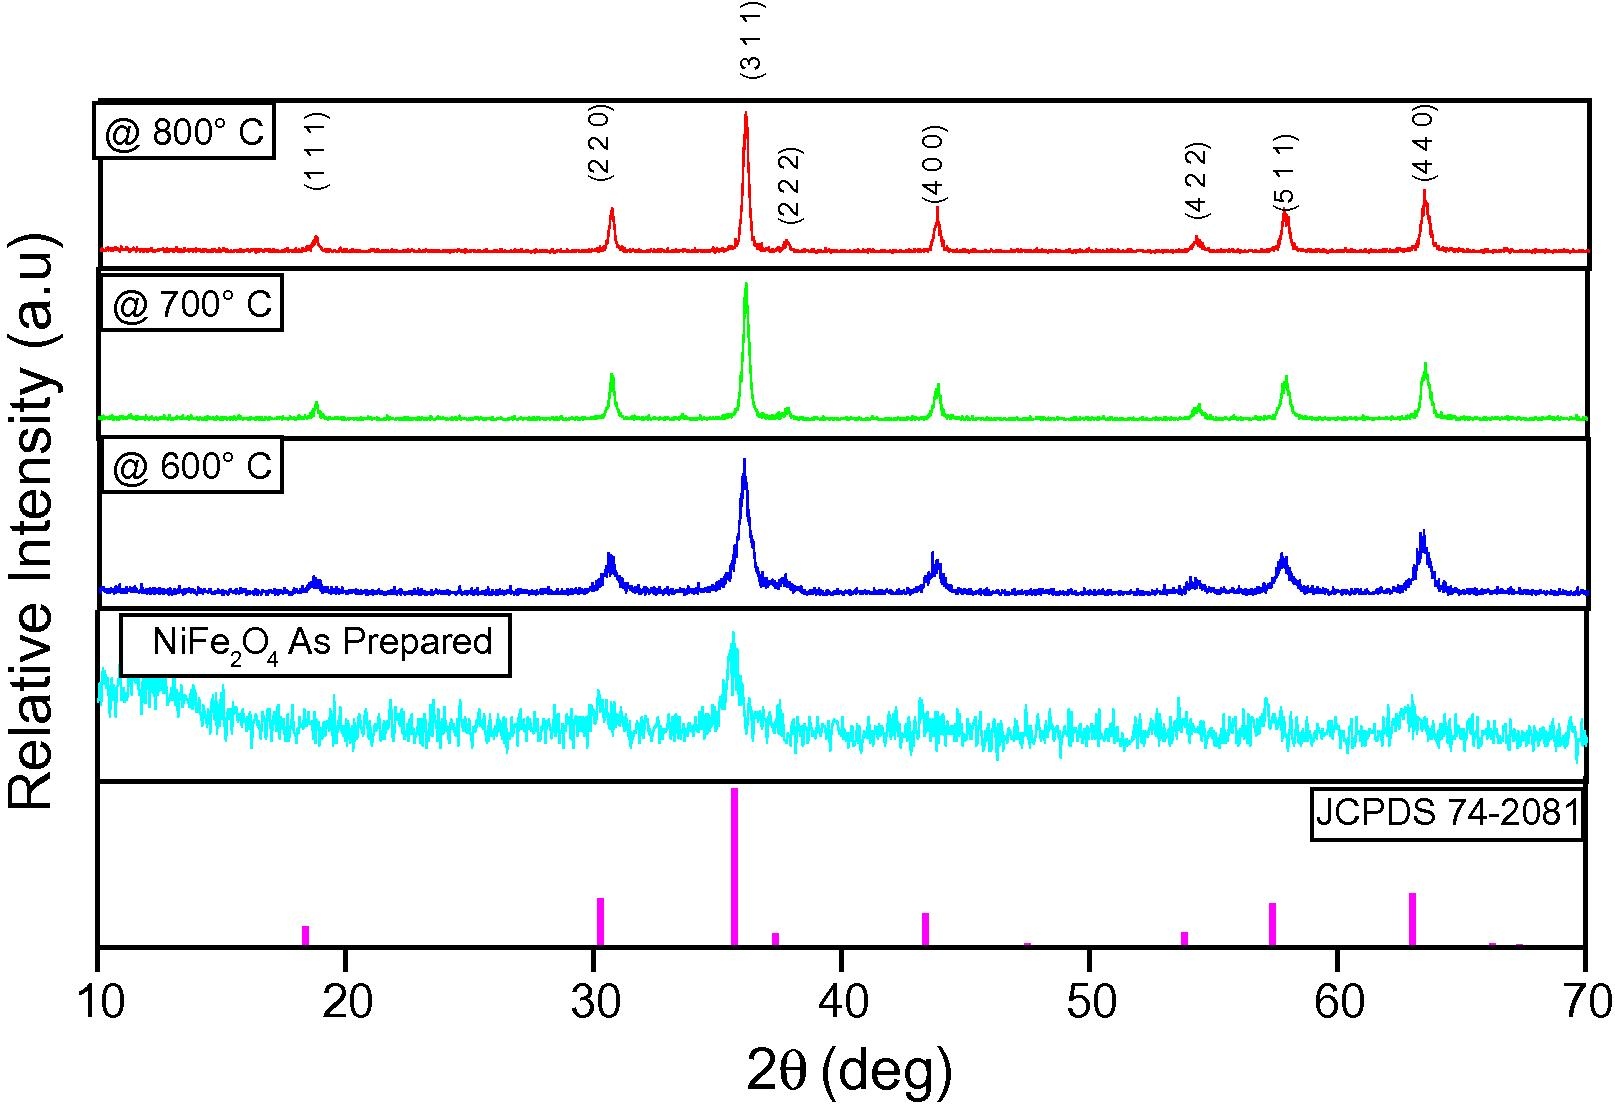
Powder XRD pattern of the (a) as prepared NiFe2O4 sample and the samples calcinated at (b) 600, (c) 700 and (d) 800 °C (JCPDS-No. for NiFe2O4 – 74-2081).
The average crystallite size (D) of the as-prepared NiFe2O4 particles was calculated by using the Debye–Scherrer equation (Klug and Alexander, 1974). As the calcination temperatures were increased from 600 to 800 °C, the full width half wave maximum (FWHM) values of diffraction curve decrease sharply and hence the particle sizes also increase. The crystallite size of the as-prepared powders is found to be around 11 ± 1 nm. When the temperature of the synthesized nano powder is raised further its crystallite size increases from 17 ± 1 nm to 35 ± 1 nm. This phenomenal change due to calcination effect is reported elsewhere (Zhou et al., 2002). Based on the obtained results, it has been observed that the single phase ferrite was achieved immediately after combustion. When similar attempts are made in order to prepare the same system with the aid of oleic acid and aloe vera the ferrite phase along with hematite phase was yielded as an impurity in the final state (Kurosawa et al., 2012; Laokul et al., 2011). Hence it is concluded that citric acid has been found to be the best fuel for the synthesis of NFO.
3.2 FTIR analysis
FTIR spectra for the as-prepared sample and for the nanopowders calcined at 700 °C are shown in Fig. 2. The decomposition of hydroxide to oxide phase for the formation of spinel ferrites were well reflected in the FTIR spectra when calcined. It has been reported that the IR bands of solids are usually assigned to vibration of ions in the crystal lattice (Brabers, 1969). The absorption bands observed for calcined sample give fruitful information about the vibrational structure of the molecule (Waldron, 1955; More et al., 2005; EI-Sayed, 2002). The band appearing at 3450 cm−1 in as-prepared sample corresponds to OH stretching vibration of H2O and there are special absorption peaks appearing at 2969, 1620 and 1437 cm–1, which correspond to the O–H group of citric acid, carboxylate anion, and anti-symmetric NO3 stretching vibrations, respectively (Brabers, 1969). The O–H stretching at 2333 cm−1 corresponds to the hydroxyl group of the as-prepared sample. Whereas in the sample calcined at 700 °C, it is due to the atmospheric moisture, the band appears weak as compared to the as-prepared sample. Incase of spectra of NiFe2O4 calcined at 700 °C, characteristic absorption bands found at ∼720 cm−1, correspond to tetrahedral sites of positive ions of nickel ferrite respectively.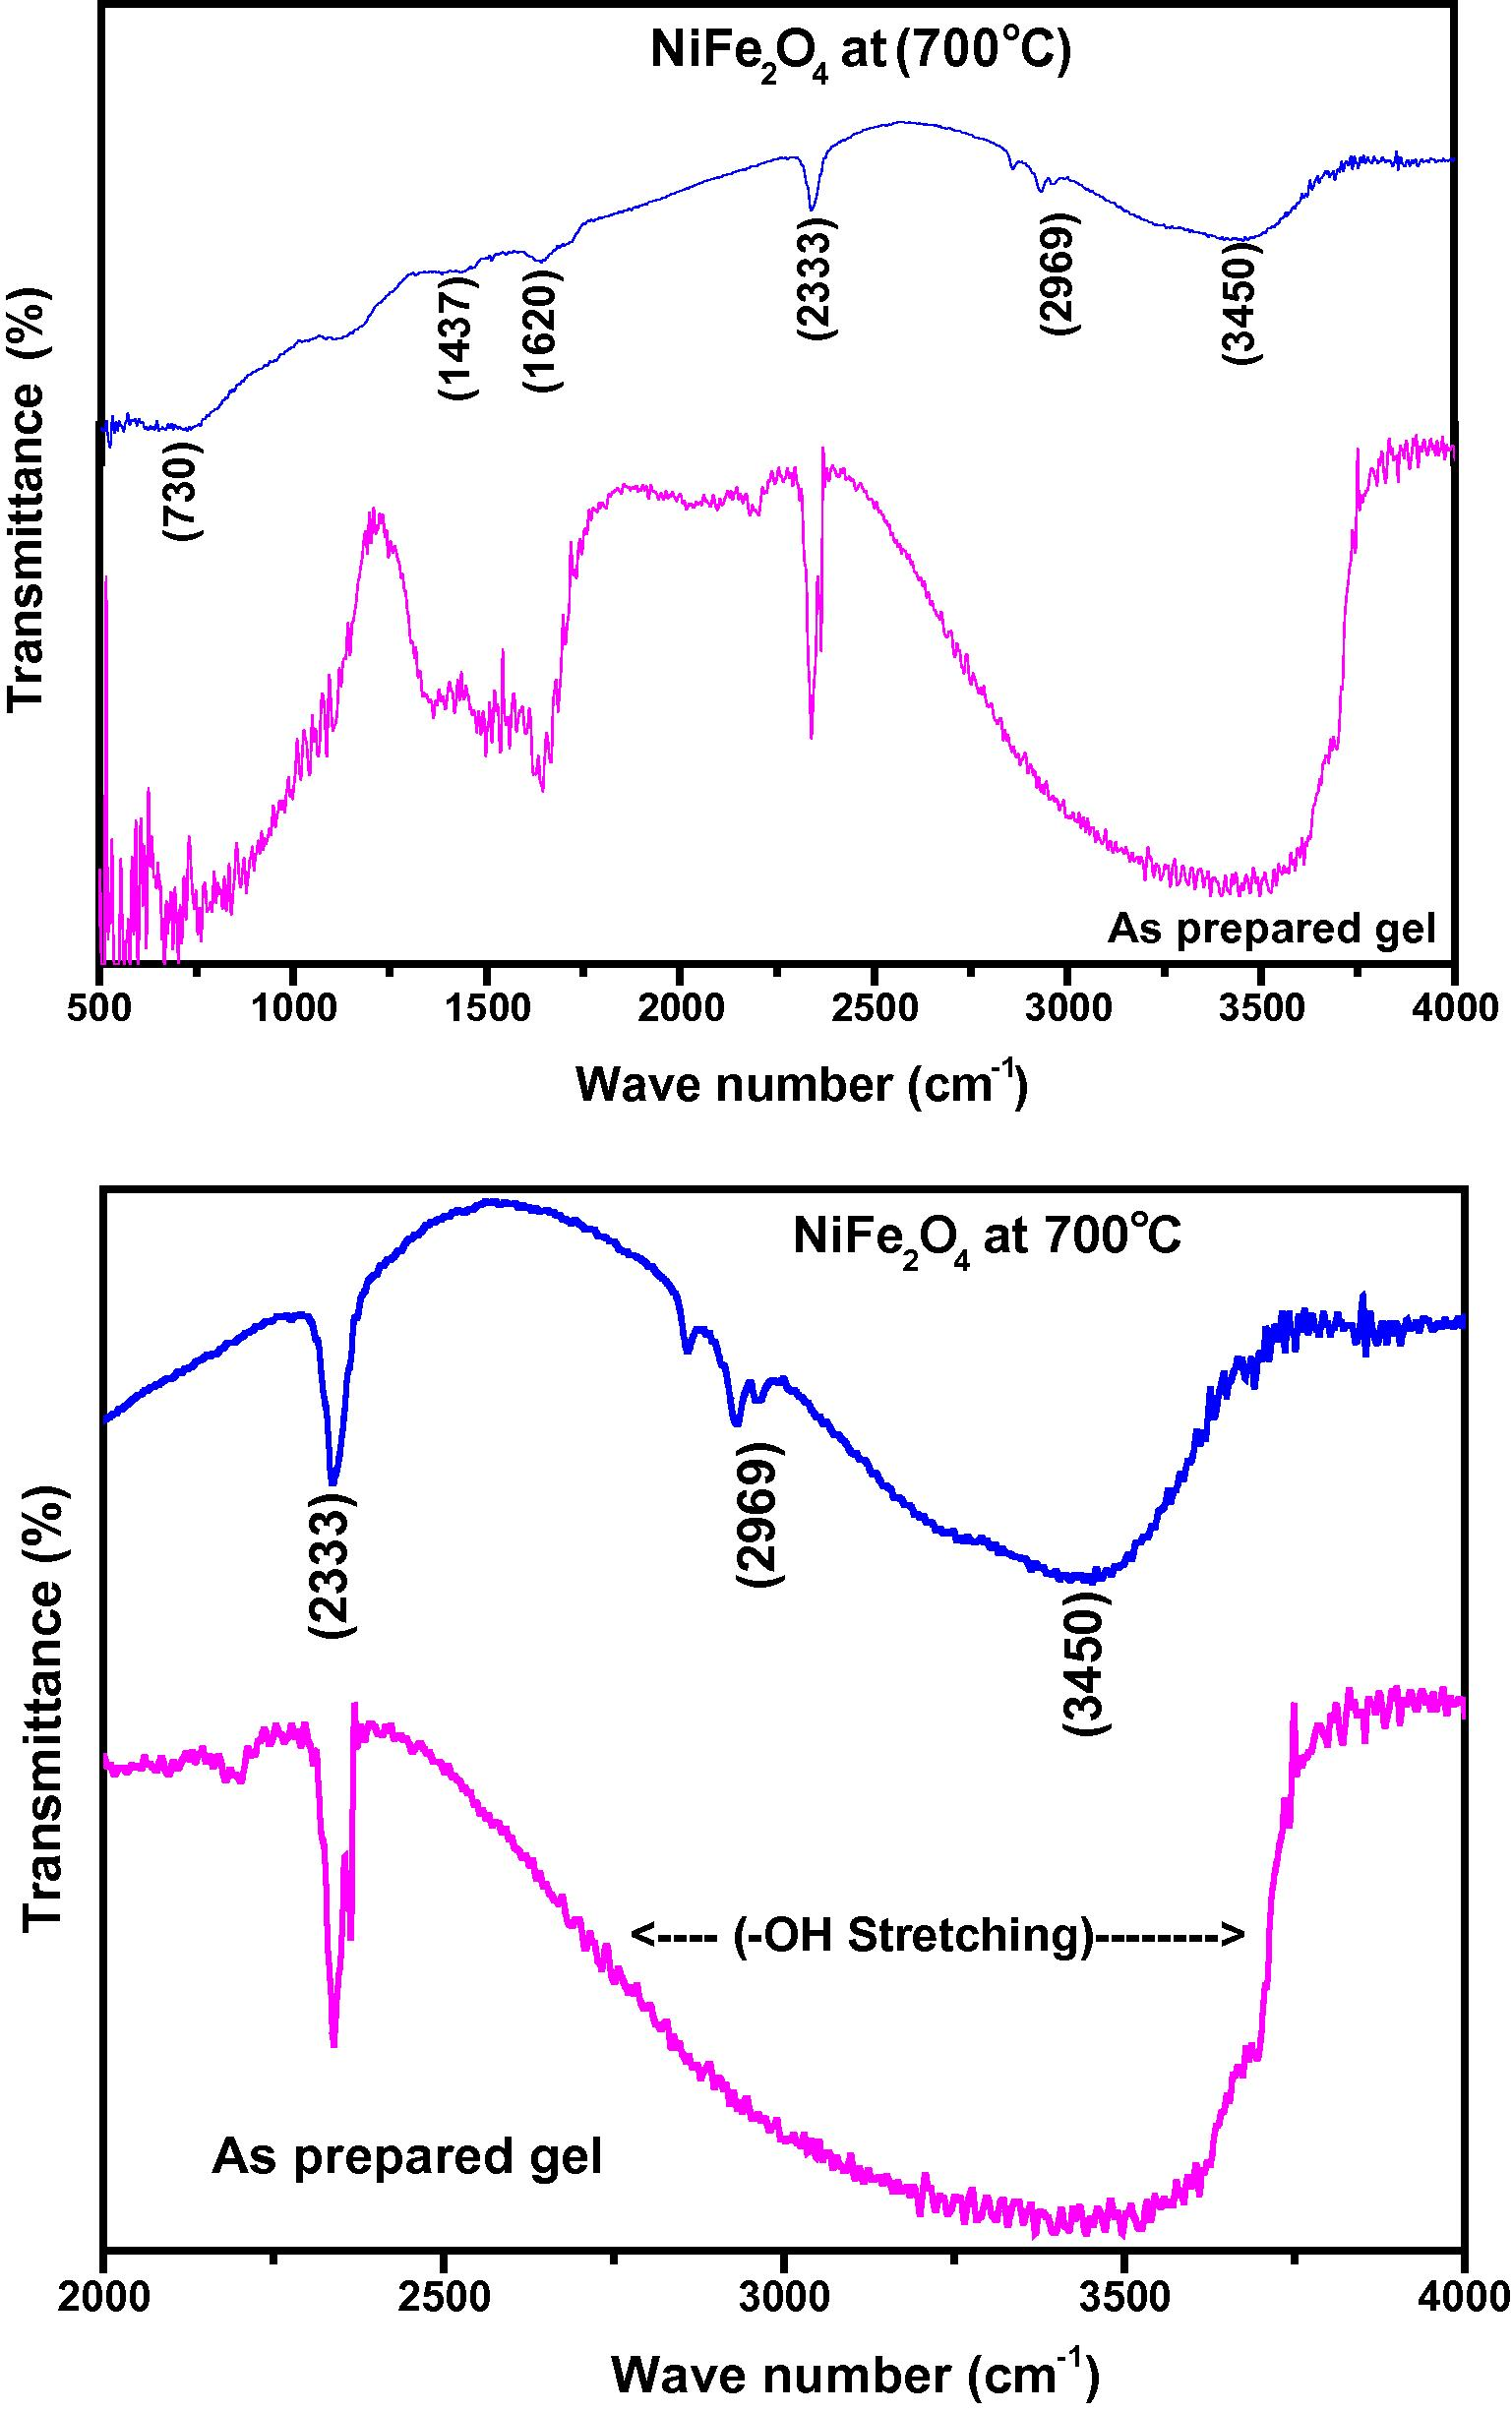
(a) and (b) FTIR spectrum of nickel ferrite as prepared and samples calcinated at 700 °C.
3.3 Magnetic measurements
Magnetic measurements were carried out using a vibrating sample magnetometer (VSM) up to a magnetic field strength of 10 kOe. All NiFe2O4 samples (as prepared, 600, 700 and 800°C) have been subjected to magnetization measurements at room temperature. Various magnetization properties like saturation magnetization, retentivity and coercive field were obtained from the hysteresis curves. The saturation magnetization (Ms) of the as-synthesized samples is lower than that of the annealed samples, while coercive fields (Hc) are found to be higher.
The values of saturation magnetization (Ms) and coercivity (Hc) of NiFe2O4 prepared by the sol–gel method have been reported as 31 emu/g and 93 Oe respectively (Wu et al., 2004). The lower values of Ms and Hc may be due to the low shape anisotropy and multiple domains of NiFe2O4 nanoparticles. It has been observed elsewhere that the nanocrystalline NiFe2O4 prepared by the sol–gel method exhibits low saturation magnetization in comparison to the hydrothermal method (Zhou et al., 2005). Hence it is believed that Ms is an intrinsic property of magnetic materials, but different preparation methods and conditions may affect the Ms value of the ferrites in the practical process. De Marco et al. (1993) have reported that the values of Ms of NiFe2O4 nanoparticles, measured at room temperature and prepared by solid-state reaction and plasma aerosol methods are 36 and 19 emu/g respectively. The variations in Ms values have been attributed to the difference in the structural morphology of the nanoparticles. Fig. 3 shows the hysteresis curves of nanocrystalline NiFe2O4 indicating a soft ferromagnetism of the ferrite materials in the field range up to 10 kOe, while outside this range the specific magnetization may increase slowly with the increasing field and it saturates well in the field range investigated (10 kOe).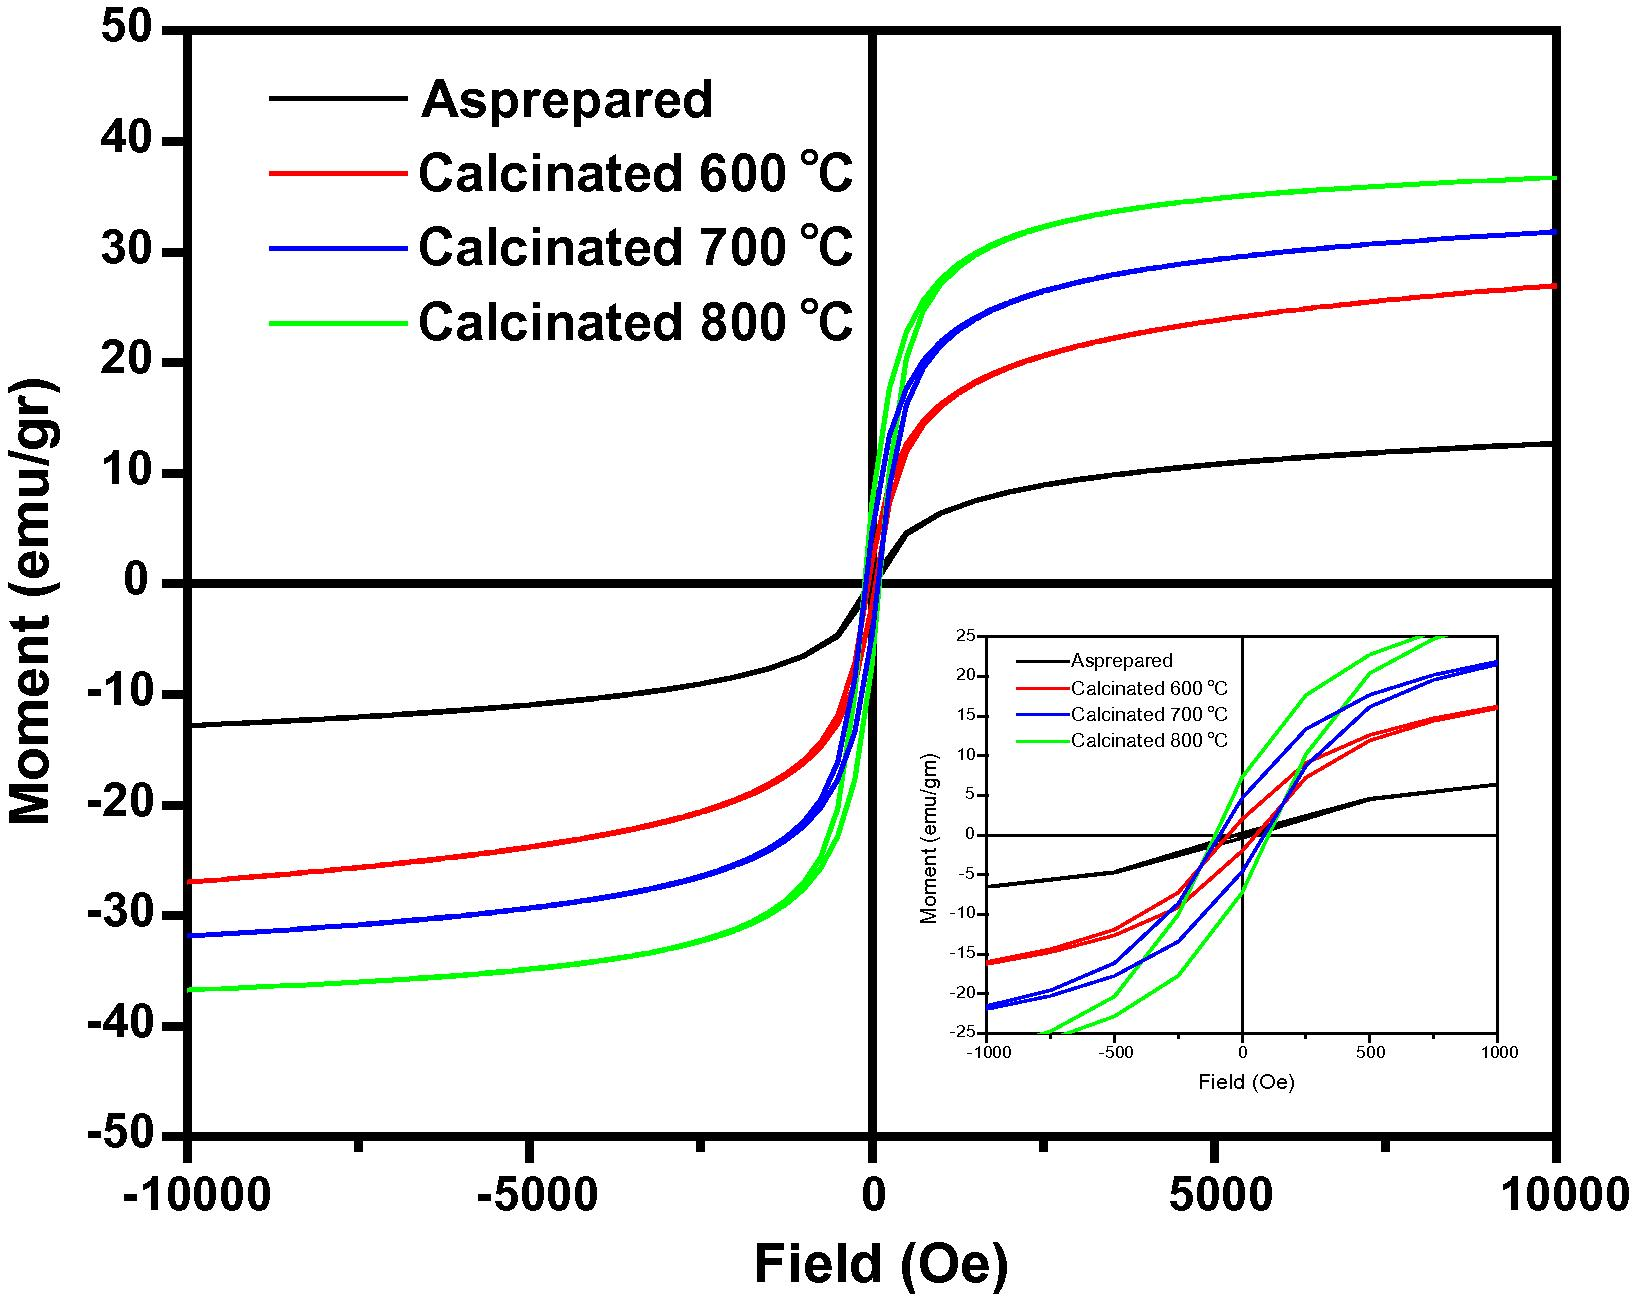
Room temperature hysteresis loop for the NiFe2O4 samples calcinated at 600, 700 and 800 °C.
The magnetic properties of samples depend on the calcination temperatures. Specific saturation magnetization (Ms) values of 12.8, 26.6, 31.7 and 36.9 emu/g are observed for the NiFe2O4 samples calcined at room temperatures, 600, 700 and 800 °C respectively. There is a clear tendency of Ms to increase with the enhancement of crystallinity of the NiFe2O4 samples. In addition, it is seen that the values of Ms increase with the increase of particle size. The effect of particle size on magnetic properties of ferrite materials could be determined using the surface spin disorder in magnetic nanoparticles. Kodama et al. studied the effect of surface spin canting of ball-milled NiFe2O4 particles and have demonstrated that the canted spin on the particle surfaces, having multiple configurations for any orientation of the core magnetization, is an important factor on the magnetic moment reduction (Kodama et al., 1996). In this work, the highest specific saturation magnetization of 36.9 emu/g is obtained in the sample calcined at 800 °C, which is particularly low in comparison with the theoretical saturation magnetization of 40 emu/g calculated by using Neel’s sublattice theory and the reported value for the bulk sample is 56 emu/g. The coercivity was found to be 30, 56, 89, and 104 Oe for the nanocrystalline samples calcined at 600, 700 and 800 °C respectively. It is seen from these results that the value of coercivity increases with the increasing of particle size. In Table 1, the saturation magnetization, coercivity and retentivity of NiFe2O4 for the as-prepared and samples calcined at 600, 700 and 800 °C are listed which shows an increasing trend as the calcination temperature is increased. This indicates that the crystallization increases when the calcinations temperatures are increased.
Calcination temperature (°C)
Crystallite size (D ± 1) nm
Saturation magnetization (Ms) (emu/g)
Coercivity (Hci) Oe
Retentivity (Mr) emu/g
As prepared
11
12.8
30.1
0.244
600 °C
17
26.6
56.1
1.99
700 °C
31
31.8
89.1
4.29
800 °C
35
36.9
104.6
7.26
Temperature dependent magnetic measurement carried out for the samples calcinated at 700 °C is shown in Fig. 4. The measured Tc from the curve was about 500 °C as shown in Fig. 4.The hysteresis loops show high coercivity (Hc), saturation magnetization (Ms) and remanence ratio (Mr/Ms). From the curve, it is understood that fine particles are easier to be thermally activated to overcome the magnetic anisotropy.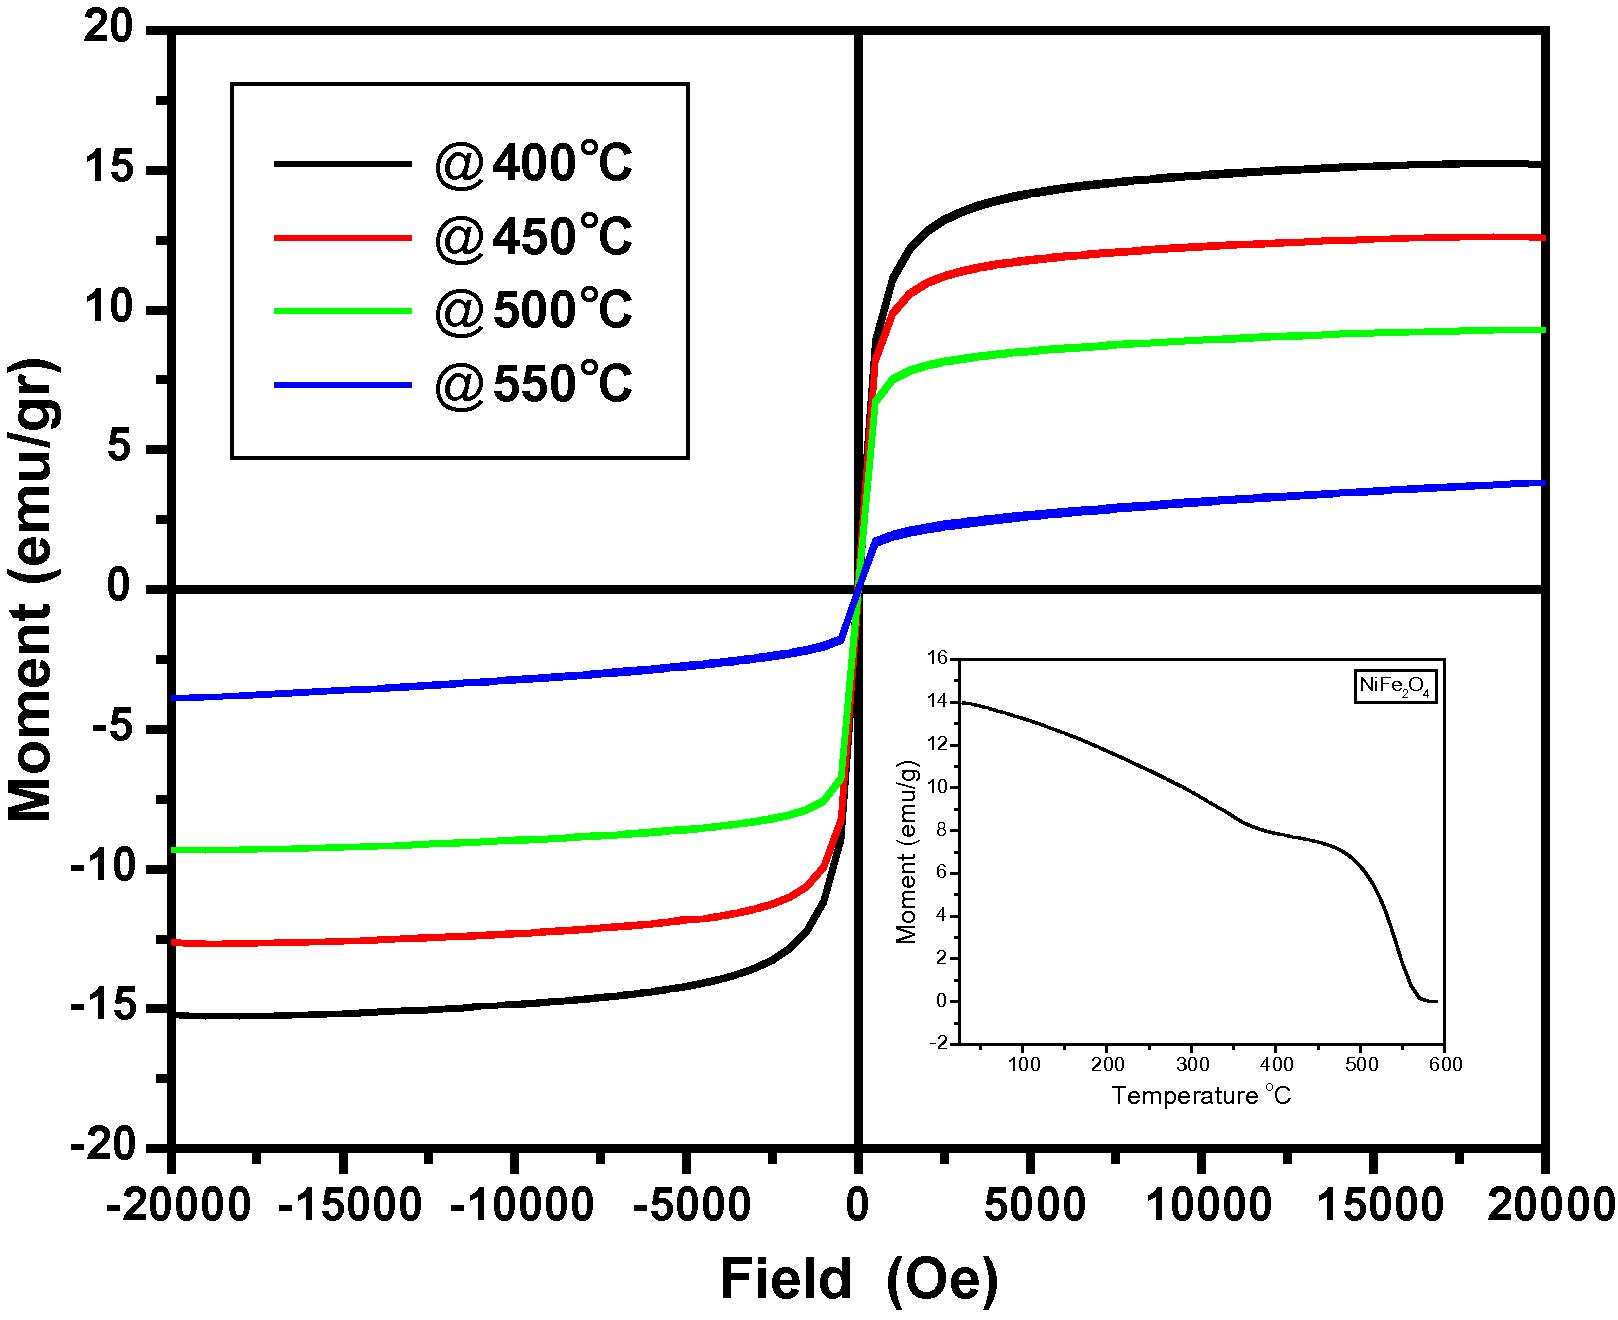
Temperature dependent magnetization for the NiFe2O4 samples calcinated at 700 °C.
3.4 SEM analysis
Fig. 5(a) and (b) shows the scanning electron micrographs (SEM) nickel ferrites sample calcinated at 700 °C. SEM micrograph depicts that the samples consist of micrometrical aggregation of smaller particles at a magnification of 5000 times the existence of high dense, agglomeration indicates that pore free crystallites are present on the surface.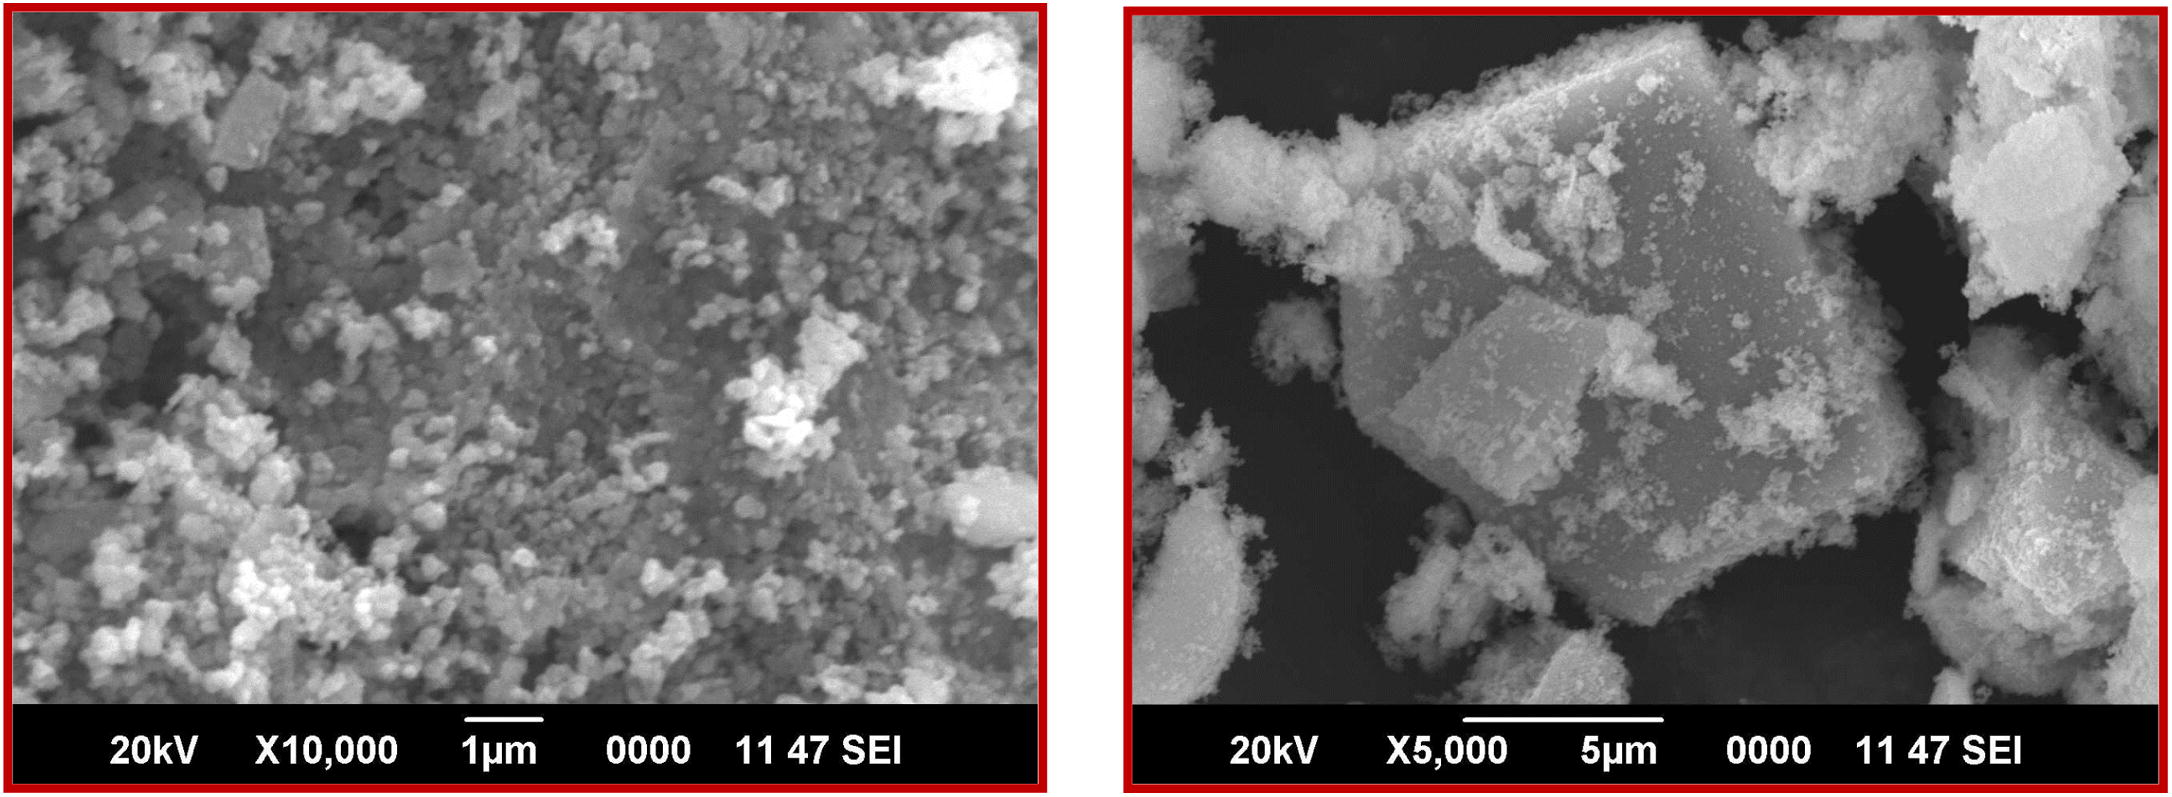
SEM micrograph of NiFe2O4 sample calcinated at 700 °C.
3.5 TEM analysis
HRTEM image of nanocrystalline NiFe2O4 is shown in Fig. 6. The micrograph depicts the spherical morphology of the calcined nanocrystalline NiFe2O4 particles at 700 °C. Analysis shows that the plane (1 1 1) is prominent in the present case and has been indexed in the HRTEM pattern. The selected area electron diffraction (SAED) pattern of the nanocrystalline NiFe2O4 sample calcinated at 700 °C is shown in Fig. 7. In SAED pattern, each spot of SAED becomes a disk, whose radii are approximately few hundred nanometers at around the center of the images. SAED and microdiffraction patterns of a crystal are permitted to obtain the symmetry of its lattice and to calculate its interplanar distances (with the Bragg’s law). According to the XRD results (Fig. 1), the single phase nanocrystalline materials, are made up of many tiny single crystals. The diffraction pattern of those samples will therefore look like a superposition of single crystal spot patterns: a series of concentric rings resulting from many spots very close together at various rotations around the center beam spot. Each ring is a reflection of the family of planes with different interplanar spacing. From the diffraction rings, the type of crystal structure can be determined by measuring the ring radii (R) Cullity and Stock, 2001. The obtained values of d are then compared to the reference value from the JCPDS (74-2081) database. The different values of particle size investigated by XRD and TEM techniques result from the agglomeration of fine particles of the NiFe2O4 samples. The ring patterns observed in the SAED were indexed as (3 1 1), (1 1 1), (4 2 2), (4 0 0), and (5 1 1) of the cubic spinel structure, which is consistent with the results of XRD.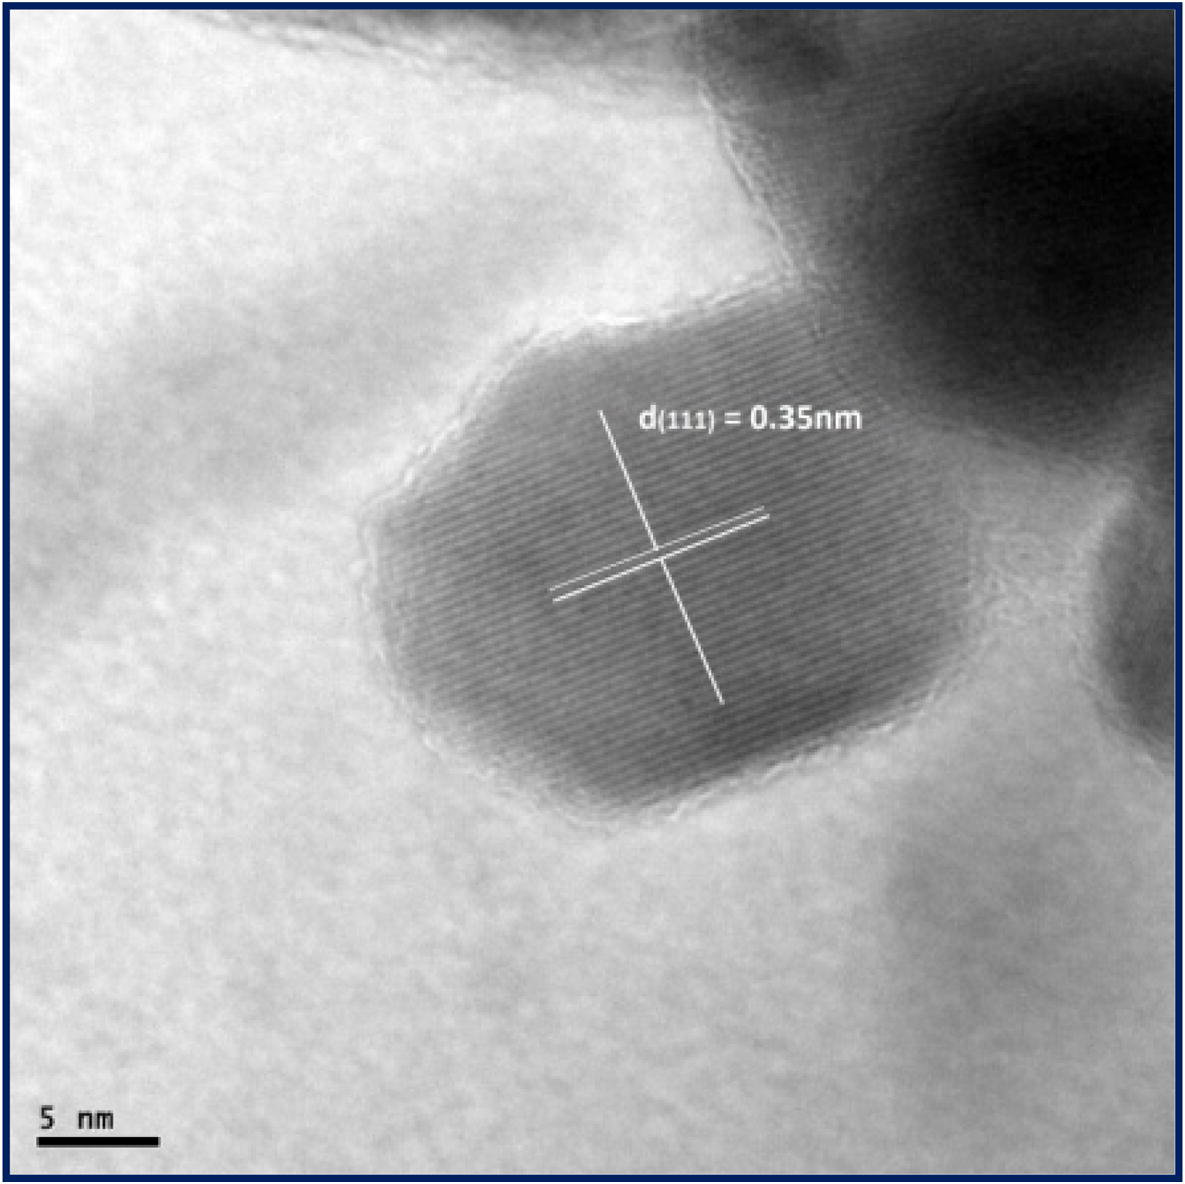
HRTEM of nanocrystalline NiFe2O4 sample calcinated at 700 °C.
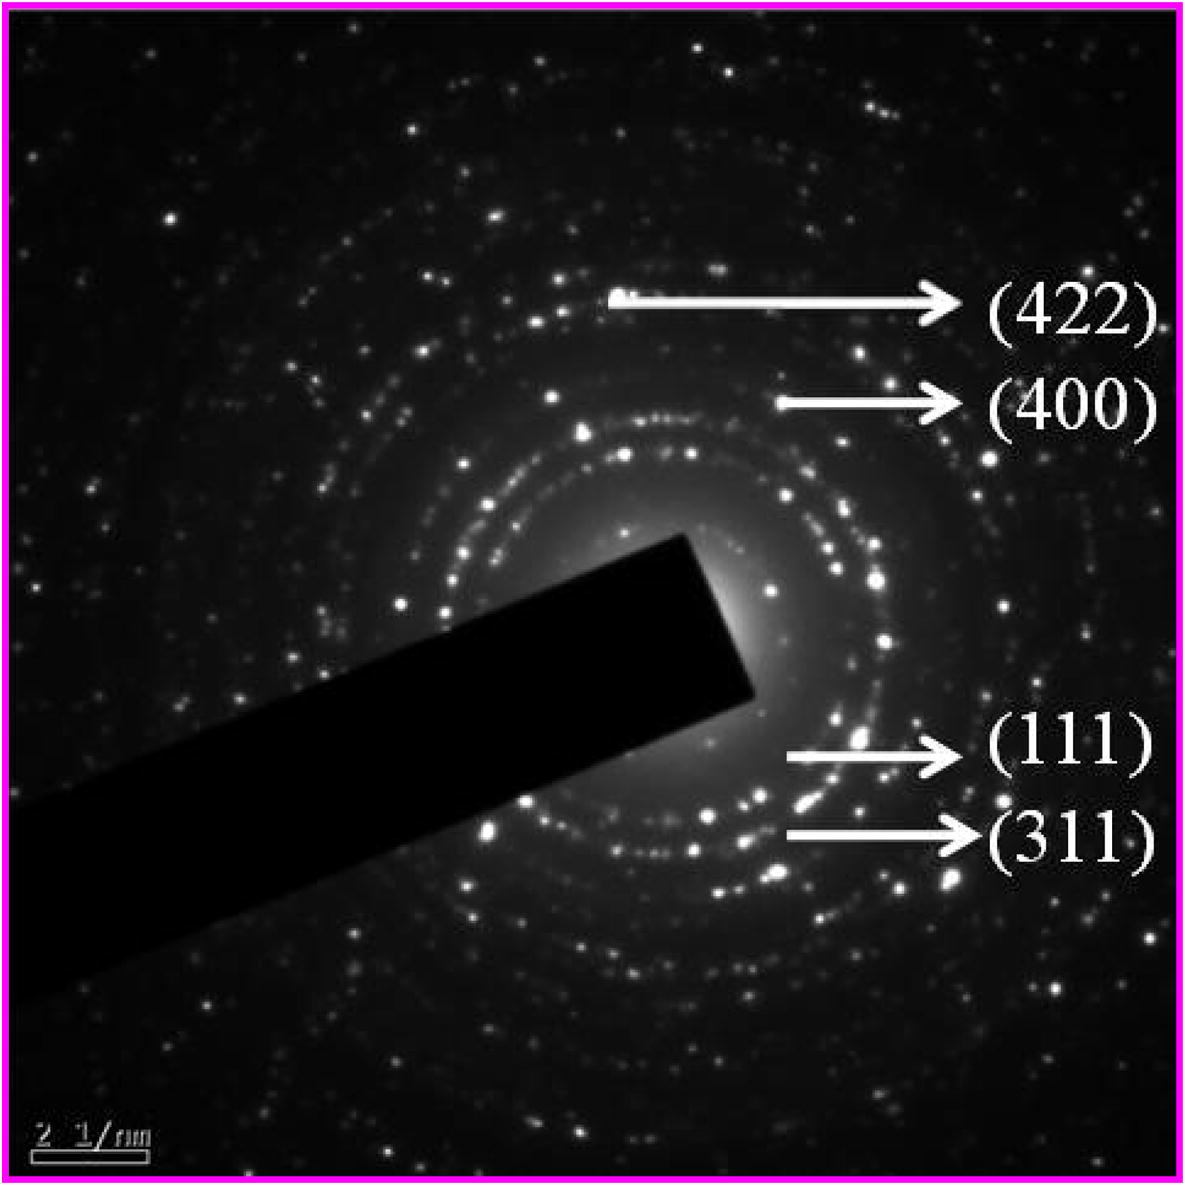
SAED pattern NiFe2O4 sample calcinated at 700 °C.
4 Conclusions
Nanocrystalline NiFe2O4 ferrites were prepared by the sol gel auto combustion method. Citric acid was found to be the best fuel for the synthesis of NFO when compared to other chelating agent. The as-prepared samples were calcined to 600, 700 and 800 °C. The effects of the calcination temperature on the particle sizes and magnetic properties of the ferrite samples were investigated and interpreted with valid reasons. The nickel ferrite samples obtained by this method had the single-phase spinel structure. The magnetic properties of the ferrite samples were strongly affected by the calcination temperature. The calcination temperature increases coercivity and saturation magnetization values are continuously increased. Scanning electron microscopic analysis reveals the highly agglomerated particles with no pores. Due to this property the crystallinity of the ferrites may be improved much more than the other techniques. High temperature magnetic measurements showed the ferrimagnetic behavior with Curie temperature at 500 °C and it is in agreement with that of the reported values.
Acknowledgment
One of the authors T. Shanmugavel wishes to thank all the Management members and Department of Physics, and various department staff members of Excel Engineering College, Komarapalayam 637303, Namakkal Dist., India and Dr. S. Gokul Raj wishes to thank the founder and chairman Prof. Dr. R. Rangarajan, and all the Management members of Vel Tech University, Avadi, Chennai – INDIA, for providing a platform to carry out the research.
References
- The role of surfactant in synthesis of magnetic nanocrystalline powder of NiFe2O4 by sol–gel auto-combustion method. J. Non-Cryst. Solids. 2008;354(47–51):5184-5185.
- [Google Scholar]
- Infrared spectra of cubic and tetragonal manganese ferrites. Phys. Status Solidi. 1969;33:563-572.
- [Google Scholar]
- Synthesis of nickel ferrite nanoparticles by sol–gel method. Mater. Res. Bull.. 2001;36:1369-1377.
- [Google Scholar]
- Elements of X-ray Diffraction (third ed.). New Jersey: Prentice Hall; 2001.
- Mössbauer and magnetization studies of nickel ferrites. J. Appl. Phys.. 1993;73:6287.
- [Google Scholar]
- Effect of chromium substitutions on some properties of NiZn ferrites. Ceram. Int.. 2002;28:651-655.
- [Google Scholar]
- Magnetic behavior of nanocrystalline nickel ferrite synthesized by the reverse micelle technique. J. Magn. Magn. Mater.. 2004;277:350-358.
- [Google Scholar]
- Morphological properties of ultra-fine (Ni, Zn)-ferrites and their ability to decompose CO2. J. Mater. Chem.. 2001;11:3373-3376.
- [Google Scholar]
- X-ray Diffraction Procedures for Polycrystalline and Amorphous Materials (second ed.). New York: Wiley; 1974.
- Promotion of grain growth in NiFe2O4 by annealing with oleic acid. Curr. Appl. Phys.. 2012;12:S68-S70.
- [Google Scholar]
- Characterization and magnetic properties of nanocrystalline CuFe2O4, NiFe2O4, ZnFe2O4 powders prepared by the Aloe vera extract solution. Curr. Appl. Phys.. 2011;11:101-108.
- [Google Scholar]
- Synthesis of nanosized nickel ferrites by shock waves and their magnetic properties. Mater. Res. Bull.. 2001;36:2357-2363.
- [Google Scholar]
- Uniform inorganic colloid dispersion. Achievements and challenges. Langmuir. 1994;10:8-16.
- [Google Scholar]
- Effect of temperature on X-ray, IR and magnetic properties of nickel ferrite prepared by oxalate co-precipitation method. J. Mater. Sci. Mater. Electron.. 2005;16:721-724.
- [Google Scholar]
- Magnetic studies of nanosized nickel ferrite particles synthesized by the citrate precursor technique. J. Alloys Compd.. 1998;265:87-92.
- [Google Scholar]
- Influence of Ce4+ ions on the structural and magnetic properties of NiFe2O4. J. Appl. Phys.. 2011;110:013914.
- [Google Scholar]
- NiFe2O4 ultrafine particles prepared by co-precipitation/mechanical alloying. J. Magn. Magn. Mater.. 1999;205:249-254.
- [Google Scholar]
- Preparation and properties of nickel ferrite (NiFe2O4) nanoparticles via sol–gel auto-combustion method. Mater. Chem. Phys.. 2009;117:163.
- [Google Scholar]
- Preparation and properties of nickel ferrite (NiFe2O4) nanoparticles via sol–gel auto-combustion method’. Mater. Res. Bull.. 2011;46(12):2204-2207.
- [Google Scholar]
- Sol–gel auto-combustion synthesis of spinel-type ferrite nanomaterials. Front. Mater. Sci.. 2012;6(2):128-141.
- [Google Scholar]
- Preparation of NiZn ferrite/SiO2 nanocomposite powders by sol–gel auto-combustion method. J. Magn. Magn. Mater.. 2004;269:150-155.
- [Google Scholar]
- Synthesis of nanocrystilline ferrites by sol–gel combustion process: the influence of pH value of solution. J. Magn. Magn. Mater.. 2004;270:216-223.
- [Google Scholar]
- A sensitive mediator-free tyrosinase biosensor based on an inorganic–organic hybrid titania sol–gel matrix. Anal. Chim. Acta. 2003;489:199-206.
- [Google Scholar]
- Fabrication, characterization of Fe3O4 multilayer film and its application in promoting direct electron transfer of hemoglobin. Electrochem. Commun.. 2006;8:148-154.
- [Google Scholar]
- NiFe2O4 nanoparticles formed in situ in silica matrix by mechanical activation. J. Appl. Phys.. 2002;91:6015-6021.
- [Google Scholar]
- Low-temperature synthesis of NiFe2O4 by a hydrothermal method. J. Am. Ceram. Soc.. 2005;88:3535-3537.
- [Google Scholar]


