Translate this page into:
Hydrophobicity and kinetic inspection of hydroxide ion attack on some chromen-2-one laser dyes in binary aqueous–methanol and aqueous–acetone mixtures: Initial state-transition state analysis
*Tel.: +20 934601807/2556, mobile: +20 1064162700; fax: +20 934601159 ahmed_benzoic@yahoo.com (Ahmed M. Abu-Dief)
-
Received: ,
Accepted: ,
This article was originally published by Elsevier and was migrated to Scientific Scholar after the change of Publisher.
Available online 24 February 2014
Peer review under responsibility of King Saud University.

Abstract
In the present study, reactivity base-catalyzed hydrolysis of 7-dimethylamino-4-methyl-2H-chromen-2-one (DMAC) and 7-diethylamino-4-methyl-2H-chromen-2-one (DEAC) in binary aqueous–methanol and aqueous–acetone mixtures was examined at 298 K. Kinetic results, rate laws and reaction mechanisms were established. Moreover, the change in the activation energy barrier of the investigated compounds from water to water–methanol and water–acetone mixtures was estimated from the kinetic data. Base-catalyzed hydrolysis of (DMAC) and (DEAC) in aqueous–methanol and aqueous–acetone mixtures follows a rate law with kobs = k2[OH]. The decrease in the rate constants of (DMAC) and (DEAC) as the proportion of methanol and acetone is due to the destabilization of OH− ion. The solubilities of the studied compounds, DMAC and DEAC in water–methanol and water–acetone mixtures were established and their transfer chemical potentials were calculated. Solvent effect on reactivity trends of the investigated compounds has been analyzed into initial and transition state components by using the transfer chemical potentials of the reactants and the kinetic data of the studied compounds. The decrease in the observed rate constant values (kobs) of the base hydrolysis of DMAC and DEAC with increasing of methanol% or acetone% is dominated by the initial state (IS).
Keywords
Chromen-2-ones
Base-catalyzed hydrolysis
Reaction mechanism
Solvent effect
Activation energy barrier
Initial-transition state analysis
1 Introduction
Coumarins belong to a group of compounds known as the benzopyrones, all of which consist of a benzene ring joined to a pyrone. Coumarin and the other members of the coumarin family are benzo-α-pyrones, while the other main members of the benzopyrone group, the flavonoids contain the γ-pyrone group (Ramazani et al., 2008; Khoobi et al., 2012; Zareai et al., 2012).
Chromen-2-ones are ubiquitous in nature, extensively studied due to their practical applications (Dall’Acqua et al., 1996). Chromen-2-ones have such marked physiological effects as active hypotoxicity, carcinogenicity, anticoagulant action, and antibiotic activity and anti-inflammatory agents (Kupcewicz et al., 2011; Kostova, 2005; Kaneko et al., 2003; Zacharski et al., 1992; Melagraki et al., 2009; Khoobi et al., 2011; Azizmohammadi et al., 2012). In addition, biological and chemical sensors, fluorescent probes and laser dyes, are some of their applications (Hagop and Sebe, 2011; Çamur and Bulut, 2008). Moreover, Chromen-2-ones that contain an electron-releasing group in the 7-position, and a heterocyclic electron-acceptor residue in the 3-position, are recognized as fluorescent dyes suitable for application to synthetic fibers (Zakerhamidi et al., 2010). Furthermore, Chromen-2-ones have a wide variety of uses in industry, mainly due to their strong fragrant odor so they are used as fragrant component in the fragrance and flavoring industries (Egan et al., 1990). Also their uses include that of a sweetener and fixative of perfumes, an enhancer of natural oils, such as lavender, a food additive in combination with vanillin, a flavor odor stabilizer in tobaccos, an odor masker in paints and rubbers, and, finally, they are used in electroplating to reduce the porosity and increase the brightness of various deposits, such as nickel (Ojala, 2001). 7-Dimethylamino and 7-diethylamino-4-methyl-2H-chromen-2-one under study are used as laser dyes for the blue-green region (Çamur and Bulut, 2008; Drexhage, 1977; Pavlopoulos et al., 1987) and as indicator dyes (Braun and Gonzalez, 1997).
In continuation of our work (Abu-Gharib et al., 2011a,b), we report here the effects of methanol and acetone as co-organic solvents on the kinetics of the base-catalyzed hydrolysis of (DMAC) and (DEAC) to gain more information about the solvent effect on base-catalyzed hydrolysis of these two compounds which they have many applications in laser field.
2 Experimental
2.1 Materials
All materials, sodium hydroxide (99.3%), sodium chloride (99.7%), sodium nitrate (99%), oxalic acid (99.7%), methanol (99.5%) and acetone (99.5%) were obtained from BDH. 7-dimethylamino-4-methyl-2H-chromen-2-one and 7-diethylamino-4-methyl-2H-chromen-2-one were obtained from Sigma. The stock solutions of NaOH (1 mol dm−3), NaCl (1 mol dm−3) and NaNO3 (1 mol dm−3) were prepared by dissolving the calculated amounts of AnalaR samples in redistilled water.
2.2 Apparatus and experimental method
2.2.1 Kinetic measurements
Kinetics of base-catalyzed hydrolysis were measured by following the dependence of absorbance on time using 10 mm silica cells in the thermostated cell compartment of JASCO model V-530 spectrophotometer. Chemical reactions were monitored in solutions held at constant ionic strength using appropriate amounts of sodium chloride in methanol and sodium nitrate in acetone over at least three half-lives. Pseudo first-order conditions were applied by mixing multifold greater concentration of NaOH than that of the compound. Rate constants were calculated from the dependence of absorbance on time at 373 and 383 nm for DMAC and DEAC, respectively.
2.2.2 Solubility measurements
Solubilities of the investigated compounds were measured by agitating a generous excess of solid with the appropriate solvent, aqueous–methanol and aqueous–acetone mixtures, in a thermostated vessel for seven hours. This time is enough to prepare the best saturated solution from the solid compound in aqueous–solvent mixtures. Then portions of supernatant saturated solution were removed and centrifuged rapidly using centrifuge before withdrawing an aliquot by using a micropipette. The solution was diluted as necessary. Then the absorbance was measured at λmax for each compound (Abu-Gharib et al., 2011a). All aliquots of equilibrated solutions were diluted with the solvent methanol or acetone and the dependences of λmax on solvent composition, were found to be very small for the studied compounds, and thus ignored in calculation of solubilities. The customary precautions were taken to avoid heating of aliquots of saturated solutions before dilution and to prevent any solid material being carried through with samples of saturated solutions. The spectra were measured at different sampling times to verify if a constant concentration has been achieved. The concentrations of the saturated solutions were determined by applying beer’s law (Aabs = ɛcl) where “ɛ” is the molar extension coefficient in dm3 mol−1 cm−1, “c” is the concentration in mol dm−3 and “l” is the length of the cell in cm.
The molar extension coefficient “ɛ” in dm3 mol−1 cm−1 for each coumarin derivative was determined from the least square of the standard curve using beer’s law.
3 Results and discussion
The absorption bands for DMAC and DEAC at λmax = 373 and 383 nm, respectively can be ascribed to an n–π∗ transition involving the lone pairs of electrons localized at nitrogen atom in position 7 of DMAC and DEAC. In the acidic medium, these bands disappear because of the hindrance of the excitation of n electrons by protonation (Abdel-Mawgoud et al., 1997), which support the intramolecular electronic transition of these bands.
3.1 Kinetic results and reaction mechanism
It can be realized from the repeated spectral scans (cf. Fig. 1) that the initial effect on DMAC and DEAC of NaOH takes place in one stage and leads to the rate determining opening of the pyrone ring and the formation of a salt of (2Z)-3-[4-(dimethylamino)-2-hydroxyphenyl]-2-butenoic acid and (2Z)-3-[4-(diethylamino)-2-hydroxyphenyl]-2-butenoic acid, respectively as shown in Scheme 1 (Abu-Gharib et al., 2011a,b). Moreover, it is inferred from the repeated spectral scans, that the product of the hydrolysis reaction is formed at 300 nm for DMAC and 310 nm for DEAC. This is due to charge transfer spectra (π–π∗ transition) as the resonance which results from (CH3)2N and (C2H5)2N groups is reflected by the action of COOH and O− groups. This leads to blue shift in value of λmax for each of the two compounds. Furthermore, it is clear that the presence of the methyl group in position 4 in each of DMAC and DEAC satirically hinders the rotation of Z form of the product to give the E form.![Repeated spectral scans of DMAC at [OH−] = 0.35 M, [DMAC] = 1 × 10⁻³ M, I = 0.5 M and 298 K with interval time = 2 min.](/content/185/2015/27/1/img/10.1016_j.jksus.2014.02.002-fig2.png)
Repeated spectral scans of DMAC at [OH−] = 0.35 M, [DMAC] = 1 × 10⁻³ M, I = 0.5 M and 298 K with interval time = 2 min.
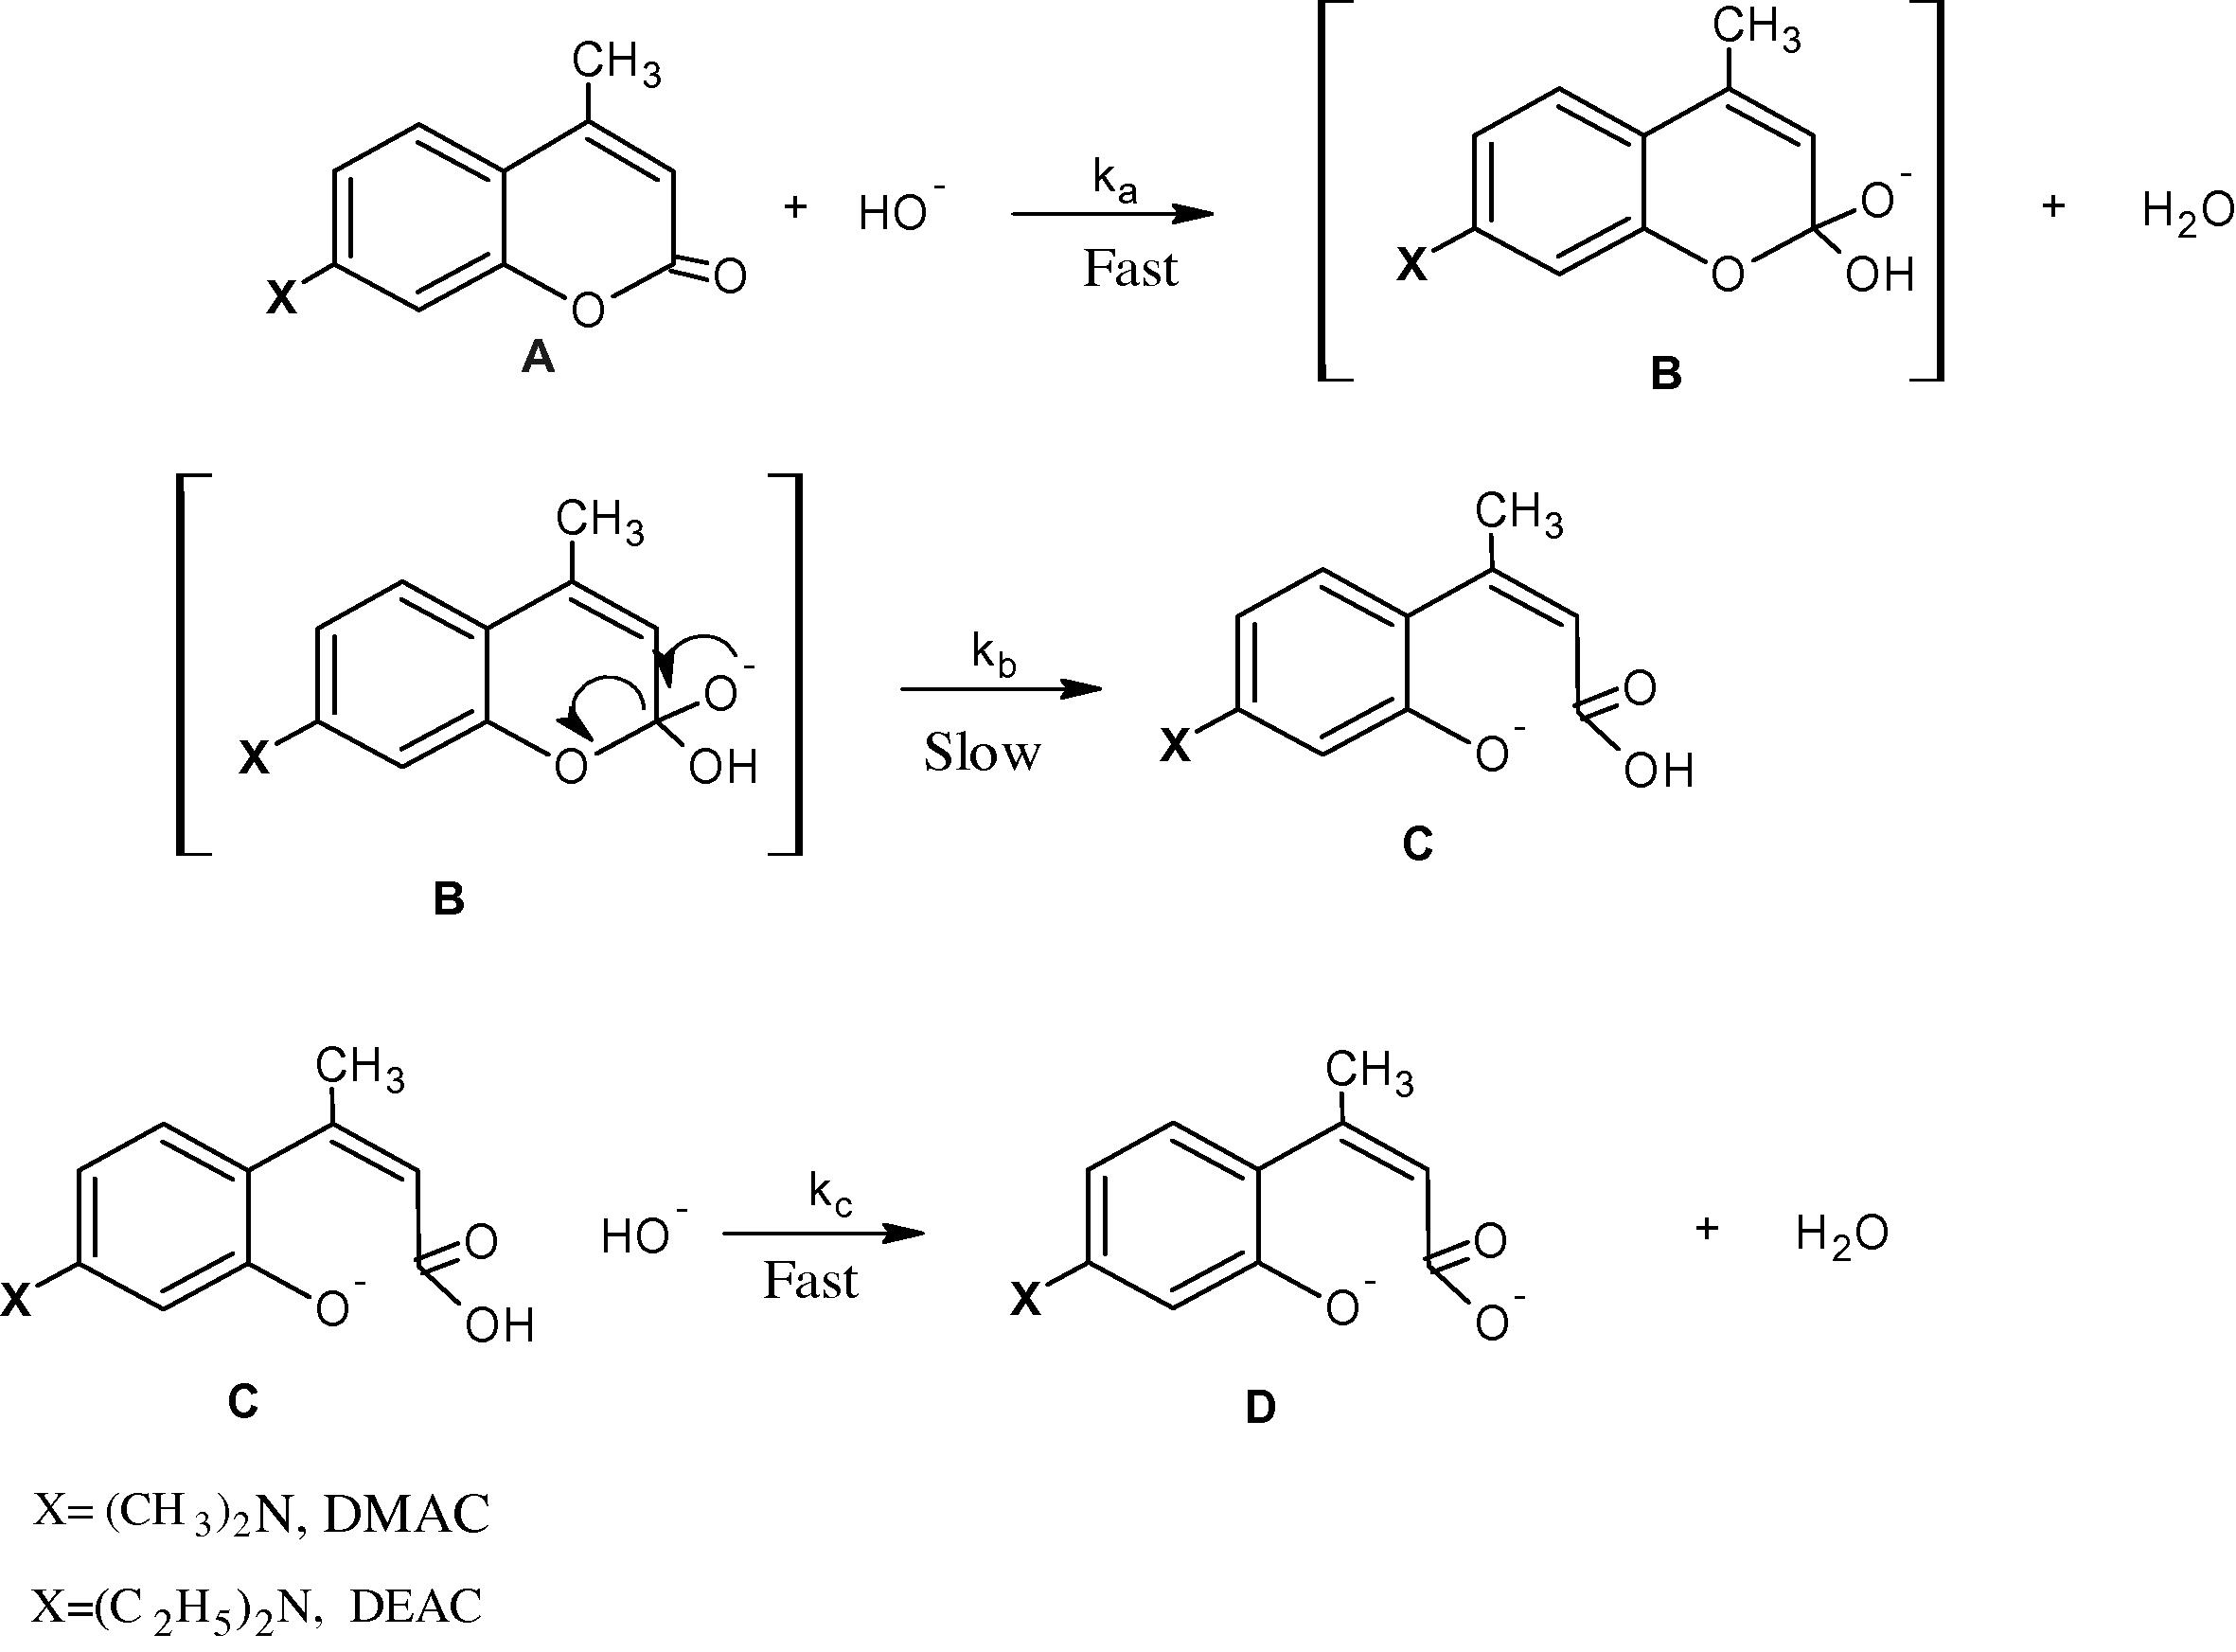
Suggested mechanism of the base hydrolysis of DMAC and DEAC.
The observed first-order rate constants (kobs) as a function of [OH−] and in the presence of different water–methanol and water–acetone ratios and values of k2 computed from least squares of kobs versus [OH−] plots using Microcal Origin program version 7.5 are reported in Tables 1 and 2 with maximum error 2%.
[OH−], mol dm−3
MeOH% (v/v)
0
10
20
40
50
60
103 kobs, s−1
0.20
1.51
1.23
0.98
0.61
0.47
0.35
0.25
1.87
1.52
1.21
0.75
0.58
0.42
0.30
2.25
1.82
1.42
0.87
0.74
0.52
0.35
2.70
2.13
1.62
1.05
0.87
0.63
0.40
3.00
2.35
1.85
1.16
0.94
0.74
0.45
3.37
2.67
2.10
1.31
1.07
0.81
103 k2 dm3 mol−1 s−1
7.79
5.84
4.54
2.76
2.38
1.90
δmΔG# kJ mol−1
0.72
1.34
2.78
2.92
3.50
[OH−], mol dm−3
MeOH% (v/v)
0
10
20
40
50
60
104 kobs, s−1
0.20
7.50
6.10
5.20
3.82
2.90
2.18
0.25
9.30
7.51
6.23
4.60
3.60
2.60
0.30
11.50
9.00
7.36
5.40
4.56
3.18
0.35
13.55
10.50
8.52
6.56
5.44
3.80
0.40
15.65
11.75
9.70
7.10
5.80
4.62
0.45
17.30
13.37
11.00
8.12
6.60
5.10
103 k2 dm3 mol−1 s−1
3.99
2.92
2.40
1.73
1.49
1.16
δmΔG# kJ mol−1
0.77
1.26
2.07
2.44
3.06
The value of kobs for the base-catalyzed hydrolysis reaction in aqueous organic solvent mixtures often increases markedly as the ratio of organic solvent increases. This trend can be attributed to the increase in transfer chemical potential for the hydrophilic hydroxide ion, δmμθ(OH−) as the solvent becomes less aqueous (Abu-Gharib et al., 2001). The base-catalyzed hydrolysis reactions of DMAC and DEAC are affected by the organic compound rather than by the OH− ions, and their kobs values decrease as the proportion of methanol or acetone increases (cf. Figs. 1 and 2). This can predominantly be ascribed to the salting out of the OH− ion.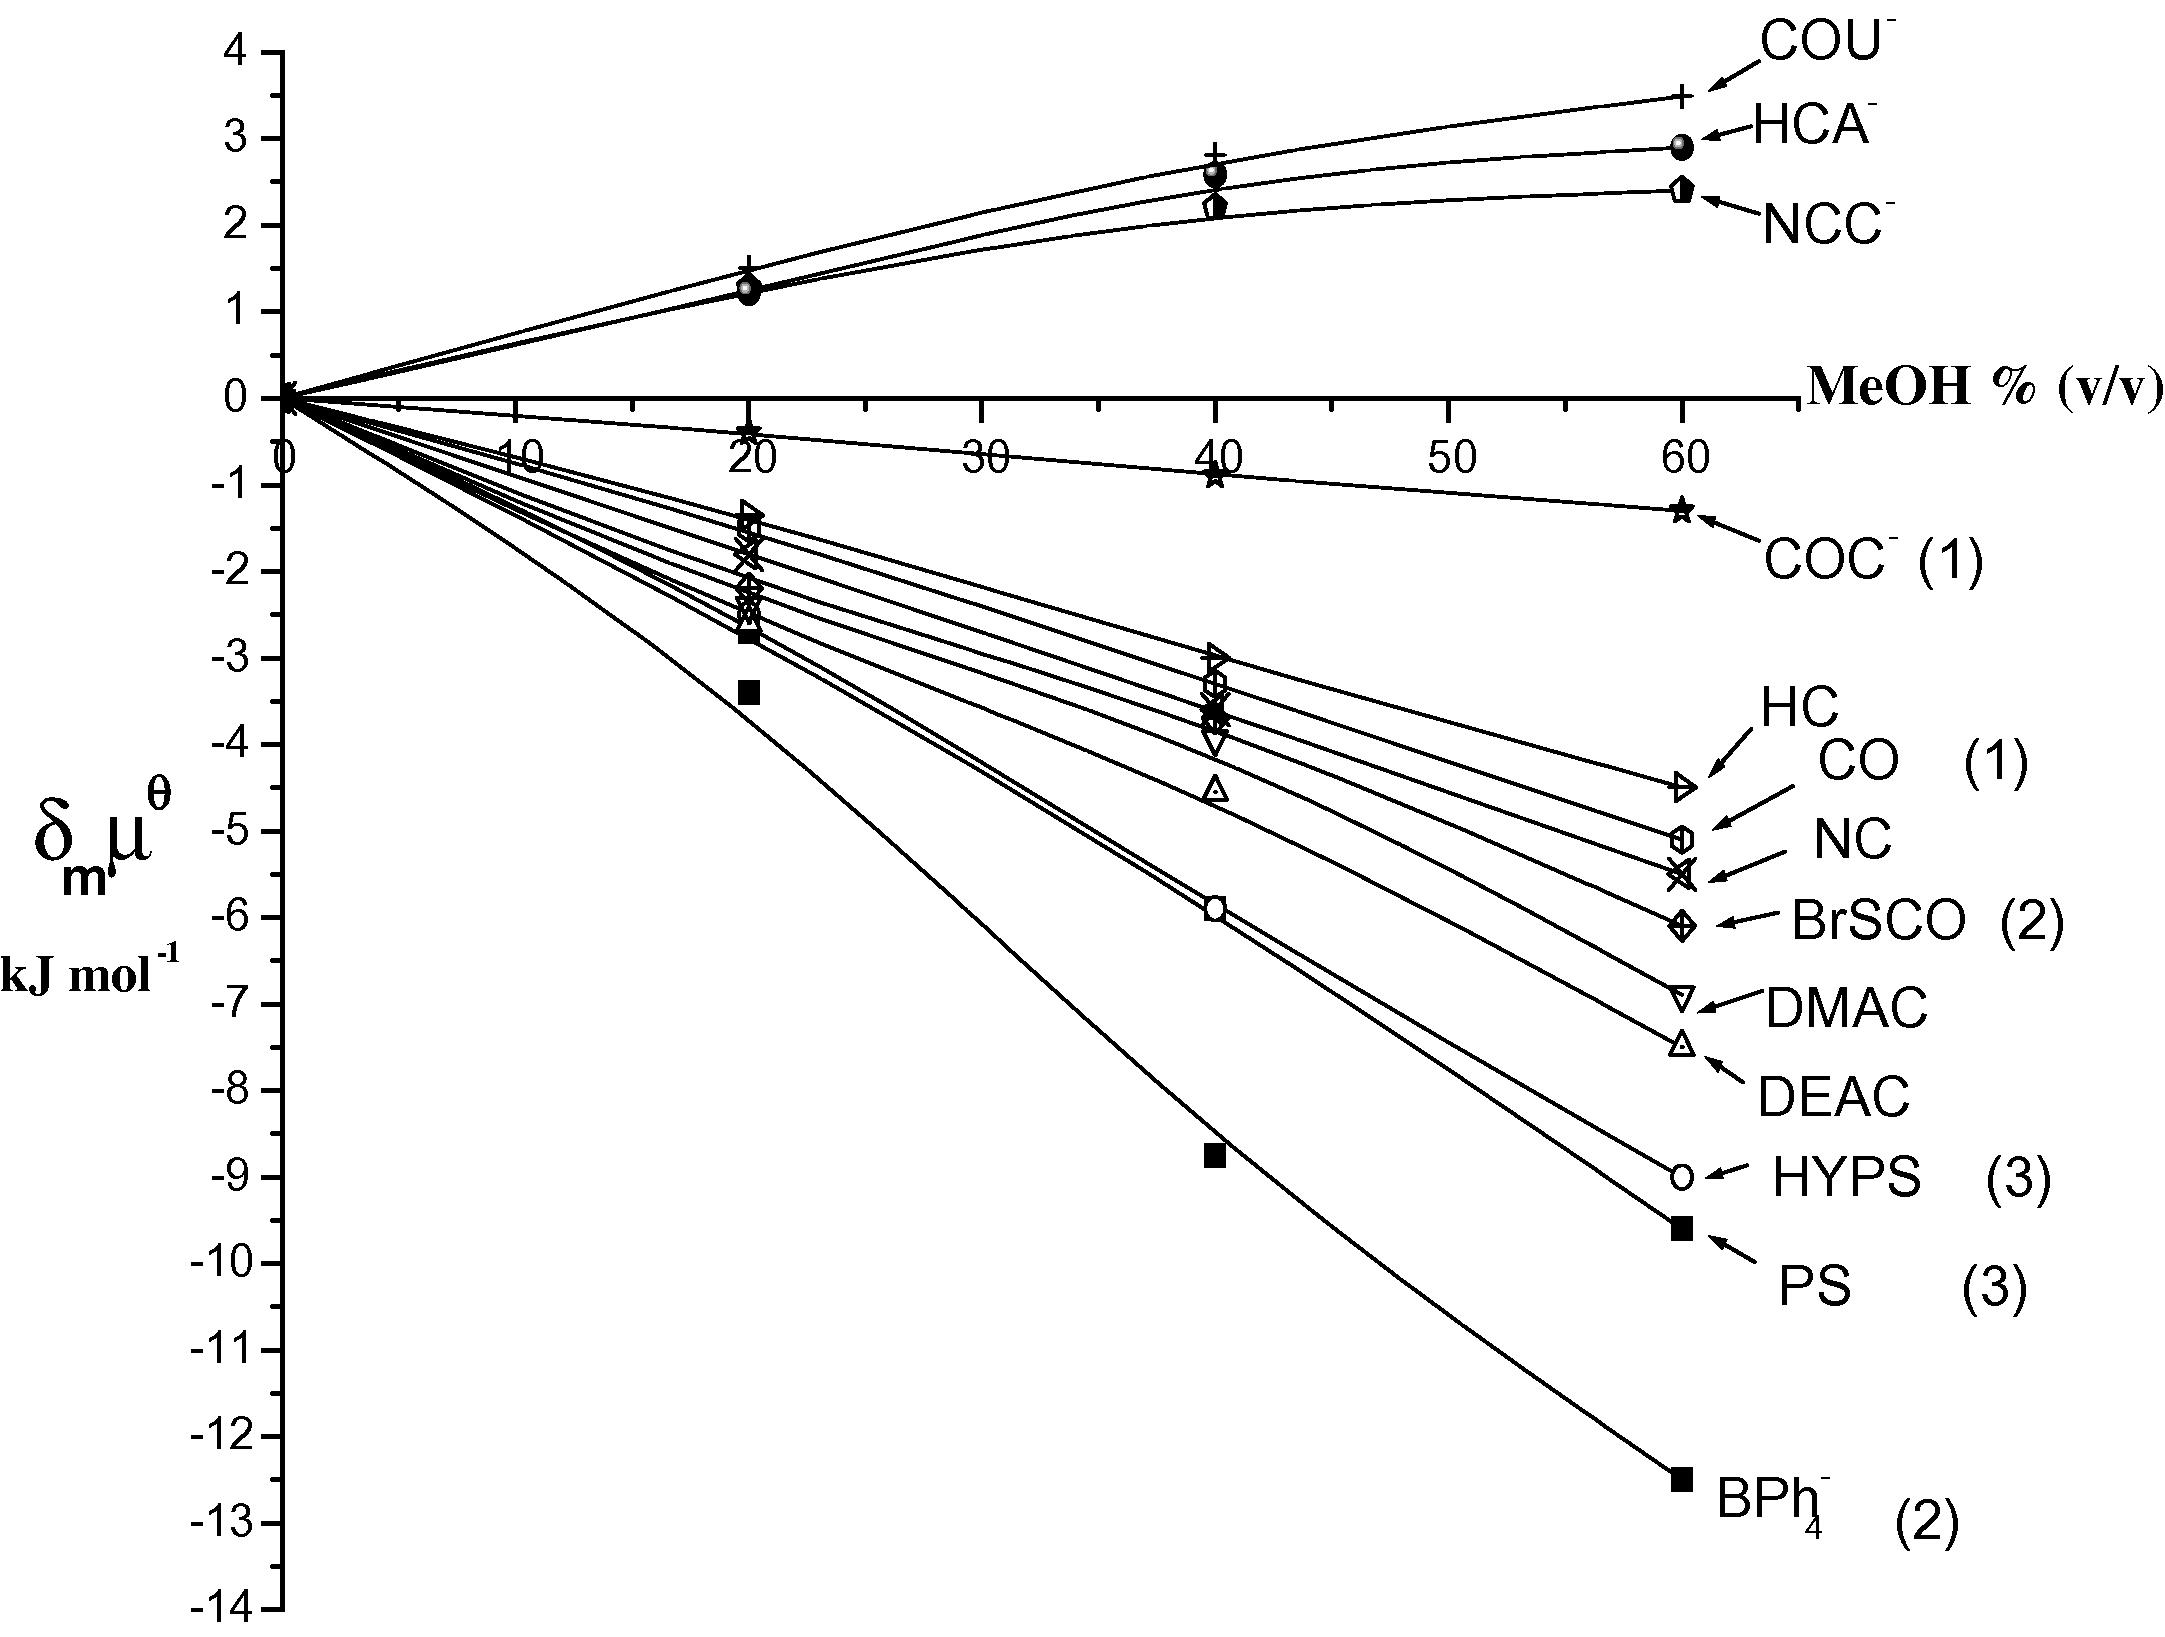
Transfer chemical potentials (kJ mol−1) from water into water–methanol vs. MeOH% (v/v) for various coumarin derivatives at 298 K. (CO = coumarin, BrSCO = 3-bromo thiocoumarin, COC- = coumarin-3-carboxylate, PS = psolaren (furocoumarin), HYPS = 8-hydroxy psolaren and
= tetraphenylborate.
The observed increase in second-order rate constant values as the percentage of solvent (v/v) increases in binary solvent mixtures can be ascribed mainly to the decrease in the free chromen-2-one derivative concentration due to the increase in dispersion forces in solvent molecules. The high delocalization of charge in DMAC and DEAC compounds promotes interaction with localized dispersion centers in nearby solvent molecules. This interaction is expected to increase in the following order water < methanol < acetone and stabilizes the studied compounds in the same direction. Furthermore, the transition state is more polar than the initial state that matches with the decrease in k2 values with increasing the ratios of co-organic solvent.
The observed enhancement of the rate constant values in acetone co-solvent compared with the corresponding values in methanol co-solvent would be ascribed to the destabilization of the hydrophilic OH− ions in acetone more than methanol (Abu-Gharib et al., 2011a; Hendersona and Hayward, 2012). Also this may be due to the steric effect which results from the size of solvent molecule allowing the OH− ions to penetrate the large acetone molecules more than the small methanol molecules.
The kinetic results conform to the latter Eq. (1)
Tables 1–4 show that the observed first-order rate constant of base-catalyzed hydrolysis of DMAC is much greater than the corresponding value for DEAC. This behavior could be attributed to the easier attack of OH− ion on the carbonium center in DMAC due to that the electron donating character of the dimethylamino group in DMAC is less than that of the diethylamino group in DEAC thus increasing the activity of the pyrone ring toward the attack of OH−. This trend has been indicated by the observed decrease in activation energy for the reaction with DMAC relative to the corresponding value for the reaction with DEAC (cf. Tables 1 and 2).
[OH−], mol dm−3
Ac% (v/v)
0
10
20
40
50
60
103 kobs, s−1
0.20
1.45
1.25
1.13
0.73
0.62
0.50
0.25
1.80
1.60
1.30
0.93
0.78
0.61
0.30
2.24
1.90
1.65
1.11
0.91
0.73
0.35
2.61
2.30
1.88
1.25
1.12
0.88
0.40
3.30
2.60
2.10
1.46
1.26
1.00
0.45
3.33
2.90
2.42
1.65
1.40
1.17
103 k2 dm3 mol−1 s−1
7.68
6.90
5.26
3.68
3.08
2.66
δmΔG# kJ mol−1
0.27
0.94
1.82
2.27
2.63
[OH−], mol dm−3
Ac% (v/v)
0
10
20
40
50
60
103 kobs, s−1
0.20
0.75
0.66
0.58
0.48
0.39
0.31
0.25
0.93
0.81
0.68
0.60
0.49
0.38
0.30
1.13
0.99
0.86
0.70
0.56
0.46
0.35
1.31
1.17
0.98
0.82
0.69
0.54
0.40
1.51
1.32
1.13
0.92
0.78
0.63
0.45
1.66
1.48
1.27
1.05
0.87
0.73
103 k2 dm3 mol−1 s−1
3.95
3.37
2.81
2.30
1.92
1.66
δmΔG# kJ mol−1
0.39
0.84
1.34
1.79
2.15
3.2 Effect of hydrophilic/hydrophobic character of the studied coumarin derivatives on their solubilities
The hydrophobic character of the studied compounds can be deduced from the values of transfer chemical potentials of 7-dimethylamino-4-methyl-2H-chromen-2-one (DMAC), 7-diethylamino-4-methyl-2H-chromen-2-one (DEAC) (cf. Fig. 2). Furthermore, the following figure presented a comparison between the hydrophilic/hydrophobic character of the investigated compounds and the compounds in the literatures.
The results of transfer chemical potentials of single ion of HCA−, NCC−, COU− anions and none charged compounds (HC, NC, DMAC and DEAC) in Fig. 2 can mainly be rationalized in terms of hydrophilic/hydrophobic nature of compound. Hydrophobic nature of compounds such as tetraphenylbronate ( ), psolaren (PS) and 8-hydroxypsolaren (HYPS) leads to stabilization of the compound with increasing methanol%. Thus, is the most hydrophobic one due the four phenyl groups. The furan ring in PS and HYPS is considerably more hydrophobic than the diethylamino group in DEAC.
The order of hydrophobicity can increase in the direction > PS > HYPS > DEAC > DMAC > BrSCO > NC > CO > HC, thus the results show preferential solvation by methanol as molecule size increases.
Although the size of HYPS is more than PS, PS is more hydrophobic than HYPS. This can be attributed to the hydrophilic character of the hydroxyl group in HYPS.
Fig. 2 shows that the high stabilization of 3-bromothiocoumarin compared with NC as the proportion of methanol increases. This is because the sulphur atom is more hydrophobic than oxygen atom.
The less stabilization of HC compared with coumarin could be attributed to the hydrophilic nature of the hydroxyl group in HC.
In contrast hydrophilic nature such as HCA−, NCC− and COU− anions leads to destabilization as methanol or acetone content increases.
The order of hydrophilicity for anions is COU− > HCA− > NCC−. This trend can be attributed to the order of size of these anions which is COU− < HCA− < NCC.
3.3 Initial state-transition state analysis
The influence of solvent composition on the rate constant was analyzed in terms of initial and transition states. This approach provides complementary information on the role of the solvation and how transition state modeling can assist in interpretation. Solvent effects on the rate constants reflect solvation changes on the initial and transition states as these are transferred from water into mixed aqueous methanol or aqueous acetone media. If solvent effects on the initial state can be established from thermodynamic data (solubility data), then solvent effects on the transition state can be calculated from initial state and kinetic data assuming constancy of mechanism and validity of transition state theory.
The values of the transfer chemical potentials of OH− ion in methanol are obtained from references (Abu-Gharib et al., 2011b) and for OH− ion in acetone from references (Abu-Gharib et al., 2011b; Marcus, 2007).
The change in second order rate constant on going from water to medium (aqueous–methanol or aqueous–acetone mixtures) of mole fraction x2, δmΔG# will be equal to ΔG#(x2) minus ΔG#(x2 = 0).
The free energies of activation and transfer chemical potentials are now used in the analysis of reactivity trends with changing solvent composition into initial state and transition state components, i.e., combination of kinetic data, solubility data and transfer chemical potentials yield the effect of solvent on the transition state according to Eq. (3).
The effect of added organic solvent on the rate constants of the base hydrolysis of the studied compounds can be understood in terms of the impact of co-solvent on reference chemical potentials of these ions and the transition state δmμ#. The effect of added co-solvents is described by Eq. (4):
Compound
MeOH%
105 Soly mol dm−3
δmμθ DMAC) kJ mol−1
δmμθ (OH−) kJ mol−1
δmμθ (IS) kJ mol−1
δmΔG# kJ mol−1
δmμθ (TS) kJ mol−1
DMAC (Є = 22,700 dm3 mol−1 cm−1 at λmax = 373 nm)
0
10.95
20
28.80
−2.40
−0.20
−2.60
1.34
−1.26
40
53.80
−3.94
0.10
−3.84
2.78
−1.06
60
177.00
−6.90
1.60
−5.30
3.50
−1.80
DEAC (Є = 23,550 dm3 mol−1 cm−1 at λmax = 383 nm)
0
9.45
20
26.76
−2.60
−0.20
−2.80
1.26
−1.54
40
59.30
−4.55
0.10
−4.45
2.07
−2.38
60
195.00
−7.50
1.60
−5.90
3.06
−2.81
Compound
Ac%
105 Soly mol dm−3
δmμθ DMAC) kJ mol−1
δmμθ (OH−) kJ mol−1
δmμθ (IS) kJ mol−1
δmΔG# kJ mol−1
δmμθ (TS) kJ mol−1
DMAC (Є = 22,700 dm3 mol−1 cm−1 at λmax = 373 λnm)
0
11.01
20
50.60
−3.78
1.64
−2.14
0.94
−1.2
40
103.65
−5.56
2.45
−3.11
1.82
−1.29
60
226.00
−7.49
3.00
−4.49
2.63
−1.86
DEAC (Є = 23,550 dm3 mol−1 cm−1 at λmax = 383 λnm)
0
9.55
20
48.36
−4.02
1.64
−2.38
0.85
−1.53
40
109.90
−6.05
2.45
−3.60
1.34
−2.26
60
333.00
−8.80
3.00
−5.80
2.15
−3.65
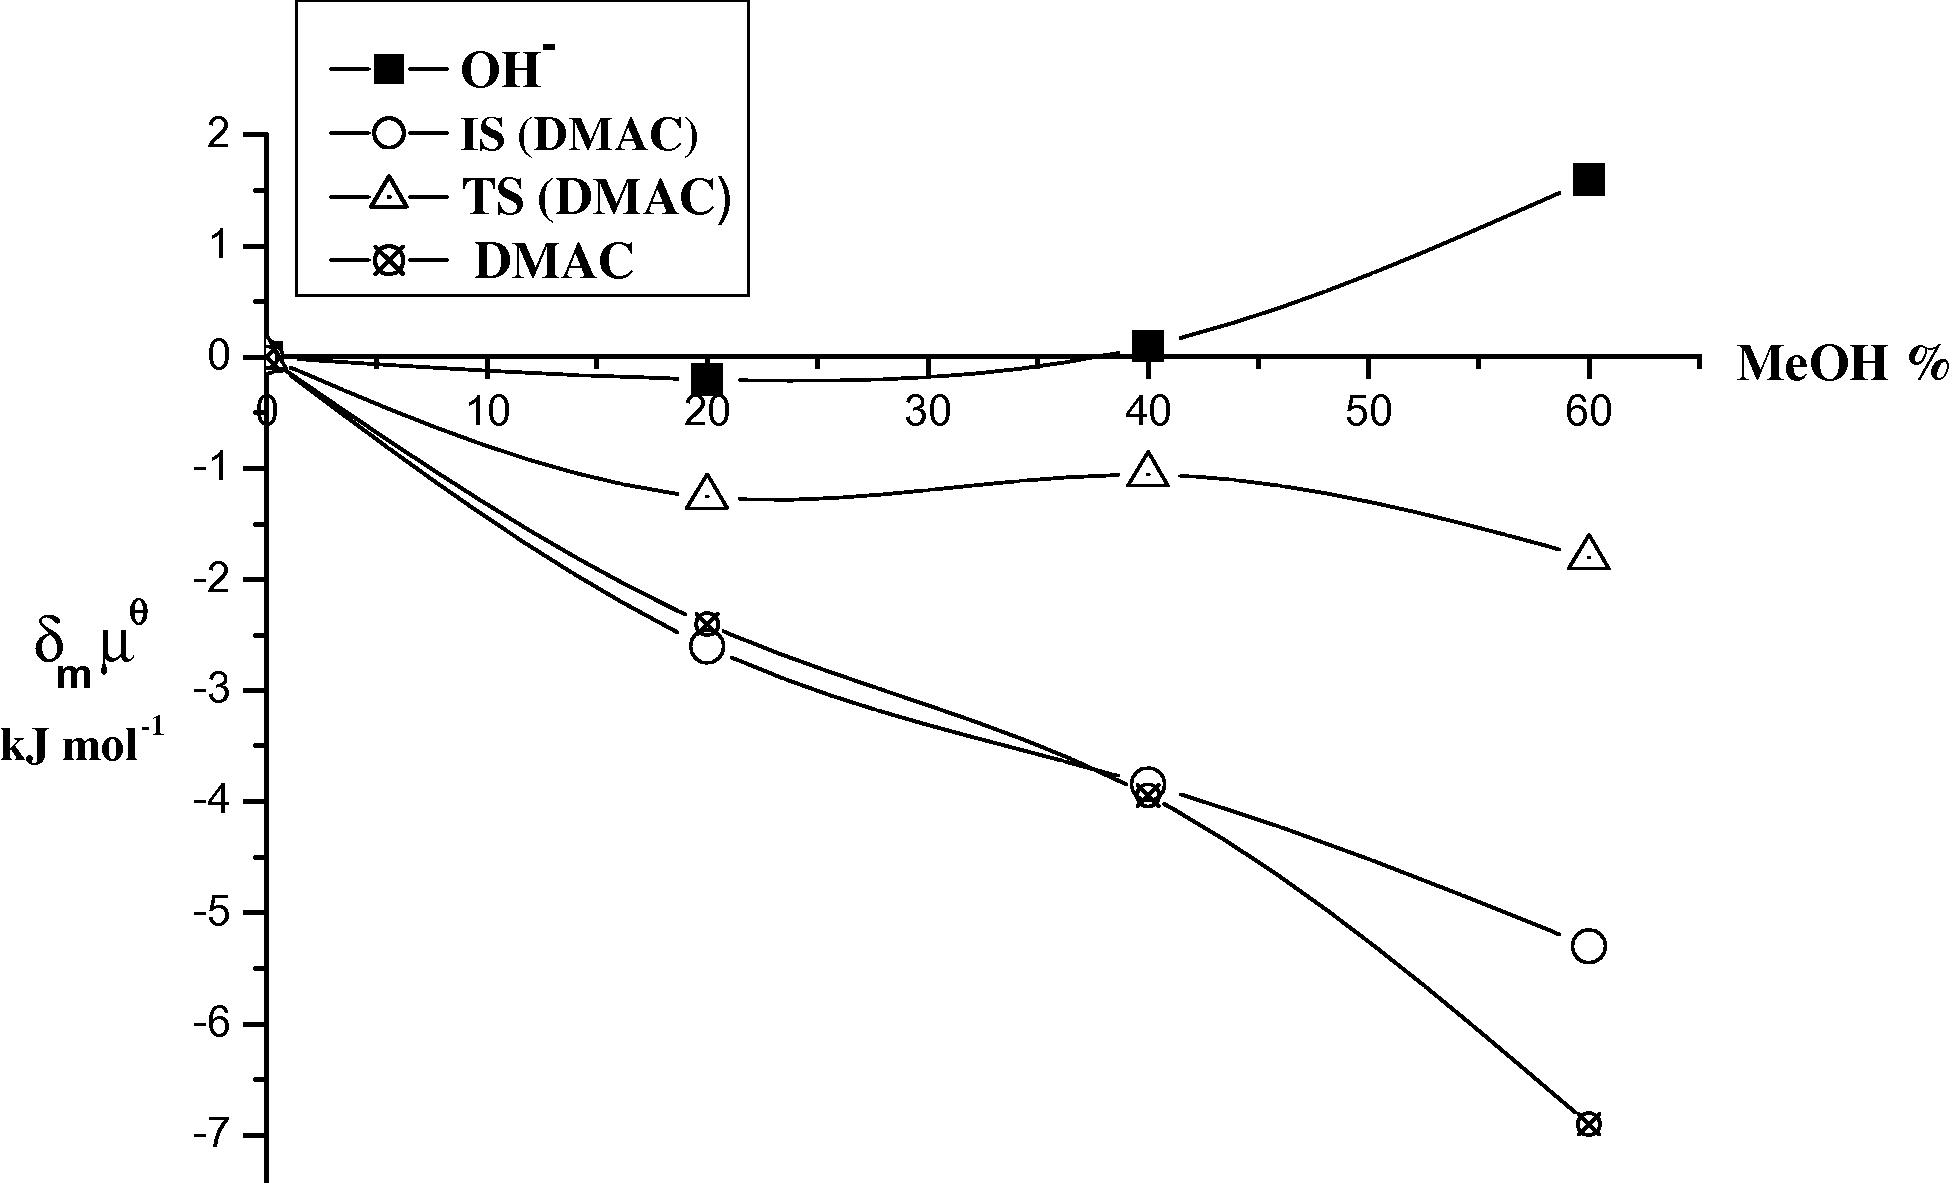
Plots of the initial state (IS) and transition state (TS) for the base hydrolysis of DMAC in different ratios (v/v) of MeOH at 298 K.
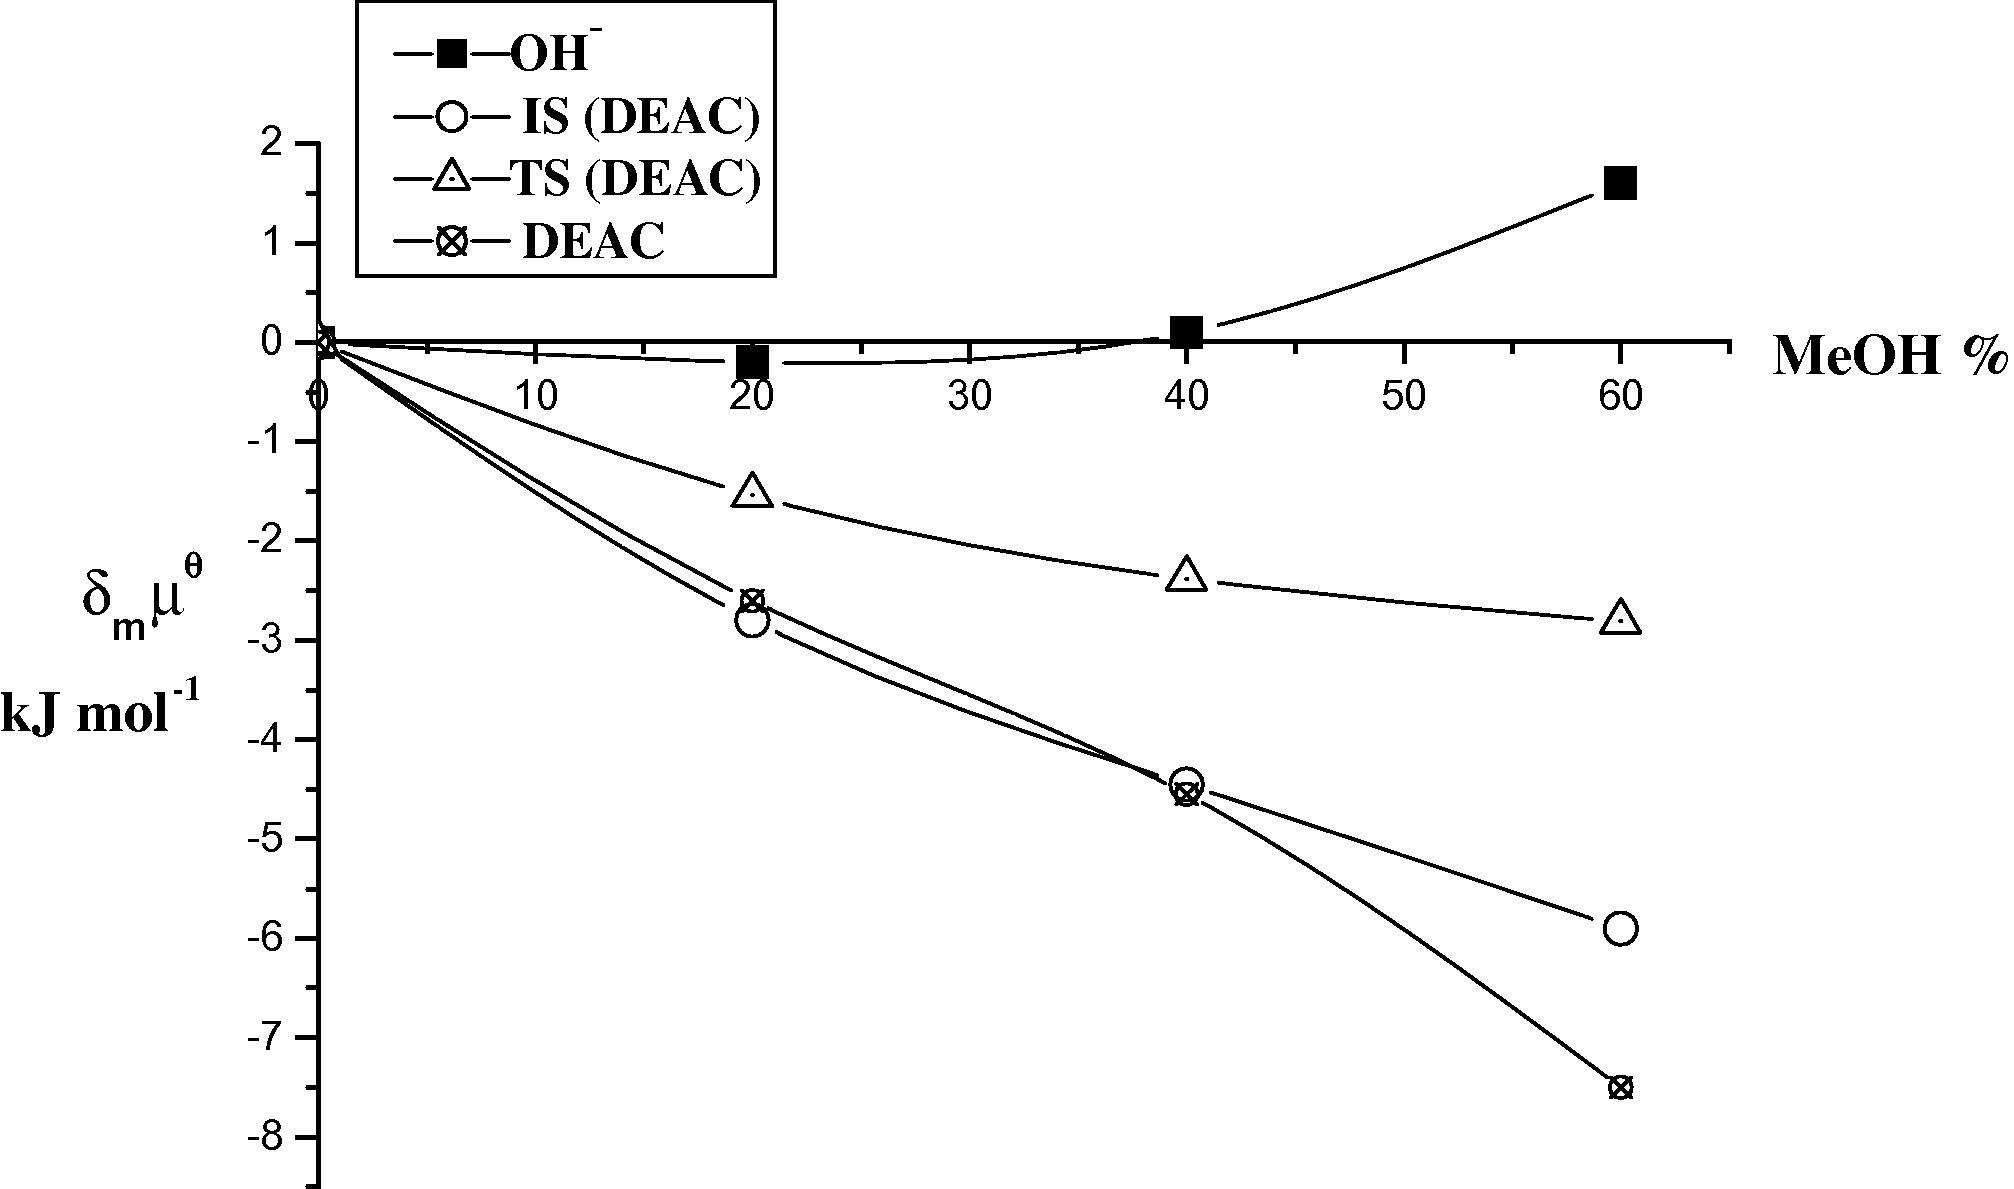
Plots of the initial state (IS) and transition state (TS) for the base hydrolysis of DEAC in different ratios (v/v) of MeOH at 298 K.
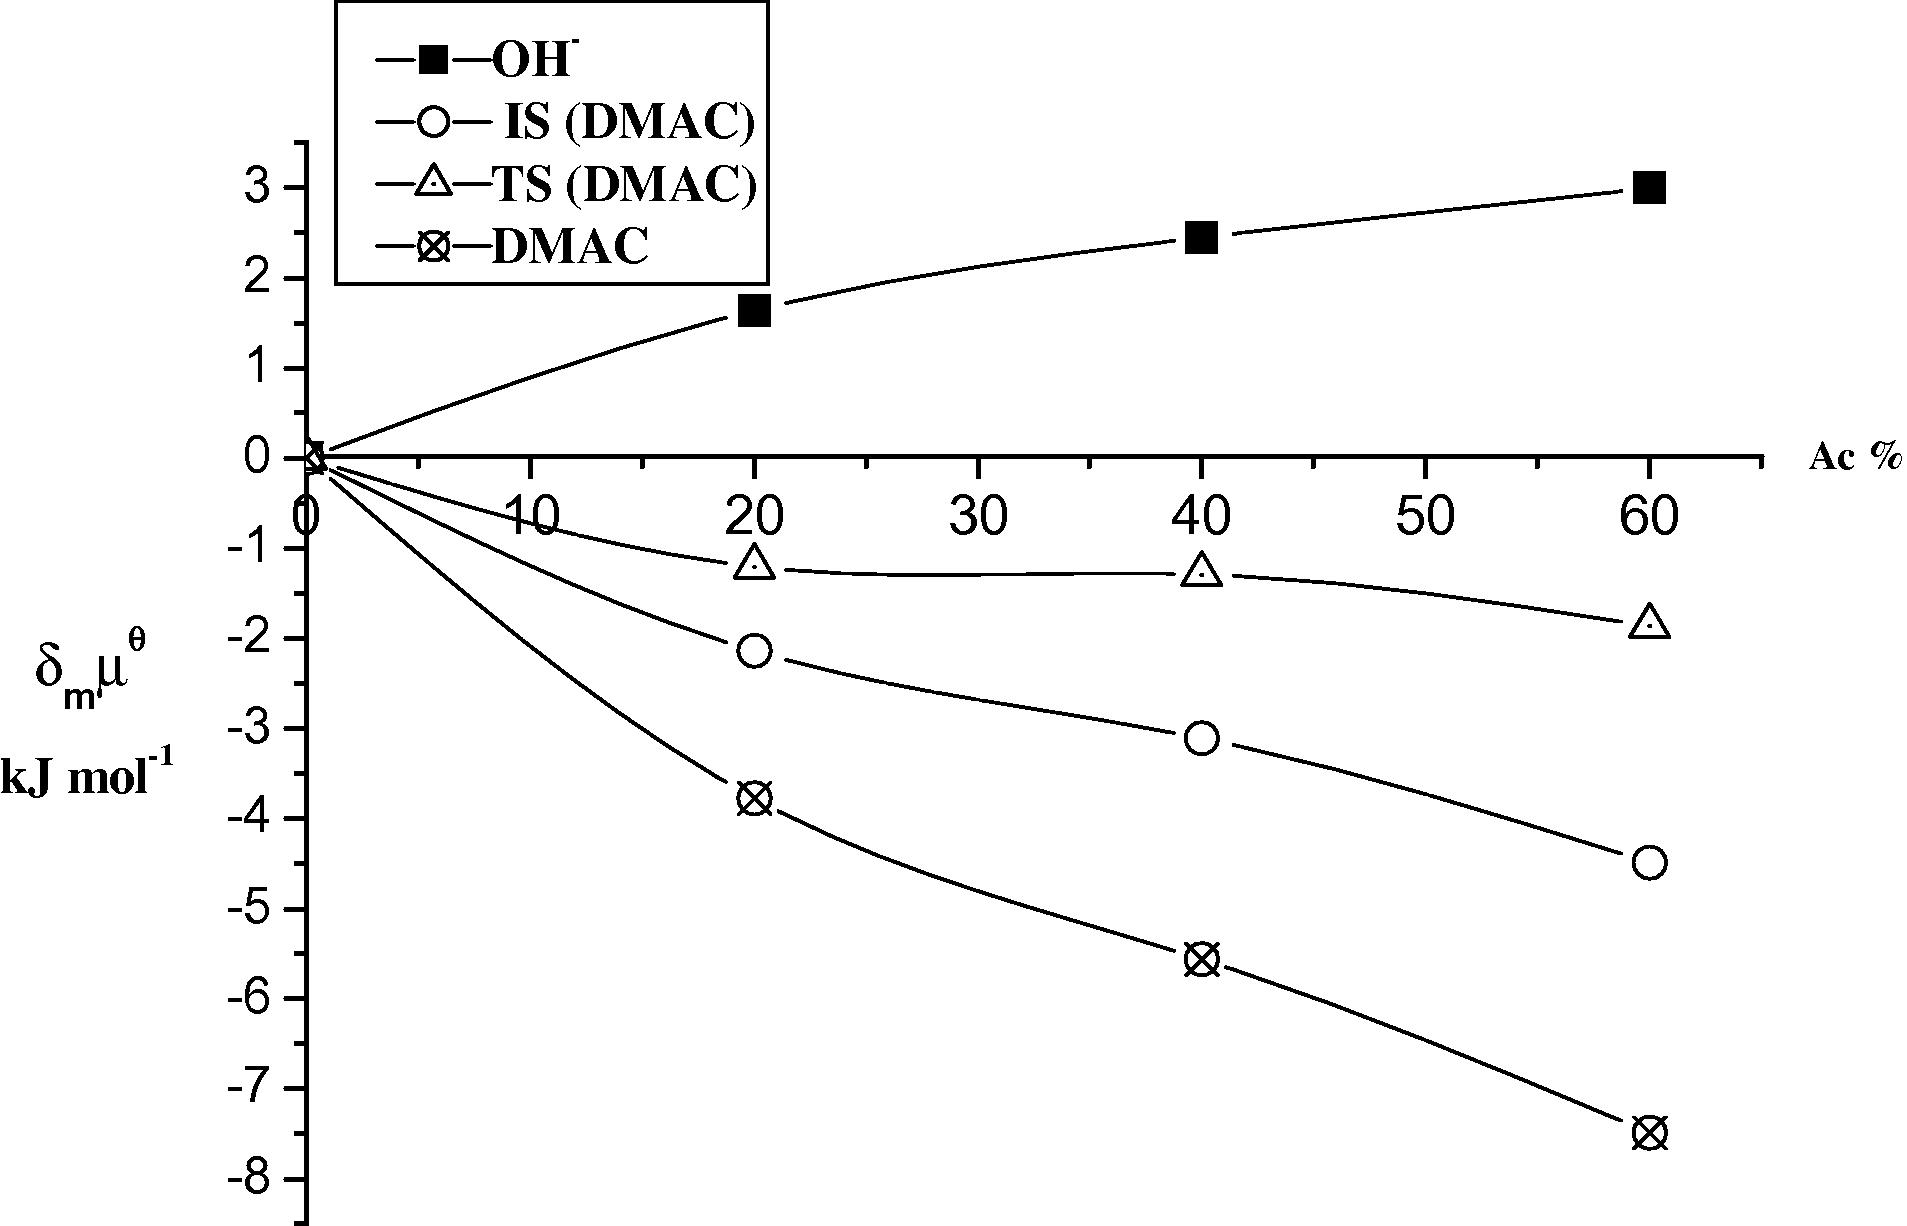
Plots of the initial state (IS) and transition state (TS) for the base hydrolysis of DMAC in different ratios (v/v) of Ac at 298 K.
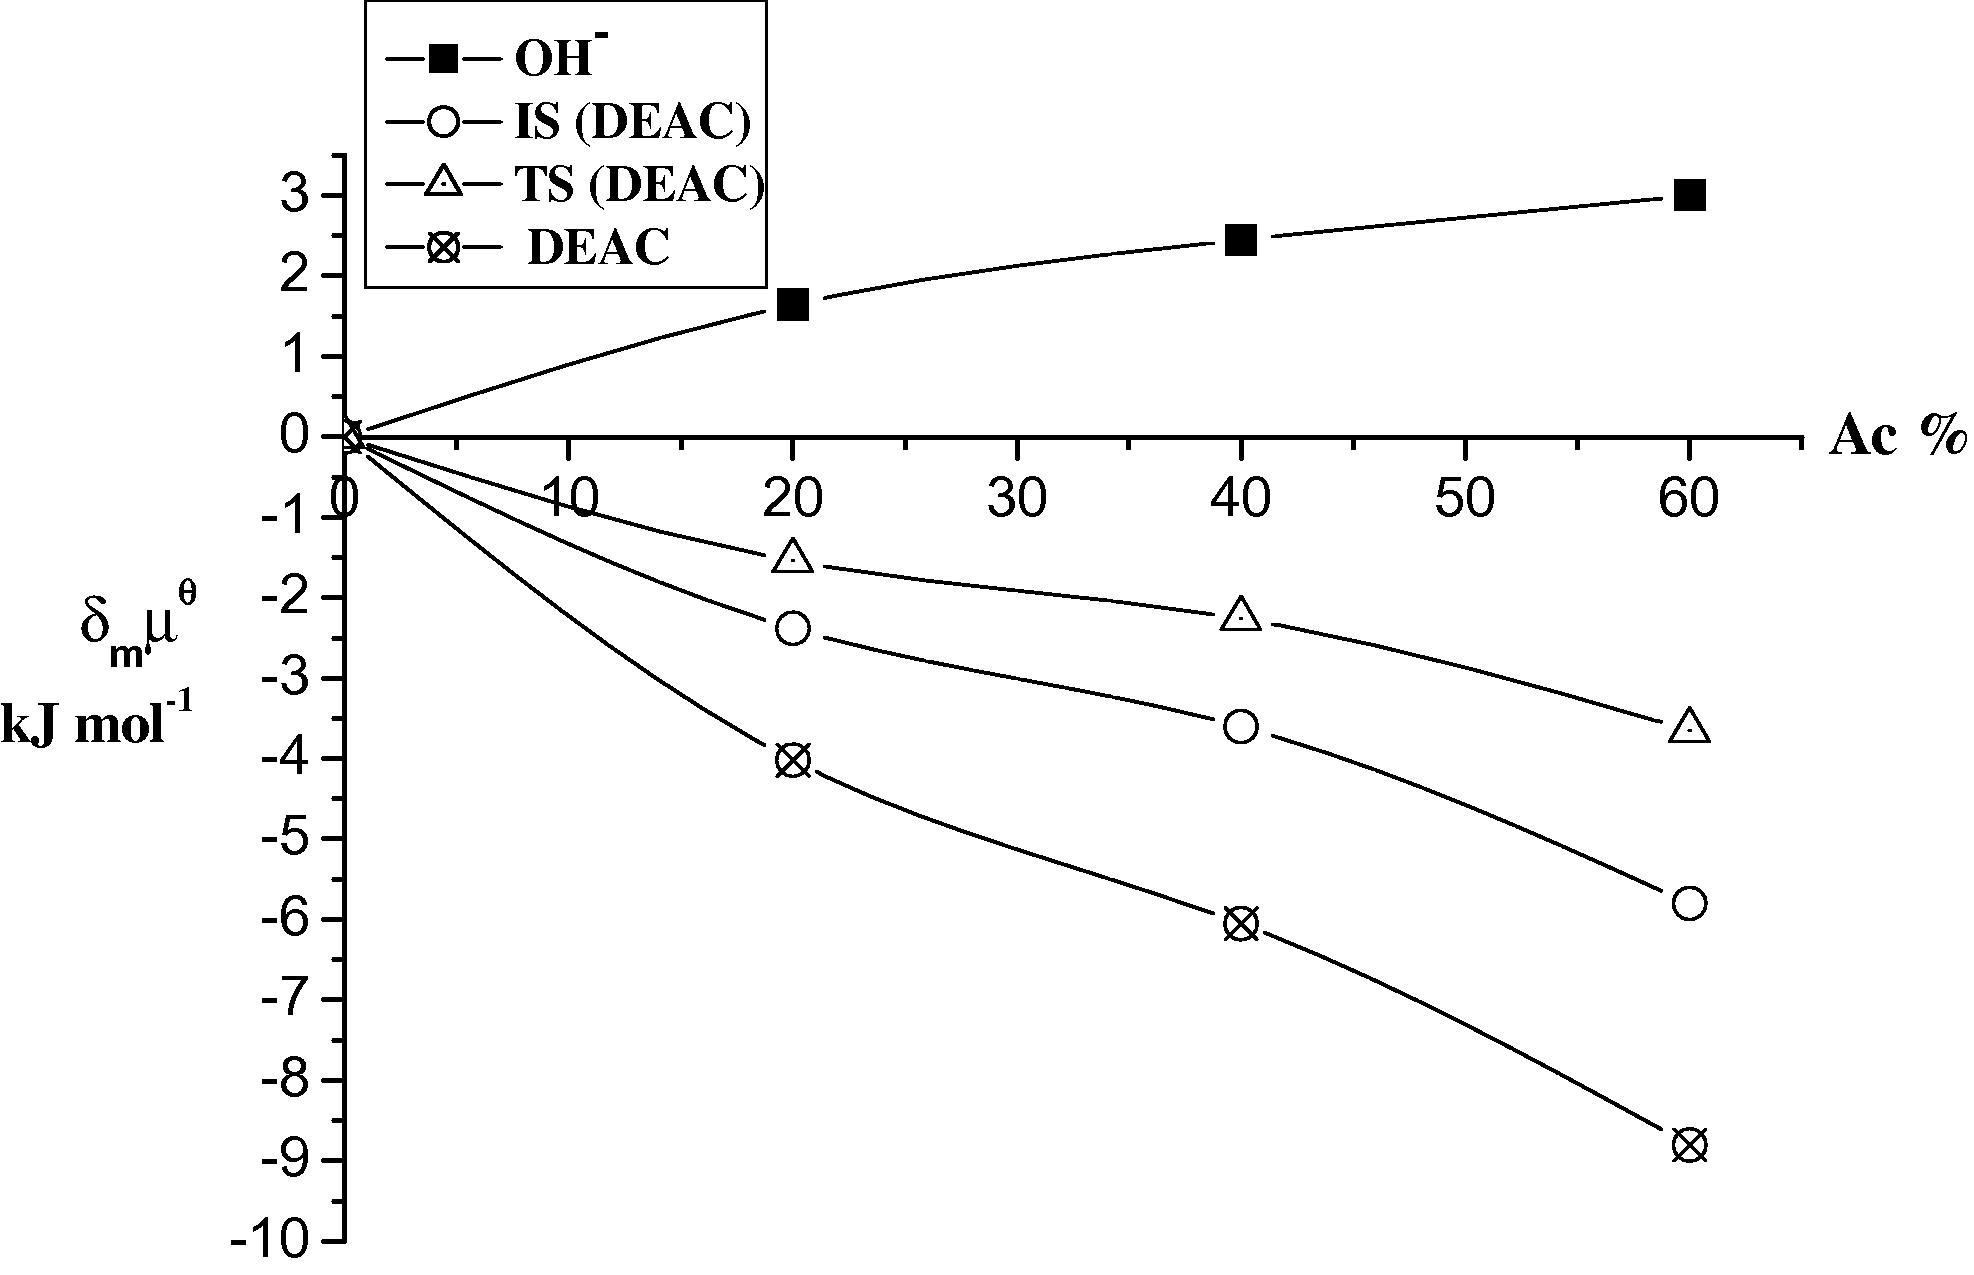
Plots of the initial state (IS) and transition state (TS) for the base hydrolysis of DEAC in different ratios (v/v) of Ac at 298 K.
The results in Tables 5 and 6 and Figs. 3–6 show that DMAC and DEAC are markedly stabilized and the hydroxide ion is slightly destabilized on transfer from water to 60% methanol resulting in an overall increase in stabilization of the initial state. On the other hand the transition state is only slightly destabilized on going from water to 60% methanol. Thus, the observed decrease in the rate constant can be attributed to high stabilization of the initial state, rather than to less stabilization of the transition state i.e., the dominant effect of (IS) on the rate constant of the base hydrolysis of DMAC and DEAC as the co solvent methanol% increases.
4 Conclusion
Base-catalyzed hydrolysis of DMAC and DEAC was kinetically investigated in different binary aqueous–organic solvent mixtures at 298 K. The base hydrolysis reaction of the investigated compounds follows a rate law with kobs = k2[OH−]. The decrease in the rate constants of DMAC and DEAC as the proportion of methanol or acetone increases is due to the destabilization of OH− ion. The values of rate constants (kobs and k2) decrease in the following order water > acetone > methanol with increasing the methanol or acetone content. The decrease in the observed rate constant values (kobs) of the base hydrolysis of DMAC and DEAC with increasing of methanol% or acetone% is dominated by the initial state (IS).
References
- UV/Vis spectroscopic behaviour of some new hydroxy azocoumarin derivatives. Mon. für Chemie. 1997;128:553-561.
- [Google Scholar]
- Kinetics of base hydrolysis of low-spin Iron(II)-diimine complexes in methanol-water mixtures. CCACAA. 2001;74(3):545-558.
- [Google Scholar]
- Initial state and transition state contributions to reactivity trends of base-catalyzed hydrolysis of some nitro chromen-2-one derivatives. Z. Phys. Chem. 2011;225(2):235-248.
- [Google Scholar]
- Kinetics of base hydrolysis of some chromen-2-one indicator dyes in different solvents at different temperatures. J. Korean Chem. Soc.. 2011;55:346-351.
- [Google Scholar]
- 2H-chromene derivatives bearing thiazolidine-2,4-dione, rhodanine or hydantoin moieties as potential anticancer agents. Eur. J. Med. Chem.. 2012;59C:15-22.
- [Google Scholar]
- The synthesis and characterization of novel soluble phthalocyanines substituted with 7-octyloxy-3-(4-oxyphenyl)coumarin moieties. Dyes Pigment. 2008;77:165-170.
- [Google Scholar]
- Dall’Acqua, F., Vedaldi, D., Caffieri S., 1996. In: Hönigsmann, H., Jori, G., Young, A.R. (Eds.), The Fundamental Bases of Phototherapy, pp. 1–16.
- Drexhage, K.H., 1977. Dye lasers. In: Schafer, F.P., (Ed.), Topics in Applied Physics second revised edition, Vol. 1, Springer, Berlin, pp. 144–192.
- The pharmacology, metabolism, analysis, and applications of coumarin and coumarin-related compounds. Drug Metab. Rev.. 1990;22(5):503-529.
- [Google Scholar]
- Synthesis of some new benzocoumarin heterocyclic fluorescent dyes. Rev. Chim.. 2011;62(11):1098-1101.
- [Google Scholar]
- Kinetic stabilities of bis-terpyridine complexes with iron(II) and cobalt(II) in organic solvent environments. J. Mater. Chem.. 2012;22:21366-21369.
- [Google Scholar]
- Protection of coumarins against linoleic acid hydroperoxide-induced cytotoxicity. Chem. Biol. Interact.. 2003;142:239-254.
- [Google Scholar]
- Coumarin based bioactive compounds: facile synthesis and biological evaluation of coumarin fused 1,4 thiazepines. Chem. Biol. Drug Design. 2011;78(4):580-586.
- [Google Scholar]
- Highly cis-diastereo selective synthesis of coumarin-based 2,3-disubstituted dihydrobenzothiazines by organo catalysis. Helv. Chim. Acta. 2012;95(4):660-671.
- [Google Scholar]
- Synthetic and natural coumarins as cytotoxic agents. Curr. Med. Chem, Anti-Cancer Agents. 2005;5:29-46.
- [Google Scholar]
- The synthesis, spectroscopic properties and X-ray structure of Zn(II) complexes with amino derivatives of chromone. Polyhedron. 2011;30(6):1177-1184.
- [Google Scholar]
- Gibbs energies of transfer of anions from water to mixed aqueous organic solvents. Chem. Rev.. 2007;107(9):3880-3897.
- [Google Scholar]
- Synthesis and evaluation of the antioxidant and anti-inflammatory activity of novel coumarin-3-aminoamides and their alpha-lipoic acid adducts Euro. J. Med. Chem.. 2009;44:3020-3026.
- [Google Scholar]
- Ojala, T., 2001. Biological screening of plant coumarins (M.Sc. thesis). University of Helsinki, Finland.
- Synthesis and reactions of stabilized phosphorus Ylides. Curr. Org. Chem.. 2008;12:59-82.
- [Google Scholar]
- Pathways of coagulation/fibrinolysis activation in malignancy. Semin. Thromb. Hemost.. 1992;18:104-116.
- [Google Scholar]
- Substituent and solvent effects on the photo-physical properties of some coumarin. Spectrochim. Acta A Mol. Biomol. Spectrosc.. 2010;77(2):337-341.
- [Google Scholar]
- Synthesis of functionalized furo[3,2-c]coumarins via a one-pot oxidative pseudo three-component reaction in poly(ethylene glycol) Tetrahedron. 2012;68:6721-6726.
- [Google Scholar]


