Translate this page into:
Optimization and strain improvement by mutation for enhanced cellulase production by Bacillus sp. (MTCC10046) isolated from cow dung
*Corresponding author. Tel.: +91 (0342) 2659493 (R), mobile: +91 9434167047; fax: +91 (0342) 2564452 tkmbu@yahoo.co.in (Tushar Kanti Maiti)
-
Received: ,
Accepted: ,
This article was originally published by Elsevier and was migrated to Scientific Scholar after the change of Publisher.
Available online 19 June 2014
Peer review under responsibility of King Saud University.

Abstract
The goal was to investigate the cellulase enzyme production ability of bacterial strain C1 isolated from cow dung and identified as Bacillus sp. on the basis of 16 S rDNA sequence homology. The effects of different carbon sources like Carboxymethyl cellulose (CMC), avicel, starch, maltose, sucrose, glucose, fructose, galactose and lactose on cellulase production at varying environmental parameters of incubation period (2–10 days), temperature (35–55 °C), and pH (6.0–8.5) were examined. The CMC was the best carbon source for cellulase production followed by lactose in this bacterial strain. The maximum enzyme production was achieved at a temperature of 50 °C by Bacillus sp. with pH of 7.0 on the 8th day of growth. The nitrogen source NH4NO3 at 0.175% was optimum for cellulase production by this bacterium. A putative mutant (C1M26) was screened from wild C1 strain after mutagenesis with N-methyl-N′-nitro-N-nitrosoguanidine (NTG) as a mutagenic agent. The mutant C1M26 produced a larger amount of cellulase in comparison to wild type C1 strain.
Keywords
Avicelase
β-Glucosidase
Carboxymethyl cellulase (CMCase)
Lactose
1 Introduction
Cellulose is the most abundant renewable natural product in the biosphere with an estimated annual production of 4.0 × 10⁷ tons (Bekare et al., 2005). It is a linear homopolysaccharide consisting of glucose residues joined with β-1, 4-glycosidic linkage. The cellulosic biomass can be hydrolyzed to fermentable sugars by cellulolytic enzymes to produce bioethanol (Fang et al., 2008). A cellulosic enzyme system consists of three major components: endo-β-glucanase (EC 3.2.1.4), exo-β-glucanase (EC 3.2.1.91) and β-glucosidase (EC 3.2.1.21).
The cellulases have a central role in the bioconversion of abundant renewable cellulosic biomass to commodity chemicals (Himmel et al., 1999). It has got very high biotechnological potential for applications in different industries, such as food, brewery, wine, pulp and paper, textile, detergent, feed and agriculture (Bhat, 2000). However, cost of cellulase enzyme and their stability are the major factors for their uses. Cellulases are used in cotton preparations, wool and dyeing treatment. Due to their vast applications and ever increasing demand, novel cellulases with better process suitability, high specific activity, better specificity and stability are being discovered from new lineages of cellulolytic organisms. Majority of studies on cellulase production have been focused on fungi for simpler structure with a lesser emphasis on bacterial sources (Bhat, 2000). However, bacterial cellulase are often more complex and expressed in multi-enzyme complexes providing increased function and synergy. Most importantly, bacteria inhabit a wide variety of environmental and industrial niches, which produce cellulolytic strains that are extremely resistant to environmental stresses viz. these are thermophilic or psychrophilic, alkaliphilic or acidophilic. So these strains are able to survive in the harsh conditions, they often produce enzymes that are stable under extreme stress conditions for bioconversion process. The wide variety of bacteria in the environment permits screening for more efficient cellulases to help overcome current challenges in application of this enzyme. The source of this cellulose enzyme system is best suitable from enriched microflora found in the gut of organisms thriving on lignocellulosic biomasses as their major feed.
There is increasing interest in cellulase production by bacteria such as Anoxybacillus flavithermus EHP1 (Ibrahim and Ahmed, 2007), Streptomyces sp. (Chellapandi and Himanshu, 2008), Thermomonospora (George et al., 2001), Microbacterium sp. (Sadhu et al., 2011), Streptomyces transformant T3-1 (Jang and Chen, 2003), Streptomyces sp. F2621 (Tuncer et al., 2004), Clostridium papyrosolvens (Thirumale et al., 2001), Acidothermus cellulolyticus (Shiang et al., 1991), Bacillus sp. (Heck et al., 2002; Bajaj et al., 2009; Acharya and Choudhury, 2011; Sadhu et al., 2013), Pseudomonas sp. (Bekare et al., 2005), Cellulomonas sp. (Sangkharak et al., 2012), Bosea sp. (Sadhu et al., 2012) Streptomyces griseorubens (Prasad et al., 2013).
We have isolated a bacterial strain from the fecal matter of cow which might be present as gut micro flora capable of producing cellulase designated as C1 strain and it was identified by 16 S rDNA sequence based homology. The present study envisaged the optimization of carbon source, nitrogen source and cultural condition for cellulase production by the isolated C1 strain. The possible mechanism of synergism among Carboxymethyl cellulose (CMC) with lactose for cellulase production is also discussed. Strain improvement for cellulase production was also made by isolation of mutants using N-methyl-N-nitro-N-nitrosoguanidine (NTG).
2 Materials and methods
2.1 Isolation and screening of cellulase producing bacteria
The cow dung samples were collected from the village of Burdwan district, West Bengal, India, in plastic bags by sterilized spatula and stored in an ice box for approximately 12 h. It was brought to the laboratory for isolation of cellulolytic bacteria. One gram of cow dung sample was suspended with 100 ml of distilled water and was homogenized by constant shaking using an orbital shaker for 2 h at 180 rpm. Serial dilutions from 10−6 to 10−7 were prepared using sterilized distilled water. An aliquot of 100 μL of each dilution was spread plated onto Omeliansky’s agar medium (Omeliansky, 1902) [g/L (W/V), (NH4)2SO4 1; K2HPO4 1; MgSO4.7H2O 0.5; NaCl traces; carboxymethyl cellulose (CMC) 1%, pH 7] and incubated at 37 °C. Morphologically dissimilar and discrete colonies were picked from different dilution plates and streaked on separate Omeliansky’s agar medium and incubated at 37 °C for 96 h. The replica plates were also prepared separately for staining. Cellulase producing bacteria were screened by congo red staining (Teather and Wood, 1982) and C1 strain was selected as potent cellulolytic bacteria (colony showing largest zone of decolorization).
2.2 Culture medium for production of cellulase
The fermentation medium is the same as the previously used medium (Omeliansky’s medium) during isolation with the only difference of addition of different carbon sources or different nitrogen sources and adjustment of pH for optimization media in different experiments. Different fermentable sugars or different nitrogen sources have been shown to either induce or inhibit cellulase production depending on individual species. To decipher the sugar effect or the effect of nitrogen sources on C1 strain cellulase activities of supernatant samples attained from cultures grown on either glucose, cellobiose, CMC, lactose, sucrose, or cellulose etc. as carbon sources and KNO3, (NH4)2SO4, NH4NO3, NH4Cl, peptone etc. in medium were compared. Similarly different pH was adjusted during medium preparation to determine the optimum pH of C1 strain for cellulase production. All the ingredients were mixed proportionately except carbon source and the pH was adjusted by 0.2 N NaOH/0.1 N HCl. Then the medium was sterilized by autoclaving at 121 °C for 15 min. The carbon source was sterilized separately and added to the fermentation medium during inoculation. To check the maximum production of cellulase by the C1 strain in culture, the medium was enriched with the supplements step by step which individually increase the cellulase production.
2.3 Cultural conditions for cellulase production and preparation of crude enzymes
Two loops of C1 strain was inoculated into test tubes containing 5 ml of sterile water and shaken in a rotary shaker for mixing. Thereafter, 0.5 ml of culture was inoculated into 100 ml Erlenmeyer flask containing 20 ml of fermentation medium. Carbon sources are added after sterilization. The culture was incubated in a rotary shaker at 37 °C at 180 rpm for 10 days. Fermented broths were removed after 2, 4, 6, 8 and 10 day intervals and were centrifuged at 12,000g for 20 min at 4 °C. The cell free supernatants containing the crude enzyme were used for the estimation of cellulase enzymes. In some experiments like optimization pH, temperature, and suitable concentration of N-sources for cellulase production, fermented broths were removed after 8 day interval for crude enzyme preparation. The enzyme production by the C1 strain was determined by assay of cellulase enzymes using UV–visible spectrophotometer (Simadzu Model UV-190) at 540 nm.
2.4 DNA extraction and molecular phylogenetic analyses using 16S rRNA gene sequence
Genomic DNA was isolated from C1 strain following the method of Johnson (1994). The 16S rDNA genes was amplified with broadly conserved bacterial 16s rDNA primers SSU16s-F (5′-AAC TCC TAC GGG AGG CAG CAG-3′) and SSU16s-R (5′-AAG GAC TAC CAG GGT ATC TAA TCC-3′) which yielded PCR products of about 0.4 Kb (Wilmotte et al., 1993). The nucleotide sequences of the amplified small subunit rRNA genes were determined bidirectionally with same SSU 16s primers according to Shaikh and Tarr (2003). A continuous stretch of 415-nucleotide 16S rRNA gene sequences was used to search for similar sequences from RDP database site. After confirmation of generic affiliation, sequences from type strains of different species were retrieved from NCBI GenBank. A phylogenetic tree was constructed showing relationship between C1 strain and other reference strains by neighbor joining (NJ) method with Jukes and Cantor correction using TREECON software as described by Saha and Chakrabarti (2006).
2.5 Cellulase enzyme assay
The CMCase activity was measured by incubating 0.5 ml of culture supernatant with 0.5 ml of 1% CMC prepared in 0.05 M sodium acetate buffer, pH 4.8 at 40 °C for 1 h. The reducing sugars liberated were estimated by the 3,5-dinitrosalicylic acid (DNS) method (Miller, 1959). The enzyme reaction was stopped by the addition of 3 ml DNS reagent (dinitrosalicylic acid 1 g, NaOH, 16 g, potassium sodium tartrate 300 g, and distilled water up to 1 L) to the above 1 ml reaction mixture, boiled in capped glass tubes for 5 min, cooled and then optical density was measured at 540 nm. The CMCase activity was determined using a calibration curve for d-glucose. One unit of CMCase activity was defined as the amount of enzyme that released 1 μmol of reducing sugars as glucose equivalents min−1 and the specific activity is the number of units of enzyme activity per milligram of enzyme protein.
Avicelase activity was determined under same conditions i.e., by incubating 0.5 ml of culture supernatant with 0.5 ml of 1% Avicel (microcrystalline cellulose) prepared in 0.05 M sodium acetate buffer, pH 4.8 at 40 °C for 1 h. After incubation, released reducing sugars were measured by the DNS method. One unit of Avicelase activity was defined as the amount of enzyme that released 1 μmol of reducing sugars as glucose equivalents min−1 and the specific activity is the number of units of enzyme activity per milligram of enzyme protein.
The filter paper (FPase) activity was measured according to the method of Ghosh (1987). 50 mg (1 × 6 cm2 strip) of Whatman No. 1 filter paper were added in 0.5 ml of 0.05 M sodium acetate buffer (pH 4.8) and 0.5 ml of enzyme solution. The mixture was incubated at 40 °C for 1 h and then the reducing sugar liberated was measured by the DNS method. One unit of FPase activity was defined as the amount of enzyme that released 1 μmol of reducing sugars as glucose equivalents min−1 and the specific activity is the number of units of enzyme activity per milligram of enzyme protein.
β-glucosidase (or cellobiase) activity was measured by incubating 0.5 ml of culture supernatant with 0.5 ml of 1% (w/v) salicin prepared in 0.05 M sodium acetate buffer, pH 4.8 at 40 °C for 1 h. After incubation, released reducing sugars were measured by the DNS method. One unit of β-glucosidase activity was defined as the amount of enzyme that released 1 μmol of reducing sugars as glucose equivalents min−1 and the specific activity is the number of units of enzyme activity per milligram of enzyme protein.
The presence of glucose was also estimated by glucose oxidase method (Baker and Panow, 1991) as the latter gives true glucose concentration eliminating interference by other reducing sugars to detect the effect of lactose on cellulase production.
2.6 Protein concentration
The soluble protein concentration was determined according to the method of Lowry et al. (1951).
2.7 Mutagenesis by N-methyl-N-nitro-N-nitrosoguanidine (NTG)
The wide type cell grown in CMC medium at 50 °C for 24 h was harvested at logarithmic phase by centrifugation (10,000g, 20 min) at 4 °C and washed twice with McIlvaine’s buffer (containing 0.1 M citric acid and 0.2 M phosphate buffer) pH 5.0. The cell was resuspended in buffer at a concentration of 5.8 × 10⁸ cell/ml. and NTG (1 mg/ml) was added into the cell suspension. After incubation for 1 h at 37 °C in incubation shaker at 100 rpm, the cell was centrifuged and washed immediately with buffer. The treated sample was transferred into CMC plates (Xu et al., 2011) and incubated at 50 °C for 48 h. The cellulolytic activity was assayed using congo red followed by Teather and Wood (1982).
2.8 Statistical analysis
The statistical analyses (Zar, 1999) were performed using the SPSS version 11 software (Kinnear and Gray, 2000) using 3 replicates. It was performed by using a two-way factorial ANOVA, multivariate ANOVA, and three-way factorial ANOVA. In all cases, a post hoc Tukey test was carried out t y test was carried out to determine the significant differences within the variables.
3 Results
3.1 Isolation of cellulase producing bacteria from cow dung
After pouring congo red solution (0.75%) and washing it with 2% NaCl, a light colored clear zone was found around the streak. But whole plate becomes deep red in color. This indicates that the strains were cellulase producing. The cellulase producing C1 strain was isolated from cow dung and was identified to be a species of Bacillus sp. with the help of partial 16S rDNA sequence homology of C1 strain (Fig. 1).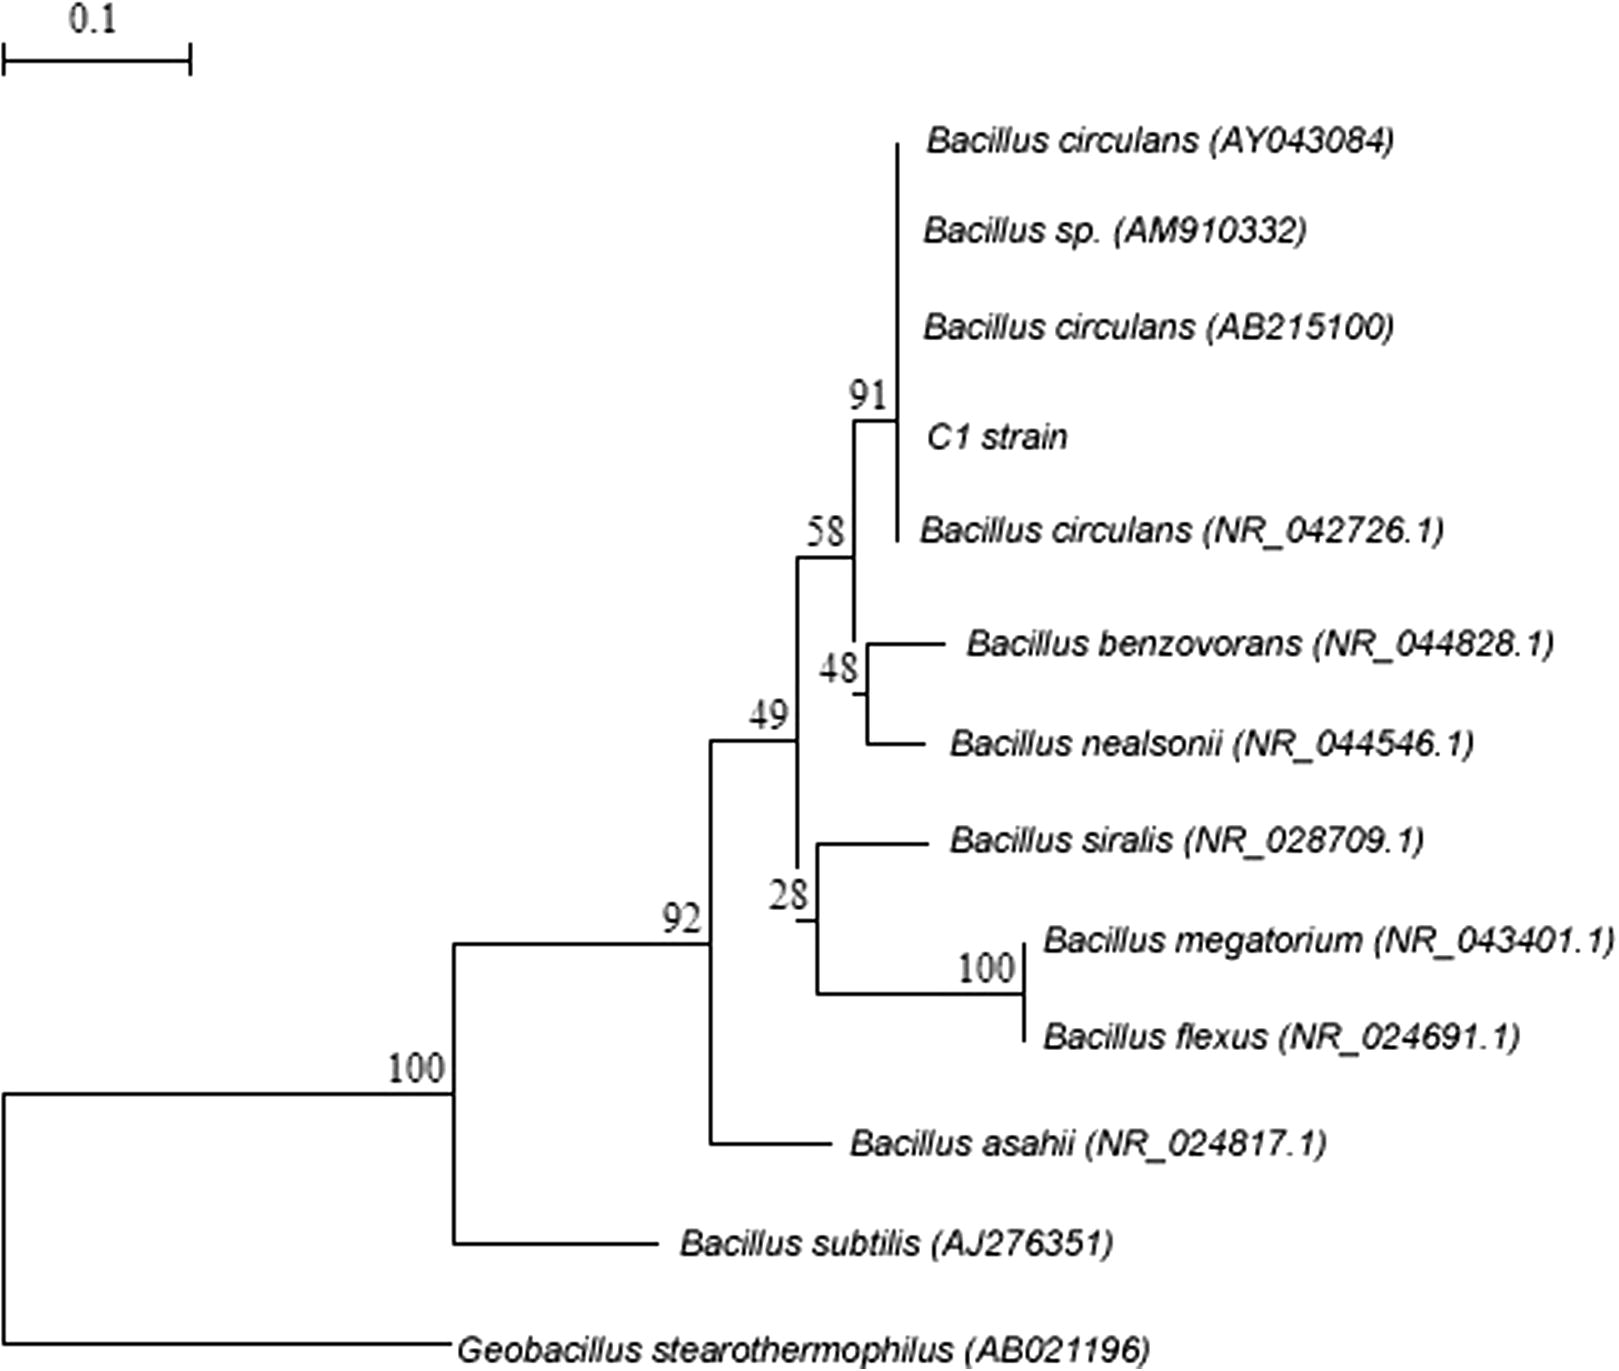
Neighbor-joining phylogenetic tree is showing relationship of C1 strain with different spp. of the Bacillus 100% similarities taken from blast analysis. The tree was generated using TREECON software (Van de Peer and De Wachter, 1997) with Jukes and Cantor’s correction. Bootstrap values of 1000 replications are shown at the nodes. Sequence of Geobacillus stearothermophilus (AB02196) was taken as out group. Bar 0.1 substitutions per site.
3.2 Bacterial growth and cellulase production with various saccharides
Cellulase production was found to be dependent upon the nature of the carbon source used in culture media. To maximize cellulase yield, the effects of different carbon sources (1% W/V) in production medium have been examined and are presented in Table 1. The results were taken after 8 days of incubation. These findings showed that Bacillus sp. utilized all carbon sources for bacterial growth. The CMC was the best among the tested carbon sources for this strain, as highest CMCase, Avicelase, FPase and β-glucosidase were recorded which proved the powerful induction of extracellular cellulase activity (Table 1). After CMC, lactose was the next better water-soluble carbon source for cellulase production by this strain. To maximize cellulase yield, the effects of different saccharides as carbon sources in the production medium have been examined and are presented in Table 1. The results of a two way ANOVA revealed significant differences in the specific activity for different carbon sources (between Carbon source, CS: F(1)8,72 = 1104.808; P < 0.001) and enzyme types (between enzyme types, ET: F(1)3,72 = 11.58; P < 0.001) and their interactions (between CS and ET: F(1)24,72 = 14.46; P < 0.001).
Carbon sources
Specific activity (U/mg protein)
CMCase
AvicelaseNS
FPaseNS
β-GlucosidaseNS
Starch
0.49 ± 0.012
0.47 ± 0.008
0.45 ± 0.008
0.45 ± 0.008
Maltose
0.47 ± 0.008
0.45 ± 0.008
0.42 ± 0.017
0.35 ± 0.001
Sucrose
0.13 ± 0.005
0.16 ± 0.008
0.20 ± 0.014
0.15 ± 0.012
Glucose
0.11 ± 0.012
0.13 ± 0.005
0.20 ± 0.014
0.21 ± 0.011
CMC
0.73 ± 0.011
0.77 ± 0.011
0.84 ± 0.026
0.93 ± 0.014
AvicelNS
0.26 ± 0.015
0.45 ± 0.014
0.32 ± 0.014
0.26 ± 0.015
Lactose
0.69 ± 0.008
0.70 ± 0.006
0.75 ± 0.014
0.80 ± 0.020
FructoseNS
0.35 ± 0.014
0.31 ± 0.008
0.32 ± 0.014
0.38 ± 0.015
Galactose
0.26 ± 0.008
0.27 ± 0.014
0.28 ± 0.008
0.29 ± 0.015
3.3 Effect of days on cellulase production
Incubation time is an important parameter for optimal production of enzymes. For determining the optimum incubation days, a range of days (2–10 days) was tested, keeping the incubation temperature constant at 37 °C and pH at 7.0. It was observed that the strain gradually raised cellulase synthesis and reached maximum activity (Fig. 2) at 8 days (0.73 U/mg CMCase, 0.77 U/mg Avicelase, 0.84 U/mg FPase and 0.93 U/mg β-glucosidase) after that enzyme activity slowly decreased.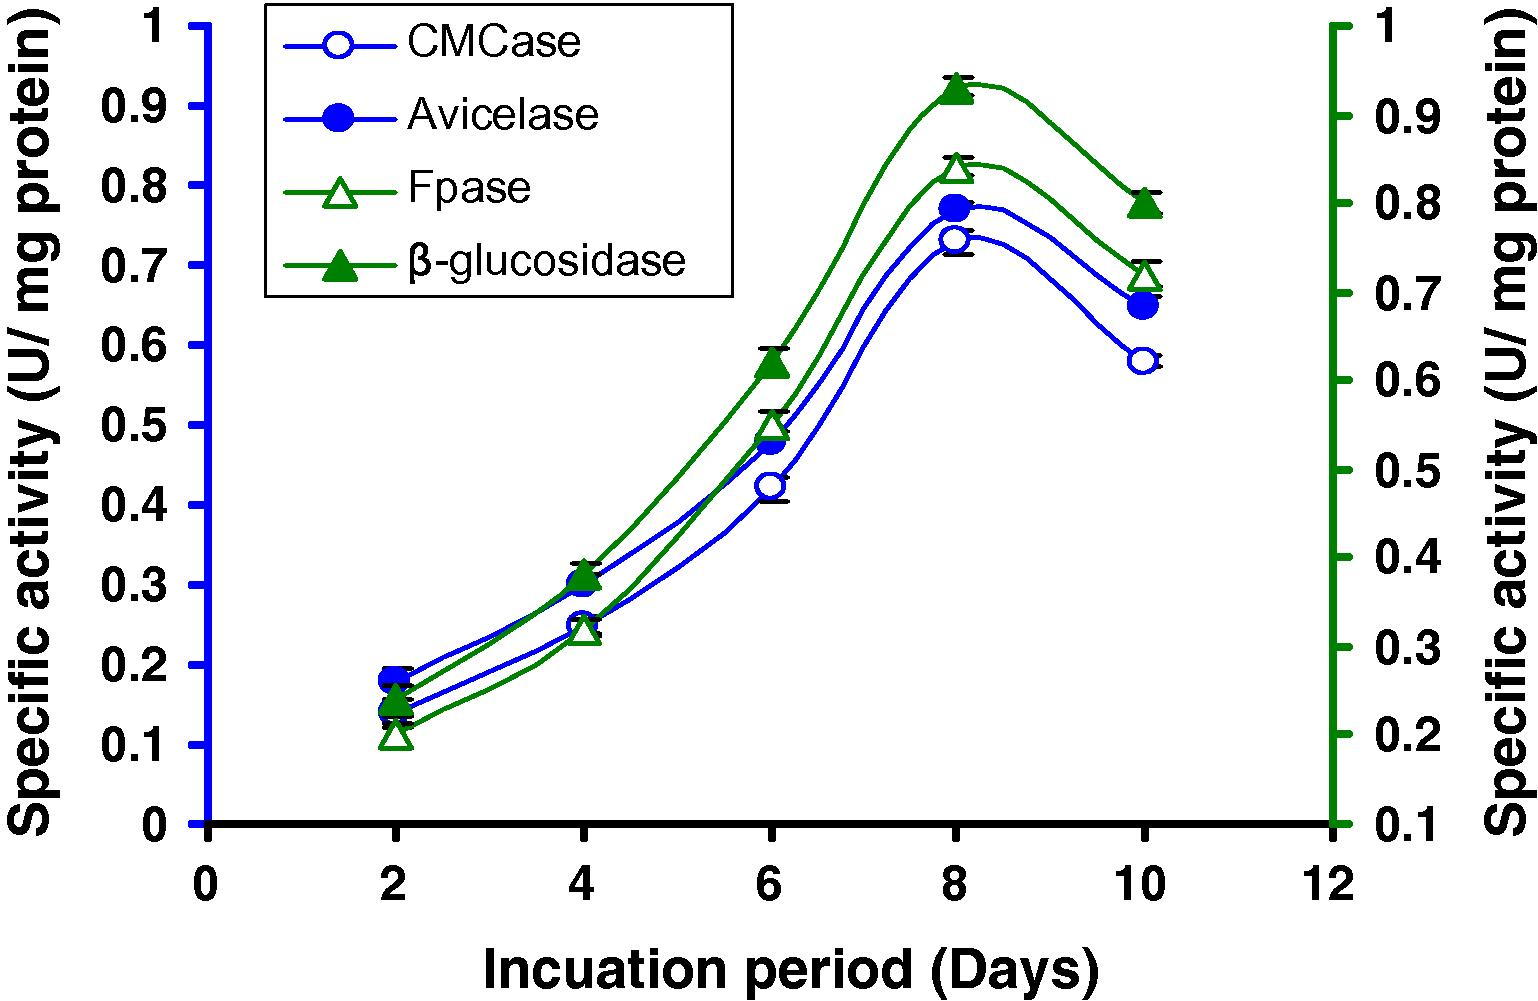
Time course of CMCase, Avicelase, FPase and β-glucosidase of crude enzyme produced by culture medium containing 1% CMC at 37 °C by Bacillus sp.
3.4 Optimum concentration of CMC
We find that among different carbon sources CMC was the best carbon source. Among different concentrations of CMC, 8% CMC was optimum for cellulase production of this strain (1.114 U/mg CMCase, 1.065 U/mg Avicelase, 1.117 U/mg FPase and 1.041 U/mg β-glucosidase) (Fig. 3) revealed by a two way ANOVA followed by Tukey test (Fig. 3). The results of a two way univariate ANOVA using CMC concentrations and the enzyme types as variables were tested to justify the differences in the specific activity exhibited by Bacillus sp. (strain C1). All P values are significant at P < 0.001 level.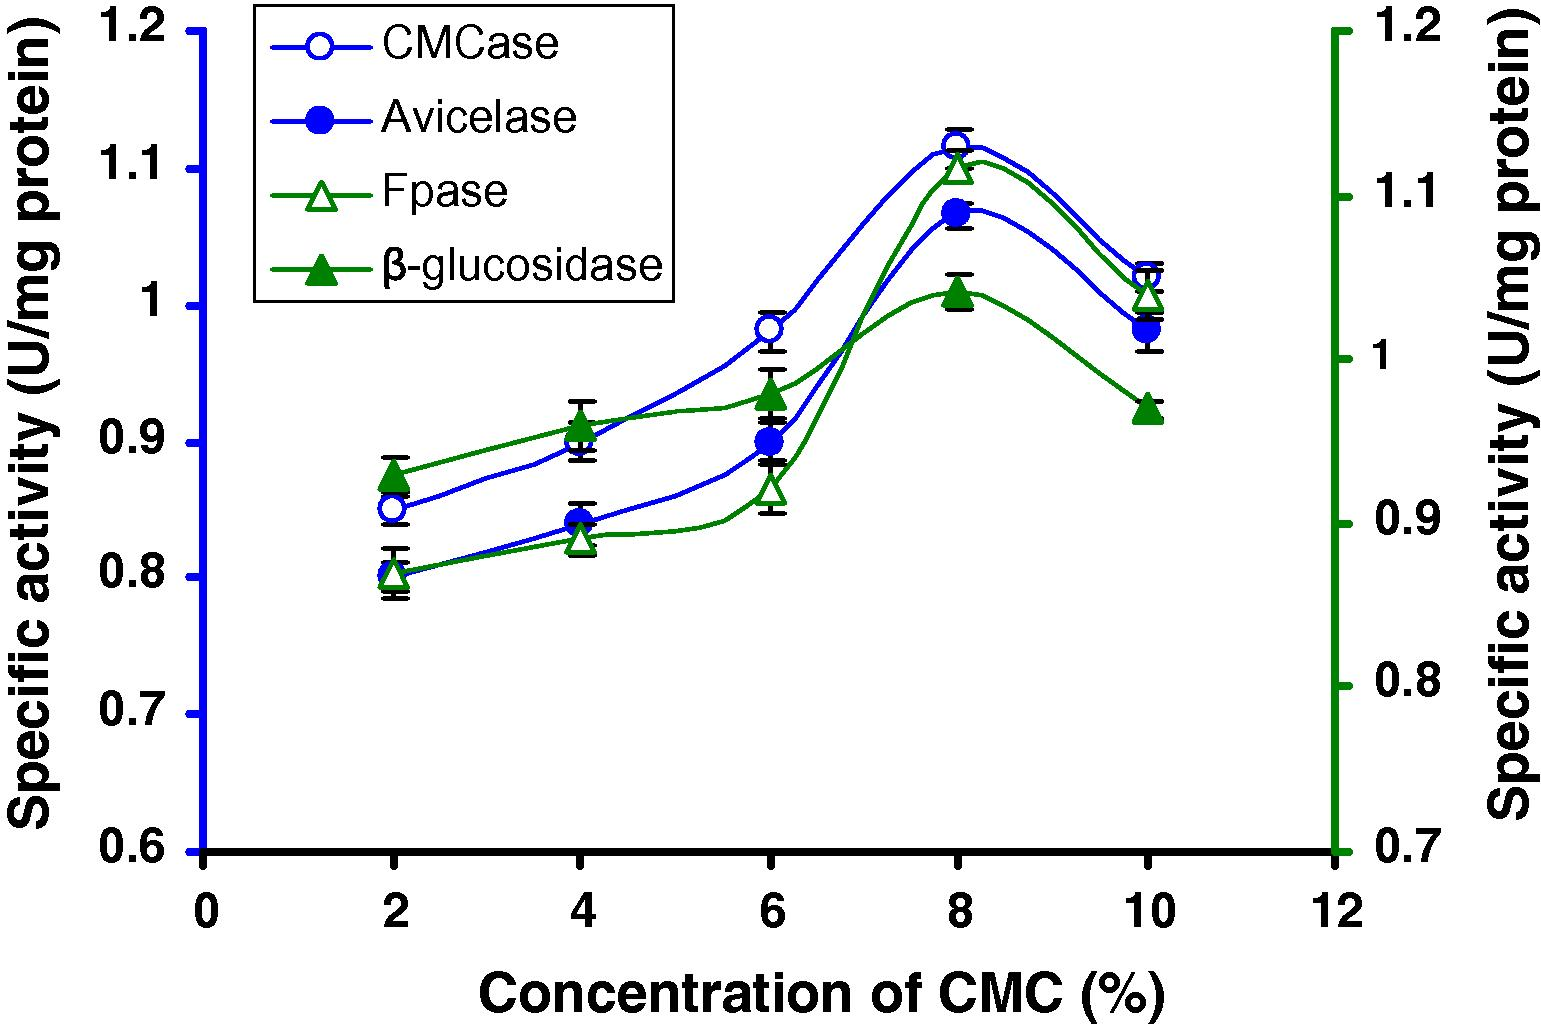
CMCase, Avicelase, FPase and β-glucosidase of crude enzyme produced by culture medium containing different concentrations of CMC at 37 °C after 8 days by Bacillus sp.
3.5 Effect of temperature on cellulase production
The medium was adjusted to pH 7.0 during the optimization of incubation temperature. For determining the optimum temperature, a range of temperatures (35 –55 °C) was tested, keeping the incubation days constant at 8 days and using 8% CMC. It was observed that the levels of CMCase, Avicelase, FPase and β-glucosidase were highest at 50 °C (2.05 U/mg CMCase, 2.4 U/mg Avicelase, 2.02 U/mg FPase and 2.6 U/mg β-glucosidase) (Fig. 4), after that cellulase production slowly decreased. The results of a two-way ANOVA substantiate the differences in the specific activities at different temperatures for the enzymes .The significant F value for the temperature and enzyme interactions is suggestive of the fact that the peak activity of the enzymes vary in their temperature ranges.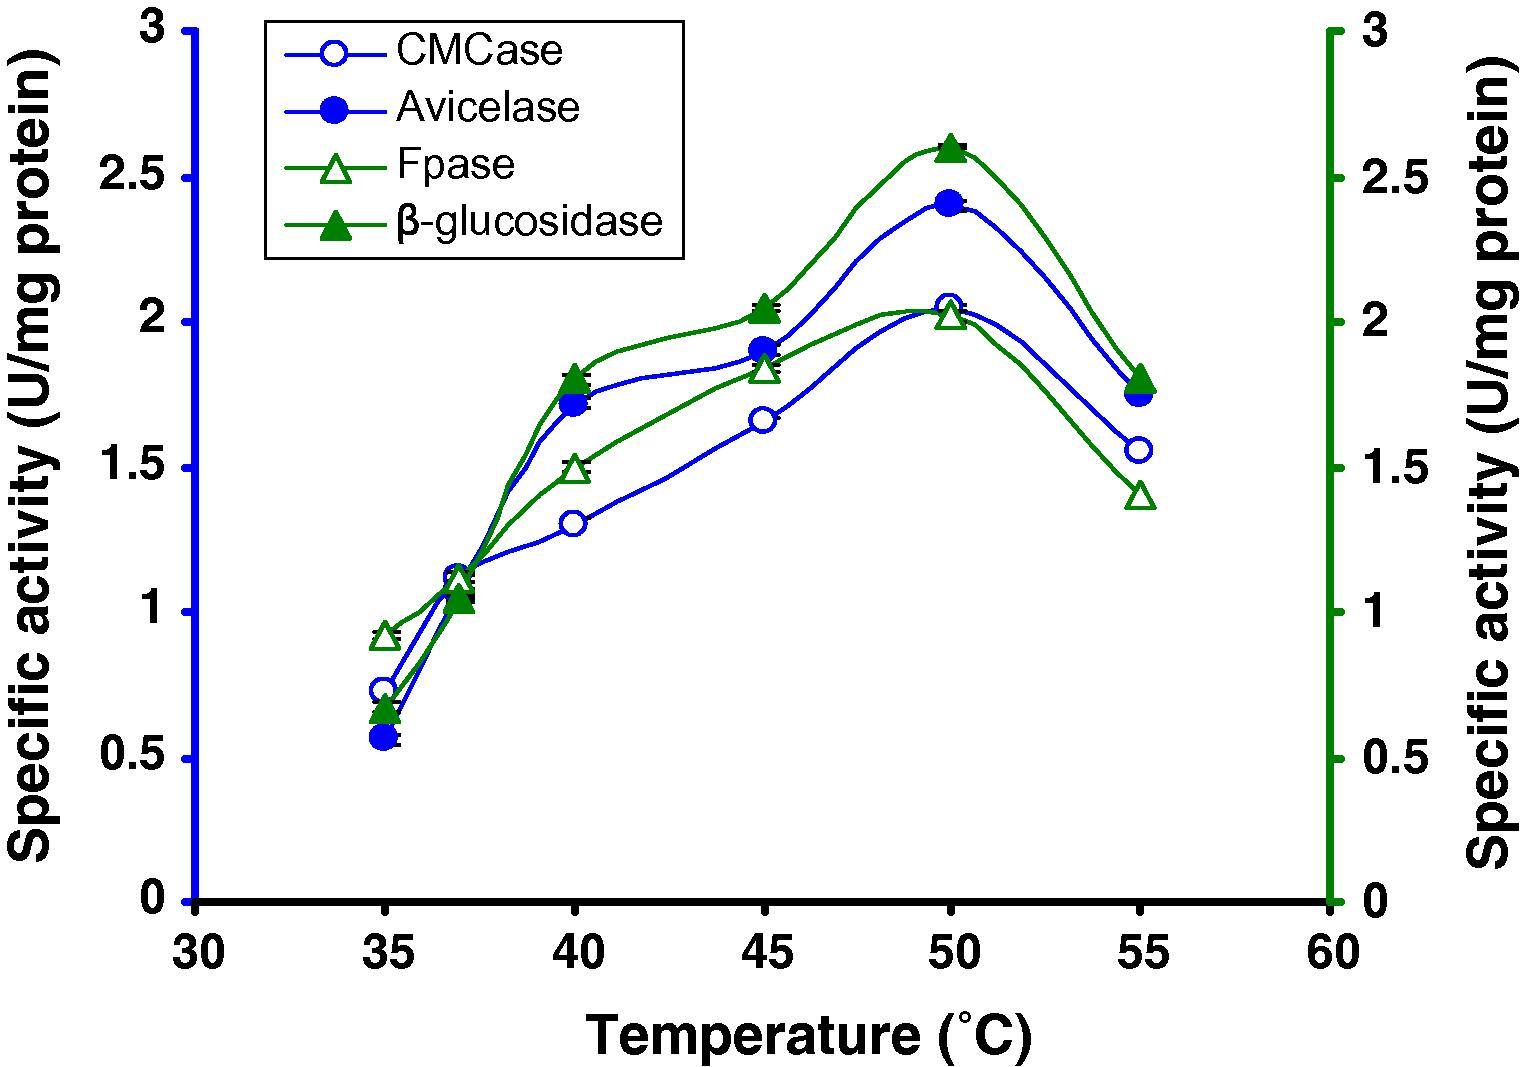
Production of cellulases by Bacillus sp. in broth culture containing 8% CMC after 8 days of incubation at different temperatures.
3.6 Effect of pH on cellulase production
For determining the optimum pH, a range of pH (6.0–8.5) was tested, keeping the incubation temperature constant at 50 °C and 8 days and using 8% CMC. It was observed that the strain gradually raised cellulase synthesis and reached maximum activity (Fig. 5) at pH 7.0 (2.26 U/mg CMCase, 2.45 U/mg Avicelase, 2.05 U/mg FPase and 2.84 U/mg β-glucosidase) after that enzyme activity slowly decreased. Like the temperature effects on cellulase production, effects of pH and enzyme interactions in the ANOVA were also noted (Fig. 5).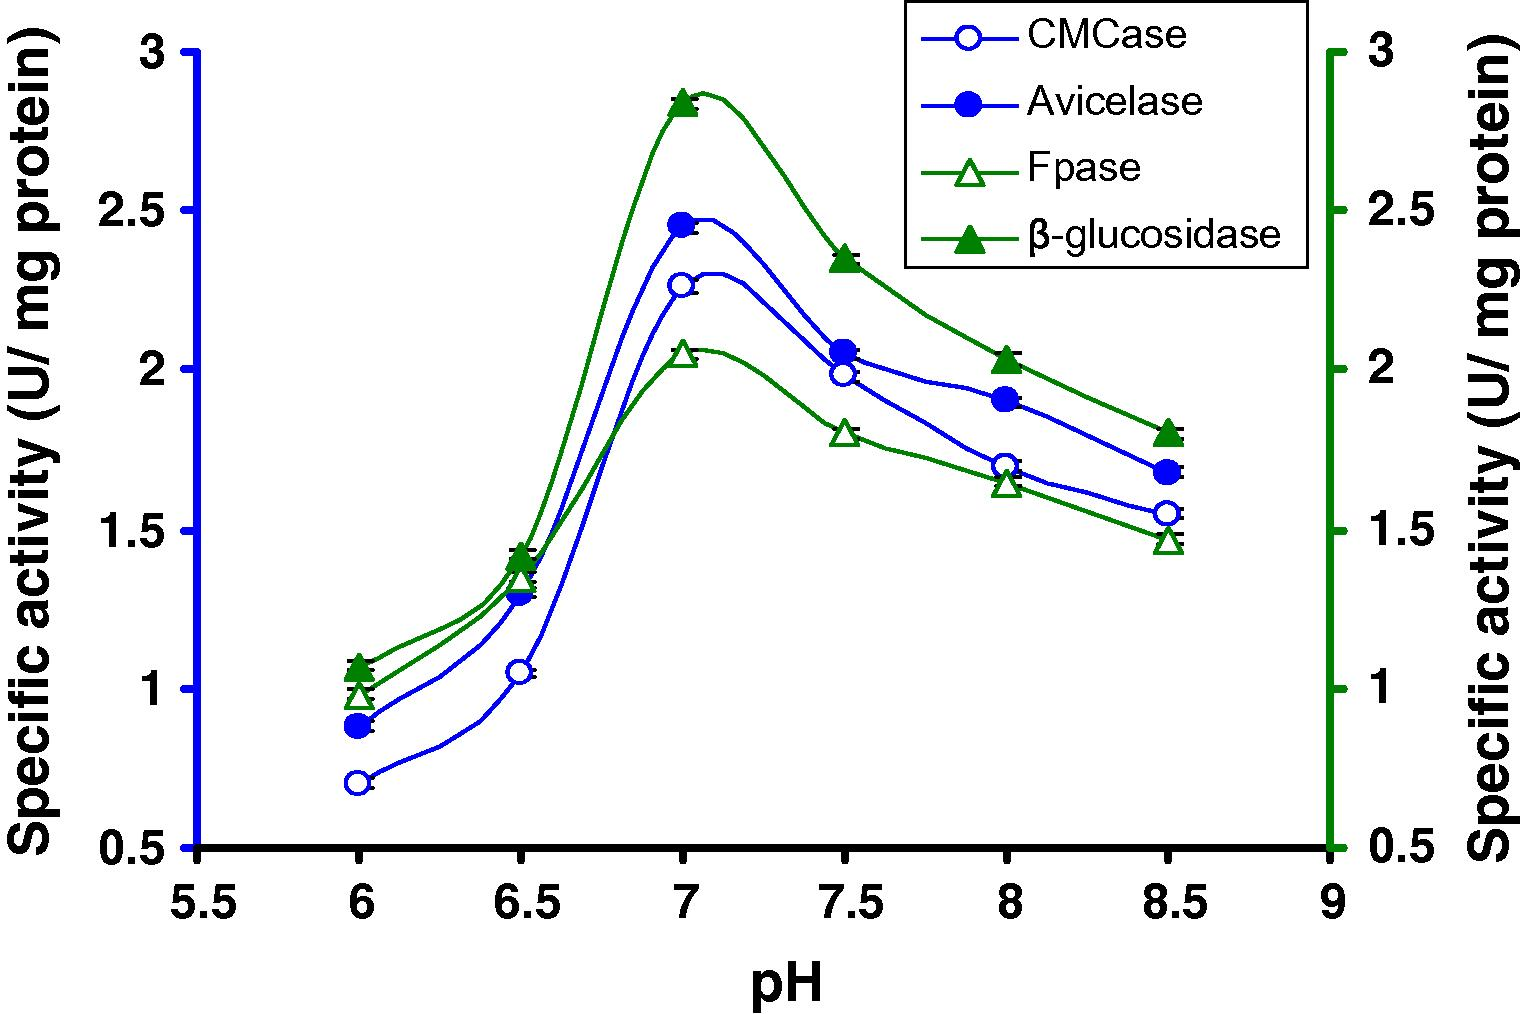
Production of cellulases by C1 in broth culture containing 8% CMC after 8 days of incubation at 50 °C at different pH.
3.7 Effect of nitrogen sources on cellulase production
The enzyme production is affected significantly under different concentrations of the organic and inorganic nitrogen sources (Table 2). For determining the suitable nitrogen source, all optimized conditions are used. The results of a two way ANOVA revealed significant differences in the specific activity for different nitrogen sources (between Nitrogen source, NS: F(1)6,56 = 13272.808; P < 0.001) and enzyme types (between enzyme types, ET: F(1)3,56 = 194.58; P < 0.001) and their interactions (between NS and ET: F(1)18,56 = 323.941; P < 0.001). Among the different nitrogen sources tested, the enzyme activity was higher with NH4NO3 (Table 3). To find out the suitable concentration of NH4NO3, different concentrations of NH4NO3 were tested, among which 0.175% NH4NO3 was optimum for this strain (5.6 U/mg CMCase, 5.75 U/mg Avicelase, 5.4 U/mg FPase and 5.62 U/mg β-glucosidase) (Fig. 6).
Nitrogen source (0.1%)
CMCase (U/mg protein)
Avicelase (U/mg protein)
FPaseNS (U/mg protein)
β-GlucosidaseNS (U/mg protein)
KNO3
2.26 ± 0.020
2.40 ± 0.015
2.05 ± 0.17
2.82 ± 0.015
(NH4)2SO4
1.14 ± 0.015
1.82 ± 0.015
1.82 ± 0.015
1.99 ± 0.020
NH4NO3
3.52 ± 0.015
3.52 ± 0.017
3.56 ± 0.017
3.62 ± 0.011
NH4Cl
3.03 ± 0.015
3.21 ± 0.011
2.85 ± 0.011
2.74 ± 0.015
Peptone
2.37 ± 0.015
2.37 ± 0.015
2.38 ± 0.015
1.87 ± 0.005
Yeast extract
1.91 ± 0.020
1.99 ± 0.015
1.52 ± 0.015
1.70 ± 0.015
Tryptone
1.05 ± 0.015
1.20 ± 0.015
1.08 ± 0.018
1.12 ± 0.017
Analysis items
I
II
t(2),2-Value
CM Case specific activity (U/mg protein)
1.114 ± 0.002
6.41 ± 0.023
145.091
Avicelase specific activity(U/mg protein)
1.065 ± 0.002
5.46 ± 0.037
120.107
FPase specific activity (U/mg protein)
1.117 ± 0.005
6.41 ± 0.014
114.303
β-Glucosidase specific activity (U/mg protein)
1.041 ± 0.002
5.40 ± 0.023
141.499
Protein (mg/ml)
0.136 ± 0.002
0.720 ± 0.003
99.19
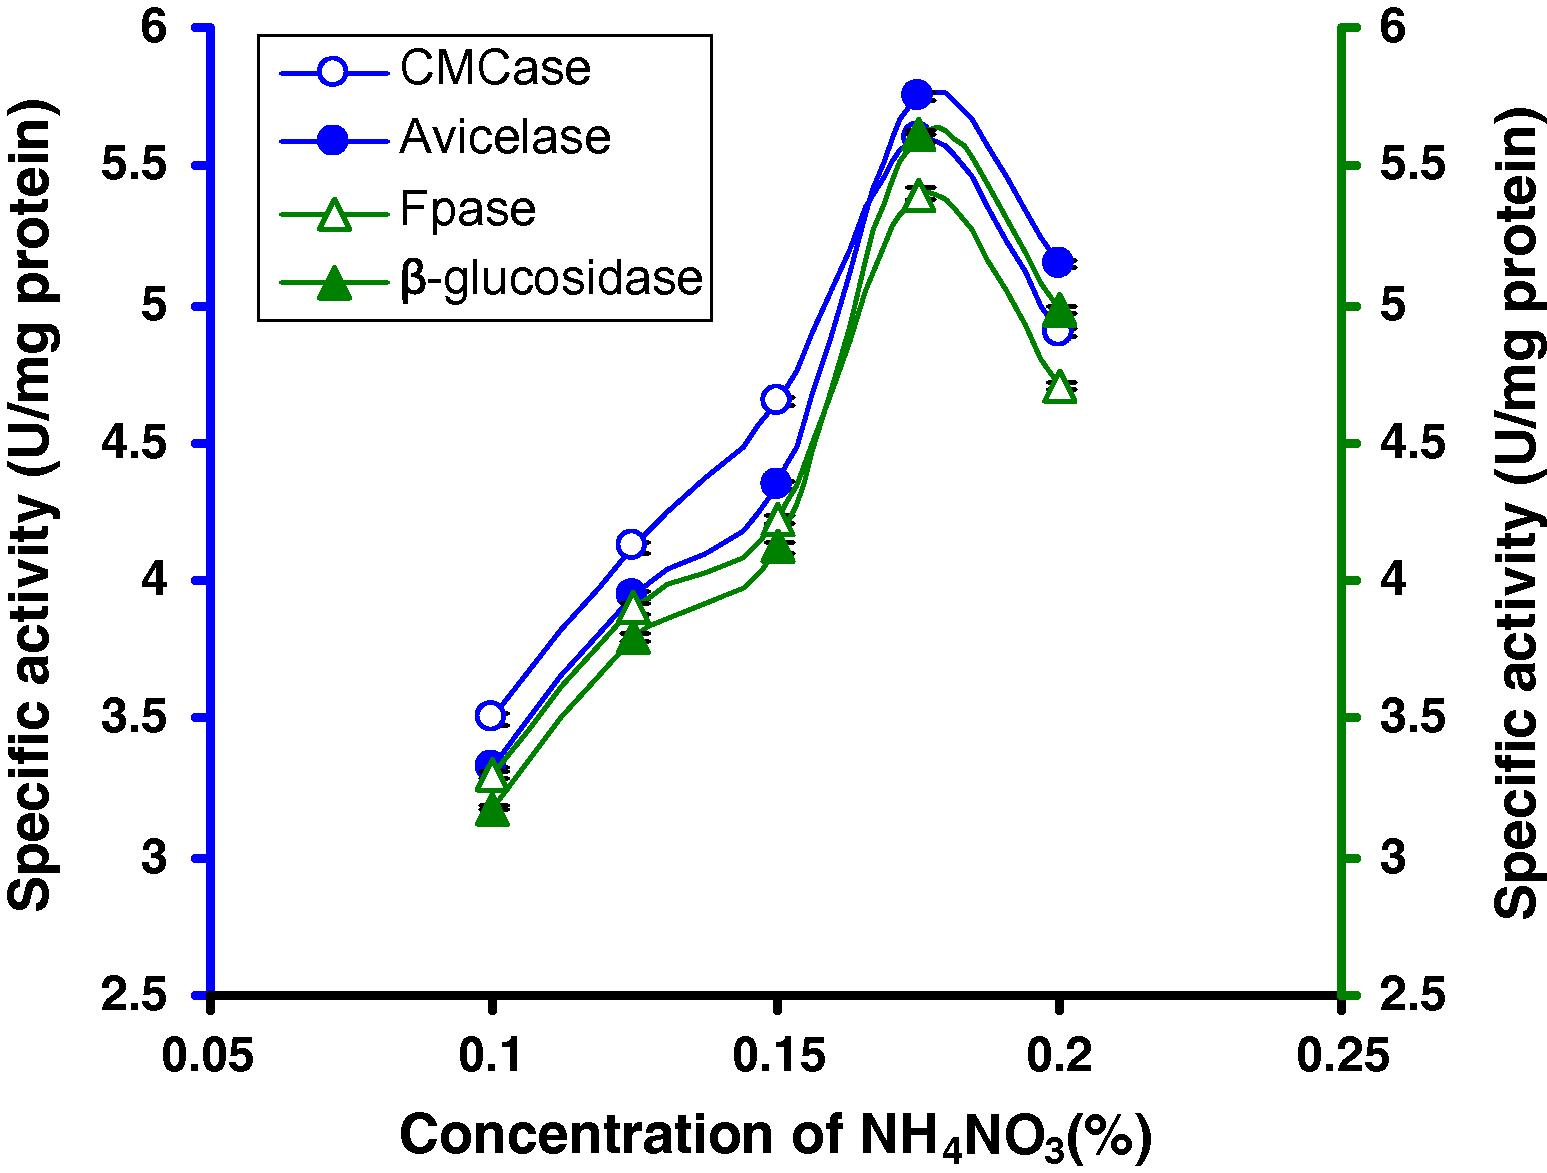
CMCase, Avicelase, FPase and β-glucosidase of crude enzyme produced by culture medium containing different concentrations of NH4NO3 at 37 °C after 8 days by Bacillus sp.
3.8 Optimum concentration of lactose
We find that lactose was the penultimate best carbon source for cellulase production. Therefore, effects of two different concentrations of lactose have been tested (Figs. 7A and B) and it was observed that 1% lactose was better for cellulase production of this strain (Fig. 7A). A repeated measures ANOVA justified the differences on the supplement added to the medium, the time (in days) of incubation and the activity of the different enzyme by this Bacillus sp. strain C1.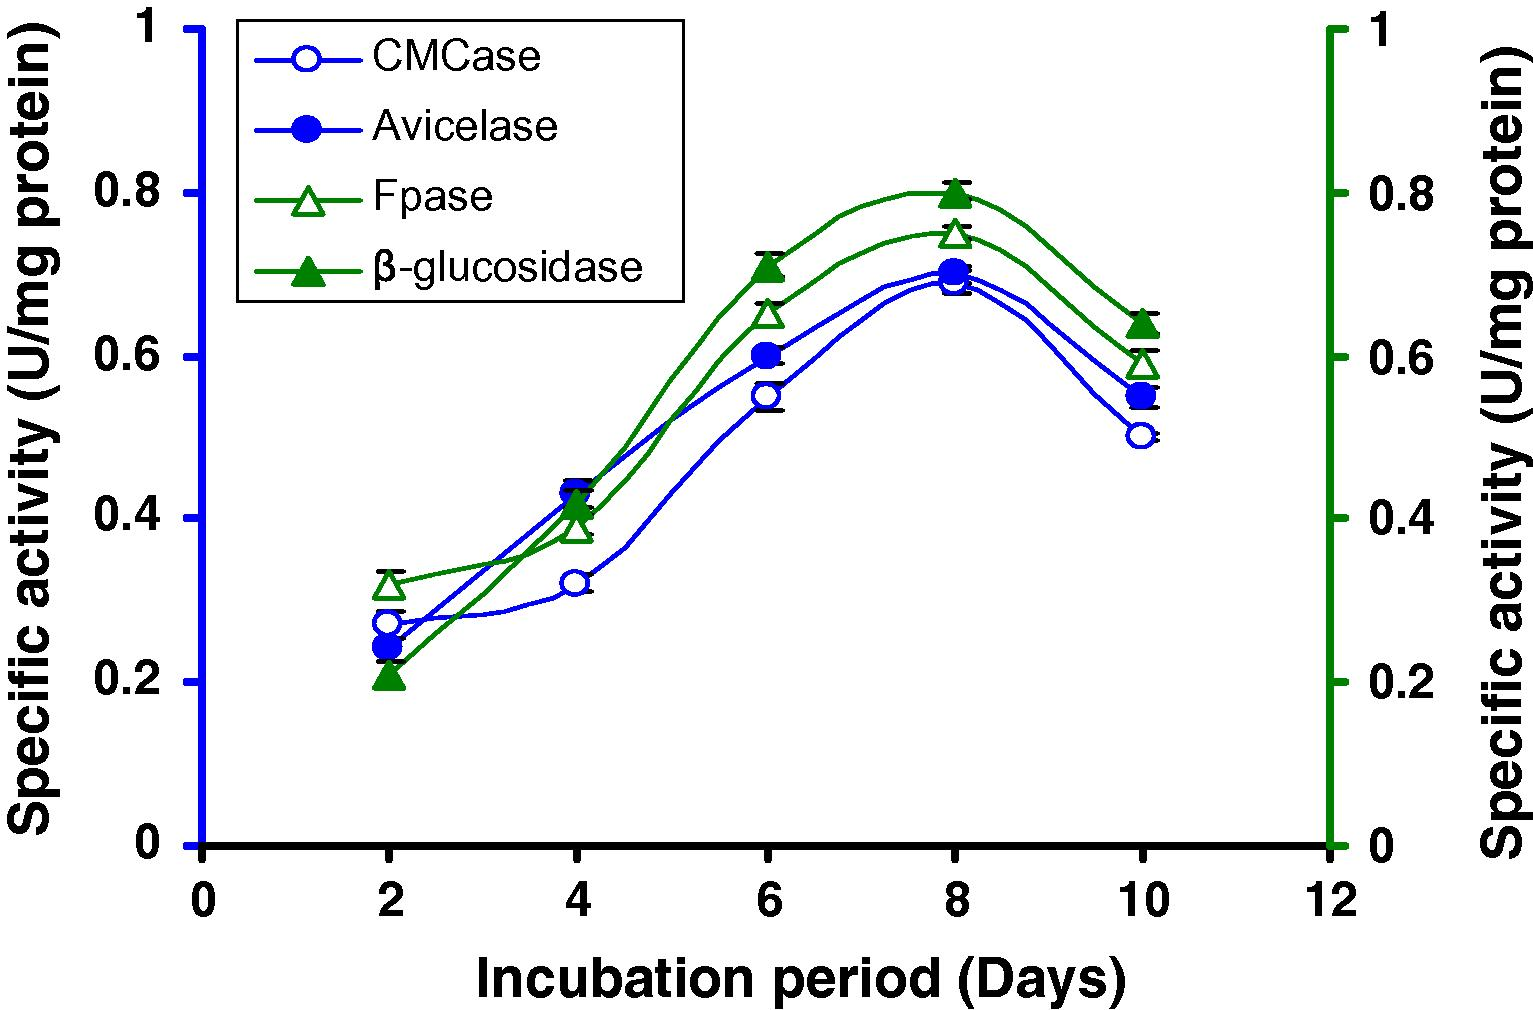
Time course of CMCase, Avicelase, FPase and β-glucosidase of crude enzyme produced by culture medium containing 1% lactose at 37 °C by Bacillus sp.
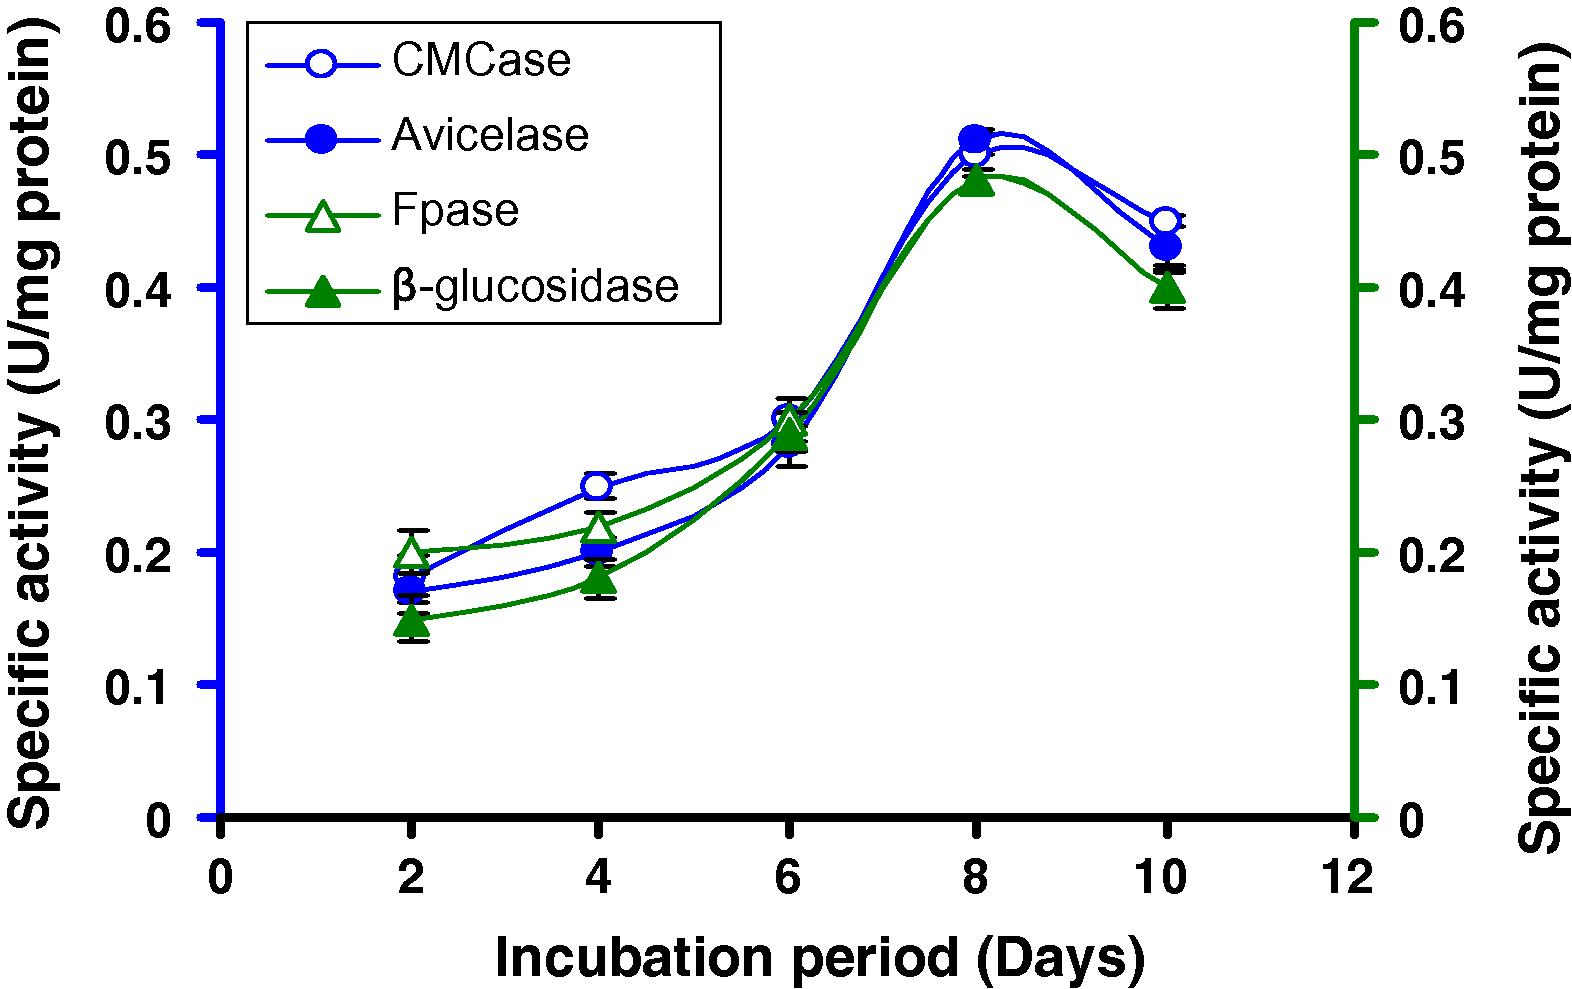
Time course of CMCase, Avicelase, FPase and β-glucosidase of crude enzyme produced by culture medium containing 2% lactose at 37 °C by Bacillus sp.
3.9 Effect of lactose on cellulase production
CMC was the optimum carbon source for cellulase production among the sources tested (Table 1). We noticed that the effect of disaccharide lactose on cellulase synthesis significantly differed. The specific activity of CMCase, Avicelase, FPase and β-glucosidase recorded highest when 8% CMC was supplemented with 1.0% lactose (Table 3). Activities of the same enzymes under similar conditions were comparatively lower with 7% CMC with 1% lactose or with any other combination percentage of them as substrate (Figs. 8A, B).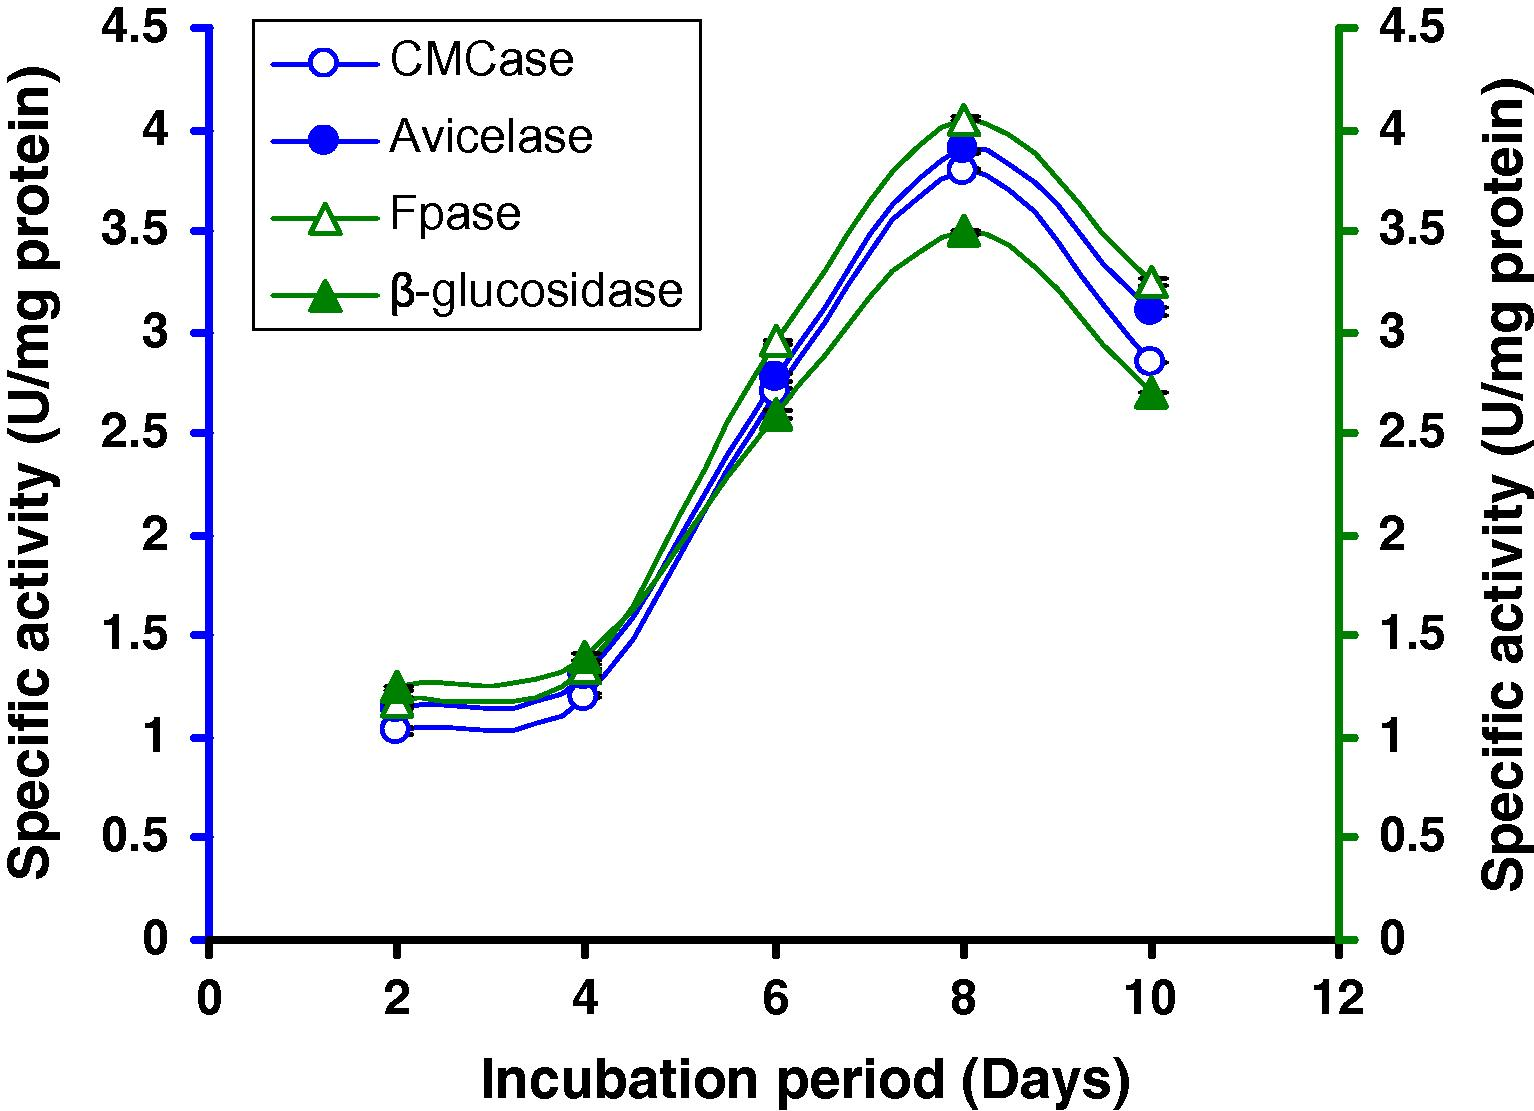
Time course of CMCase, Avicelase, FPase and β-glucosidase of crude enzyme produced by culture medium containing (A) 7% CMC + 1% lactose at 37 °C by Bacillus sp.
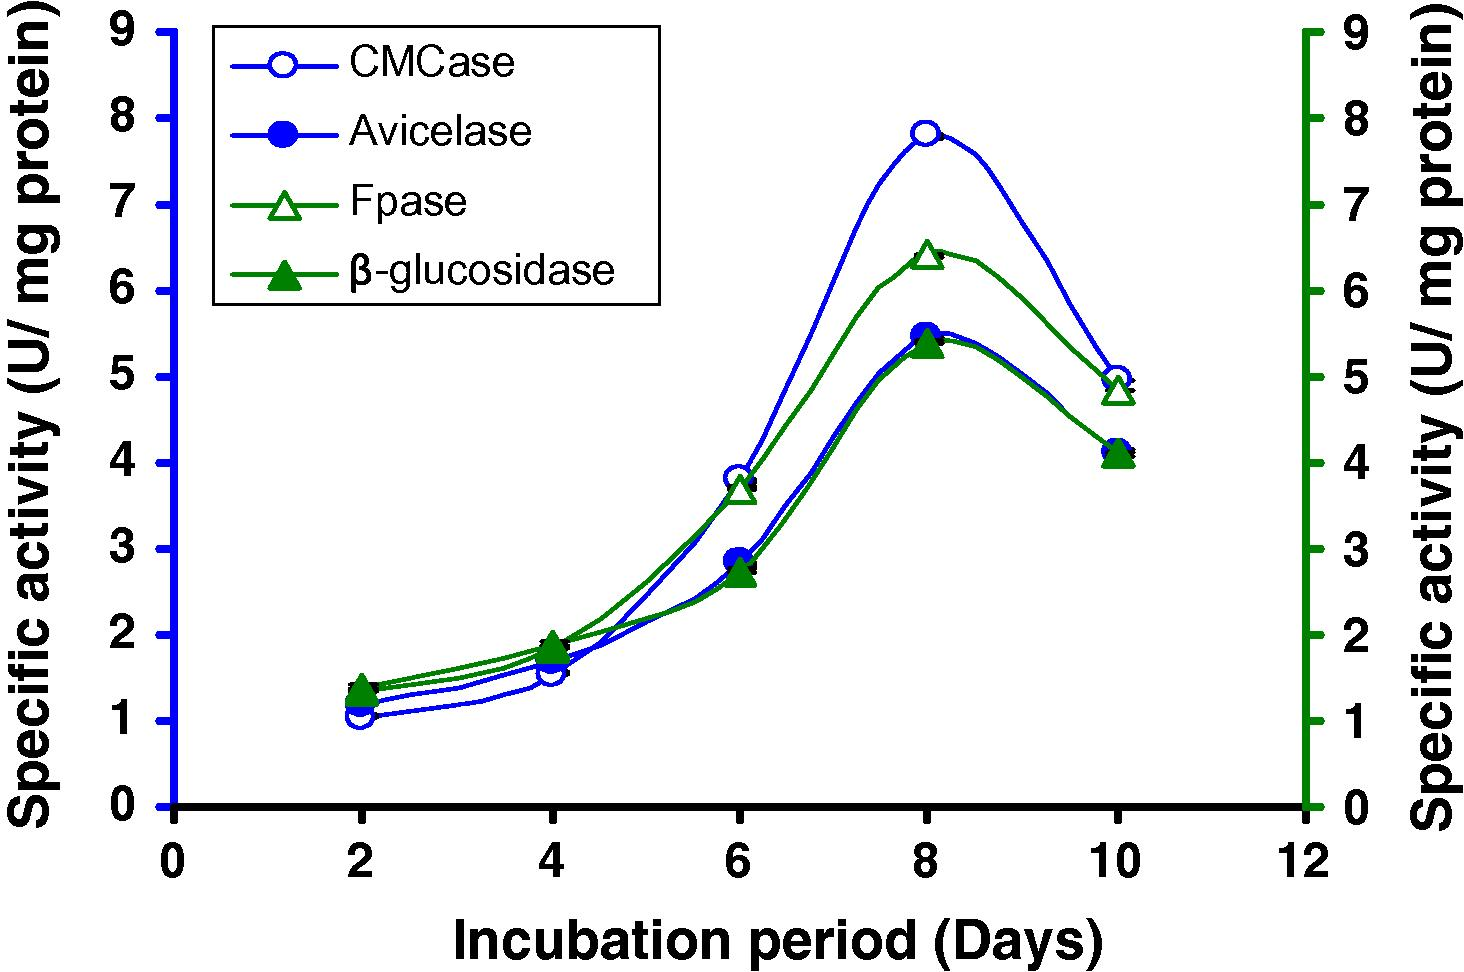
Time course of CMCase, Avicelase, FPase and β-glucosidase of crude enzyme produced by culture medium containing (B) 8% CMC + 1% lactose at 37 °C by Bacillus sp.
3.10 Effect of mutagenic treatment on cellulose production
The wild type Bacillus sp. strain C1 was subjected to mutagenic treatment using NTG for strain improvement. After mutagenesis, following C1M11, C1M16, C1M23, C1M26, C1M29 mutant colonies were obtained based on the ratio of diameter between the clearing zone and colony on the CMC-congo red medium. The cellulase activity of clones that displayed the largest clearing zones was assessed after 60 h of cultivation. The five best isolates were selected and cultivated in the CMC agar medium (Table 4). Mutant strain C1M26 exhibited the highest CMCase activity at 16.30 U/mg protein followed by the mutant strain C1M16 (14.75 U/mg proteins) (Table 4).
Bacterial strains
CMCase (U/mg protein)
Avicelase (U/mg protein)
FPase (U/mg protein)
β-Glucosidase (U/mg protein)
Wild type
C1 strain
9.40 ± 0.002
10.12 ± 0.002
9.55 ± 0.002
9.02 ± 0.002
Mutant
C1M11
11.20 ± 0.002
11.35 ± 0.002
11.25 ± 0.002
11.11 ± 0.002
C1M16
14.75 ± 0.037
14.82 ± 0.037
14.55 ± 0.037
14.22 ± 0.037
C1M23
13.21 ± 0.023
13.26 ± 0.023
13.21 ± 0.023
13.02 ± 0.023
C1M26
16.30 ± 0.015
16.55 ± 0.015
16.62 ± 0.014
16.15 ± 0.015
C1M29
12.86 ± 0.014
12.92 ± 0.017
12.70 ± 0.017
12.78 ± 0.011
4 Discussion
The 16S rDNA sequence has been submitted to Microbial Type Culture Collection Centre and GenBank, Chandigarh, India and Accession No. is MTCC10046. The phylogenetic analysis of the C1 strain using its 16S rDNA sequence data showed that strain C1 had the highest homology (100%) with Bacillus circulans. Due to the lack of overall genome relatedness, chemotaxonomic data, FAME etc. the specific epithet of C1 strain could not be assigned and identified as Bacillus sp. (Fig. 1).
Production of cellulase in the presence of different cellulosic substrates was studied by using C1 strain. The strain has the ability to metabolize these cellulosic substrates for their growth by expressing cellulolytic enzyme activities. In the presence of CMC, the strain displayed significant activity when compared with others followed by lactose, starch and maltose etc., substantiated by post hoc Tukey test (Table 1). Other carbon sources did not show a significant role on enzyme productivity. The results of carbon sources were in accordance with the results of Streptomyces sp. BRC1 and BRC2 (Chellapandi and Himanshu, 2008), A. flavithermus EHP1 (Ibrahim and Ahmed, 2007), Microbacterium sp. (Sadhu et al., 2011), Bacillus sp. (Sadhu et al., 2013).
In the present study the C1 strain produced highest enzyme production after 8 days of incubation, after that it was decreasing (Fig. 2). In Streptomyces sp. BRC1 and BRC2 gradually raised endoglucanase synthesis and reached maximum activity at 3 days, after that enzyme activity slowly decreased (Chellapandi and Himanshu, 2008). A similar 8 day incubation period was essential for cellulase production in Microbacterium sp. (Sadhu et al., 2011) and in Bosea sp. (Sadhu et al., 2012). A 10 day incubation period was essential for cellulase production in Bacillus sp. (Sadhu et al., 2013).
Among different carbon sources, lactose was the next suitable carbon source after CMC for cellulase production by this strain (Table 1). This is reflective of the various physiological and biochemical adaptations of the bacteria Bacillus sp. and that the enzyme activities vary with time and the available energy sources.
Microbial cellulase production has been influenced by temperature. Optimum temperatures for cellulase production are different in different bacteria (Chellapandi and Himanshu, 2008; George et al., 2001). From Fig. 4, it was found that maximum cellulase activity was recorded at 50 °C by this strain. Similar results have been found in Thermonospora (George et al., 2001), Streptomyces transformant T3-1 (Jang and Chen, 2003), Bosea sp. (Sadhu et al., 2012), Bacillus sp. (Sadhu et al., 2013) and S. griseorubens (Prasad et al., 2013).
Comparison in terms of enzyme activity is difficult to establish because the prokaryotic cellulases may present very different actions from those of fungi, with best pH varying among them (Heck et al., 2002). The cellulase production was higher at pH 7.0 in the medium by C1 strain. Similar observations have been recorded in Streptomyces sp F2621 (Tuncer et al., 2004), Streptomyces BRC1 and BRC2 (Chellapandi and Himanshu, 2008), A. flavithermus EHP1 (Ibrahim and Ahmed, 2007), Bosea sp. (Sadhu et al., 2012), Bacillus sp. (Sadhu et al., 2013) and S. griseorubens (Prasad et al., 2013).
The production of cellulases is sensitive to the nitrogen source and nitrogen level in the medium. The production medium was incorporated with different inorganic nitrogen sources to determine a suitable nitrogen source for CMCase production. Meat extract and tryptone (1%) served as intensive nitrogen sources to Streptomyces sp. BRC1 and yeast extract (1%) suited for Streptomyces sp. BRC2 (Chellapandi and Himanshu, 2008) for cellulase production. The enzyme activity was higher with NH4Cl (0.15%) in Bacillus sp. (Sadhu et al., 2013). Similar results have been found in Bosea sp. (Sadhu et al., 2012).
It was observed from Table 1 the lactose was the penultimate carbon source for cellulase production after CMC for this strain. It is apparent from the multivariate test that significant differences were obvious between the enzyme types and their peak activity in respect to the incubation periods and the media.
Most microbial cellulases are induced in the presence of cellulose but cellulose itself cannot directly trigger the induction as it is insoluble. A basal level of cellulase production occurs in the absence of glucose. The soluble saccharides such as cellobiose, sorphorose, lactose, trehalose, sorbose, and galactose might serve as inducers for cellulase synthesis as reported in C. papyrosolvens (Thirumale et al., 2001), A. cellulolyticus (Shiang et al., 1991). We therefore, investigated the positive synergistic effect of lactose with CMC on cellulase production by C1 strain. Lactose synergistically enhanced the cellulase synthesis. Activities of same enzymes under similar condition were also lower when the substrates (CMC or lactose) were added individually. The result is also in accordance with the results reported earlier with a fungus Hypocrea jecorina (Seiboth et al., 2002) and in bacteria Microbacterium (Sadhu et al., 2011). However, the mechanism through which lactose induces the formation of cellulase is not clearly known; Seiboth et al. (2002) stated that lactose might act as an inducer of cellulase formation rather than promoting cellulase biosynthesis by relieving the carbon catabolite repression.
Lactose induces cellulase production in this strain. Lactose consists of d-galactose and d-glucose though cellulase synthesis cannot be induced by galactose or glucose individually (Table 1). This is reflected through the two tailed paired t-test carried out on the specific activity of the enzymes under the two different media – 8% CMC and 8% CMC + 1% lactose, with significantly higher activity in lactose containing medium. Protein yield was also higher in the medium containing lactose. Reports from the literature suggested that glucose inhibited cellulose synthesis (Ilmen et al., 1997) and lactose enhances significantly higher cellulase levels than d-galactose in Trichoderma reesei (Karaffa et al., 2006). The induction mechanism of cellulase formation is studied in fungus by many workers (Schmoll and Kubicek, 2003) and in bacteria (Sadhu et al., 2011, 2013). We therefore consider that lactose is a water soluble disaccharide in the mixed medium with CMC and was fast utilized by Bacillus sp. and produced cellulose initially which would enable an initial attack on CMC followed by more cellulase production. Thus, the cellulase production was remarkably enhanced when lactose was added with CMC as a carbon source. Lactose is a powerful inducer that generally enhances the cellulase yield in this organism by stimulating secretion of various proteins along with cellulase. The strain C1 which initially produced low amount of cellulase but after cultural optimization it increased the production as shown in Table 5.
Experiment
Condition
Result
Specific activity (U/mg protein)
CMCase
Avicelase
FPase
β-Glucosidase
Incubation period (days)
37 °C, pH 7.0, 1% CMC, 0.1% W/V N2 source
8 days
0.73 ± 0.011
0.77 ± 0.011
0.84 ± 0.026
0.93 ± 0.014
Concentration of CMC (%)
37˚C, pH 7.0, 8 days, 0.1% W/V N2 source
8%
1.114 ± 0.015
1.065 ± 0.010
1.117 ± 0.010
1.041 ± 0.010
Temperature (°C)
pH 7.0, 8 days, 8% CMC, 0.1% W/V N2 source
50 °C
2.05 ± 0.015
2.4 ± 0.017
2.02 ± 0.011
2.6 ± 0.010
pH
50 °C, 8 days, 8% CMC, 0.1% W/V N2 source
7.0
2.26 ± 0.020
2.45 ± 0.015
2.05 ± 0.017
2.84 ± 0.015
Suitable nitrogen source
8 days, 8% CMC, 50 °C, pH 7.0, 0.1% W/V N2 source
NH4NO3
3.52 ± 0.015
3.52 ± 0.017
3.56 ± 0.017
3.62 ± 0.011
Concentration of NH4NO3 (%)
8 days, 8% CMC, 50 °C, pH 7.0
0.175%
5.6 ± 0.015
5.75 ± 0.015
5.4 ± 0.015
5.62 ± 0.011
8% CMC + 1% lactose
37 °C, pH 7.0, 8 days, 0.1% W/V N2 source
6.41 ± 0.023
5.46 ± 0.037
6.41 ± 0.014
5.40 ± 0.023
Mutant strain C1M26 exhibited the highest CMCase activity. A similar result was found in Cellulomonas sp. TSU-03 where NTG treated mutant strains increased the yield of cellulose (Sangkharak et al., 2012). NTG was suggested to affect the cellulase genes within these mutants. But, how NTG triggered cellulase production in these mutants is not clear. We favor the hypothesis that NTG could have affected the regulatory genes or the stability of the mRNA leading to greater cellulase synthesis. Similar hypothesis is also put forward in Pseudomonas sp. where catabolite repression was responsible for enhanced cellulase production by mutagenesis.
5 Conclusion
The bacteria as enzyme sources have many advantages that, the enzymes produced are normally extracellular, making easier for downstream process. The development of economically feasible technologies for cellulase production and for the enzymatic hydrolysis of cellulosic materials will enable to utilize the large quantities of biomass such as the residues of both food industries and agriculture. Thus the present investigation was selected to conduct an extensive study on cellulases from Bacillus sp. Present study aimed at isolation of promising cellulase producing Bacillus sp its identification, and optimization of cultural conditions for production of cellulolytic enzymes. Though we isolated the C1 strain from cow dung, the input of cellulase production by Bacillus sp. was attempted by the optimization and mutagenesis study. Enhancement of cellulase production in the presence of lactose has been reported in fungi and in some bacteria. Present work suggests that lactose has an enhancing effect on cellulase production in this strain also and strengthening the hypothesis. NTG treated mutants showed higher cellulase production than wild type of C1 strain. The result concludes that mutagenesis by NTG caused enhancement of cellulase production by mutation of regulatory genes or stability of mRNA of cellulase or by some other unknown mechanisms.
Acknowledgements
The first author received financial support from the University Grant Commission through The University of Burdwan. We thank our colleagues for their moral support.
References
- Effect of nutritional and environmental factors on cellulose activity by thermophilic bacteria isolated from hot spring. J. Sci. Ind. Res.. 2011;70:142-148.
- [Google Scholar]
- Partial purification and characterization of a highly thermostable and pH stable endoglucanase from a newly isolated Bacillus strain M-9. Indian J. Chem. Technol.. 2009;16:382-387.
- [Google Scholar]
- Estimation of cellulase activity using a glucose oxidase-Cu (II) reducing assay for glucose. J. Biochem. Biophys. Methods. 1991;23:265.
- [Google Scholar]
- Purification and characterization of cellulase from the wild-type and two improved mutants of Pseudomonas fluorescens. Afr. J. Biotechnol.. 2005;4:898-904.
- [Google Scholar]
- Cellulases and related enzymes in biotechnology. Biotechnol. Adv.. 2000;18:355-383.
- [Google Scholar]
- Production of endoglucanase by the native strains of Streptomyces isolates in submerged fermentation. Braz. J. Microbiol.. 2008;39:122-127.
- [Google Scholar]
- Lactose enhances cellulase production by the filamentous fungus Acremonium cellulolyticas. J. Biosci. Bioeng.. 2008;106:115-120.
- [Google Scholar]
- Studies on carboxymethyl cellulase produced by an alkalothermophilic actinomycete. Bioresour. Technol.. 2001;77:171-175.
- [Google Scholar]
- Cellulase and xylanase production by isolated Amazon Bacillus strains using soya been industrial residue based solid-state cultivation. Braz. J. Microbiol.. 2002;33:213-218.
- [Google Scholar]
- Cellulase for commodity products from cellulosic biomass. Curr. Opin. Biotechnol.. 1999;10:358-364.
- [Google Scholar]
- Isolation and identification of new cellulases producing thermophilic bacteria from an Egyptian hot spring and some properties of the crude enzyme. Aust. J. Basic & Appl. Sci.. 2007;1(4):473-478.
- [Google Scholar]
- Regulation of cellulase gene expression in the filamentous fungus Trichoderma reesei. Appl. Environ. Microbiol.. 1997;63:1296-1306.
- [Google Scholar]
- Production and characterization of thermostable cellulases from Streptomyces transformant T3-1. World J. Microbiol. Biotechnol.. 2003;19(3):263-268.
- [Google Scholar]
- Similarity analysis of DNAs. In: Gerhardt P., Murray R.G.E., Wood W.A., Krieg N.R., eds. Methods for General and Molecular Bacteriology. Washington, DC: American Society for Microbiology; 1994. p. :656-682.
- [Google Scholar]
- d-galactose induces cellulase gene expression in Hypocrea jecorina at low growth rates. Microbiology. 2006;152:1507-1514.
- [Google Scholar]
- SPSS for Windows Made Simple, Release 10. Sussex: Psychology Press; 2000.
- Protein measurement with the folin-phenol reagent. J. Biol. Chem.. 1951;193:265-275.
- [Google Scholar]
- Use of dinitrosalicylic acid reagent for the determination of reducing sugars. J. Anal. Chem.. 1959;31:426-428.
- [Google Scholar]
- Omeliansky, W., 1902. Ueber die Garung der cellulose“Centrabl. Bakt, II Abt 8, 225–231.
- Characterization of the cellulolytic enzyme produced by Streptomyces griseorubens (accession No. AB184139) isolated from Indian soil. J. King Saud Univ. Sci.. 2013;25:245-250.
- [Google Scholar]
- Lactose-enhanced cellulose production by Microbacterium sp. isolated from fecal matter of Zebra (Equus zebra) Curr. Microbiol.. 2011;62:1050-1055.
- [Google Scholar]
- Characterization of a Bosea sp. strain SF5 (MTCC 10045) isolated from compost soil capable of producing cellulase. J. Microbiol. Biotechnol. Food Sci.. 2012;2(2):576-591.
- [Google Scholar]
- Optimization of cultural condition and synergistic effect of lactose with carboxymethyl cellulose on cellulase production by Bacillus sp. isolated from fecal matter of elephant (Elephas maximus) Adv. Microbiol.. 2013;3:280-288.
- [Google Scholar]
- Emticicia oligotrophica gen. nov., sp. nov., a new member of the family ‘flexibacteraceae’ Phylum Bacteroidetes. Int. J. Syst. Evol. Microbiol.. 2006;56:991-995.
- [Google Scholar]
- Strain improvement and optimization for enhanced production of cellulase in Cellulomonas sp. TSU-03. Afr. J. Microbiol. Res.. 2012;6(5):1079-1084.
- [Google Scholar]
- Regulation of Trichoderma cellulase formation: lessons in molecular biology from an industrial fungus. Acta Microbiol. Immunol. Hung.. 2003;50:125-145.
- [Google Scholar]
- Lactose metabolism and cellulase production in Hypocrea jecorina: the gal 7 gene, encoding galactose-1-phosphate uridylyltransferase, is essential for growth on galactose but not for cellulase induction. Mol. Genet. Genomics. 2002;267:124-132.
- [Google Scholar]
- Escherichia coli O157:H7 Shiga toxin-encoding bacteriophages: integrations, excisions, truncations, and evolutionary implications. J. Bacteriol.. 2003;185(12):3596-3605.
- [Google Scholar]
- Regulation of cellulase synthesis in Acidothermus cellulolyticus. Biotechnol. Prog.. 1991;7:315-322.
- [Google Scholar]
- Use of congo red–polysaccharide interactions in enumeration and characterization of cellulolytic bacteria from the bovine rumen. Appl. Environ. Microbiol.. 1982;43:777-780.
- [Google Scholar]
- Control of cellulase formation by trehalose in Clostridium papyrosolvens CFR-703. Process Biochem.. 2001;37:241-245.
- [Google Scholar]
- Optimization of extra-cellular endoxylanase, endoglucanase and peroxidase production by Streptomyces sp. F2621 isolated in Turkey. J. Appl. Microbiol.. 2004;97(4):783-791.
- [Google Scholar]
- Construction of evolutionary distance trees with TREECON for Windows: accounting for variation in nucleotide substitution rate among sites. Comput. Applic. Biosci.. 1997;13:227-230.
- [Google Scholar]
- Evolutionary relationships among higher fungi inferred from small ribosomal subunit RNA sequence analysis. Syst. Appl. Microbiol.. 1993;16:436-444.
- [Google Scholar]
- Development of a mutant strain of Bacillus subtilis showing enhanced production of acetoin. Afr. J. Biotechnol.. 2011;10:779-788.
- [Google Scholar]
- Biostatistical Analysis (fourth ed.). New Delhi: Pearson Education (Singapore) Pvt. Ltd.; 1999. p. 663


